.
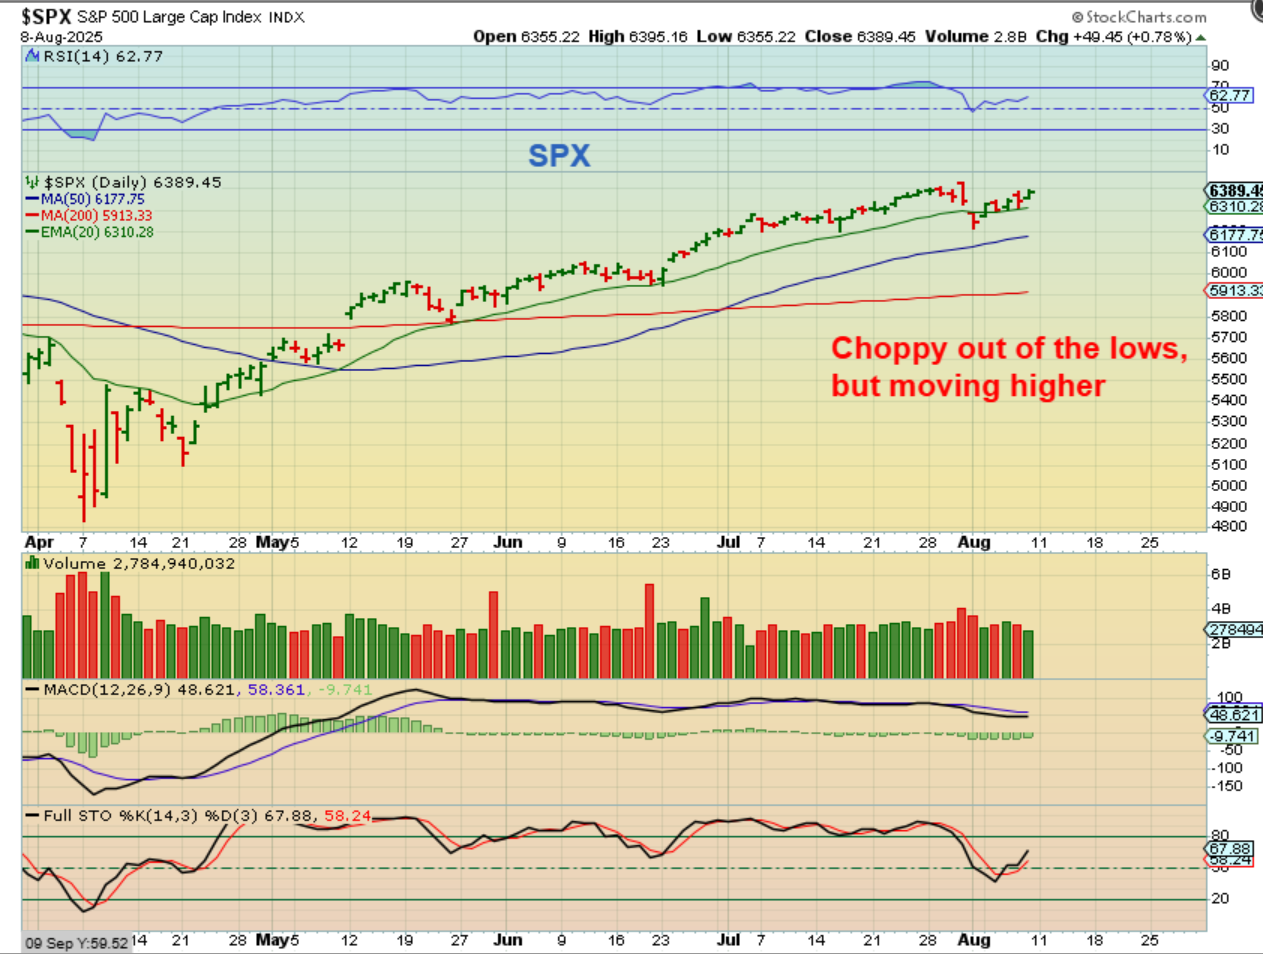
SPX– The General Markets closed at the highs of the week, with Fridays green day, so…
.
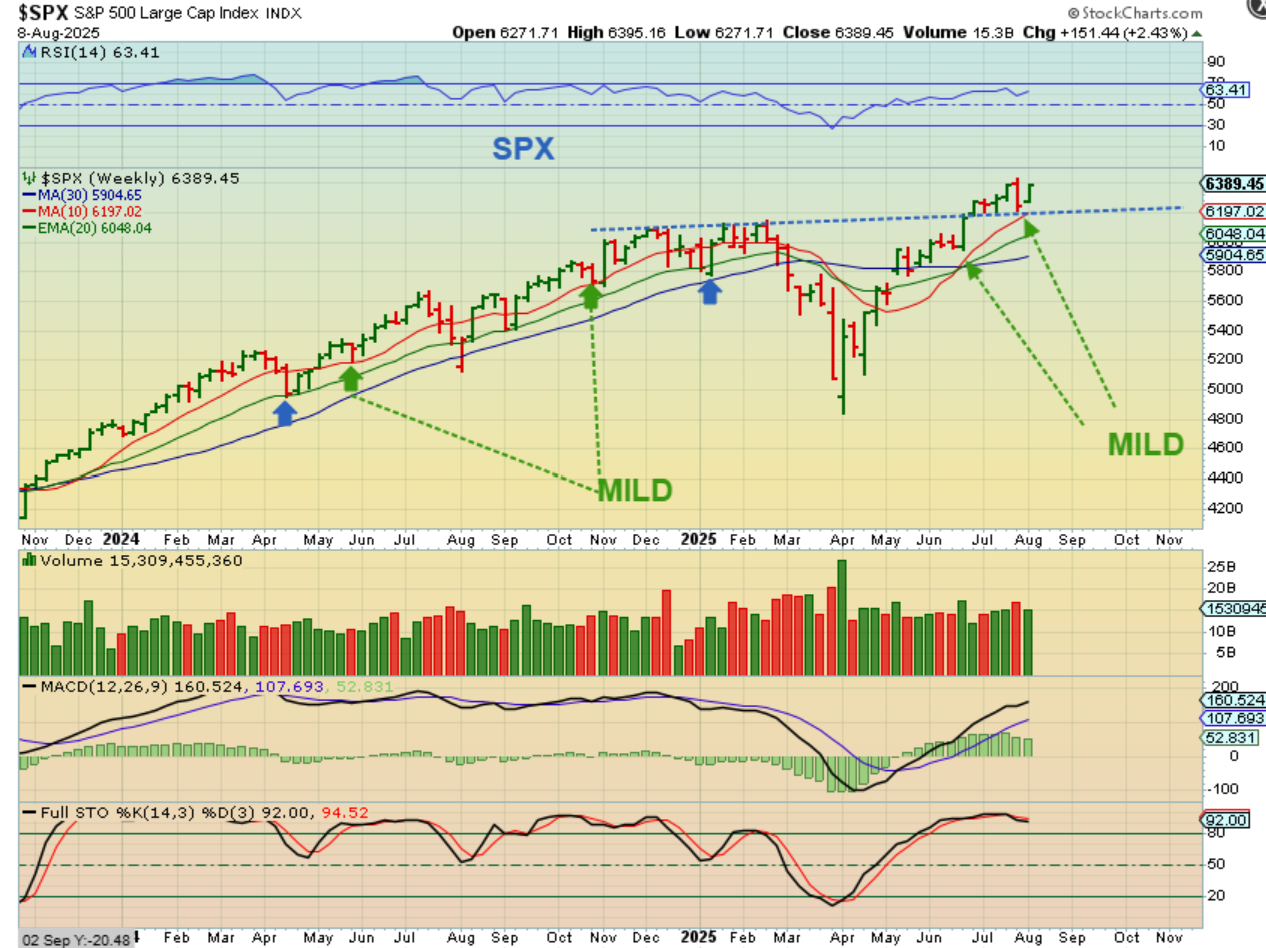
SPX WEEKLY – The SPX dropped to the red line (10 week ma) as a dcl, and we have seen that in the past. That gives us a mild dcl, compared to a normal drop to the 30 week ma. The general markets remain bullish after the dip and are up near all-time highs.
.
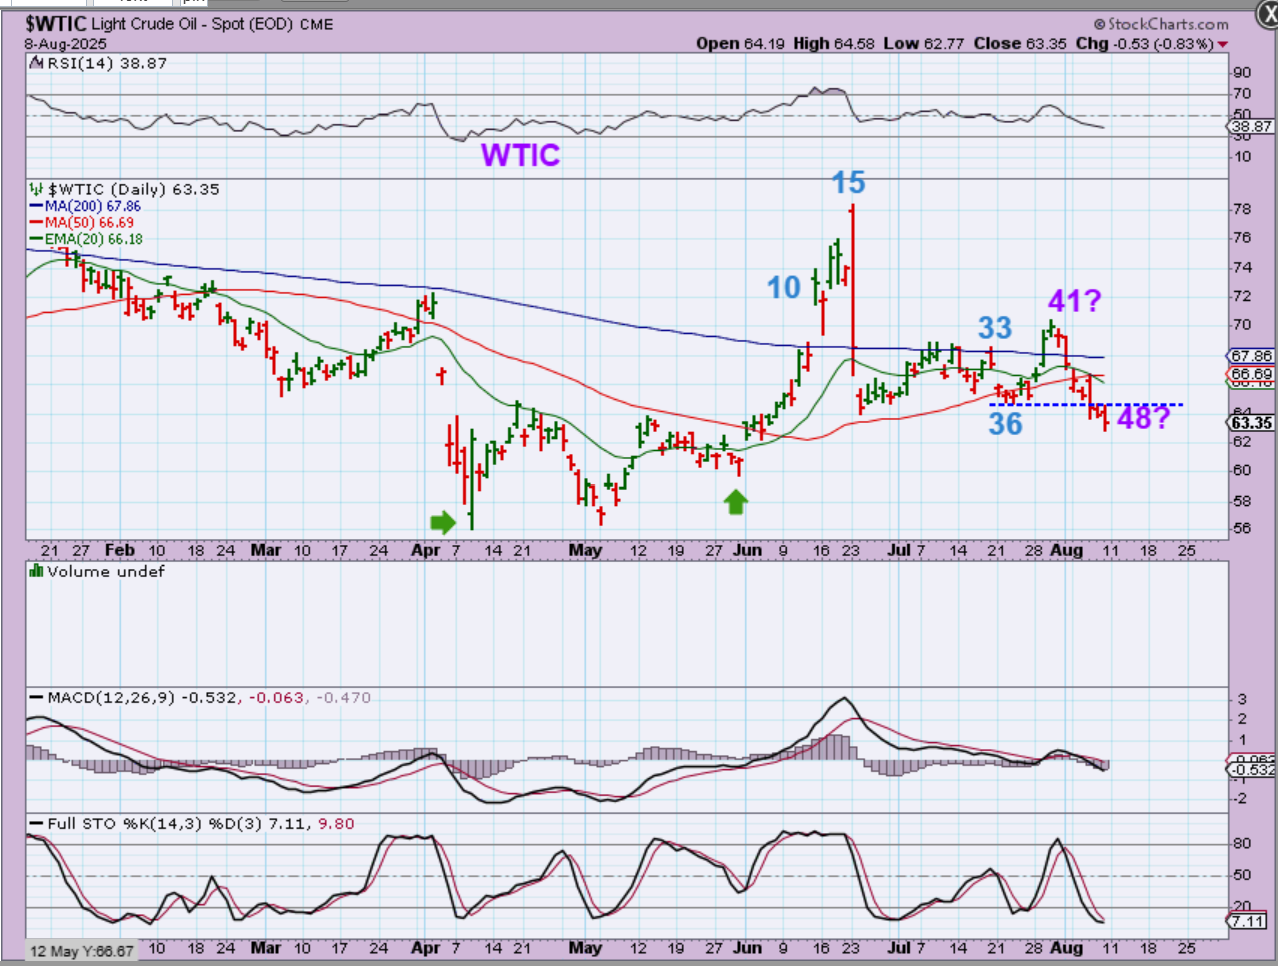
WTIC DAILY – oil is still a little uncertain, because it looked like we might have had a day 36 dcl, when Oil took off higher. Since then, it has rolled over, so
1. That either gives us a longer 2nd daily cycle at day 48, OR
2. We may have just seen the 3rd daily cycle start with a Bang, and then roll over and fail. The daily chart looks oversold, so it can bounce from here, but…
.
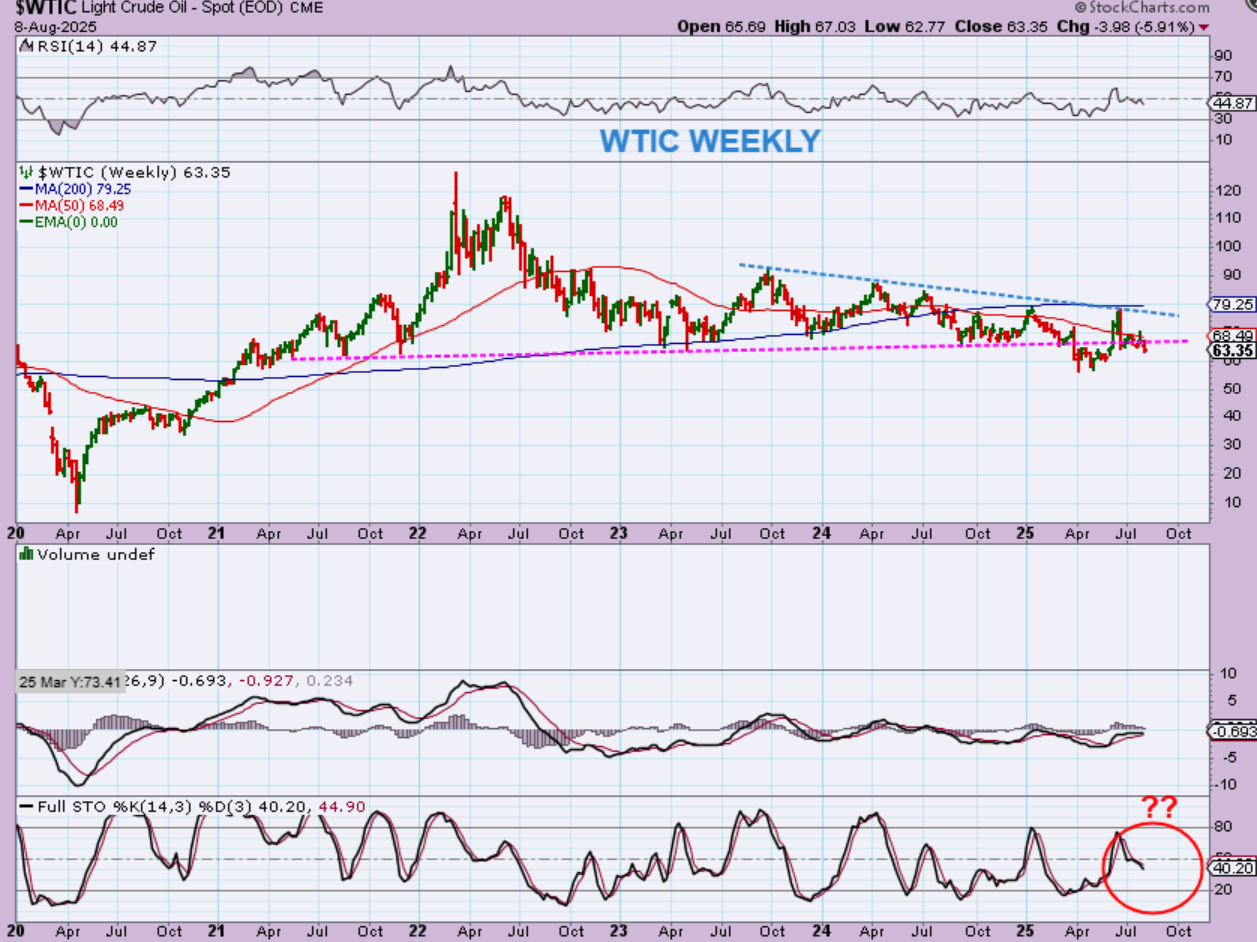
WTIC WEEKLY – This now gives us the appearance that the breakdown in April and May recovered, stopped at the upper trendline or 200week ma, and rolled over again. The weekly chart is NOT oversold, so price could bounce and continue lower. The set up is not one of confidence, it is one of uncertainty ‘technically’ and using ‘cycles’.
.
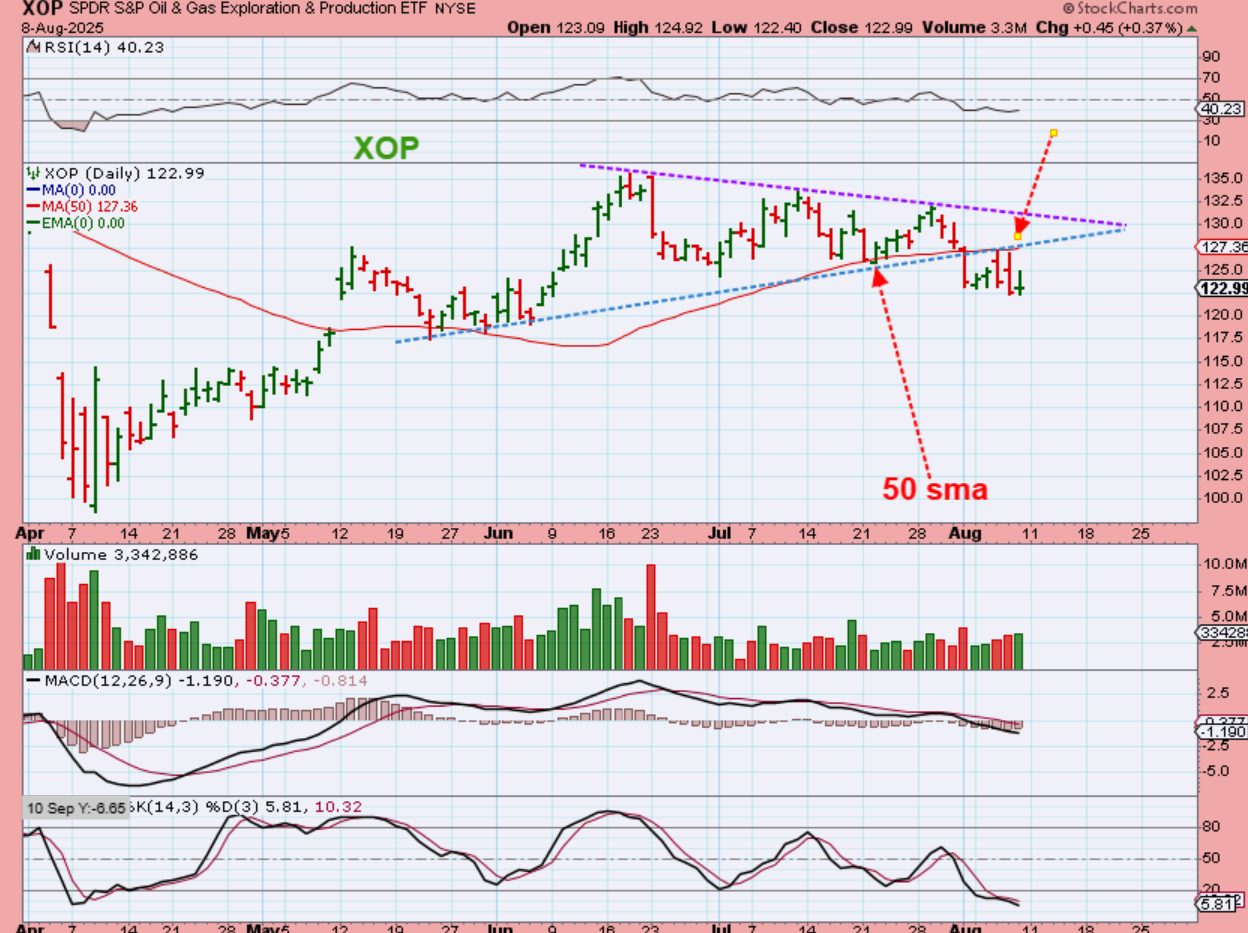
XOP – The XOP is also not a chart that gives me any confidence it a bullish price projection. It was forming a long bullish looking tringle and it also looked bullish above the red 50sma, but with the general markets at all-time highs, it broke down, lost the 50sma and back tested that breakdown at both the 50sma & triangle…and fell again.
.
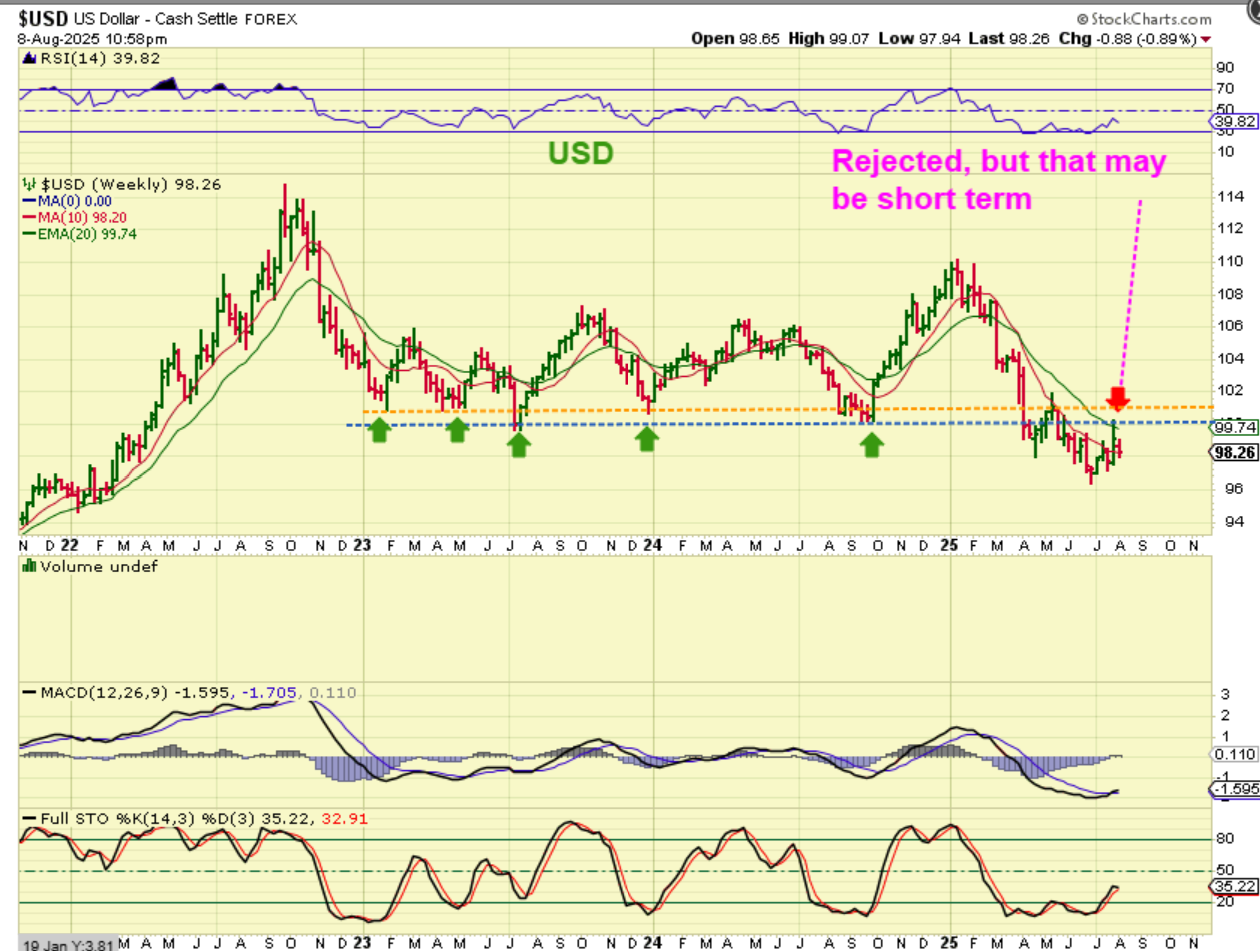
THE USD #1 – The weekly chart was oversold and has now bounced back. It lost a multiyear support this year and may be trying to regain it.
.
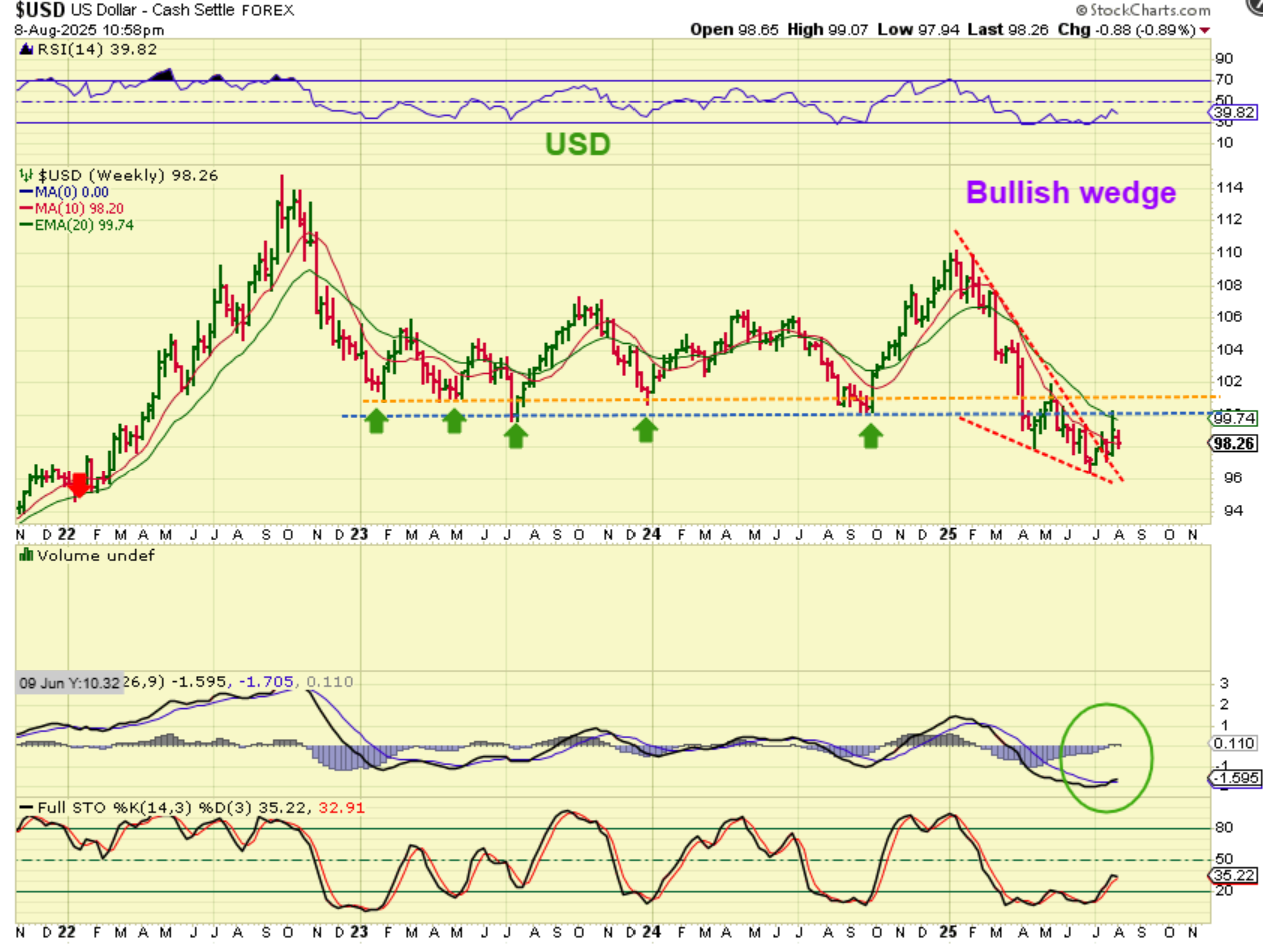
USD #2 – It does look like a bullish descending wedge that popped to the 20 ema and then stalled, so it can continue higher, especially since the stochastics is still closer to oversold.
1. Will it fully recover the blue & orange line? Or
2. Will it just chop around sideways under it for a while and drop again?
We do not know for sure, but chopping sideways and then rolling over again may help Gold.
.
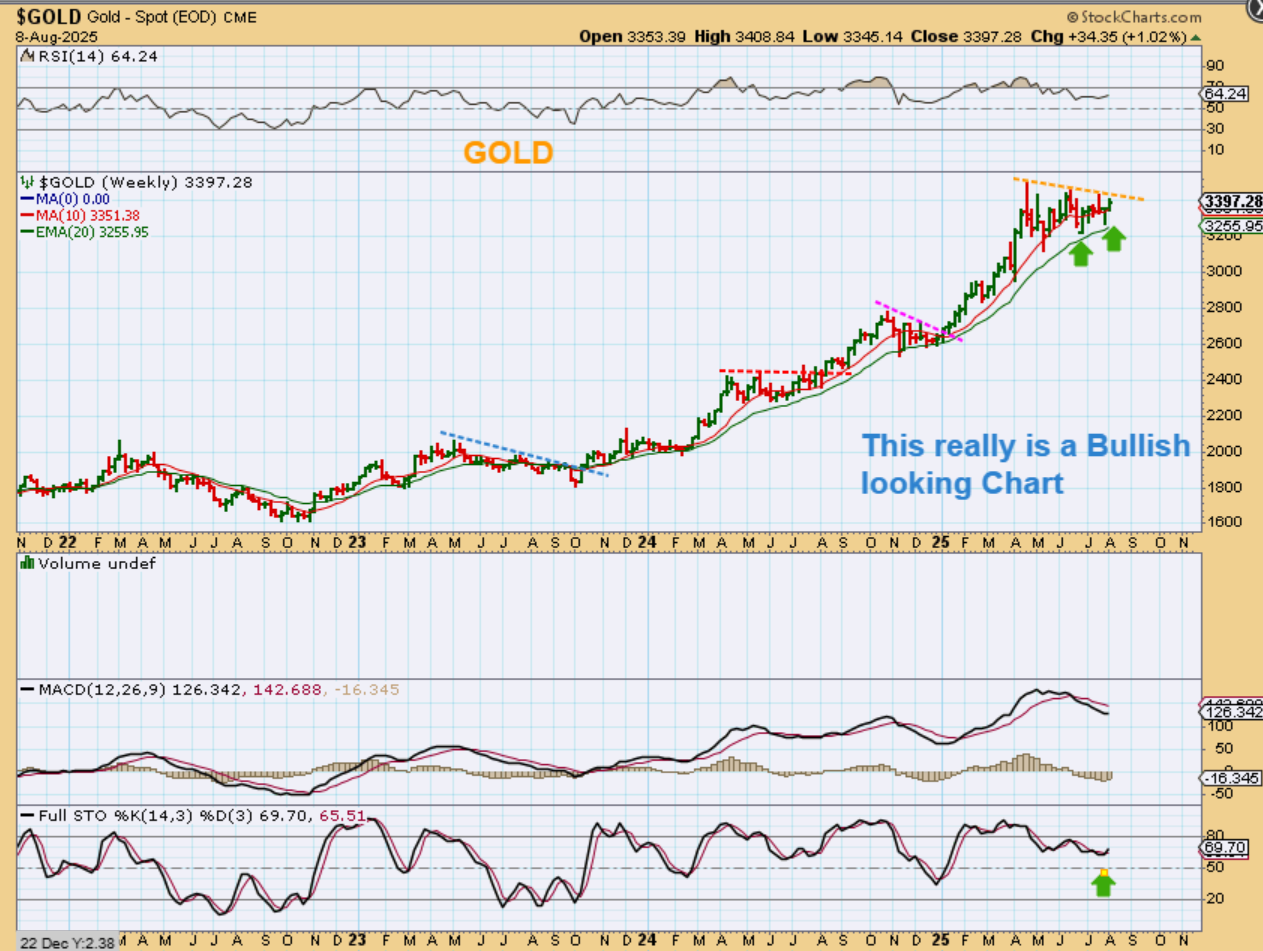
All I can say about this set up with GOLD is that it looks very bullish. If this continues higher and breaks to the upside, it could put in another rally, like it has at the past downtrend (or triangle) breaks. This DOES look very bullish and the Miners have been very bullish. Gold can churn inside of this triangle and form a stealth ICL in a month or so, when Silver does.
.
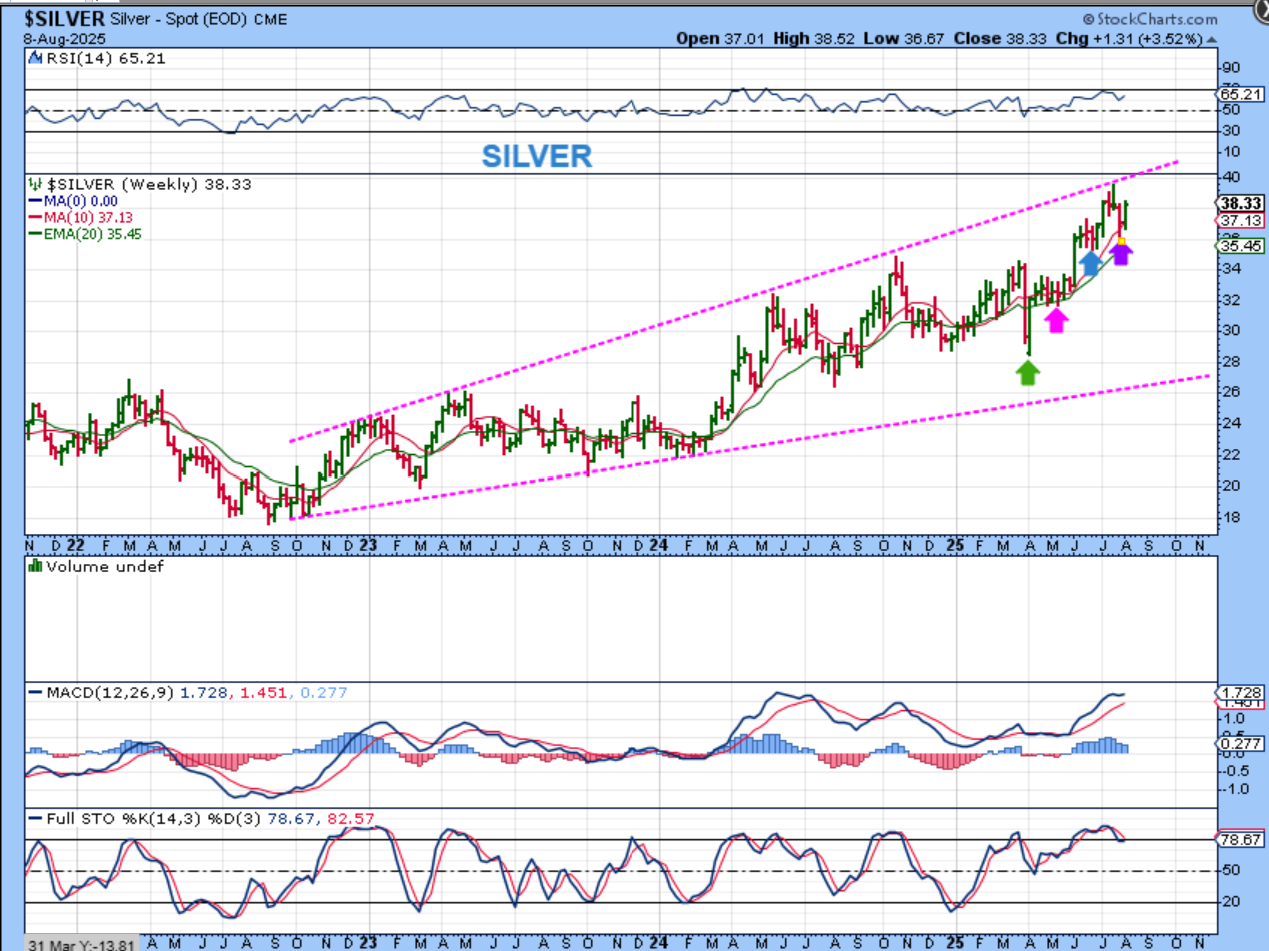
Just to be honest, this Weekly Silver Chart is messy.
The daily chart is orderly, and Silver has climbed higher, consolidated, and continued higher, but this is a bit choppy. Can it go higher? Well, Silver is the 4th daily cycle, but you can see that it does have room to run higher and then roll over. Last week it did put in 3.52% gains. That could happen again up to the magenta line.
.
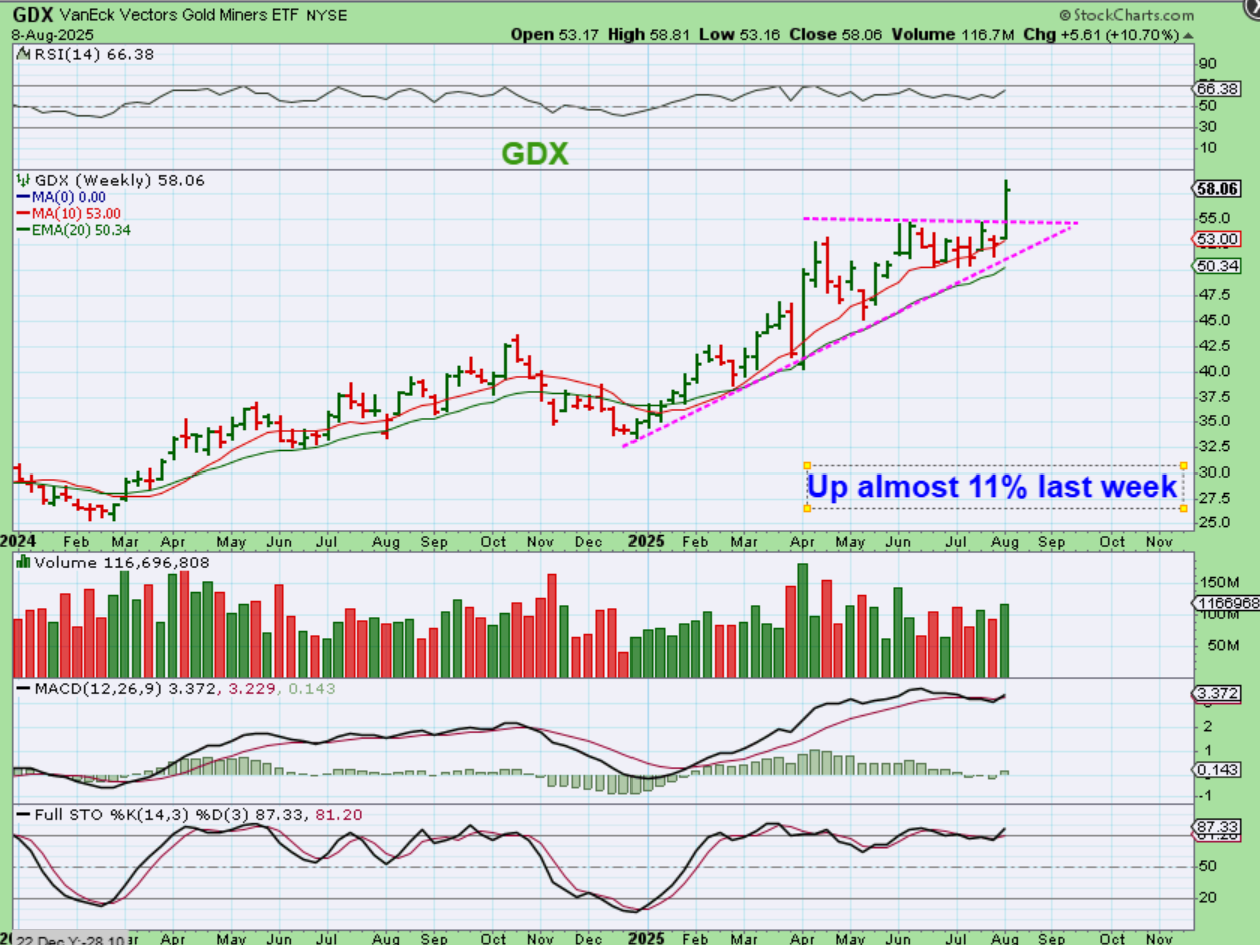
GDX WEEKLY– The Miners had an explosive week and we watched KGC, AU, AEM, CDE, PAAS, etc put on some strong gains. Some miners are doing extremely well after earnings reports, and others are taking a hit, but overall the GDX, GDXJ, and SILJ did very well, with all 3 up 10-15% last week.
.
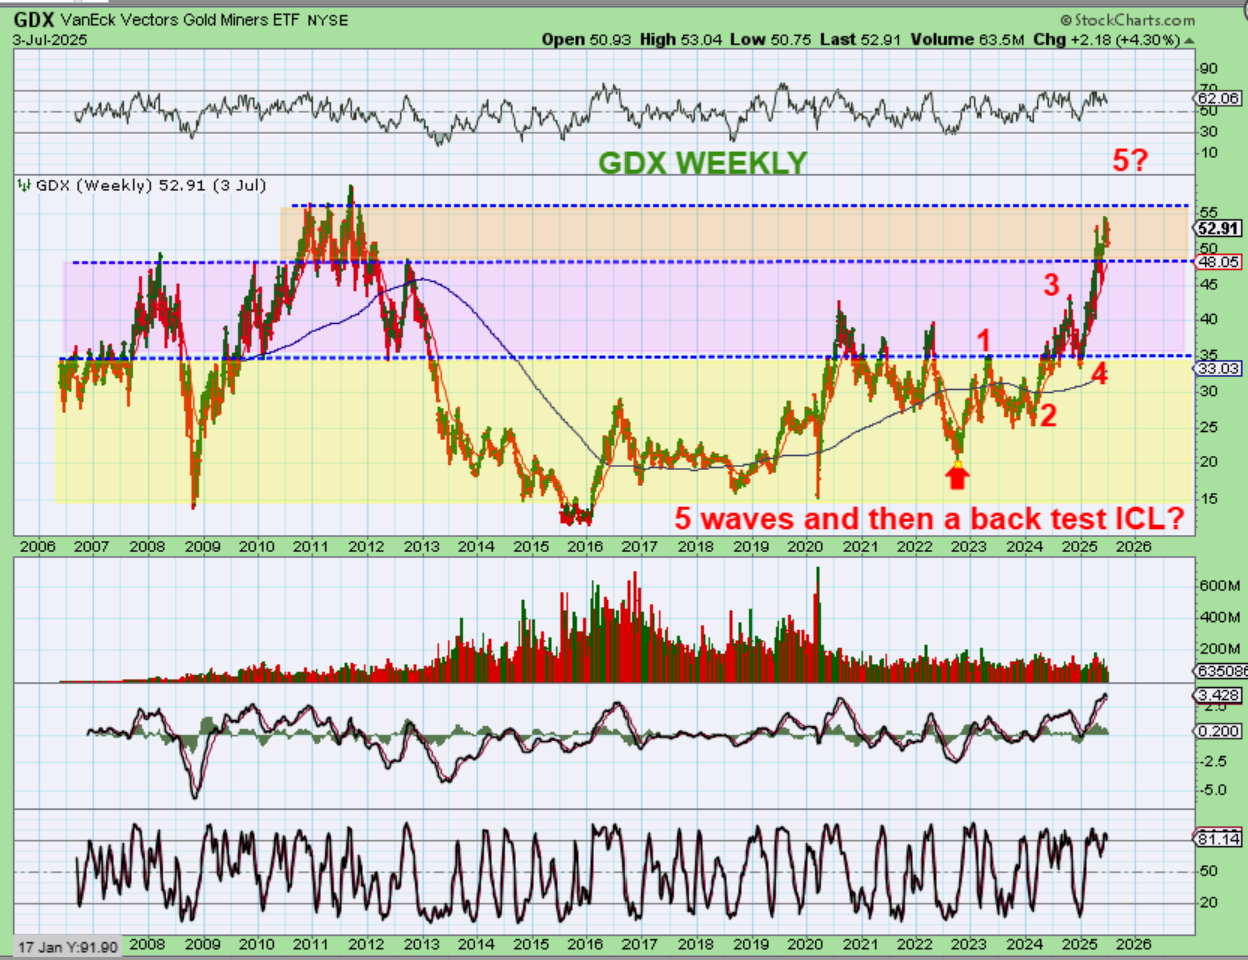
GDX WEEKLY – Using this chart I pointed out a possible 5 wave run to former highs back on July 3rd, which could be followed by a gradual dip into an ICL. Well…
.
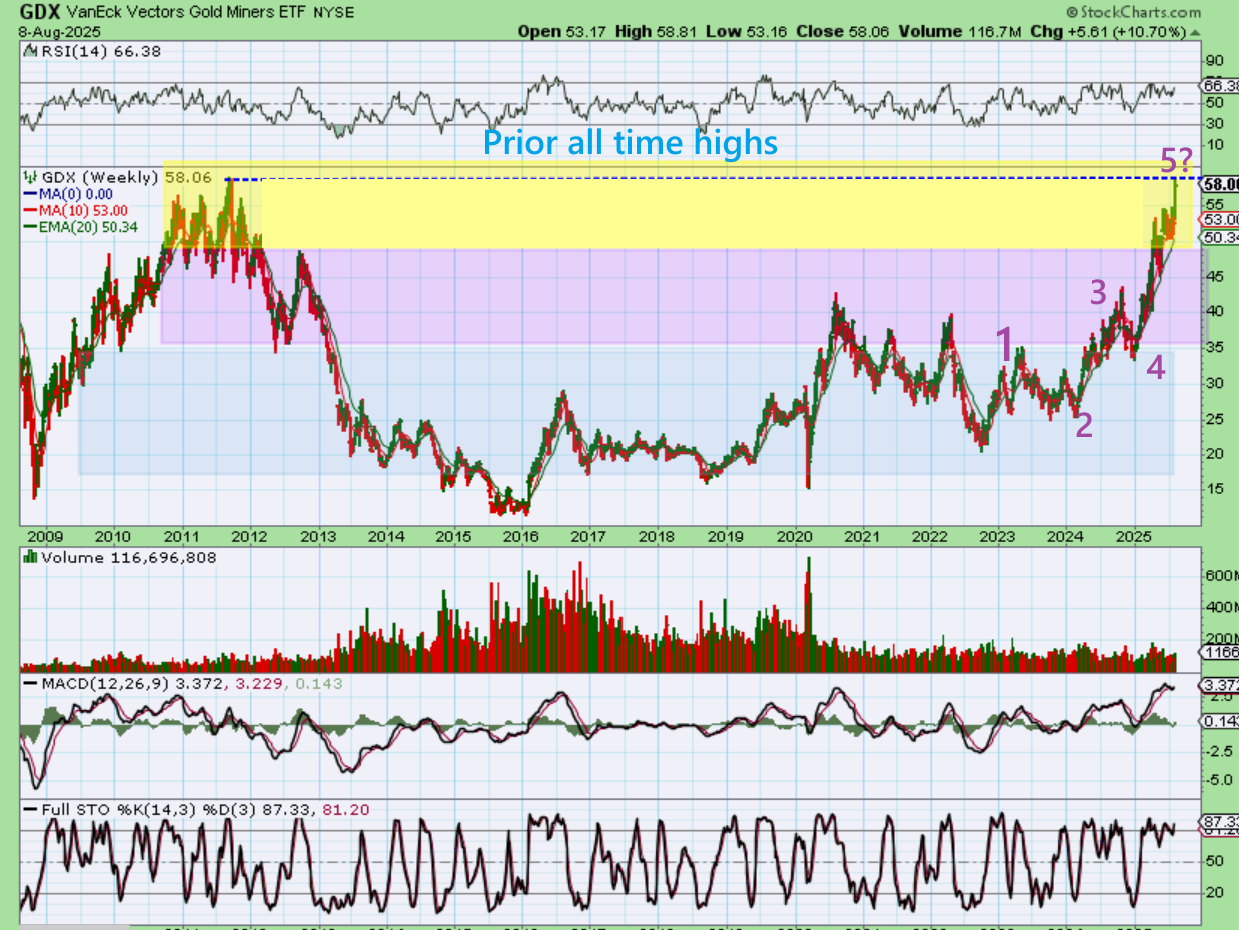
GDX has made a run to all-time highs, but I can’t say for sure if we are done yet & ready to pullback. We do want to keep in mind, however, that when Gold and Silver start to churn and pullback, the miners likely will too.
.
We have really seen a lot of Bullish moves in 2025, and the General Markets are heading back up to all-time highs after the recent sell off/ dip. The dips are being bought. Oil has not seen buying of the dips yet, so I remain very cautious there. When the time comes for Gold & Silver to pull back, we want to be ready to buy that dip (It may be in September or October that an ICL forms in the precious metals sector).
Enjoy your weekend and thanks for being here! 🙂
.
~ALEX
.
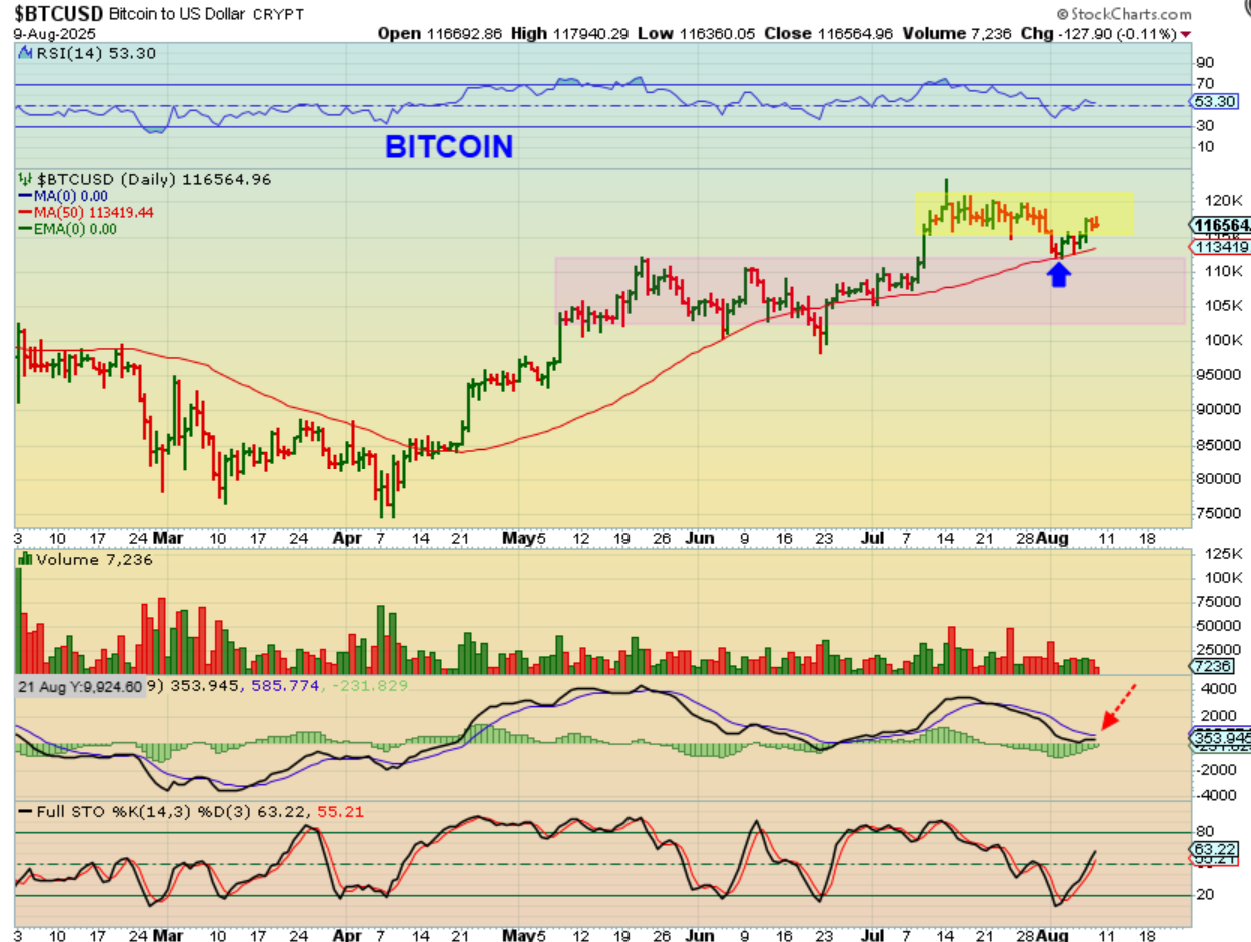
BITCOIN looks good bouncing off of the 50sma, but I saw several Crypto stocks turn pretty deeply red on Thursday and on Friday, so I am keeping an eye on that. Some of it has been a reaction to earnings, but some has just been weakness, so it is something to be aware of. For now, Bitcoin does still look good. Note: Price is pushing into resistance and the MACD needs a little improvement. RSI is good.
.
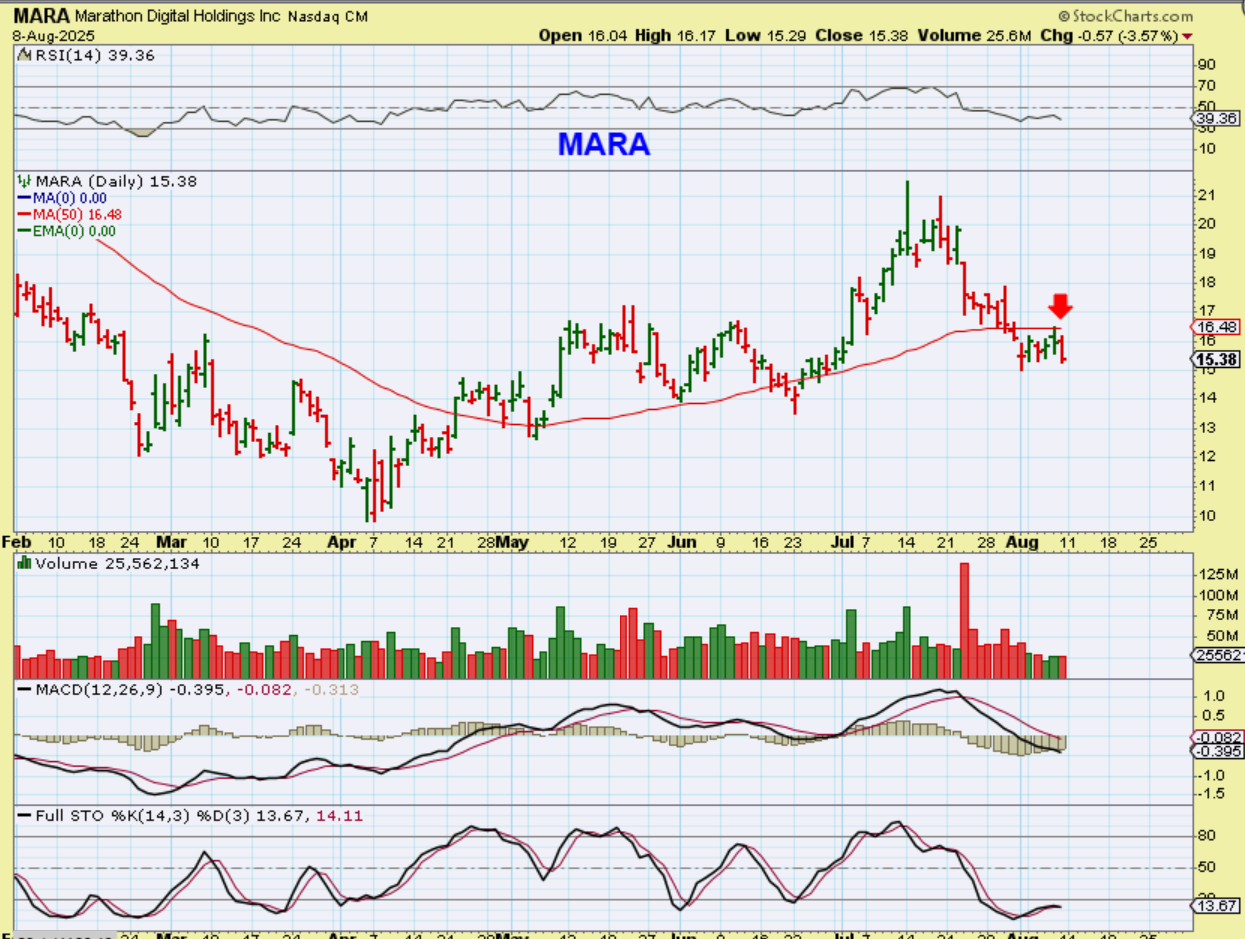
MARA had earnings 2 weeks ago and it lost the 50sma and has not been able to recover.
.
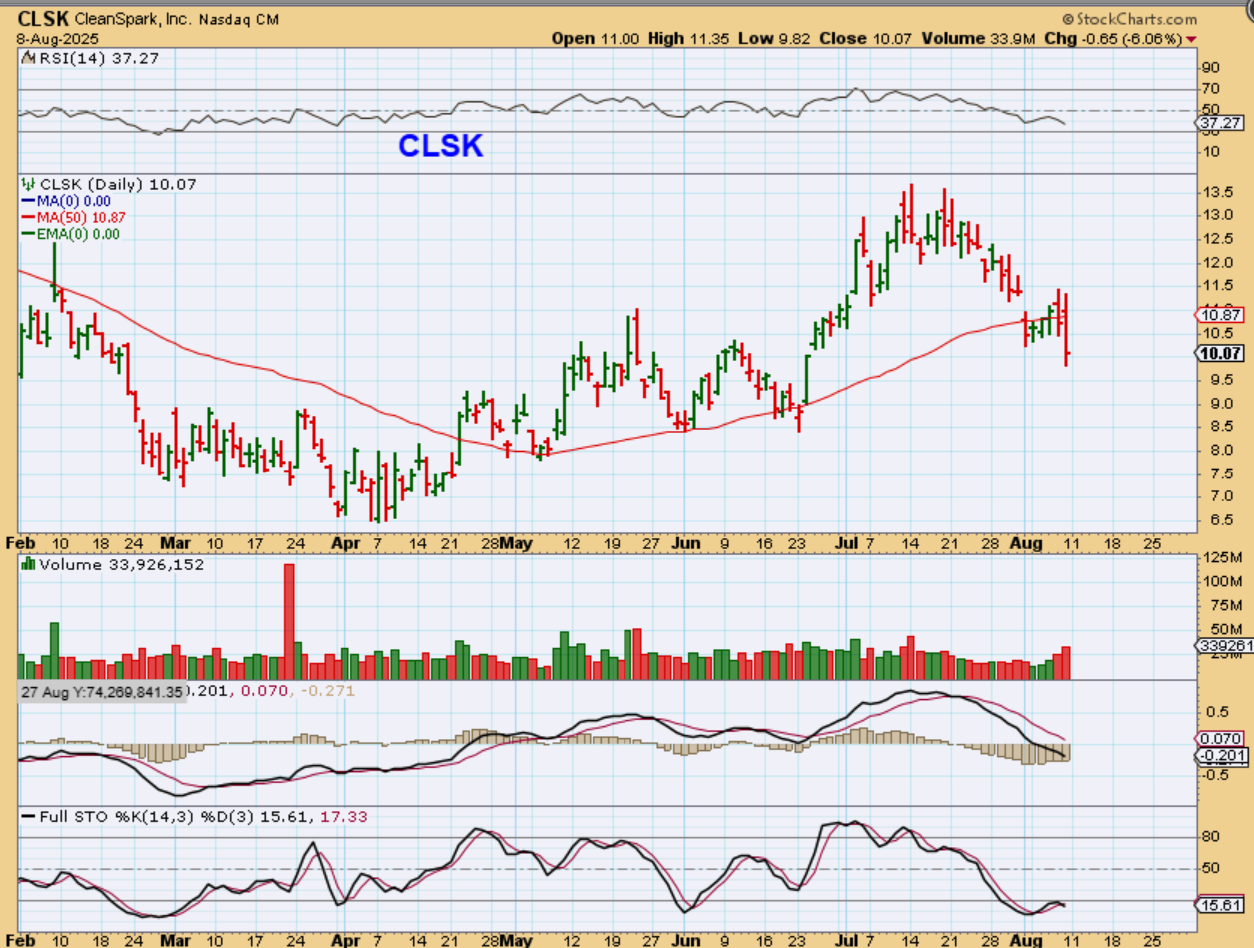
CLSK, RIOT, BTDR, etc are all trading below the 50sma too, and well off the highs when Bitcoin is not that far off of the highs and reversed ON the 50sma. It’s just something to keep an eye on: I’m watching for improvement or for continued weakness.
Friday August 8th 
 Tuesday August 12th – Inflation Numbers
Scroll to top