
August 30 WEEKEND REVIEW
.
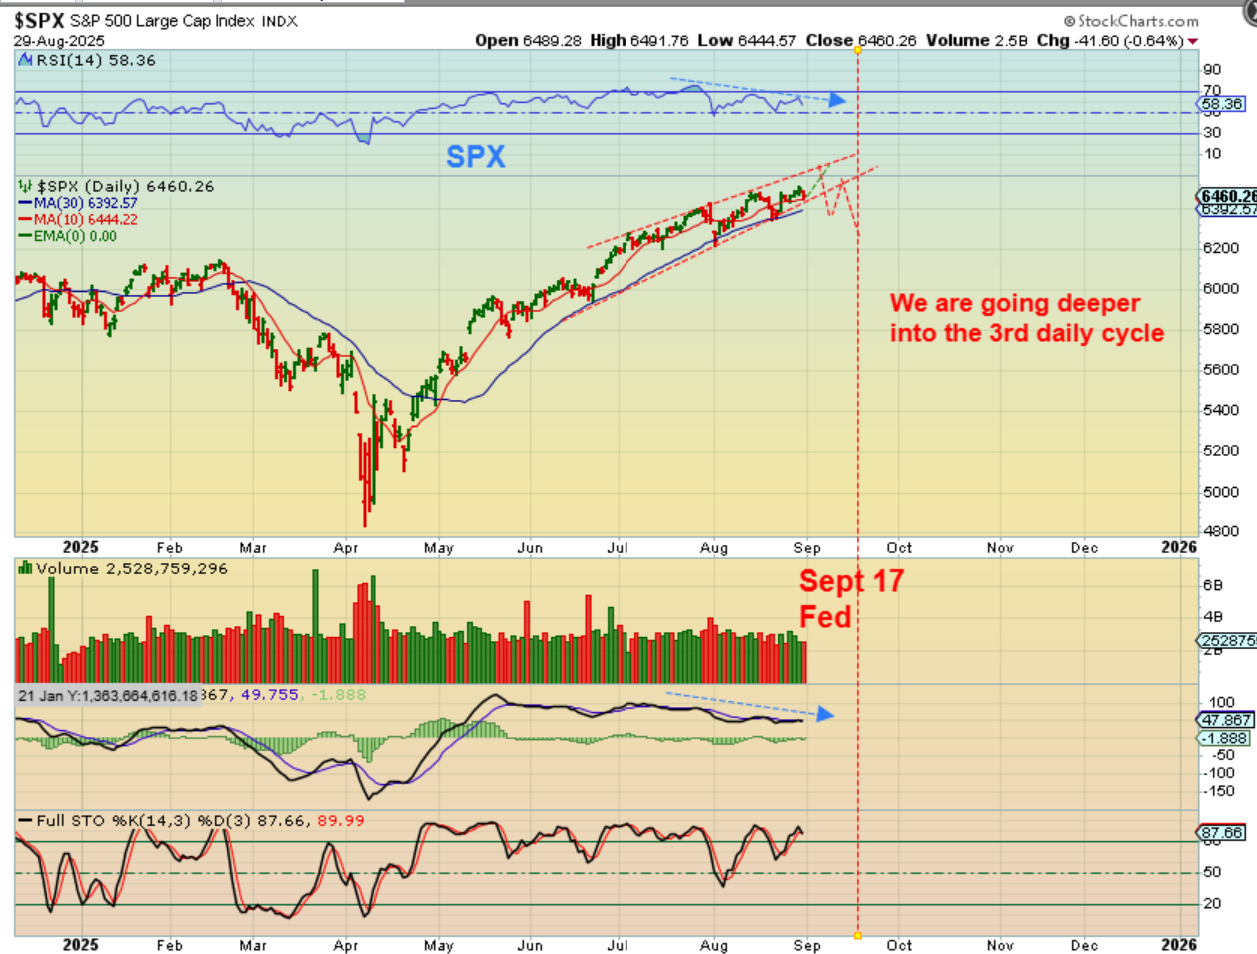
THE SPX dipped this week, but I do feel that it will continue higher into September. Why?
The markets remain bullish, and the count is only about mid-way through the 3rd daily cycle. It could be a 3rd of 4 or even a 3rd of 5 daily cycles, so this can just continue higher. But what if we DID get a dip into an ICL end of September or October? It may be mild like this.
.
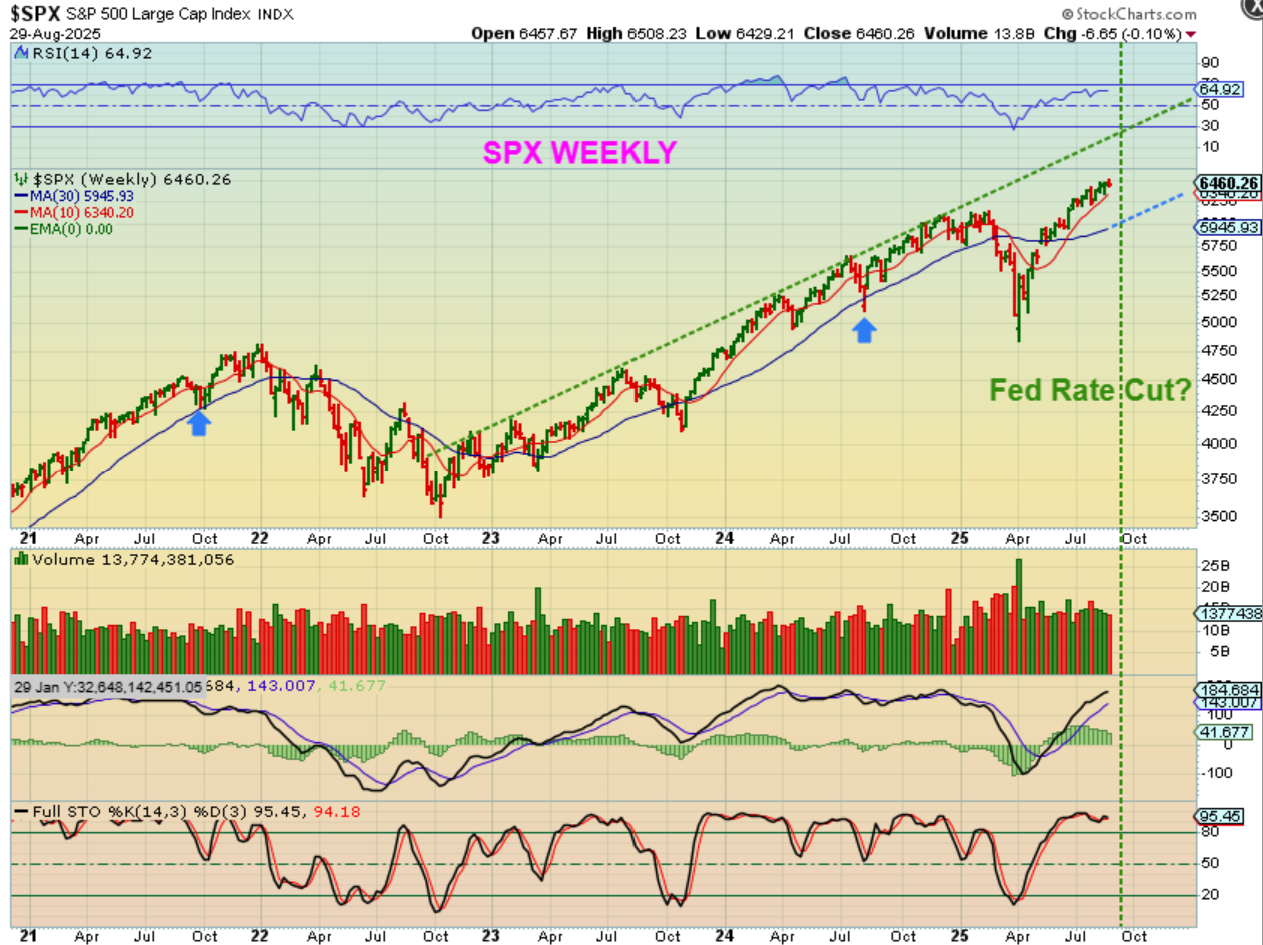
SPX WEEKLY – Some deep ICLS dropped to the blue 30 week ma, but even that would just be a back-test of the break to new highs too. With possible rate cuts in future though, it seems that we will continue higher. A 4 or 5 daily cycle run.
.
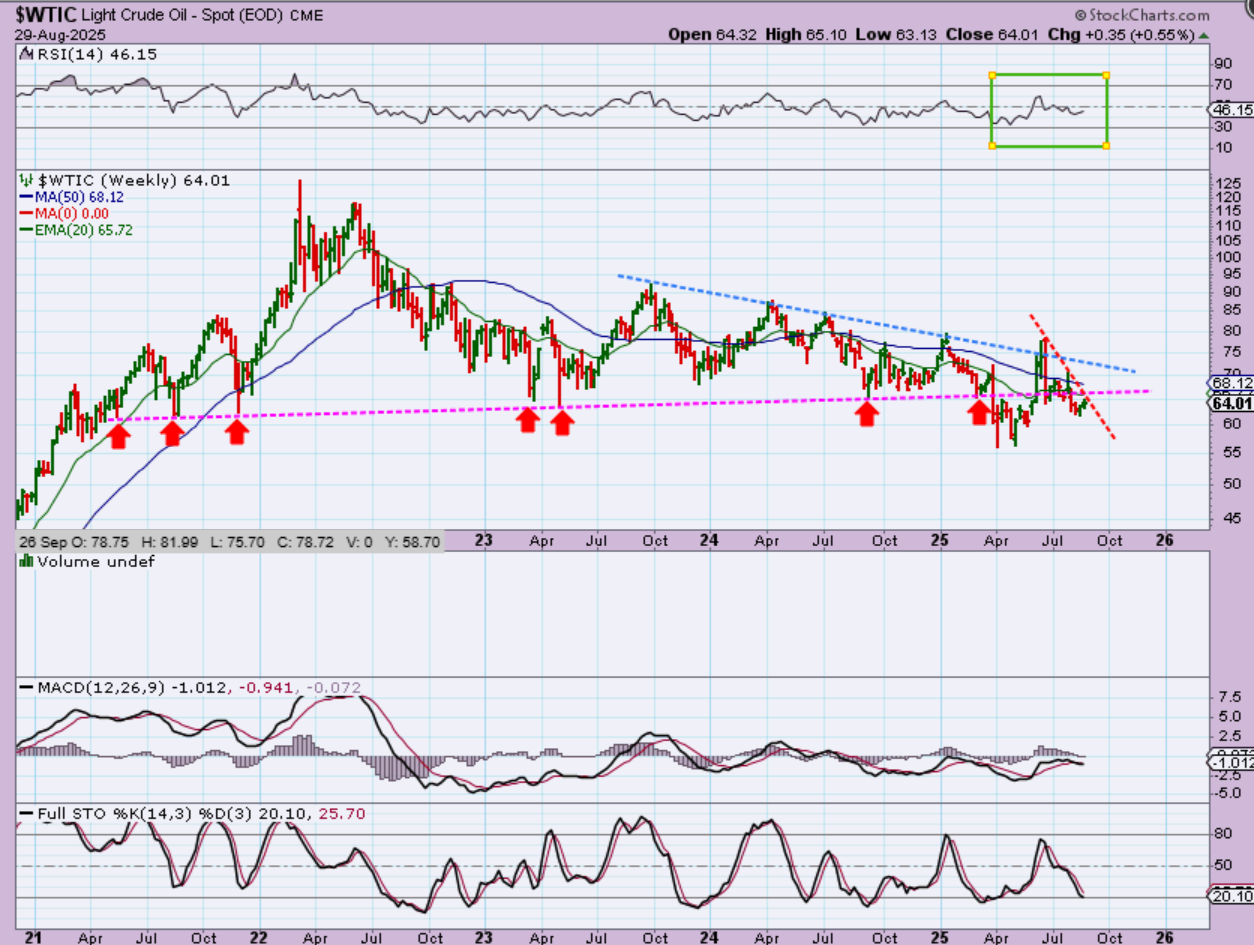
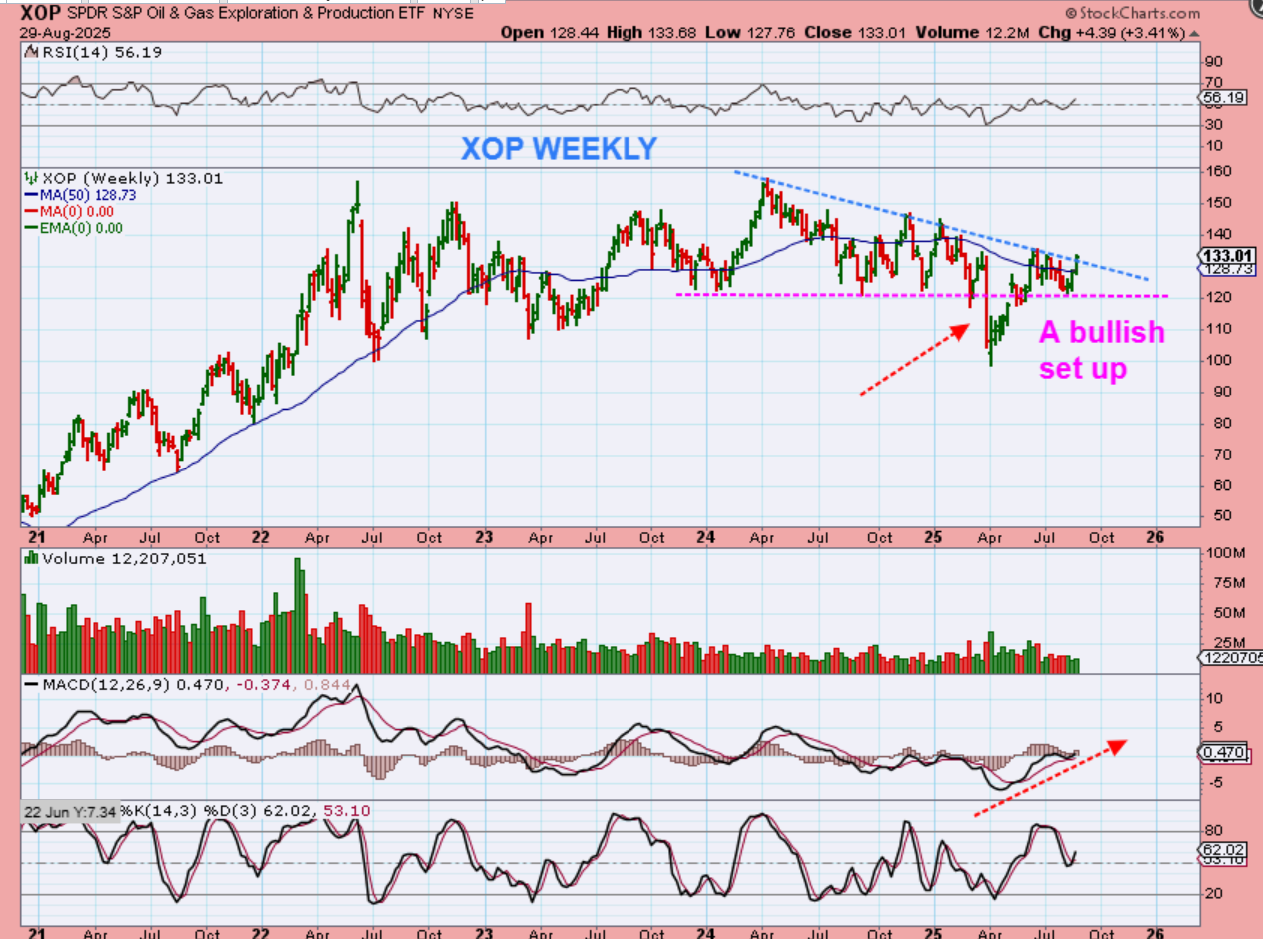
WTIC – Oil broke down and tried to recovered when the war with Iran started, but it lost support. This Might be a bullish wedge formation now. Why I do I think that? Oil stocks have been a bit stronger than Oil, so it does make me wonder if Oil will gain strength. Let’s look at the XOP & The XLE…
.
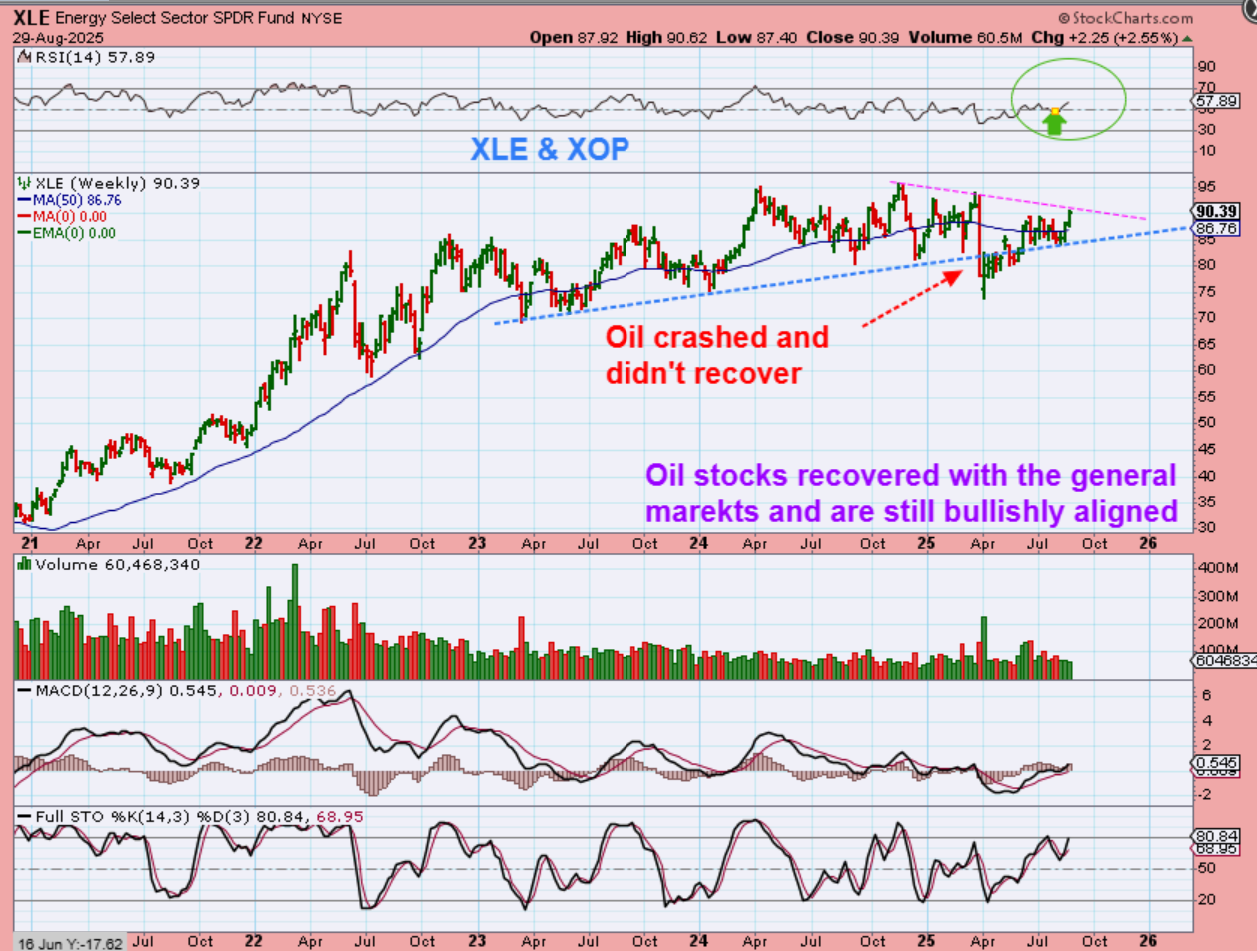
Oil broke down and has not recovered, but THE XLE crashed in April and then it gradually recovered. Over the past 2 weeks it has perked up. Pardon the typo on the chart.
.
THE XOP has a bullish looking set up too. This resembles a shake-out and it has moved to the upper trendline of a wedge. So Oil stocks actually look good again, with Oil still yet to recover the loss of support.
.
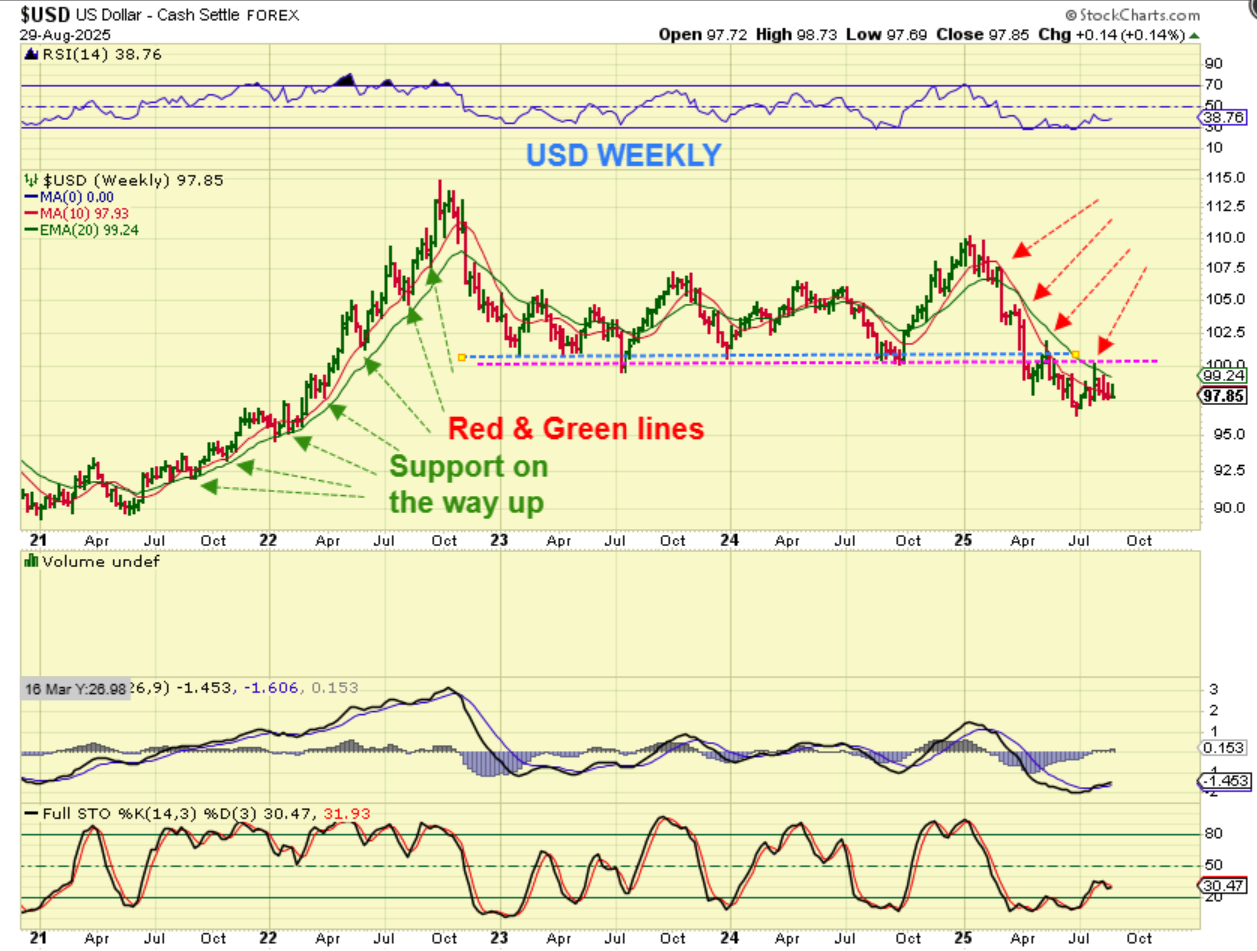
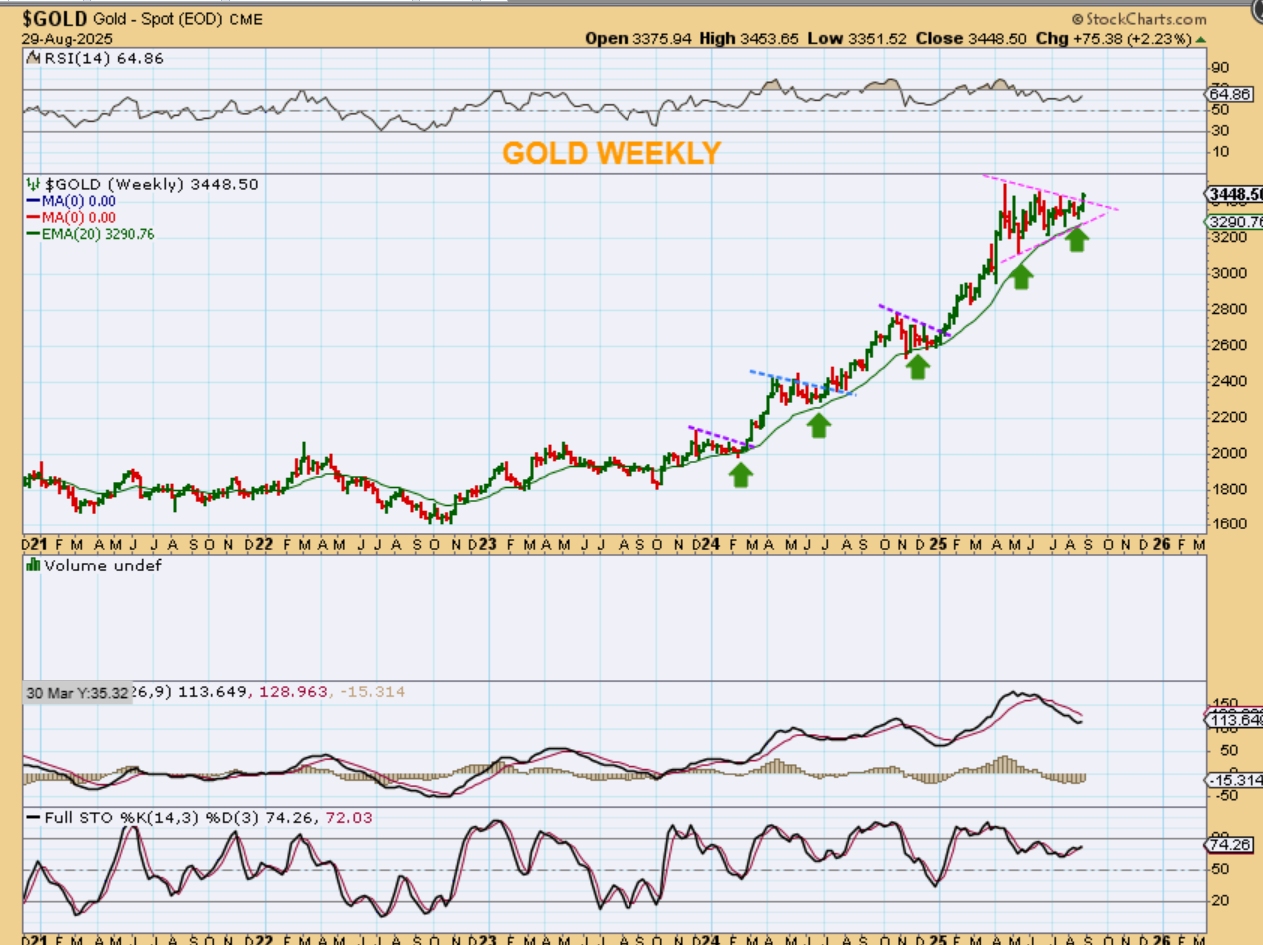
THE USD broke down in 2025 and still has not recovered either. It has bounced and tried to recover, but when the Fed discussed a cut, the USD dropped and Gold Popped. The USD may roll over from here and Gold may continue to rally…and that is actually what it looks like with GOLD’s LONG TRIANGULAR CONSOLIDATION.
.
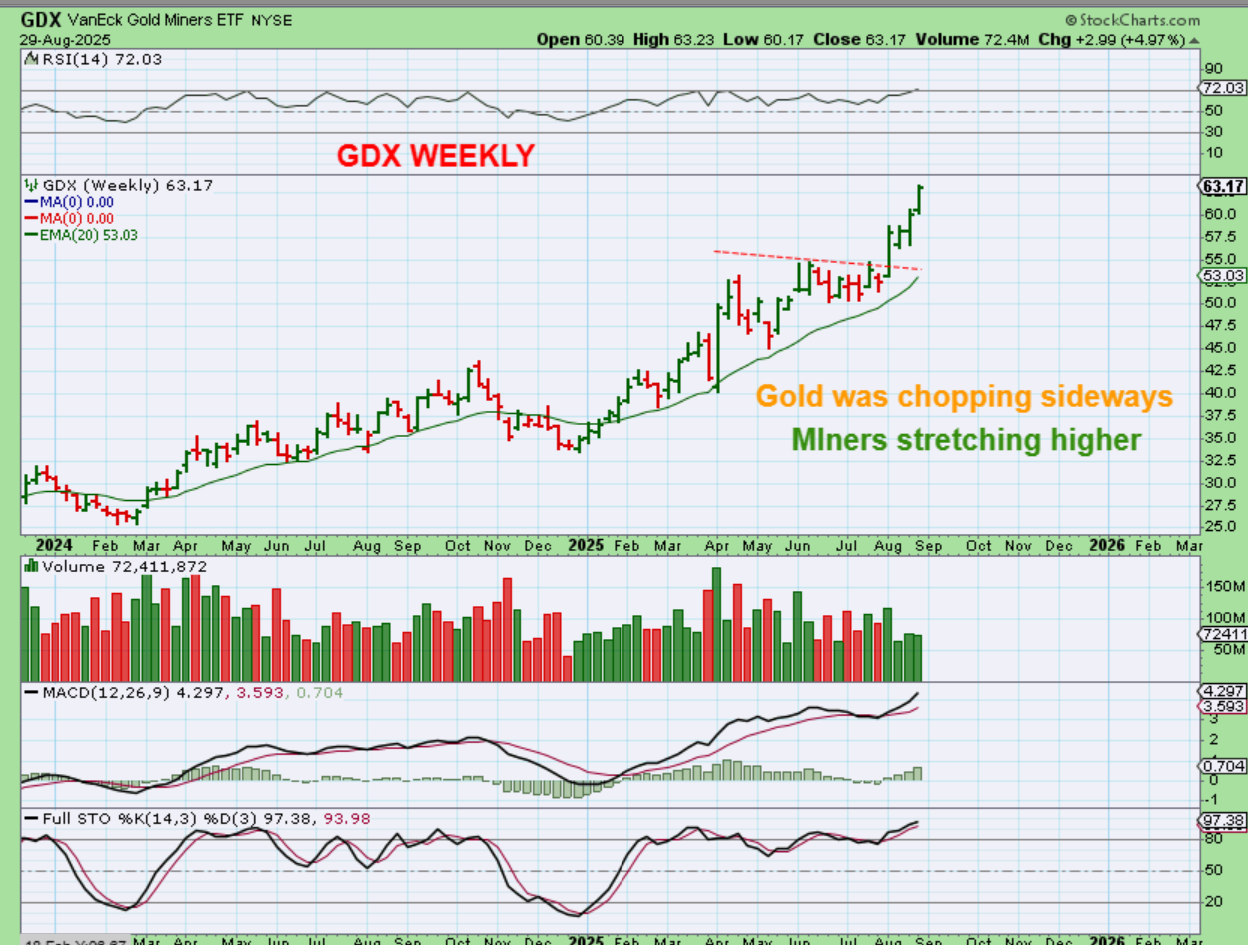
GOLD has that large triangle that has actually formed since April, and now we have the start of a breakout last week! Lately I have noticed and pointed out that Miners seemed to be running higher without Gold, so Miners were leading and Gold might catch up. This looks promising.
.
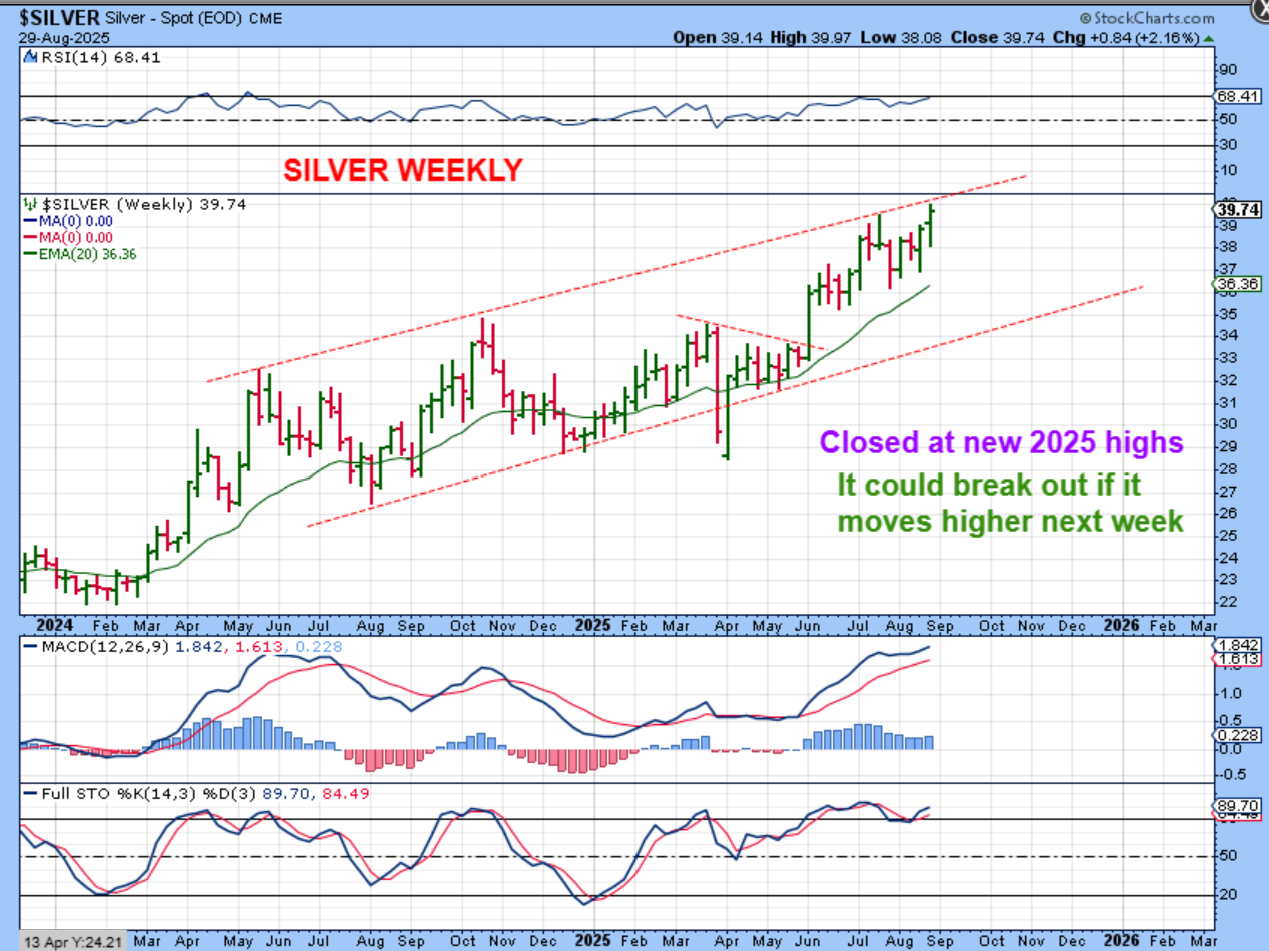
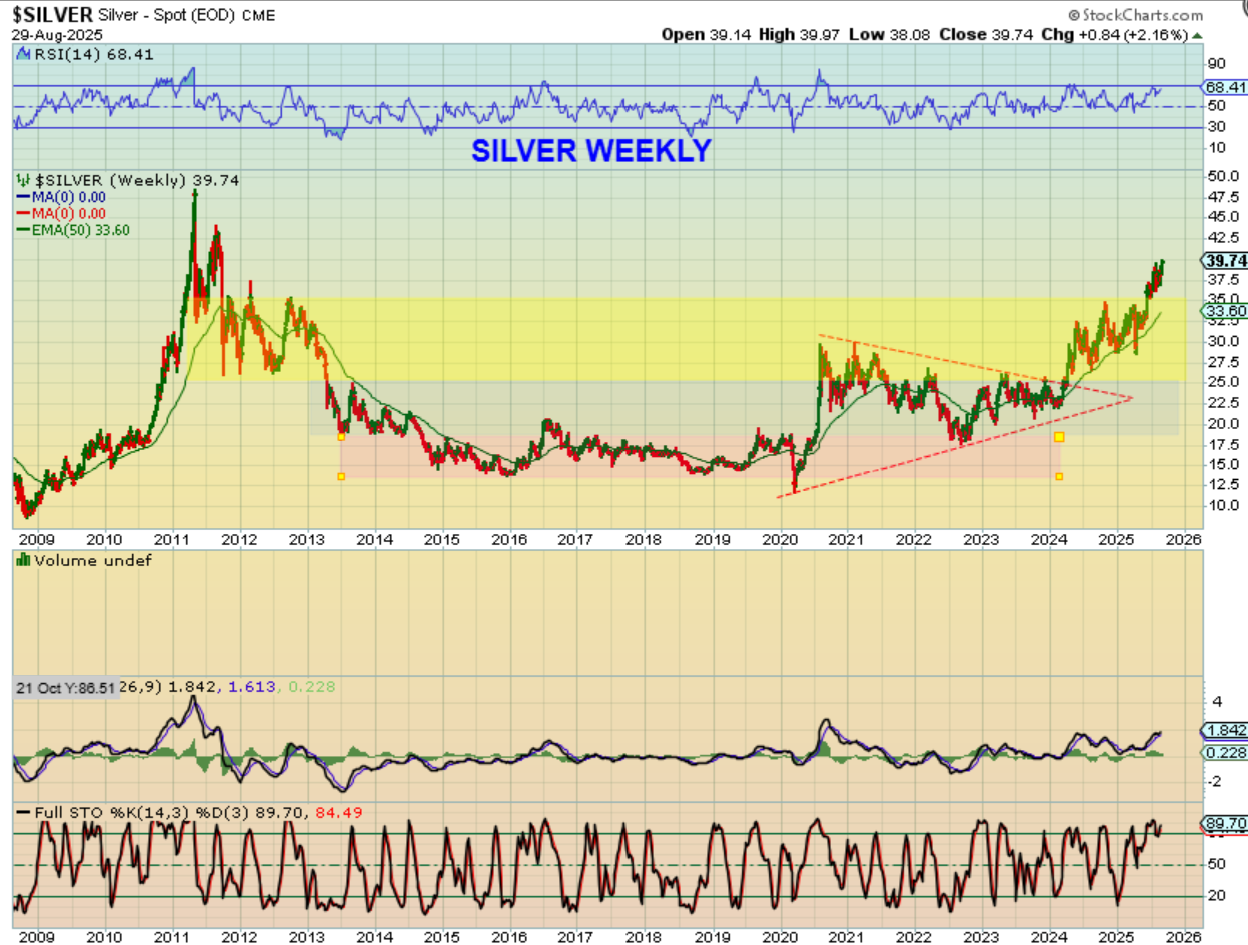
SILVER popped to a new 2025 high last week. It was only up 2%, but this is a new high for 2025 and it came in a 4th daily cycle, showing just how much strength we have in this sector. I want to show you something kind of interesting…
.
SILVER has been working its way through resistance areas and that has made Silver choppy, but it is heading toward the all-time highs of 2011 ($50ish). Notice that Silver has minimal resistance now and is nearing those highs. Next—
.
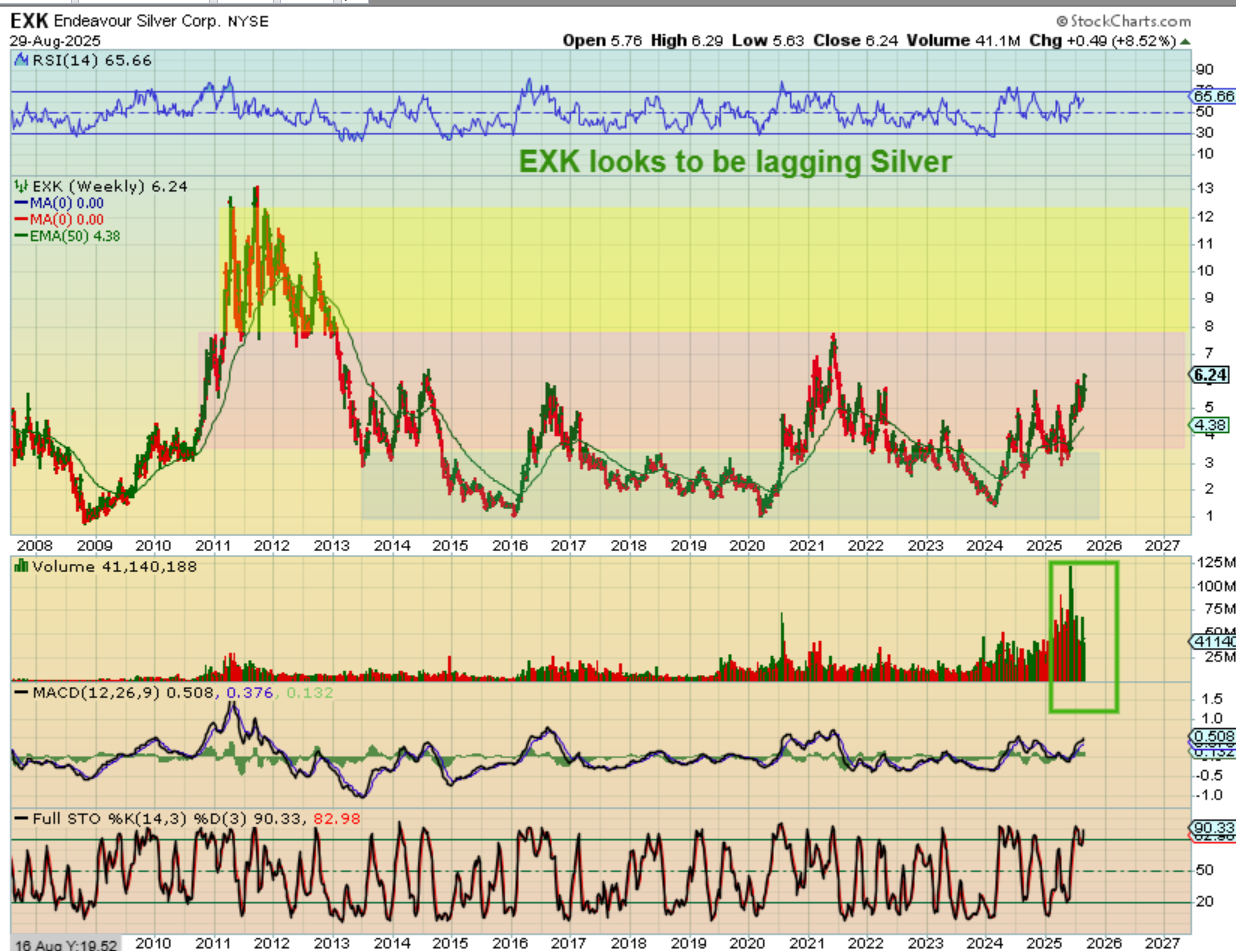
Next — Take a look at EXK compared to Silver above. Silver has been choppy like Silver, but it is still in the lower base, so EXK could start to play catch up very quickly. $6 to $12. I show you that, because we are going to review a few different kinds of Miner runs today.
.
You can see that GDX has been leading the way and not following Gold over the past couple of weeks. Miners kicked it into gear over the past couple of weeks in August.
.
So let’s discuss a couple of things about the Miners:
.
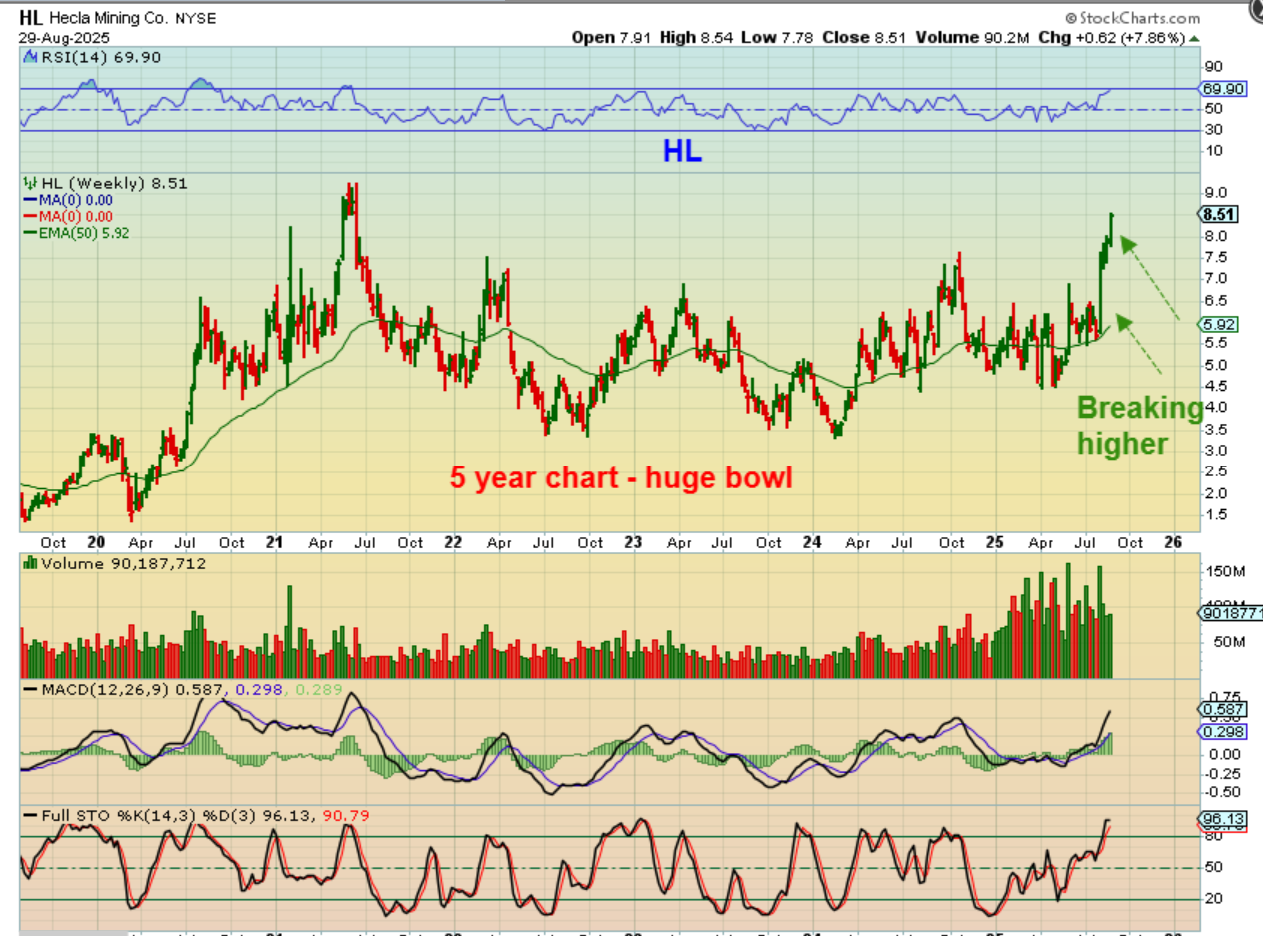
Again with EXK, it seems to be starting to run, but it was choppy and difficult. This could start to run, and you’ll see how HL just kicked into gear from a similar pattern…
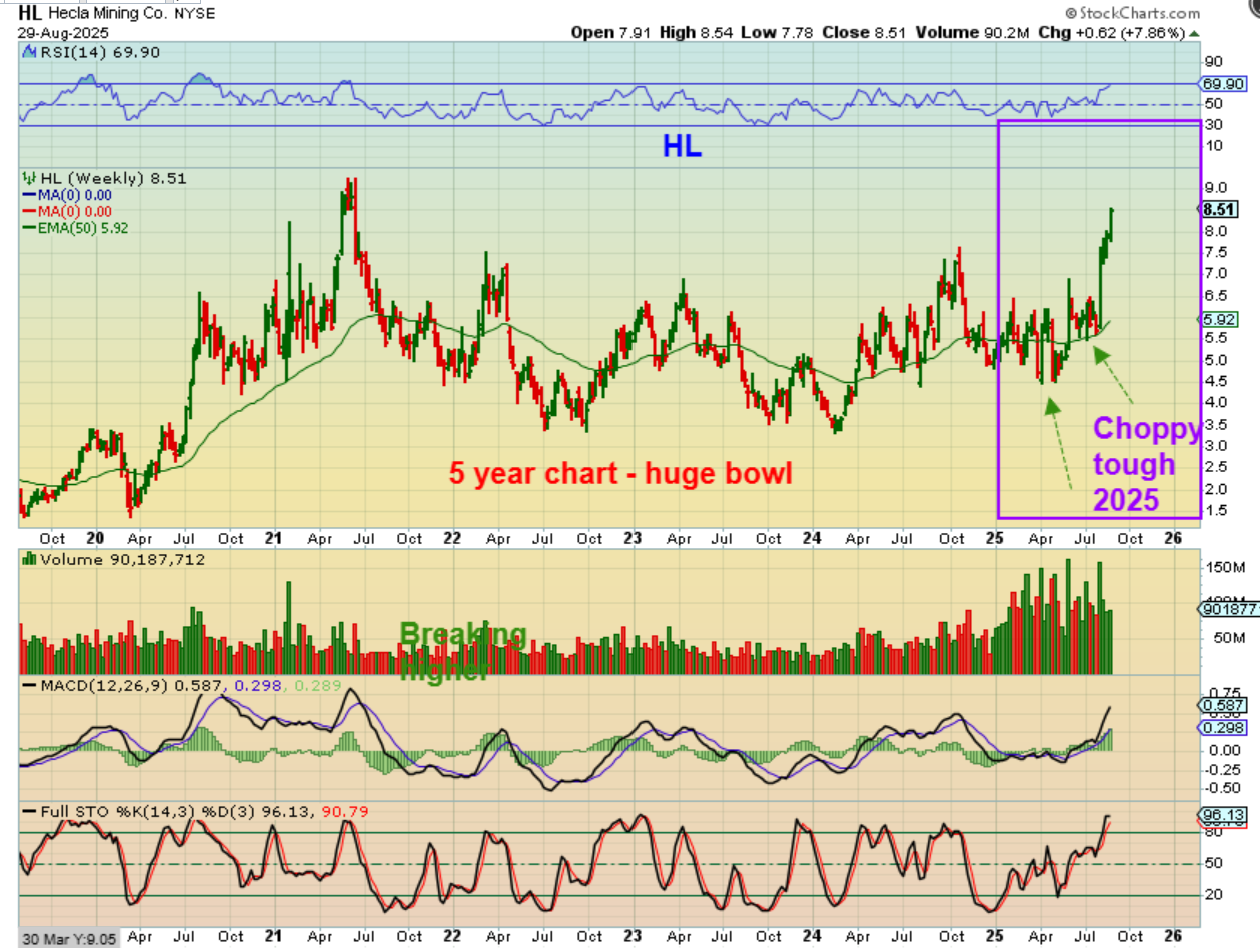
HL was lagging Silver too, but look how quickly it played catch up over just the past 4 weeks!
It was at $5.50 in July, so notice how choppy and difficult HL was in all of 2025….until the last 4-5 weeks. It went from $4.50 to $5.50 in all of 2025 and suddenly it is up 100% for the year after just 4 weeks of blast off.
.
So basically we see Silver in a 4th daily cycle and some silver stocks don’t care, they ran higher. HL shot up again last week.
.
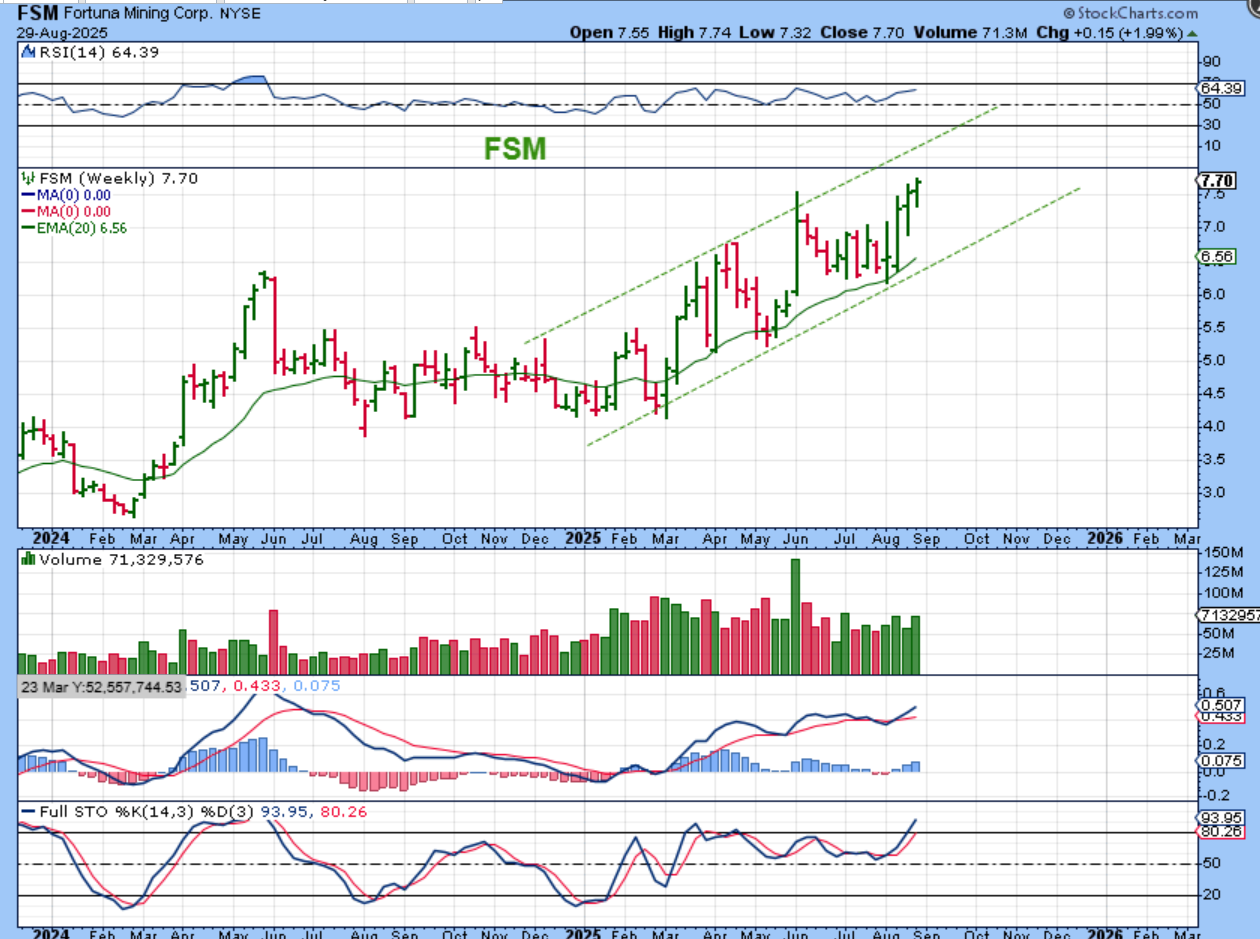
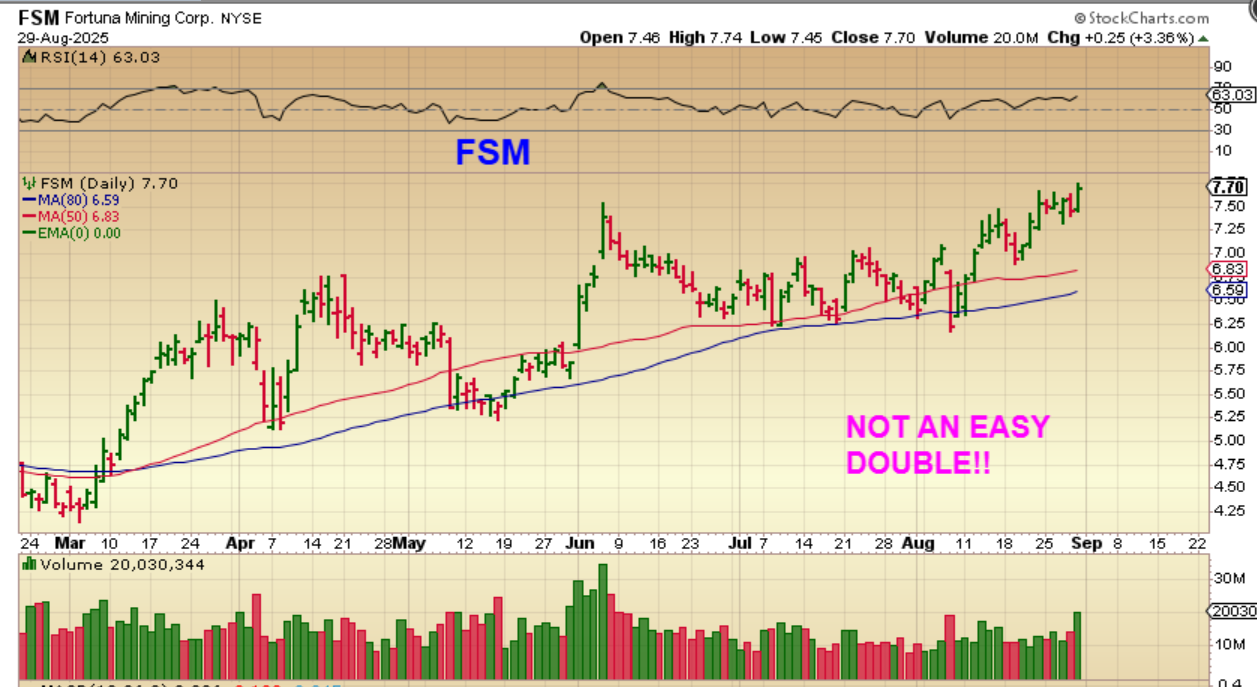
FSM has chopped higher and it also has almost doubled in 2025, but this was NOT an easy ride. Take a look at this weekly chart, and then we’ll look at the daily chart.
.
FSM looked like it was weak and extremely choppy, right? I traded this but it never looked all that strong for more than a few days, and then it would sell off. Now you go back to that weekly chart above and you have a double since March in 2025.
.
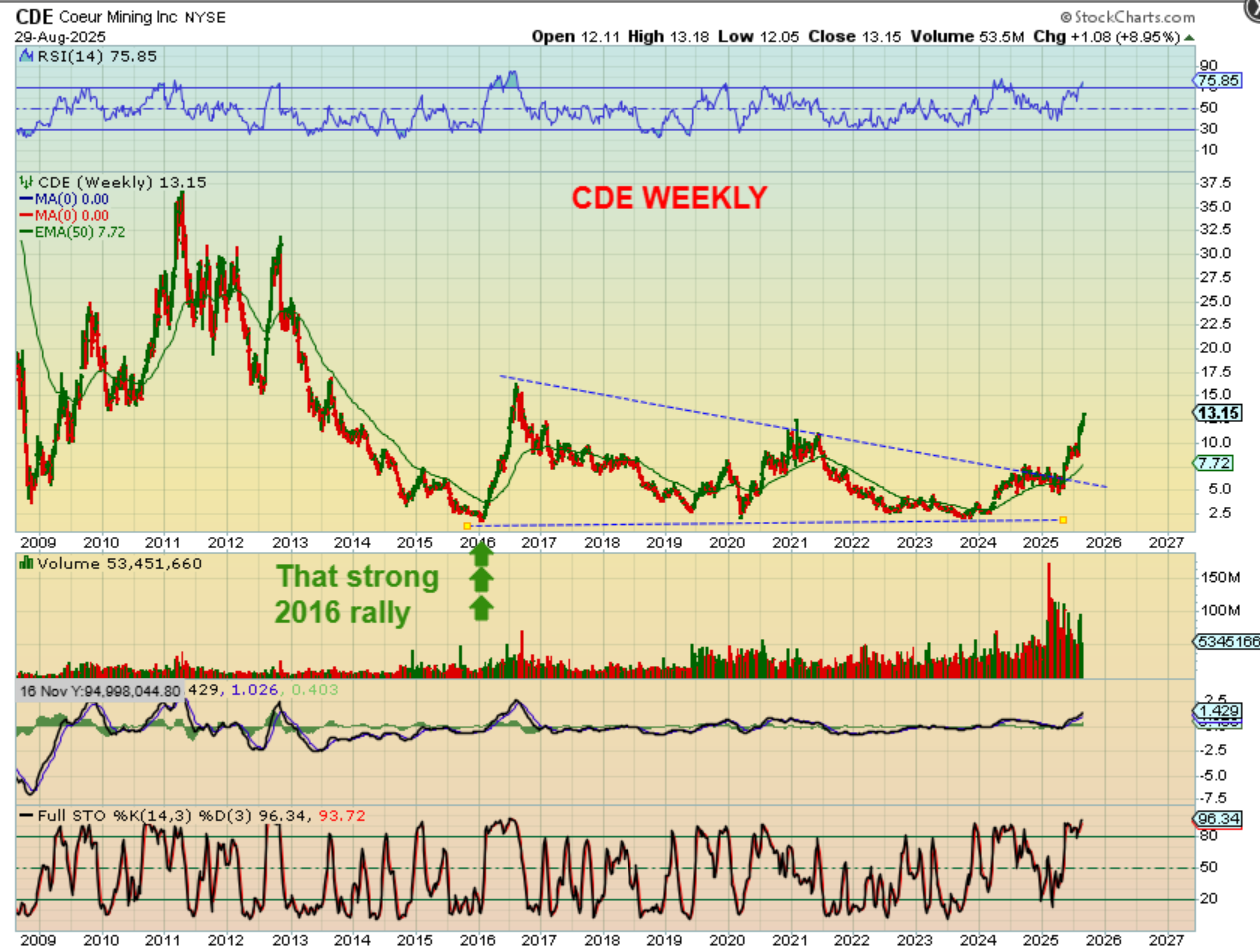
Next we’ll look at a Silver stock that perked up and became a real runner. CDE:
.
CDE ran from $5 to $13 since April. That is almost a triple! This is similar to that run in 2026, and now with this run, we have the breakout of the wedge and a rally. Next, we’ll cover a lagger…
.
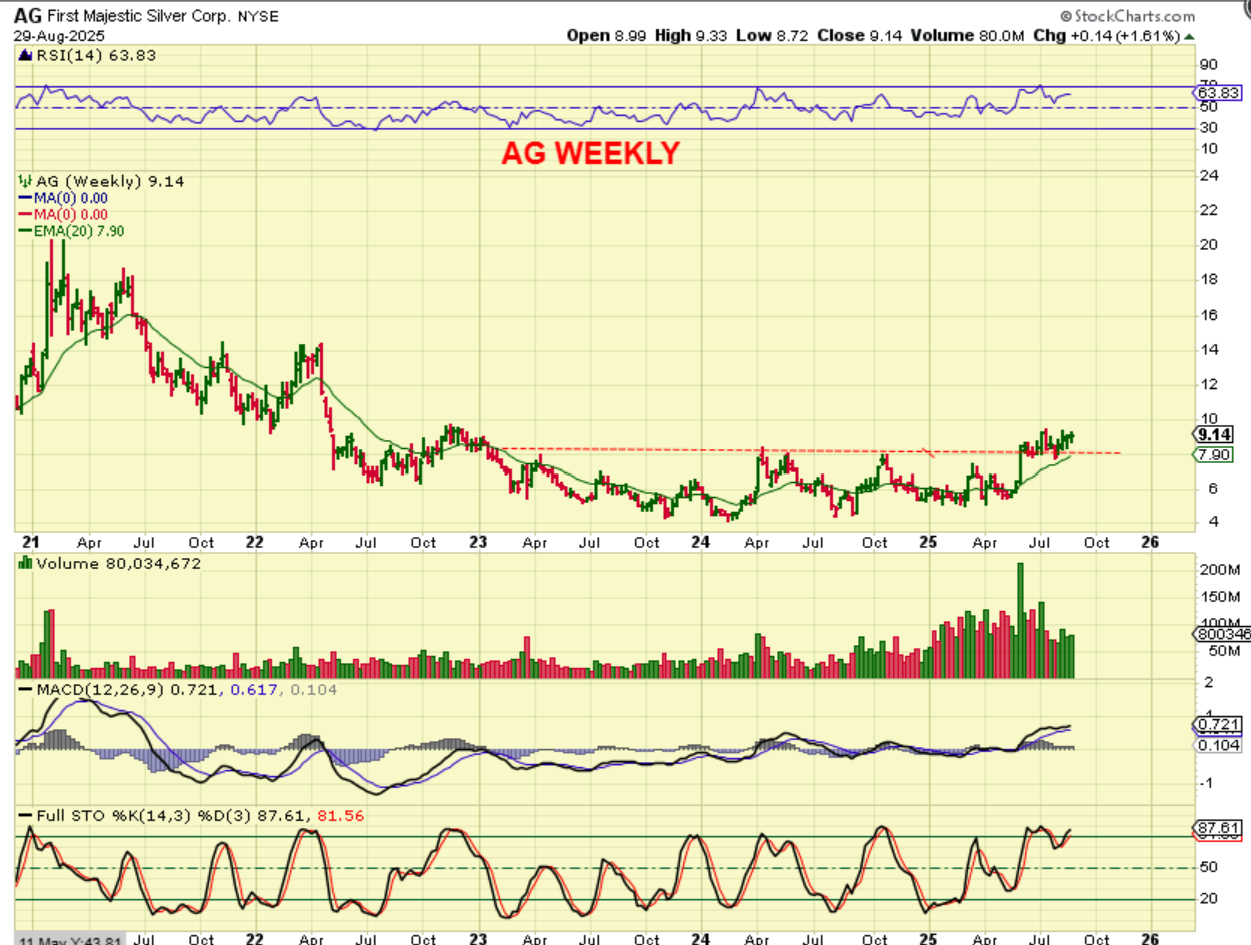
AG is a lagger, and now that it Popped above that base area and has chopped sideways, you can see the kind of upside potential that it should have. Others chopped higher and AG has chopped mainly sideways. I like the volume, and I think that it should start to follow some of these other runners. Thats like a bowl with a handle.
.
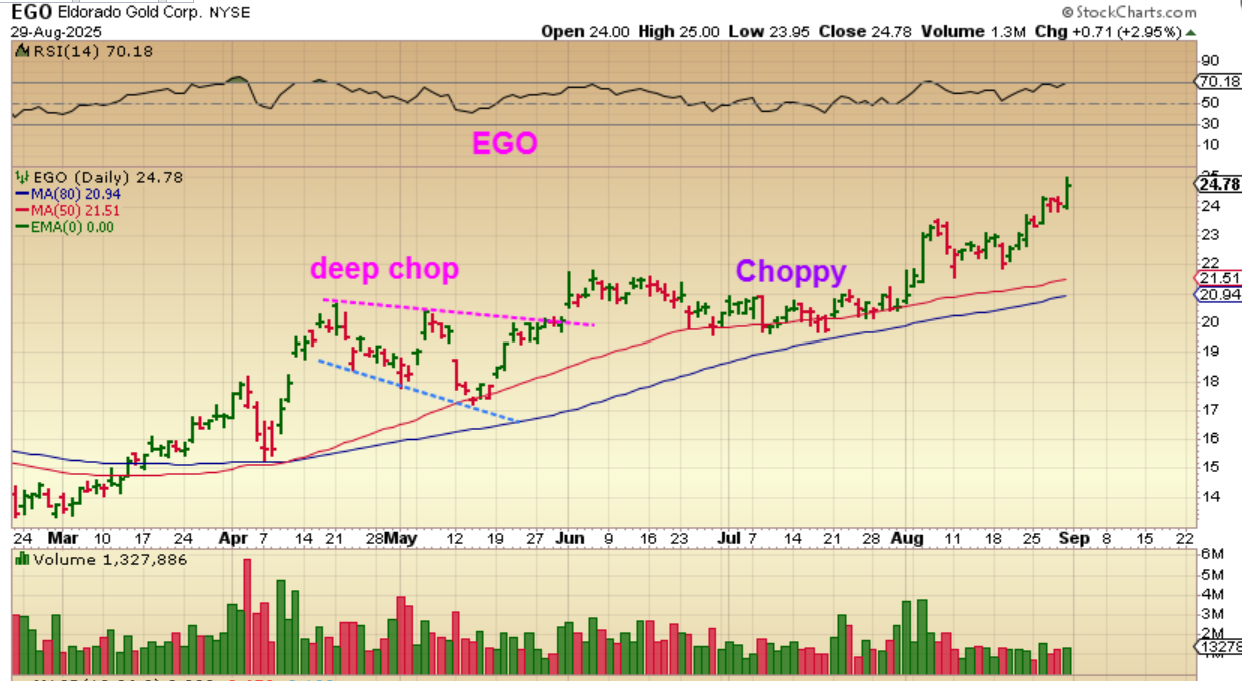
So we’re discussing these choppy daily charts. It can make the ‘buy and hold’ very difficult at times, even a little boring. This little lesson is always a good to one review though, and you’ll see why. Let’s look at EGO: One of the Gold stocks that I really liked along with KGC, IAG, NGD, etc.
.,
EGO has really had some choppy moments, right? It rallies and then gives a couple of deep drops. It got choppy and sideways for a couple of months, like we see here in June through July. It does make it a Difficult buy and hold, however it has done very well, and you easily see that with the weekly chart…
.
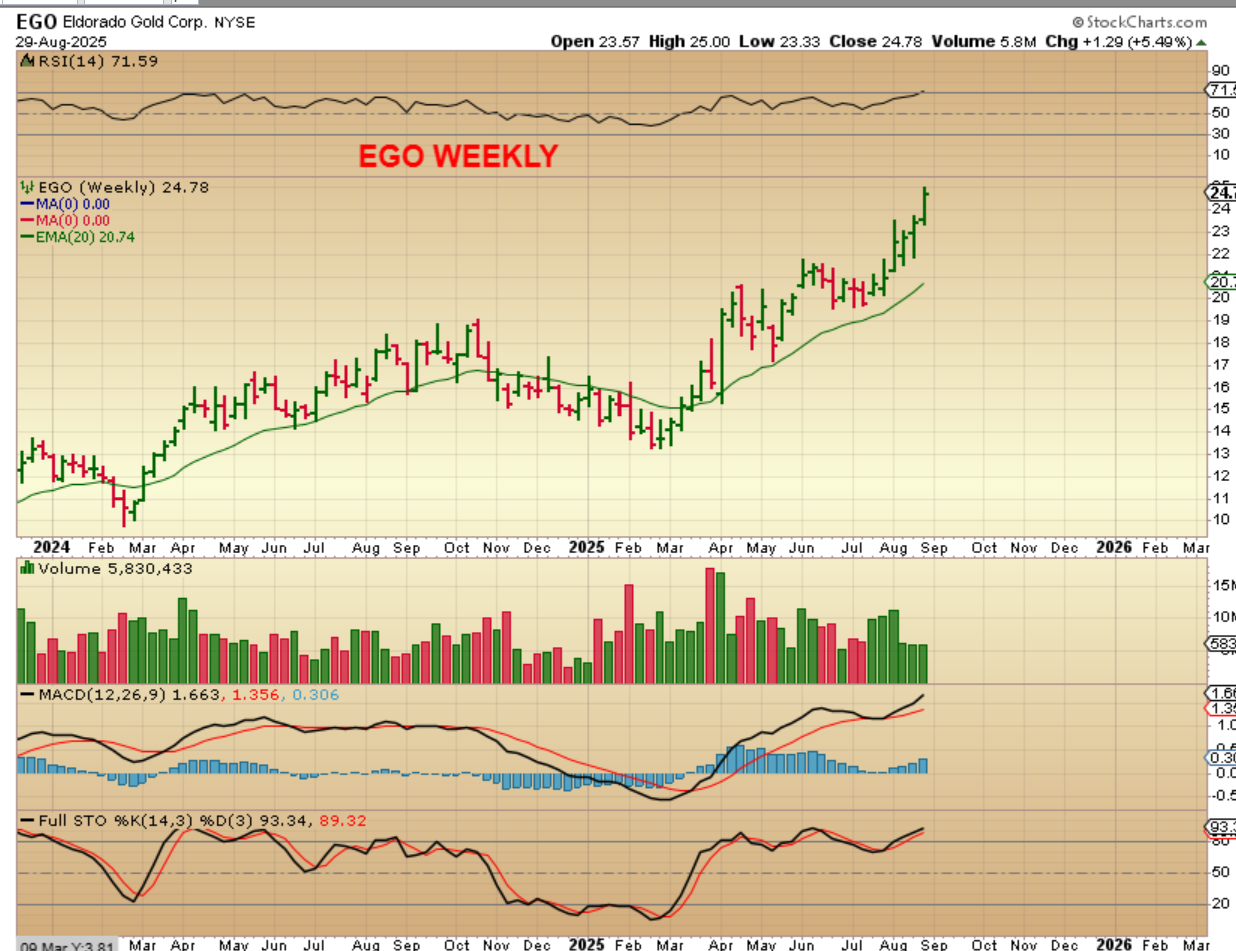
EGO WEEKLY: What’s the problem, right? 🙂 Is this even the same company as the chart above? 🙂 In 2025 alone EGO ran from $13 to $25. It certainly has been choppy, as seen on the daily chart above, but the weekly gives us a Bull Run over time. Not only that, but let me show you something really interesting about this bull run…
.
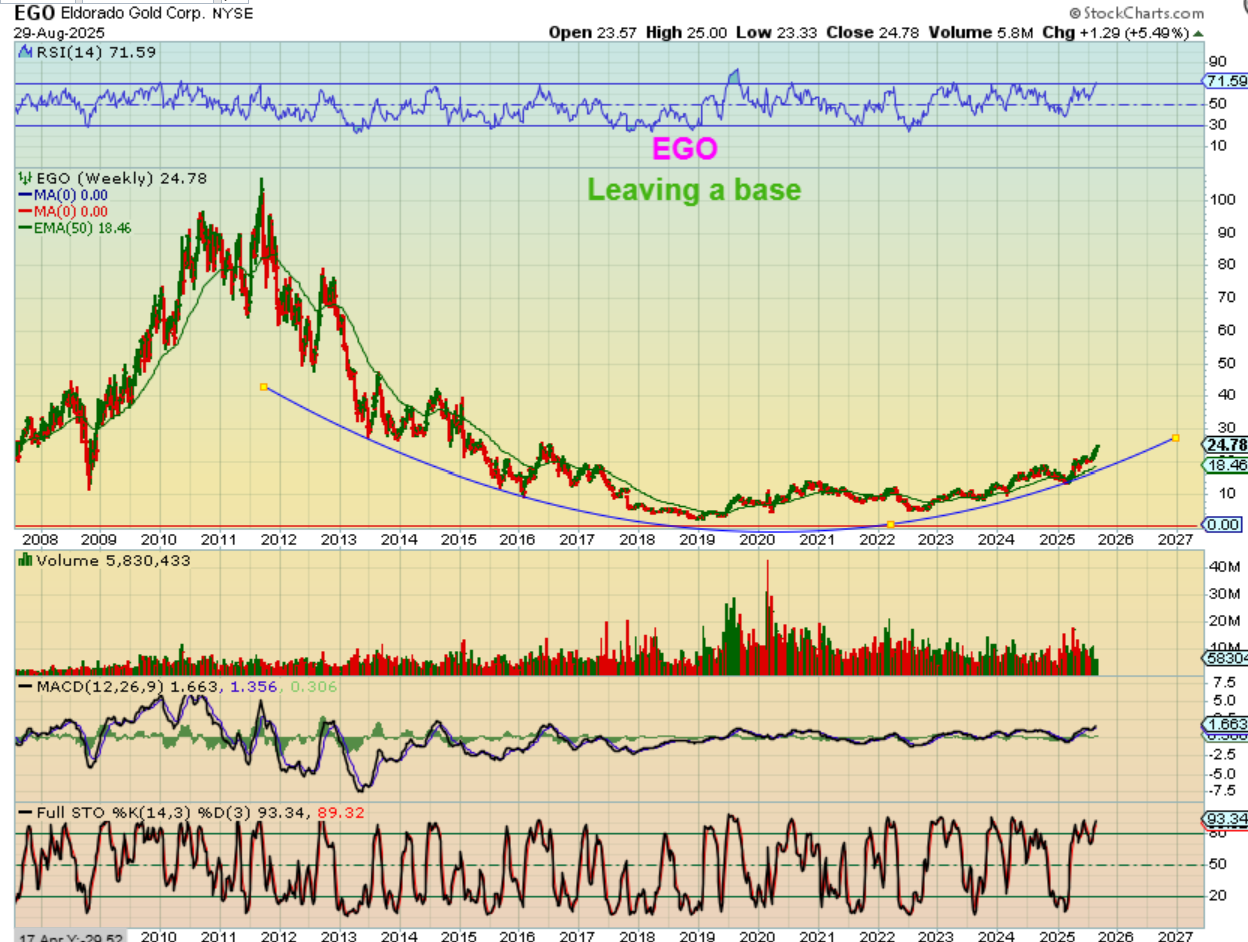
If Gold remains in a bull market and EGO stays healthy, this move may be just starting too. EGO is breaking out from a base and starting to form a nice bowl higher. EGO was a $90 stock that tagged $100 in 2011, and a run to there from here is a great gainer. Again, the daily charts may be choppy and difficult, but the potential is there.
...
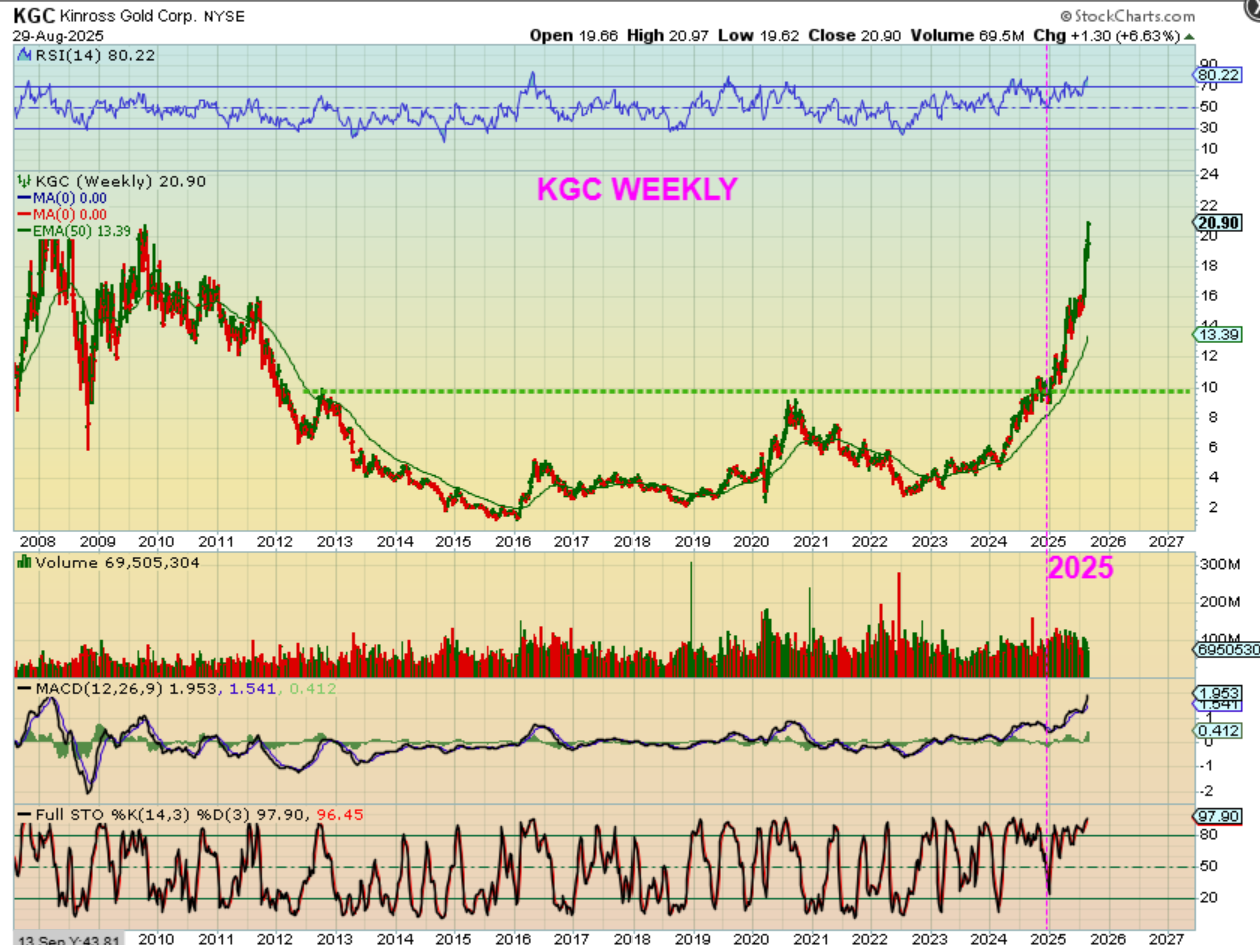
KGC was one of my favorites and look what just happened in August! This was another choppy sideways move, but it was upward chopping. Well, once it finally broke out, it just ran like a cheetah! Some others that I am discussing may do this too, when Buyers decide that they want in. What does THE KGC WEEKLY chart look like?…

...
WOW! KGC looks to be going parabolic on a weekly chart and all of that sideways chop this year fades away.
.
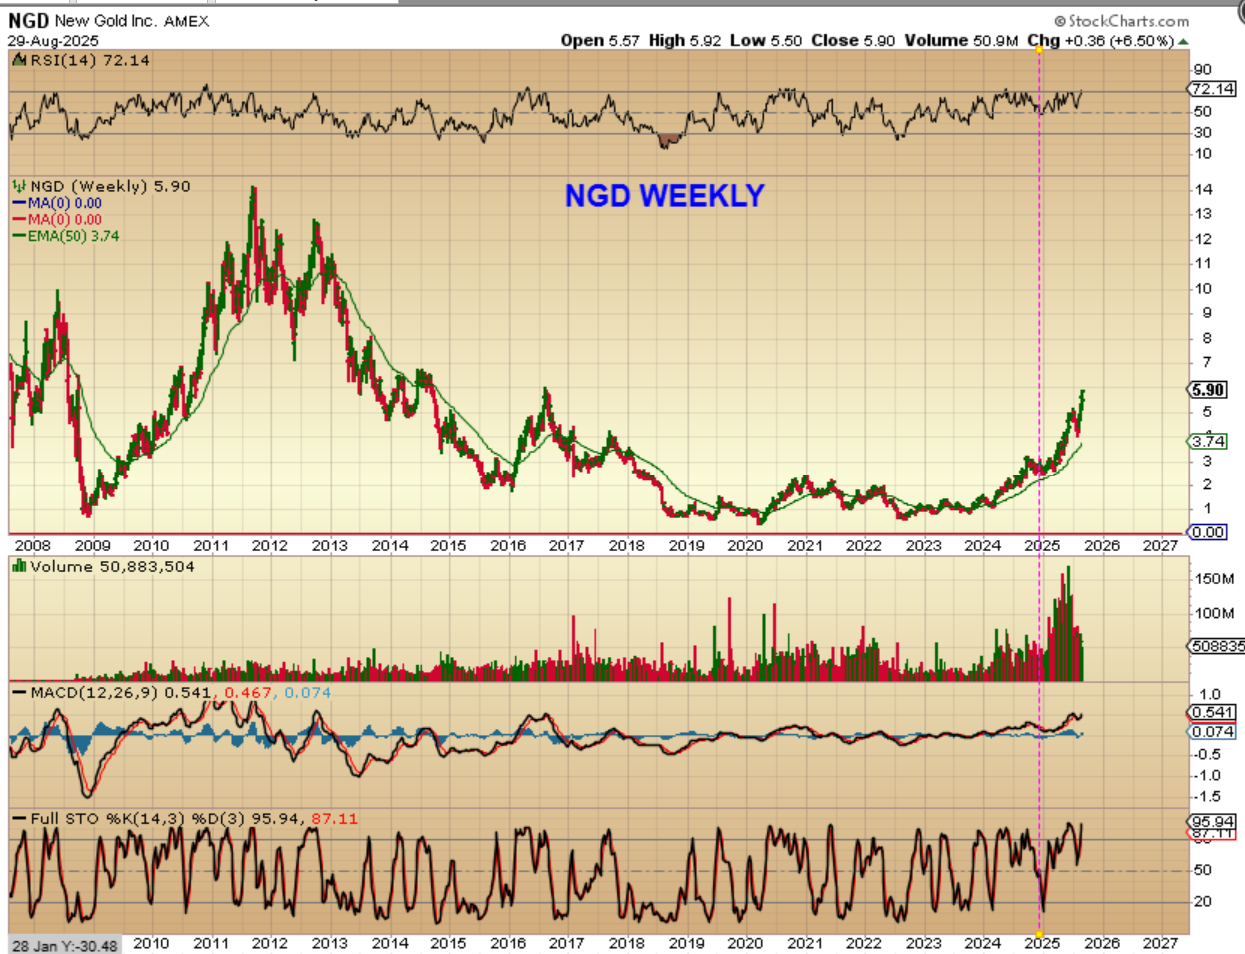
NGD is another of my favorites and it is still doing very well too, but as you can see, the upside potential is still there over time.
.
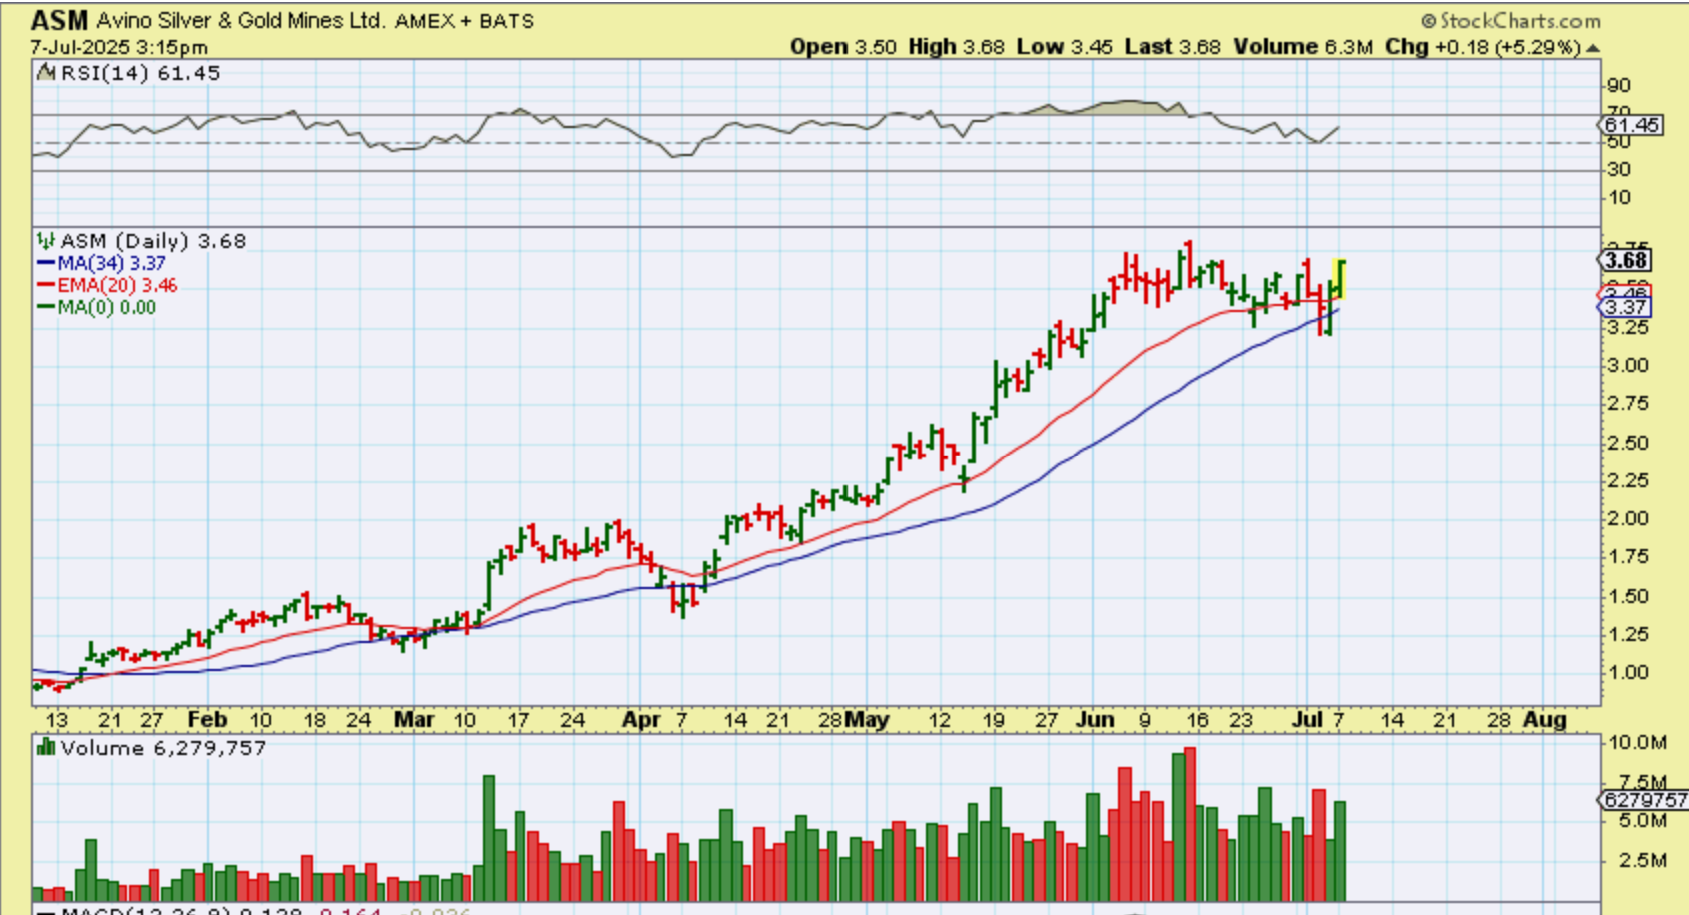
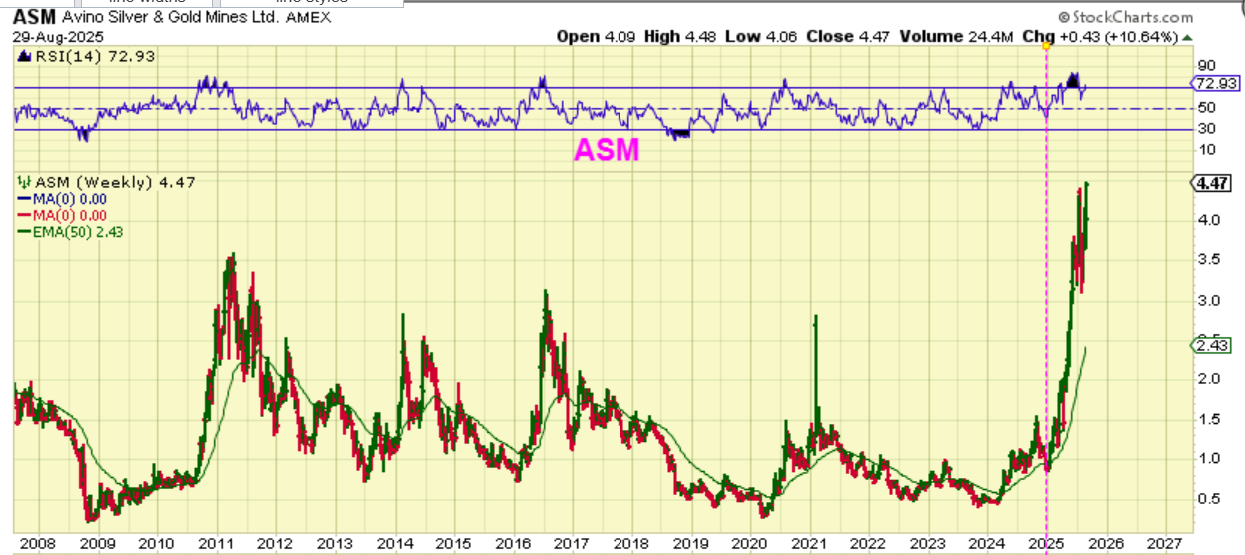
And ASM was also one that I have pointed out over the last year as a favorite too. It was running steadily in early 2025 and then started consolidating up high in July. This chart was posted then. How does the weekly chart of ASM look??
It is also parabolic this year as it continued to run higher out of that consolidation in August.
.
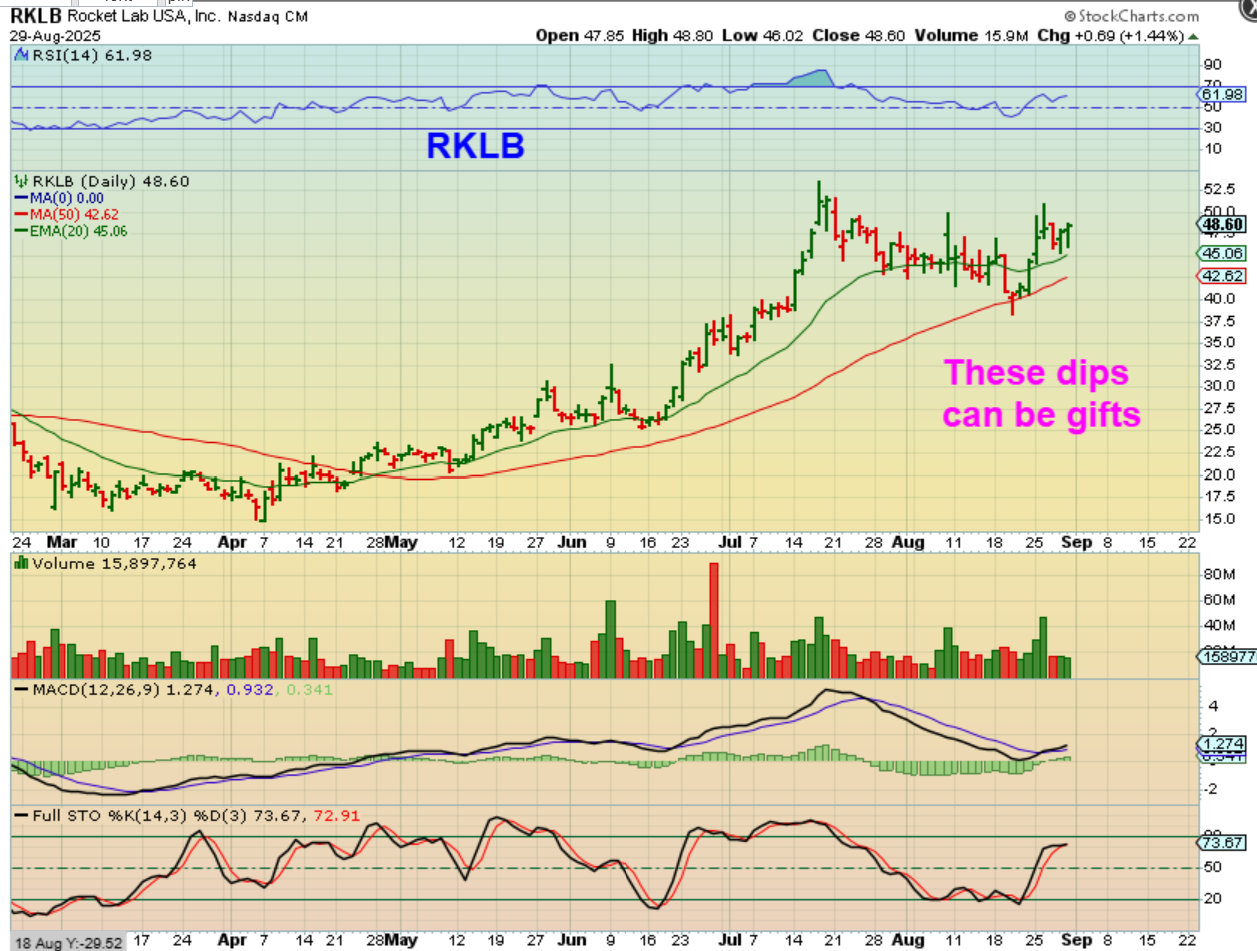
So the Bulls are running, and we’ve seen choppiness in all sectors at times. You can see what comes from choppiness in Bull markets when they break out, as we’ve been seeing with some of these Miners. Choppy dips and consolidations can be gifts when they come along.
.
I hope everyone enjoys their weekend! In the US and Canada we have a 3 day weekend, so we’ll see you all on Tuesday!
.
~ALEX
.
We discussed how Gold and Silver Miners started running higher when Gold wasn’t. Now Gold is breaking out and some of the Miners are already nicely higher. We may be seeing that with Crypto right now, so let’s discuss this big difference between Bitcoin and the Crypto stocks next.
.,.
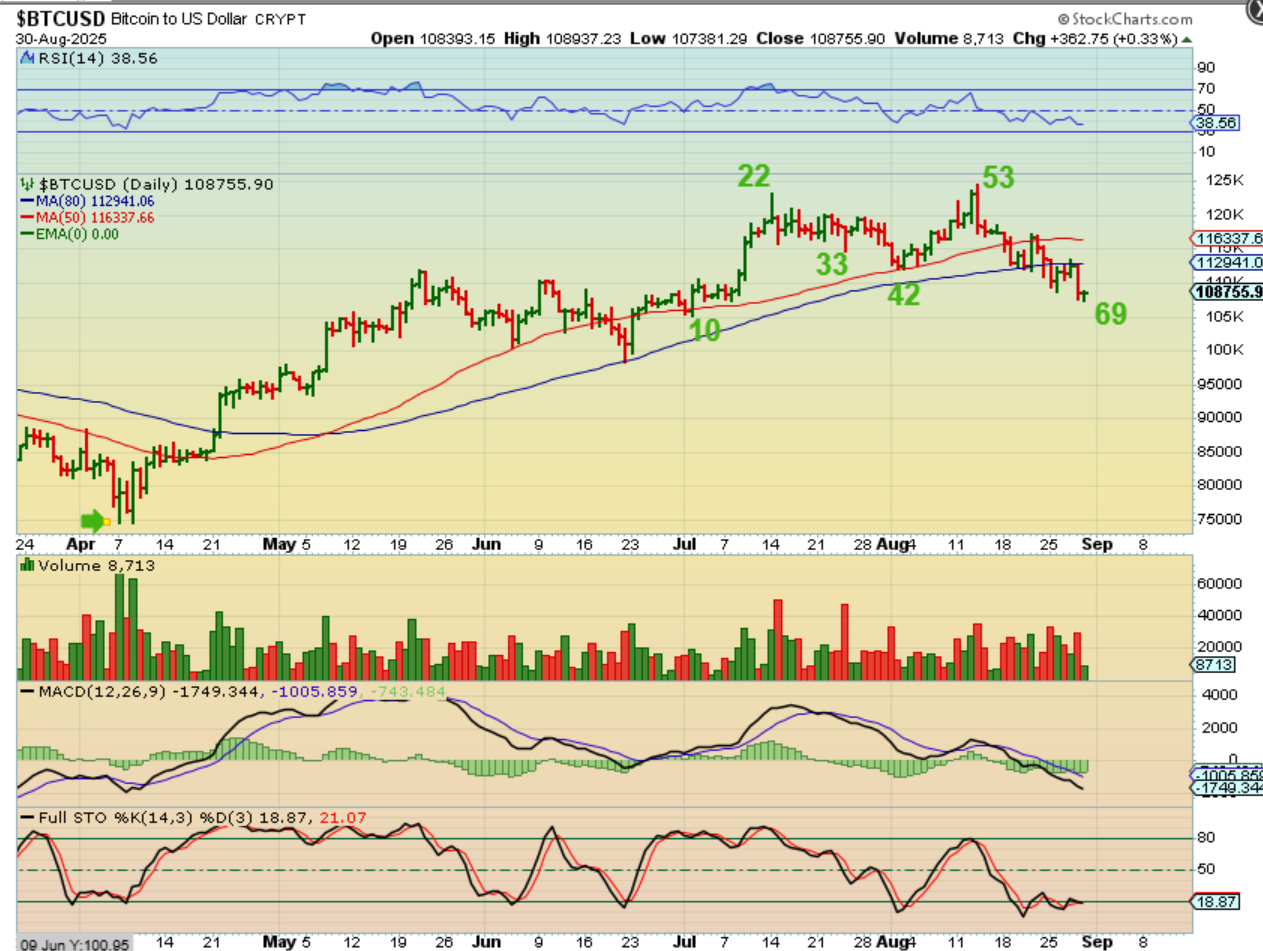
BITCOIN DAILY -A new low formed on Saturday, so that gives us Day 69, of what is usually a 60 day – daily cycle. Normally I would say that this must be failing, and it must be real weakness, but some crypto stocks are NOT dropping in August with Bitcoin, so I’ll address that.
.
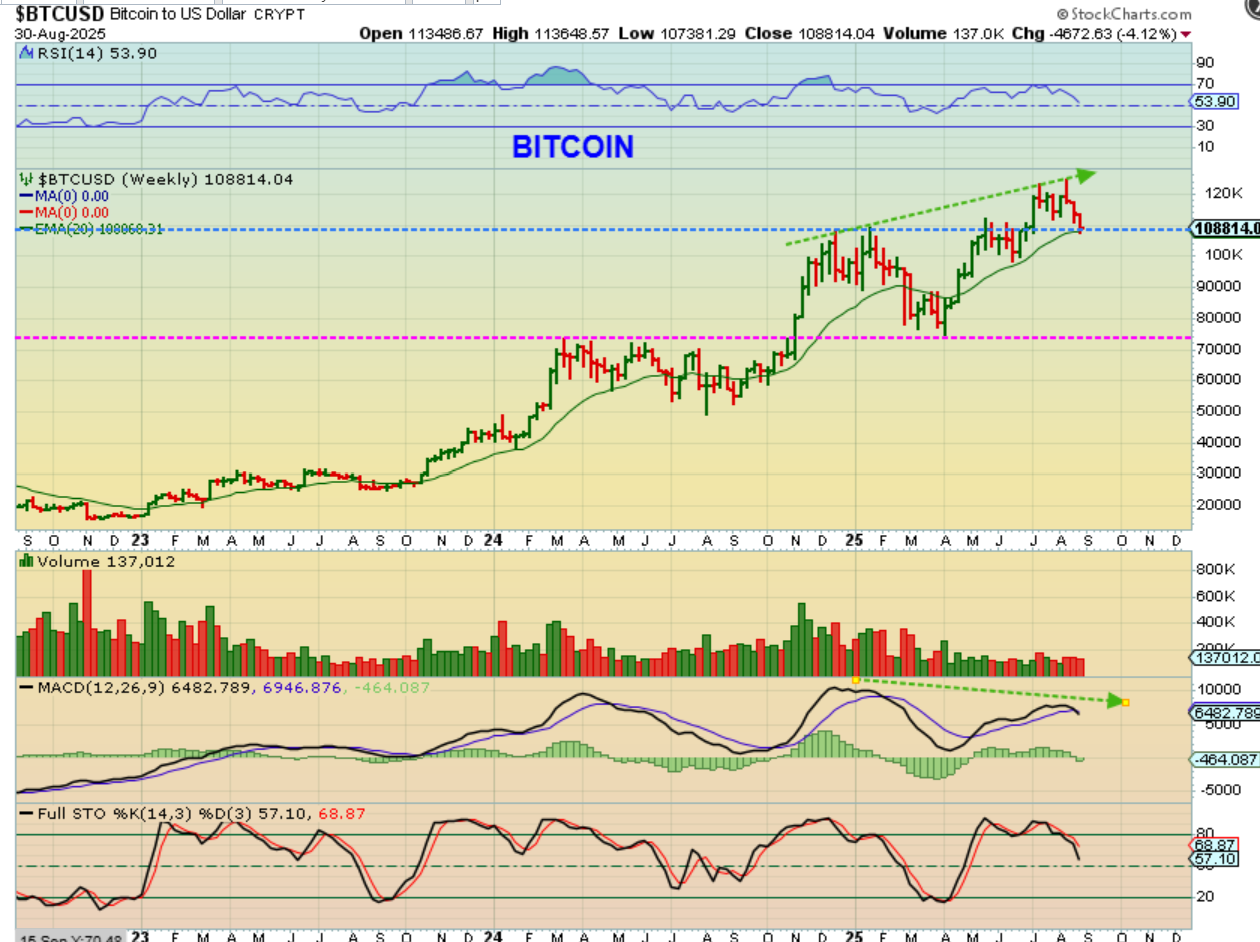
BITCOIN WEEKLY– The weekly chart has Bitcoin back testing a breakout and back testing the green 20 weekly MA. THIS doesn’t look as concerning as the daily cycle count, but we need Bitcoin to move higher next week in my opinion.
.
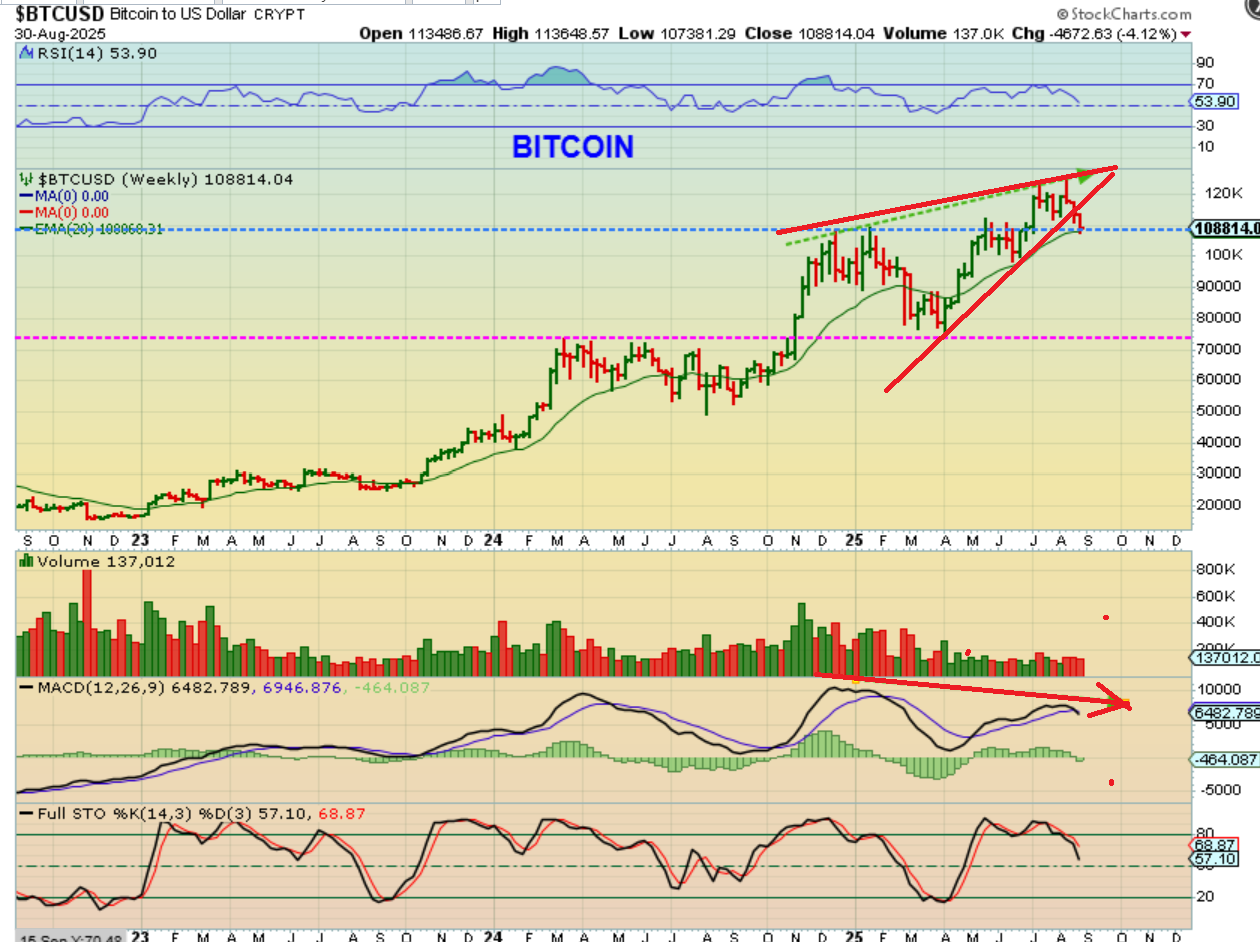
BITCOIN WEEKLY– This bearish rising wedge breakdown and a MACD cross under would make the weekly chart look bearish too, however.
.
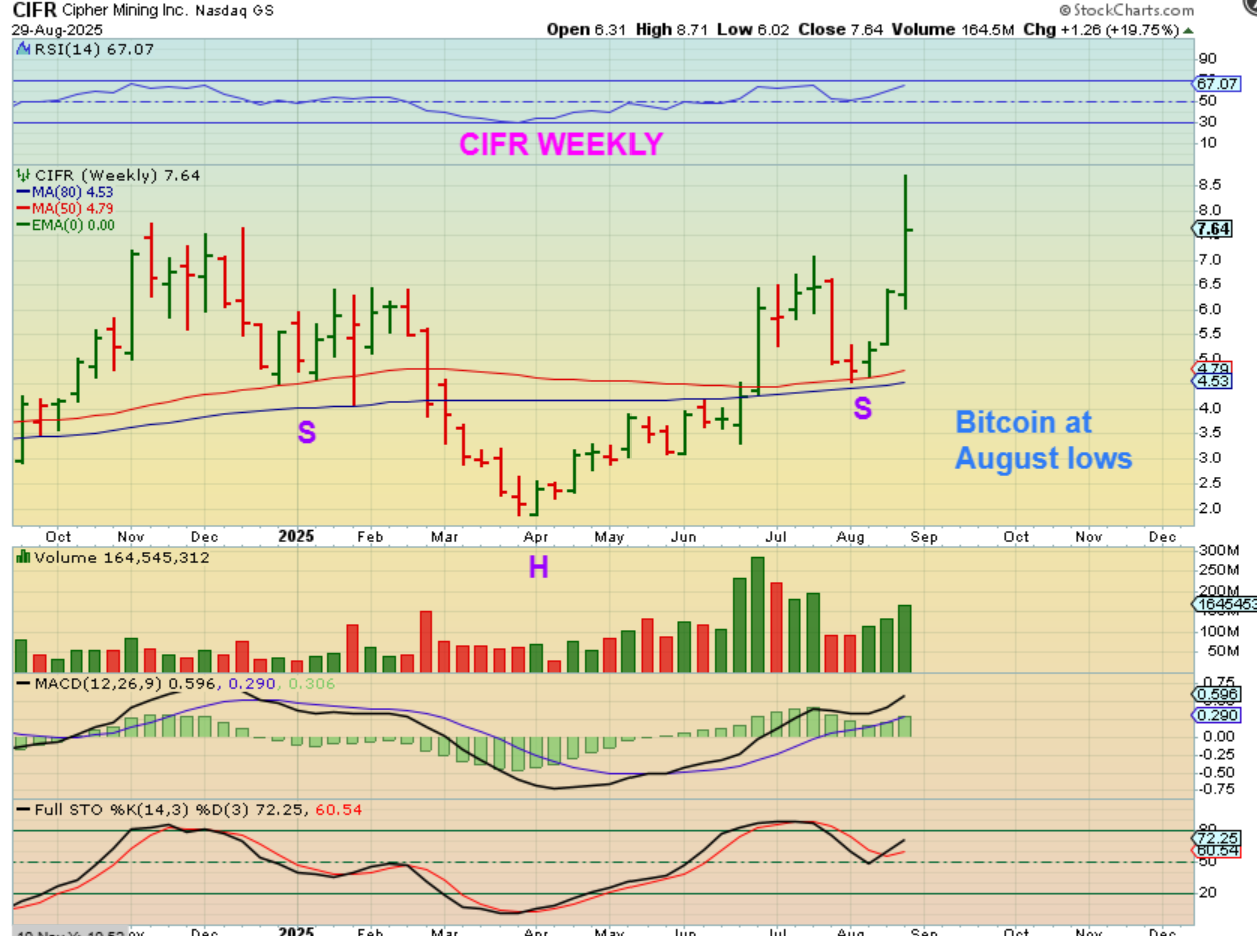
But then we look at weekly charts of some crypto stocks. Bitcoin was selling off in most of August and is at the recent lows, yet some Crypto stocks are running ahead higher. Is this similar to the Gold Miners running when Gold was only chopping sideways in a triangle? Tiem will tell, but lets look at a few charts…
.
CIFR WEEKLY – CIFR almost doubled in 3 weeks? It ws up 20% last week, so this is NOT selling off in August with Bitcoin.
.
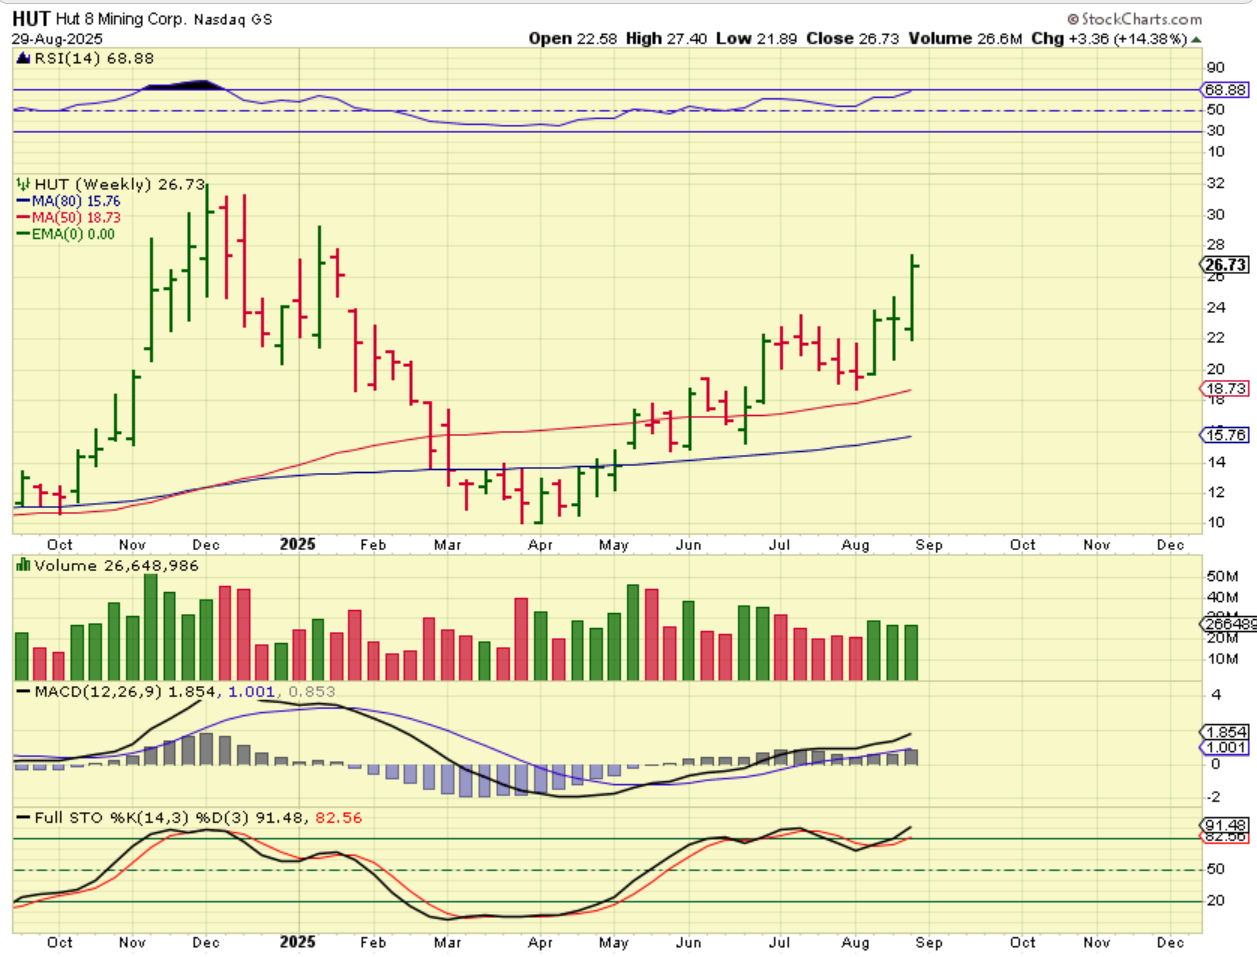
HUT WEEKLY – HUT was up another 14% and is not at the lows like Bitcoin in August.
.
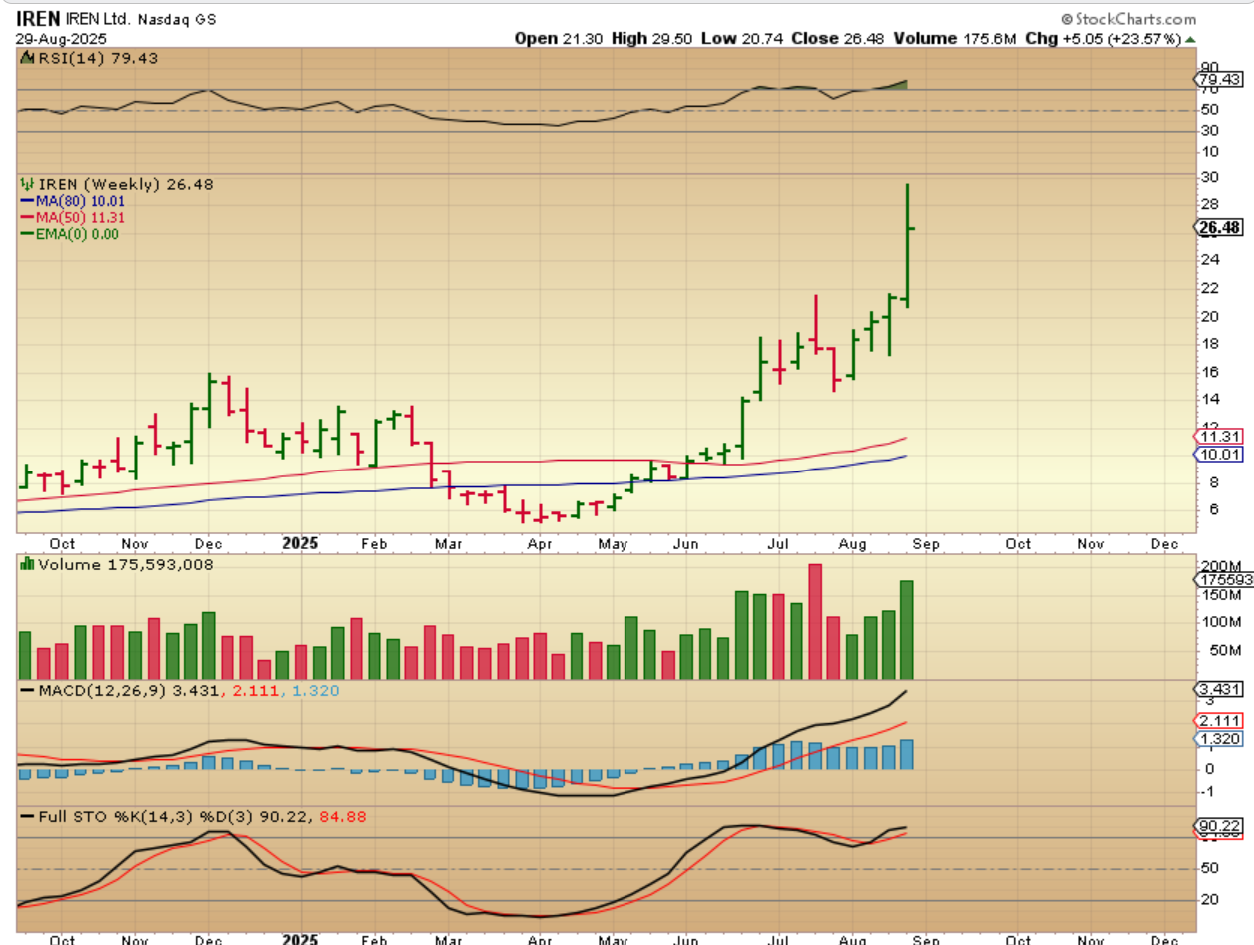
IREN WEEKLY – IREN had good earnings and shot up big on Friday, but it did drop and start to fill that gap open. Even with that Friday drift lower, IREN was up 23.5% for the week. Again, this is with Bitcoin selling off for 3 weeks and at its’ lows.
.
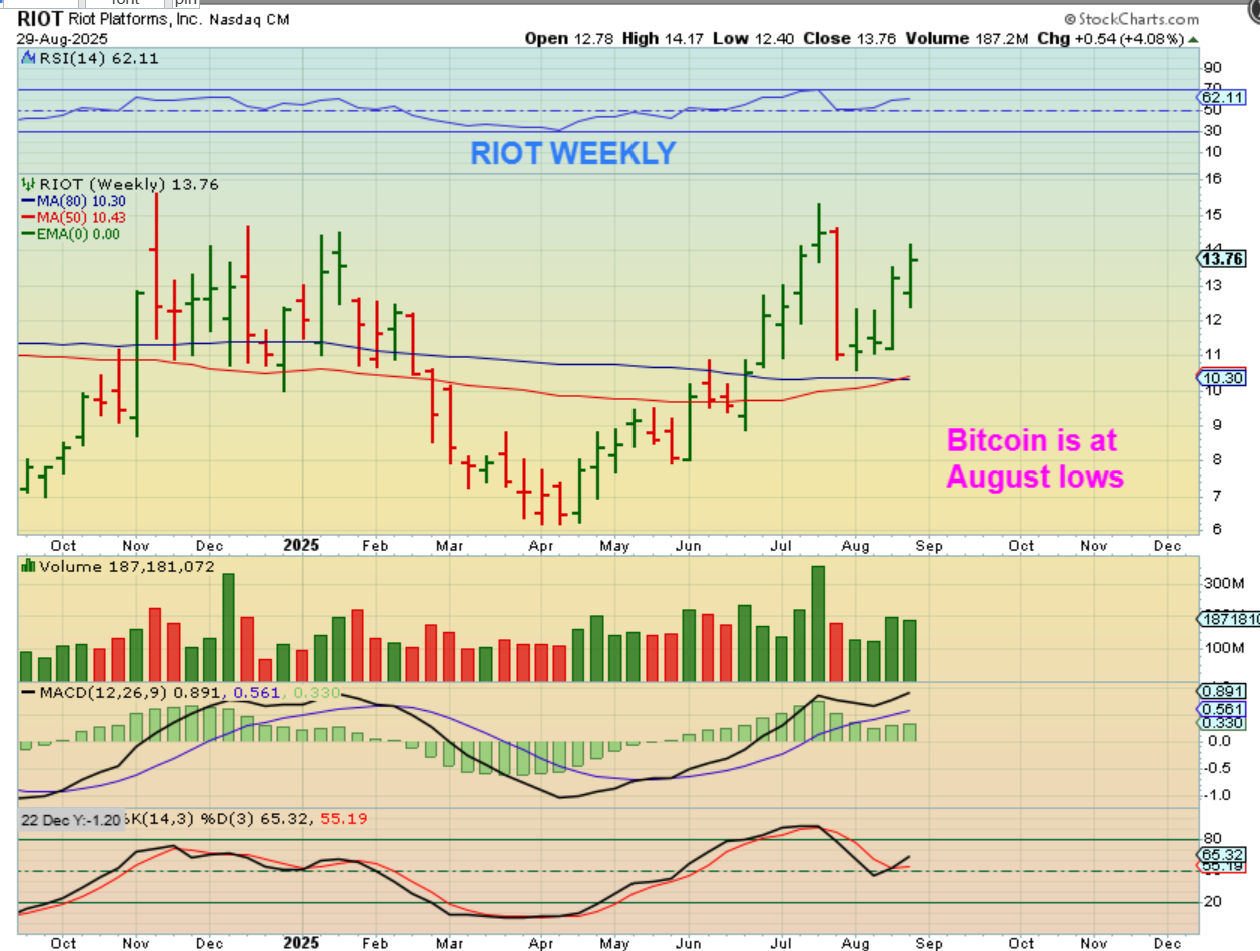
RIOT WEEKLY – RIOT wasn’t up a lot this week, but it was up 16% the week before and it has also been climbing for 3 weeks, as Bitcoin sold off, so…
.

