July 26th Weekend Report
During the daily weekday reports I use more daily charts than weekly charts, and in the weekend reports I will be mostly using weekly charts for the bigger picture view. You can always refer back to the daily reports to check on daily cycle counts, support and resistance levels, etc. for our daily trading. That said: With the general markets in this report, I’ll start with daily charts 🙂 Enjoy…
.
Question from reader: Are we getting overheated here? The RSI is overbought.
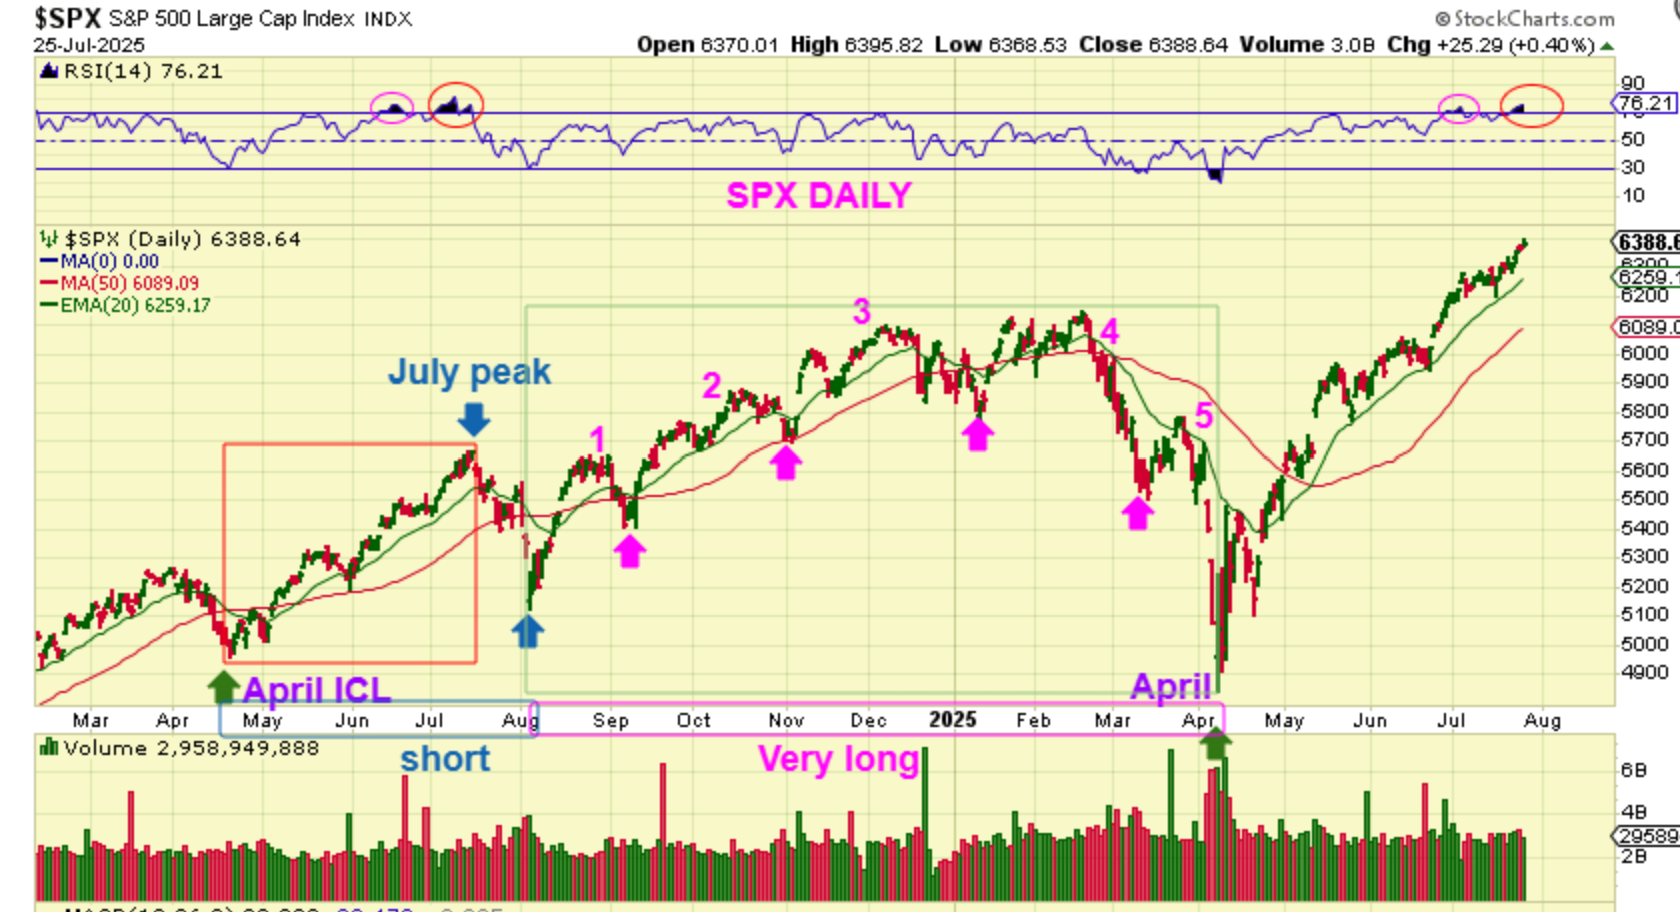
I agree that The SPX is running straight up and the RSI is in 70+ territory. I also agree that at times, we can get a ‘peak’ in that area, as seen with the 2024 bull run. Notice also that the 2024 bull run ran from April and peaked in July with that RSI at 70+. Our current rally started in April too, and we are now in July. DOES THIS MEAN WE SHOULD EXPECT A STRONG PULLBACK? Answer: No, not necessarily…
..
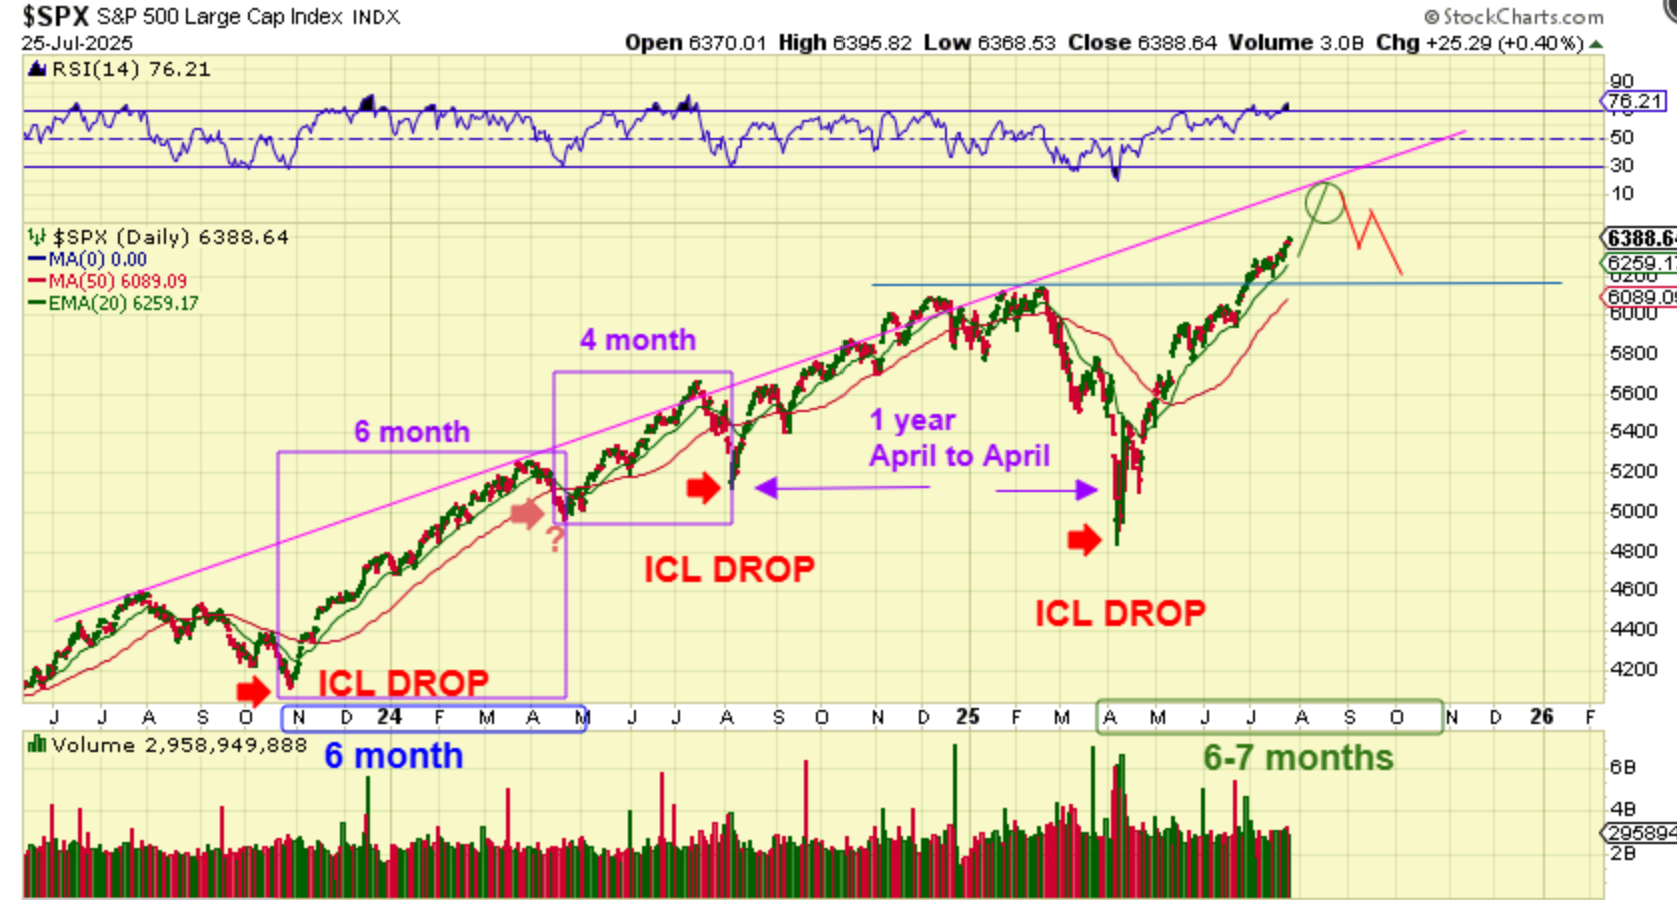
Take a look back at the bull run out of the 2023 low for The SPX.
That run hit RSI overbought levels too, but it continued higher and lasted for 6 months and peaked on Month 5. We are only on month 3 currently, and you’ll see that an upper trendline formed over time too. We could continue to rally and tag that upper trendline over time again, as drawn below.
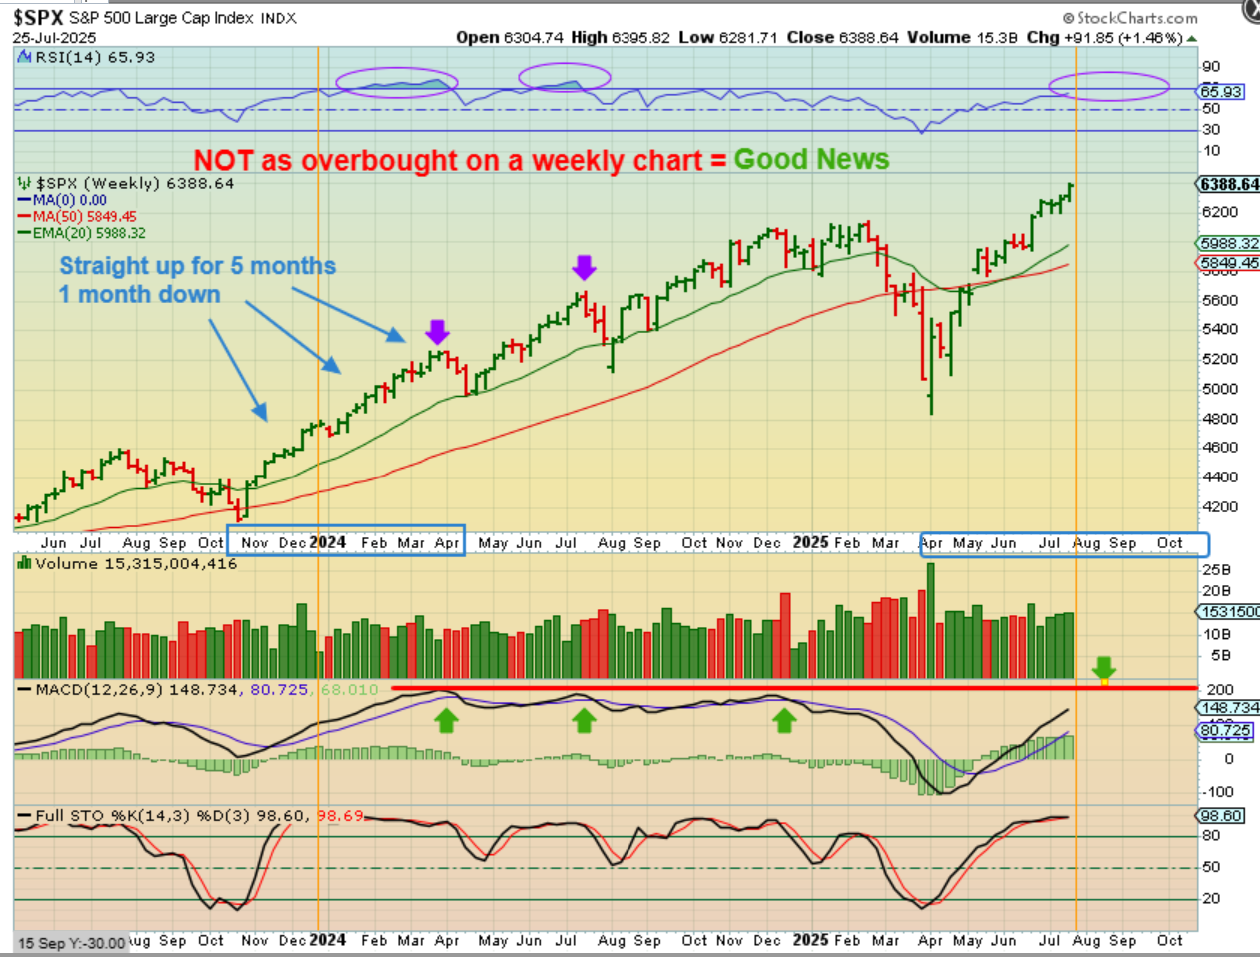
We also want to consider the Weekly Chart!
The 2023 Bull Run ran straight up for 5 months and the weekly chart pushed RSI 70+ for weeks, but notice that we aren’t there now on a weekly chart. We are only at RSI 65 and finishing up month 3, so this really can continue higher. Bull runs can surprise to the upside. The MACD is also not as overdone as the last rallies, so it is best to ride the bull and continue to raise stops.
.
Next, we’ll take a look back at the 2020 Rally. .
NASDAQ WEEKLY #1:
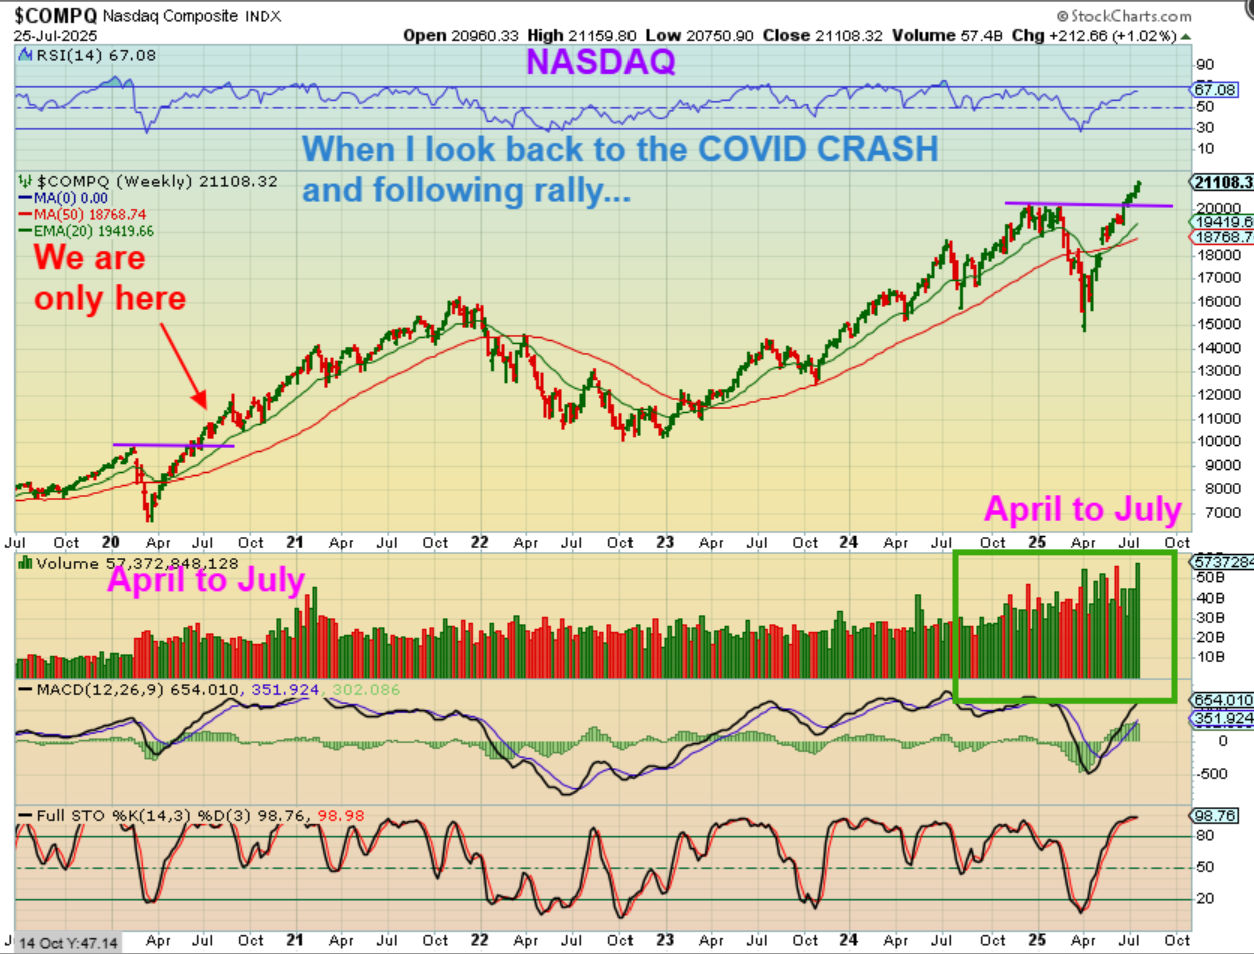
You will recall that when we crashed with the Trump tariff announcements in early 2025, I pointed to the ‘Covid-Crash’ and said that it rallied during covid shutdowns and panic, because it climbed a wall of worry. I said then that we may be in for a strong v-bottom rally just like that time period. We could buy with a trailing stop and the markets could climb a wall of worry. Now comparing the 2 time periods again…
.
Same chart: Now comparing the 2 time periods again we see that
1. They both bottomed in April and by the time 2020 hit July, it broke to new highs and continued higher for months, right?
2. We also just broke to new highs and compared to the 2020 rally; we’d have plenty of upside to go. The Volume is really impressive this time too.
.
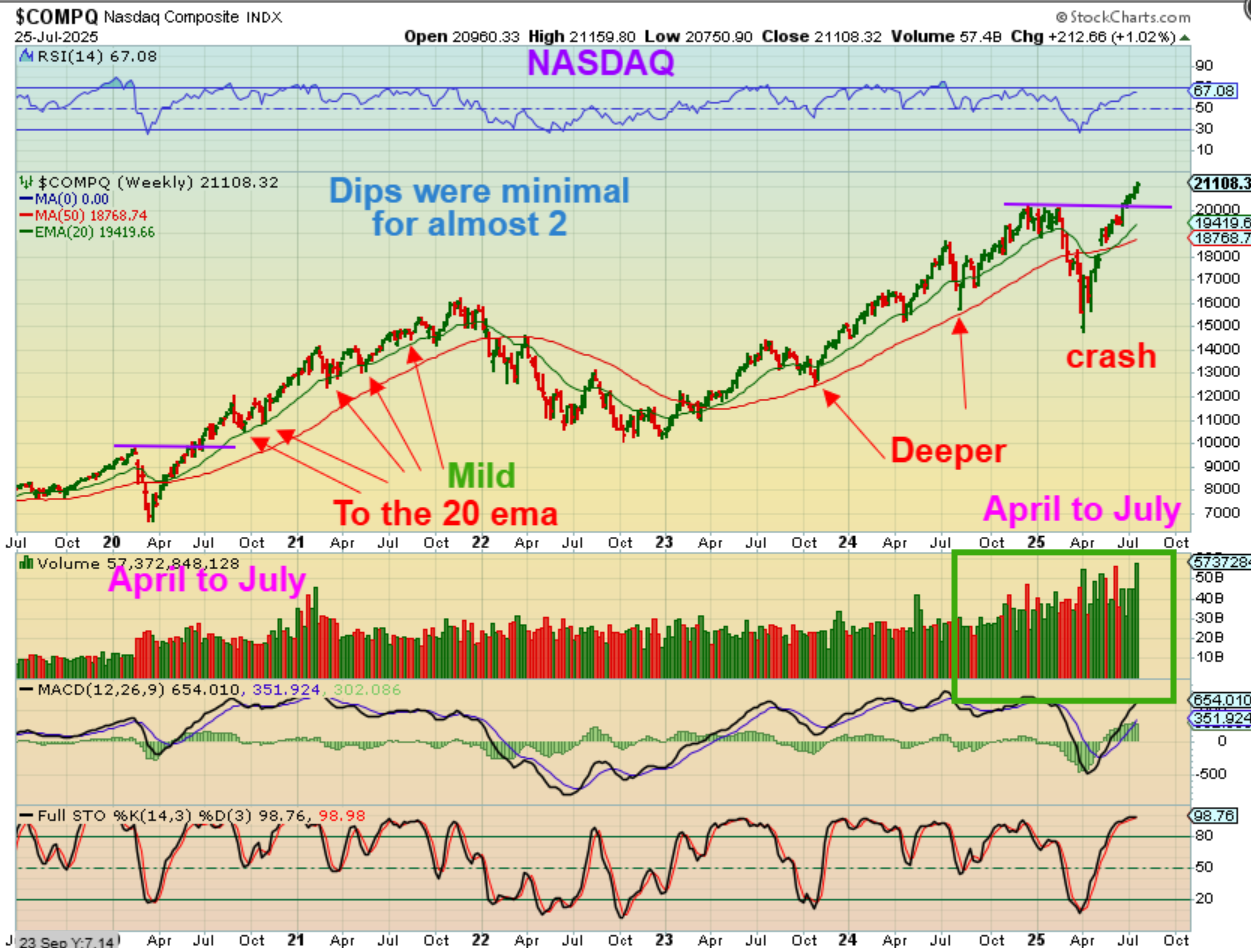
NASDAQ WEEKLY #2– I just wanted to point out that in that Covid Bull Run, dips & ICLs were relatively mild. We may have some milder dips on this bull run too.
.
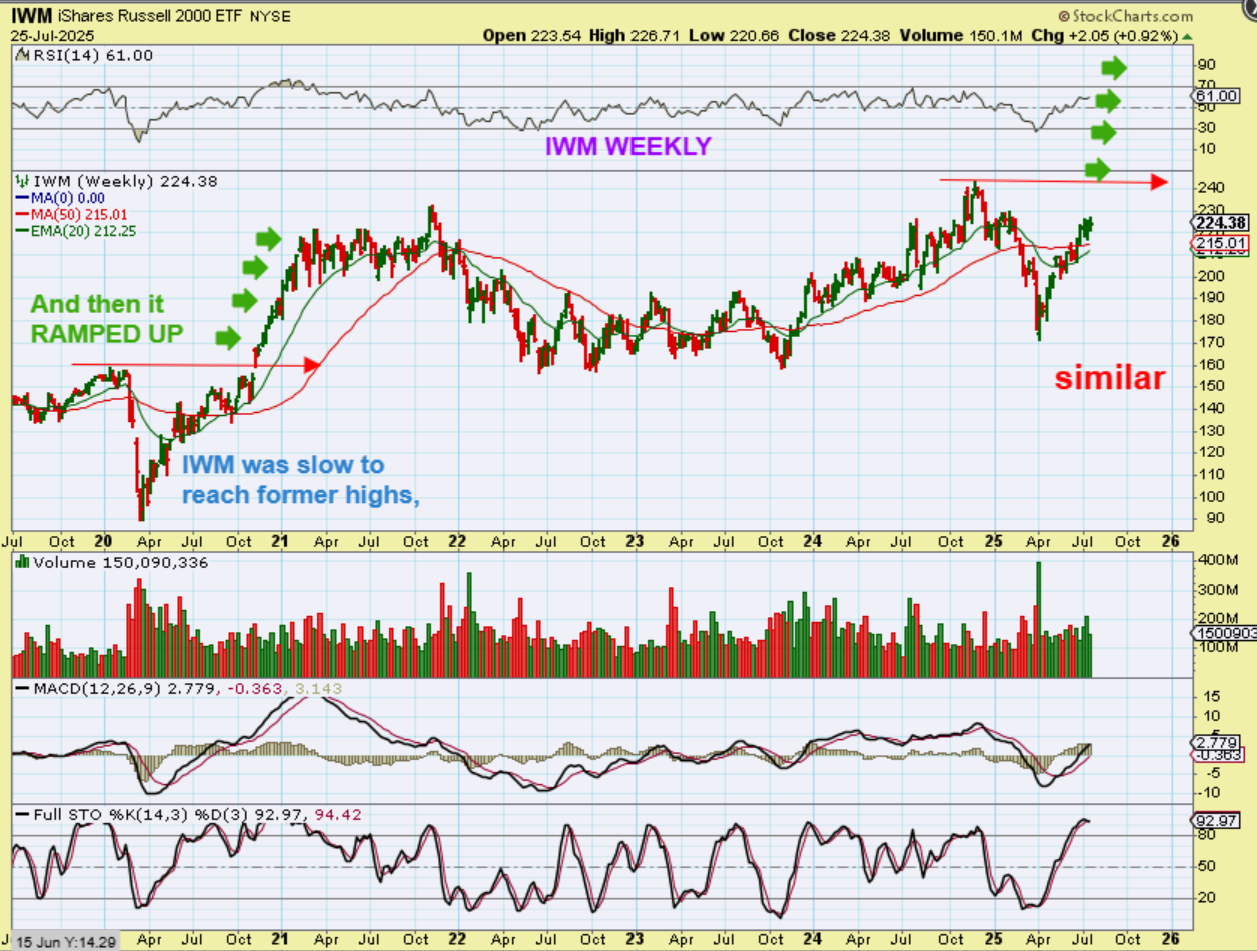
IWM has lagged in this rally, since it has not reached prior highs, but you’ll notice that the same thing happened in that post Covic-Crash rally. Take note of what happened later on in the move. Once price broke to new highs the Russell 2000 was off to the races, running straight up for months.
.
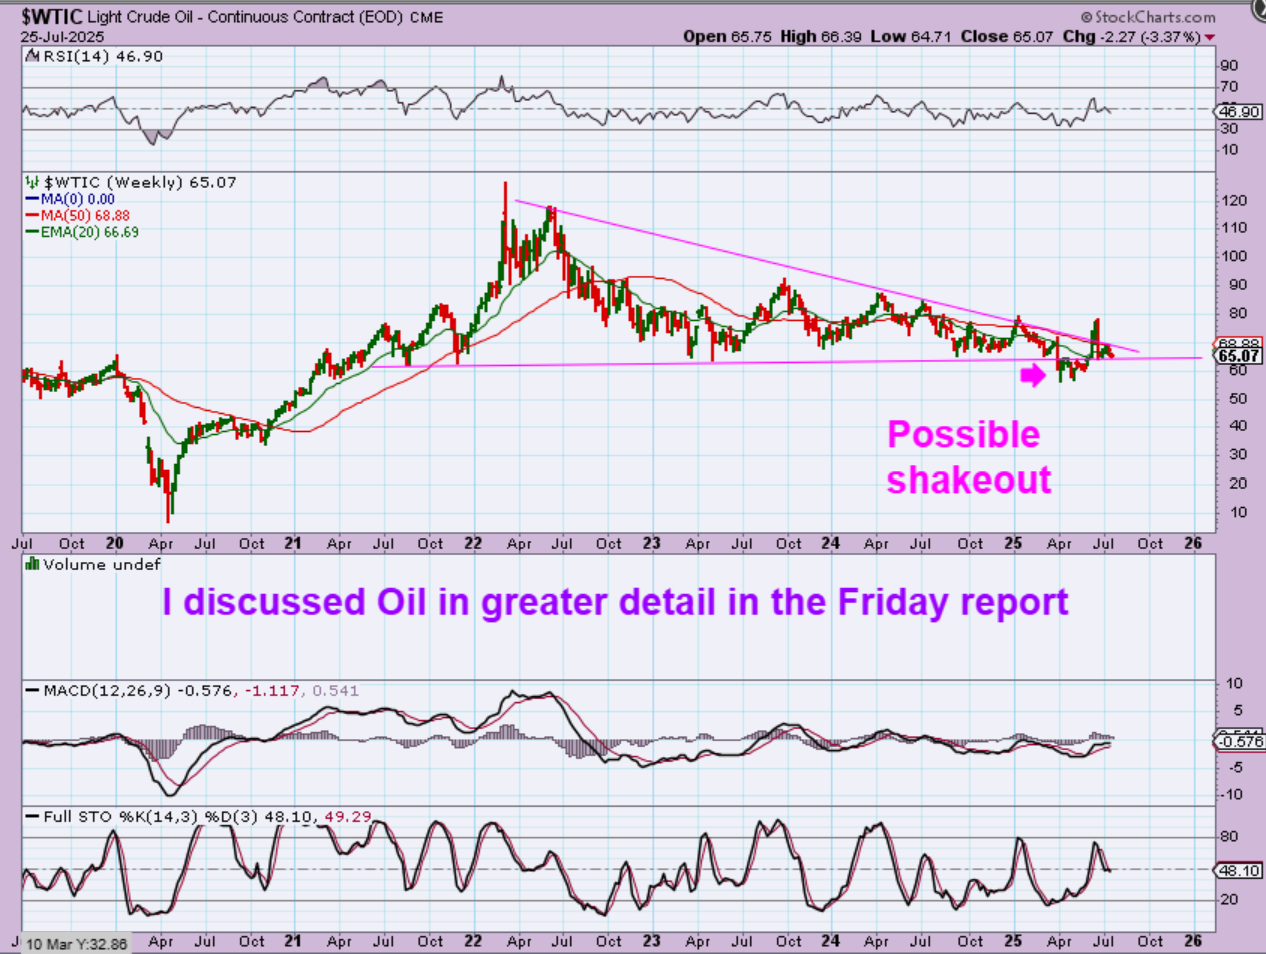
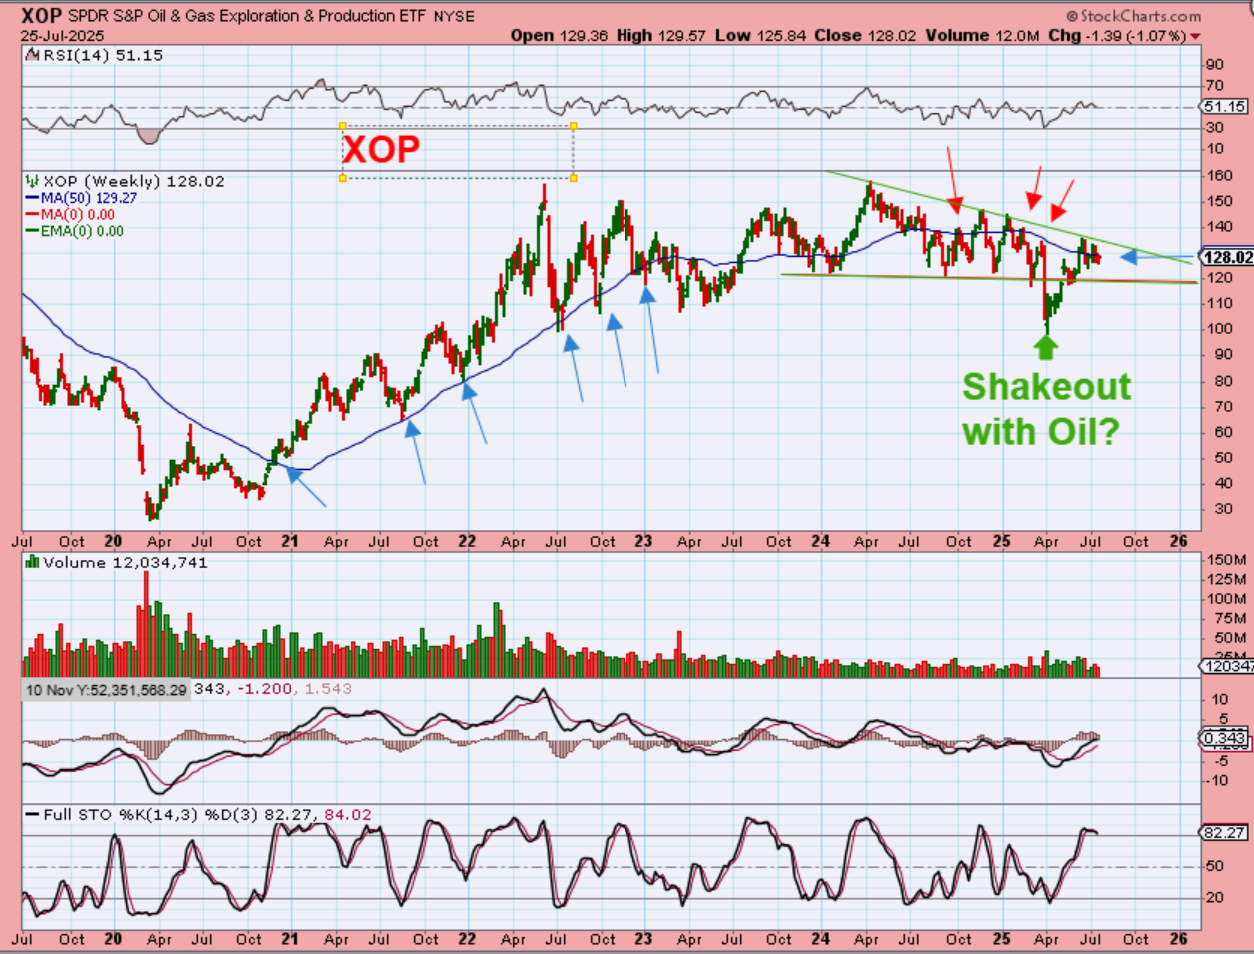
WTIC – Oil broke down below that long-term support and looked ready to stage a big sell off in April, but then it started to chop sideways & recovered sharply with the geopolitical situation (War) with Iran. Since then it dropped sharply too, back to the long term support. I discussed Oils set up in Fridays report where we also discussed the XOP/XLE and a good number of Oil stocks. Let’s look at the XOP…
.
XOP WEEKLY – Oil stocks also slammed down and recovered, but they are actually still up at the recent highs, and they did not drop back down to that lower support line. Oil stocks actually do look like they may want to break higher and that may be an indication that Oil is going to move higher from support too. We will continue to monitor this sector.
.
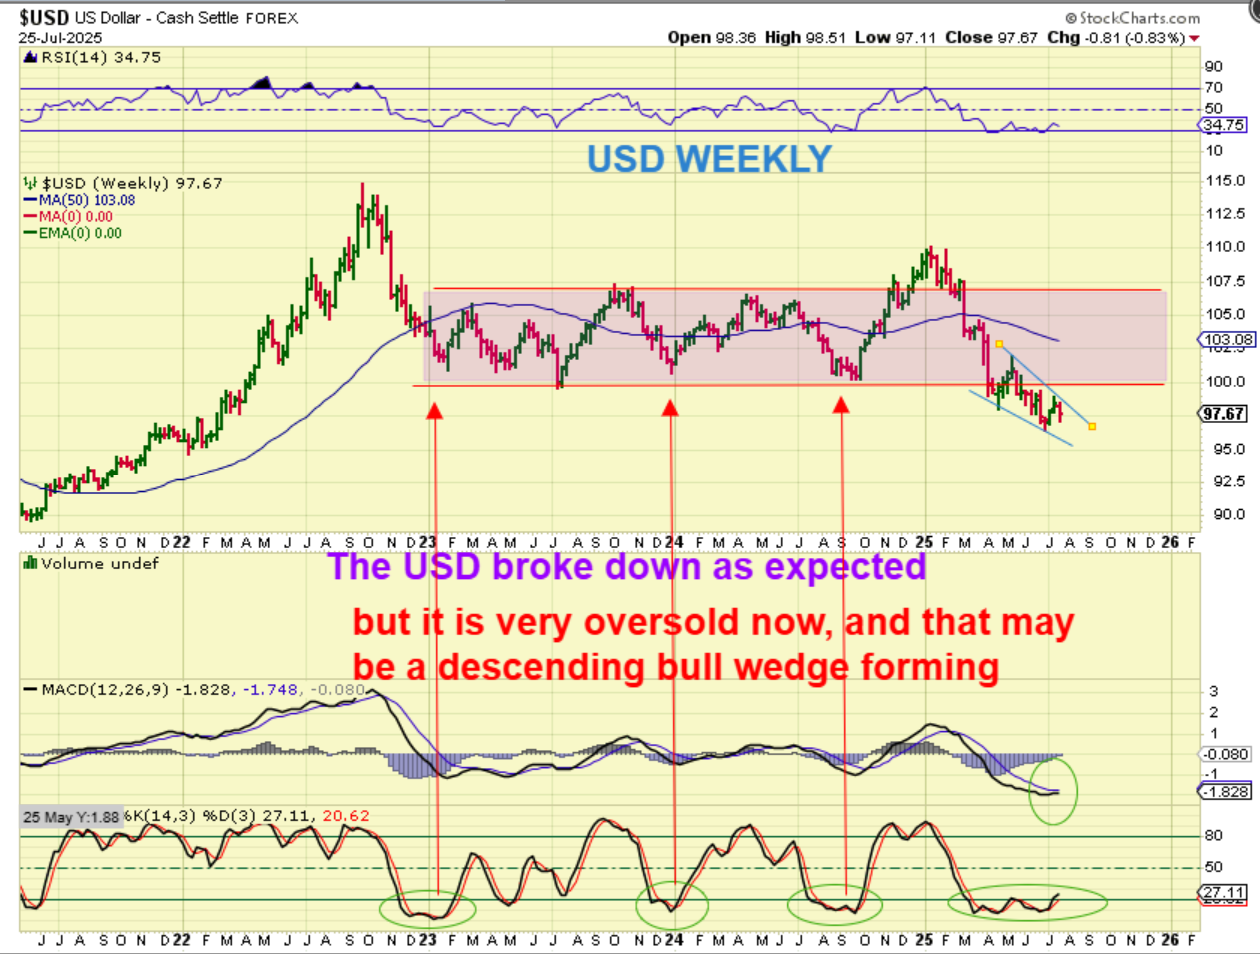
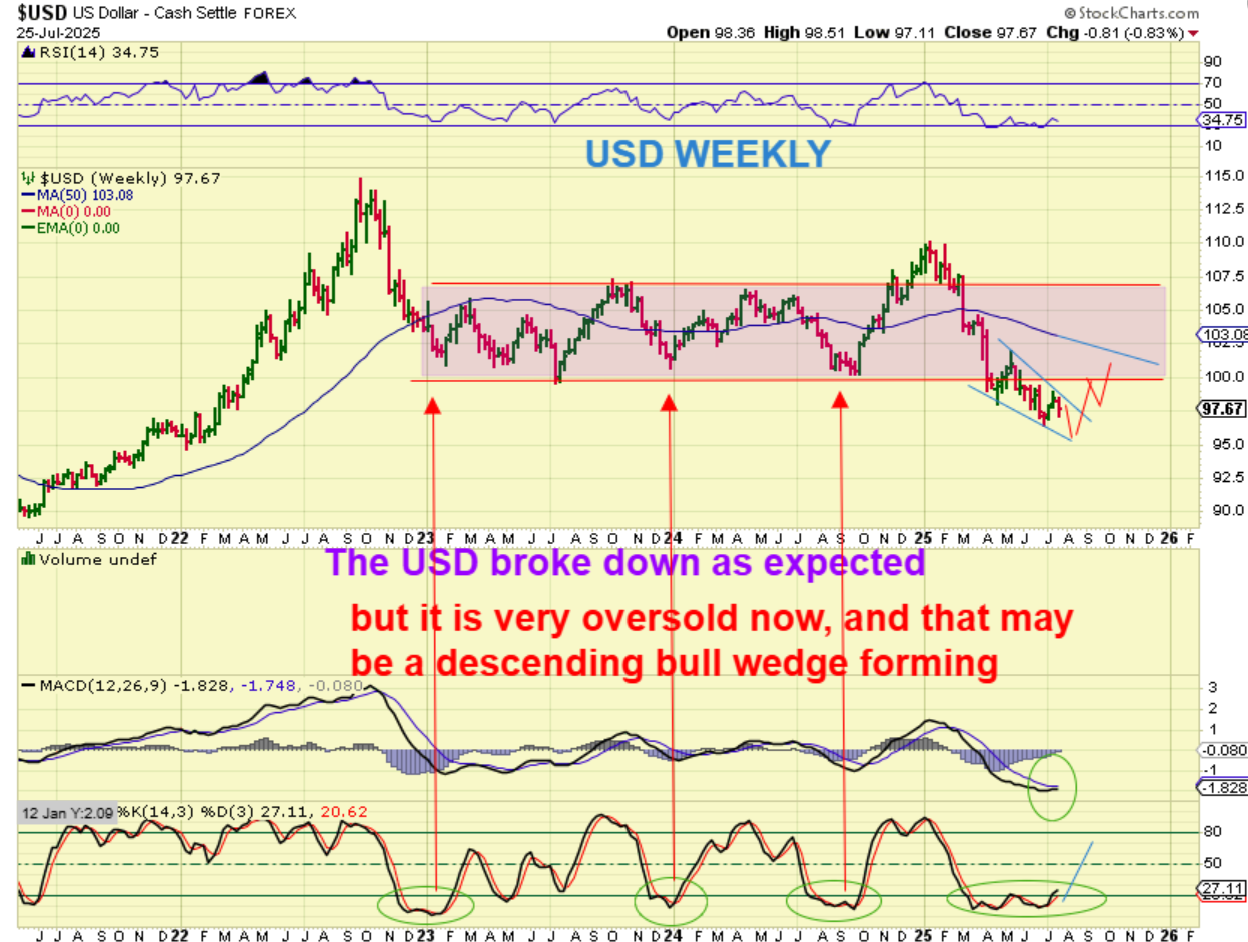
The USD is very oversold on a weekly chart, and that looks like a bullish descending wedge. Price dropped last week though, and since this is a WEEKLY chart, it could drop to the lower blue line for another week or so (possibly helping Gold). Then I think that a stronger multi-week bounce will come. Please examine the charts’ red arrows and stochastics.
.
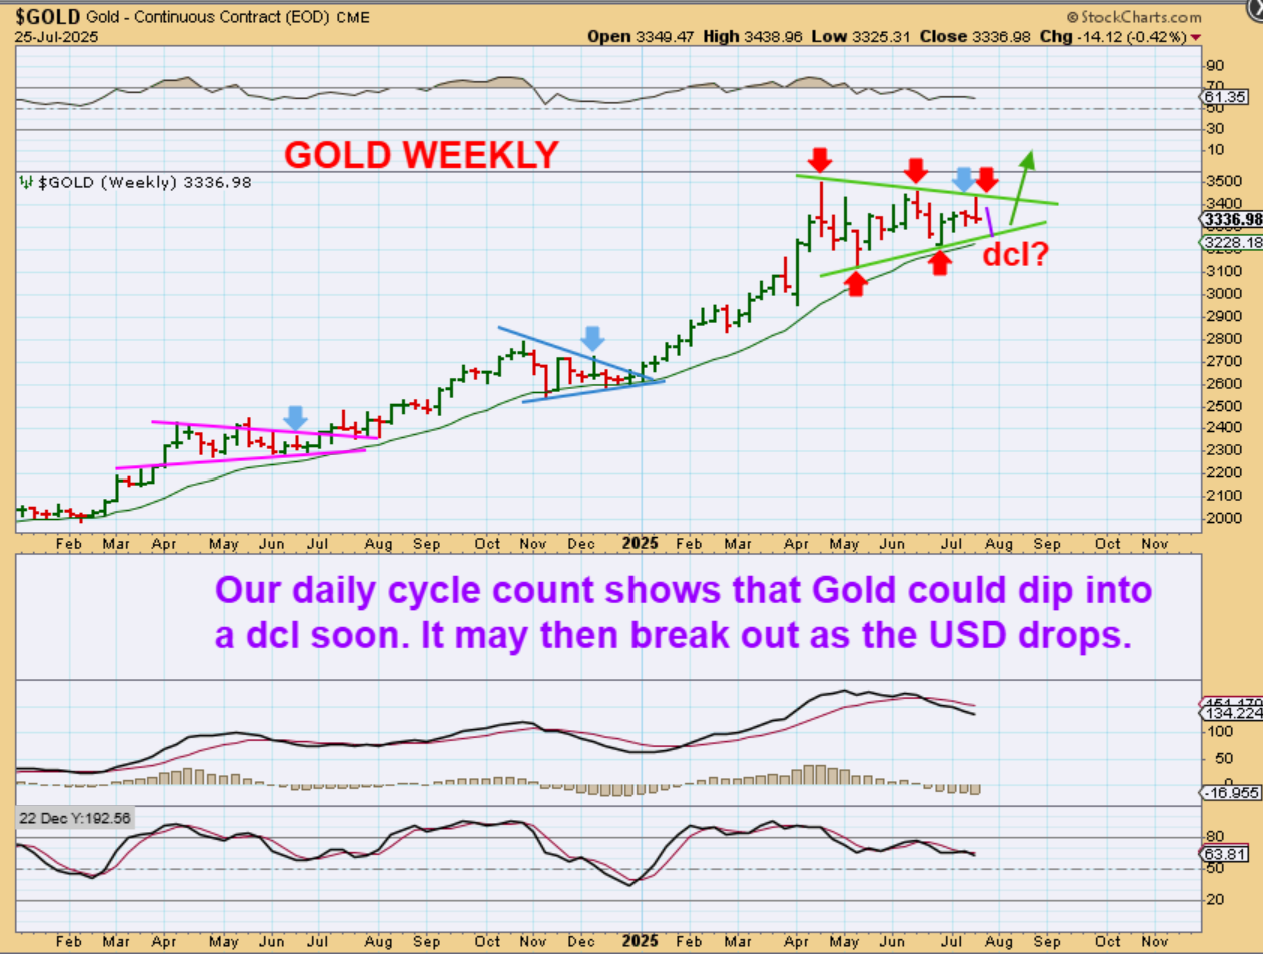
The USD: So a drop like this might send Gold to a new all-time high, but then the bounce would dip Gold into the next ICL. Note: If the USD just breaks higher from here, it is likely that Gold & Silver have ‘peaked’ for this intermediate cycle and Gold could begin to chop & drop over time.
.
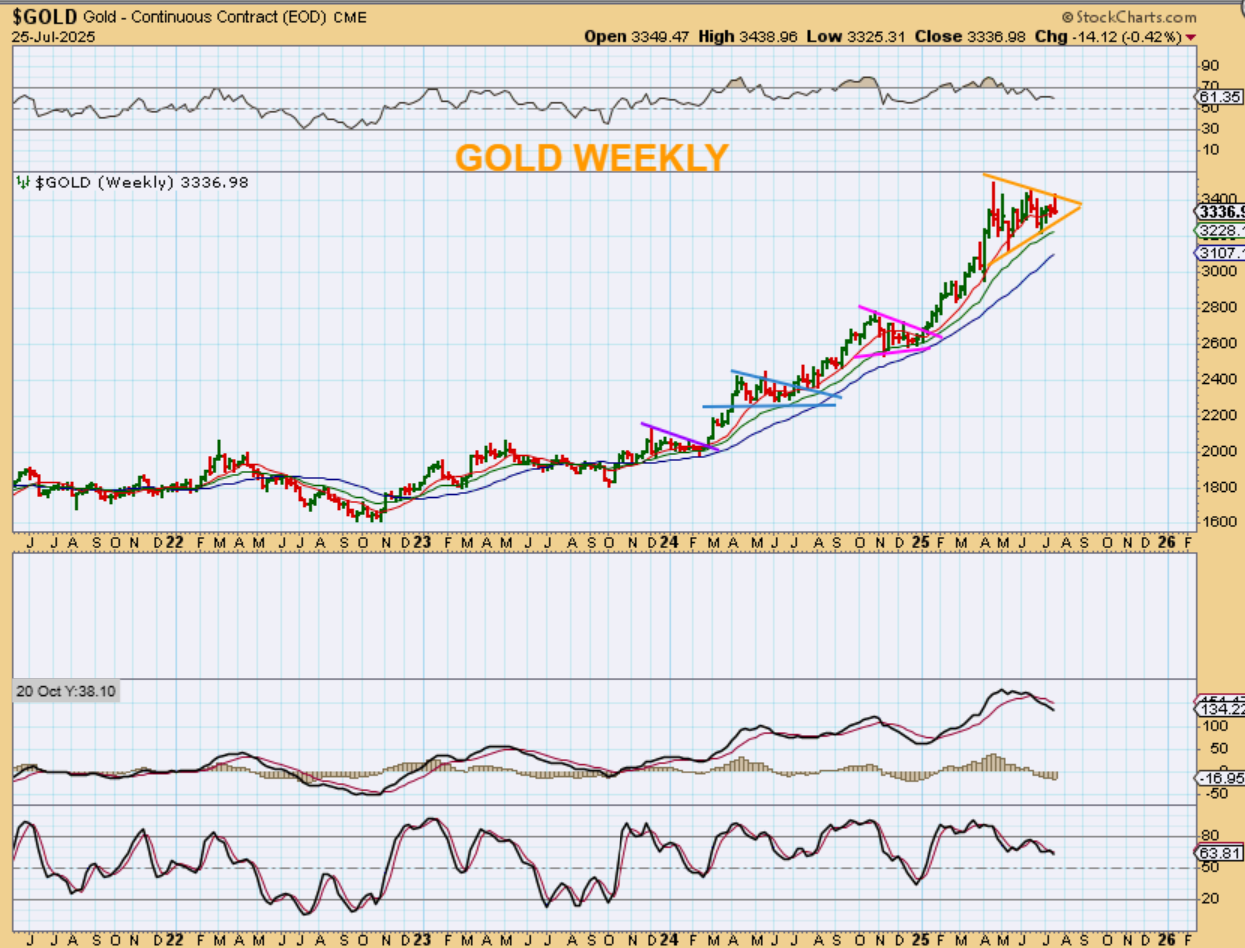
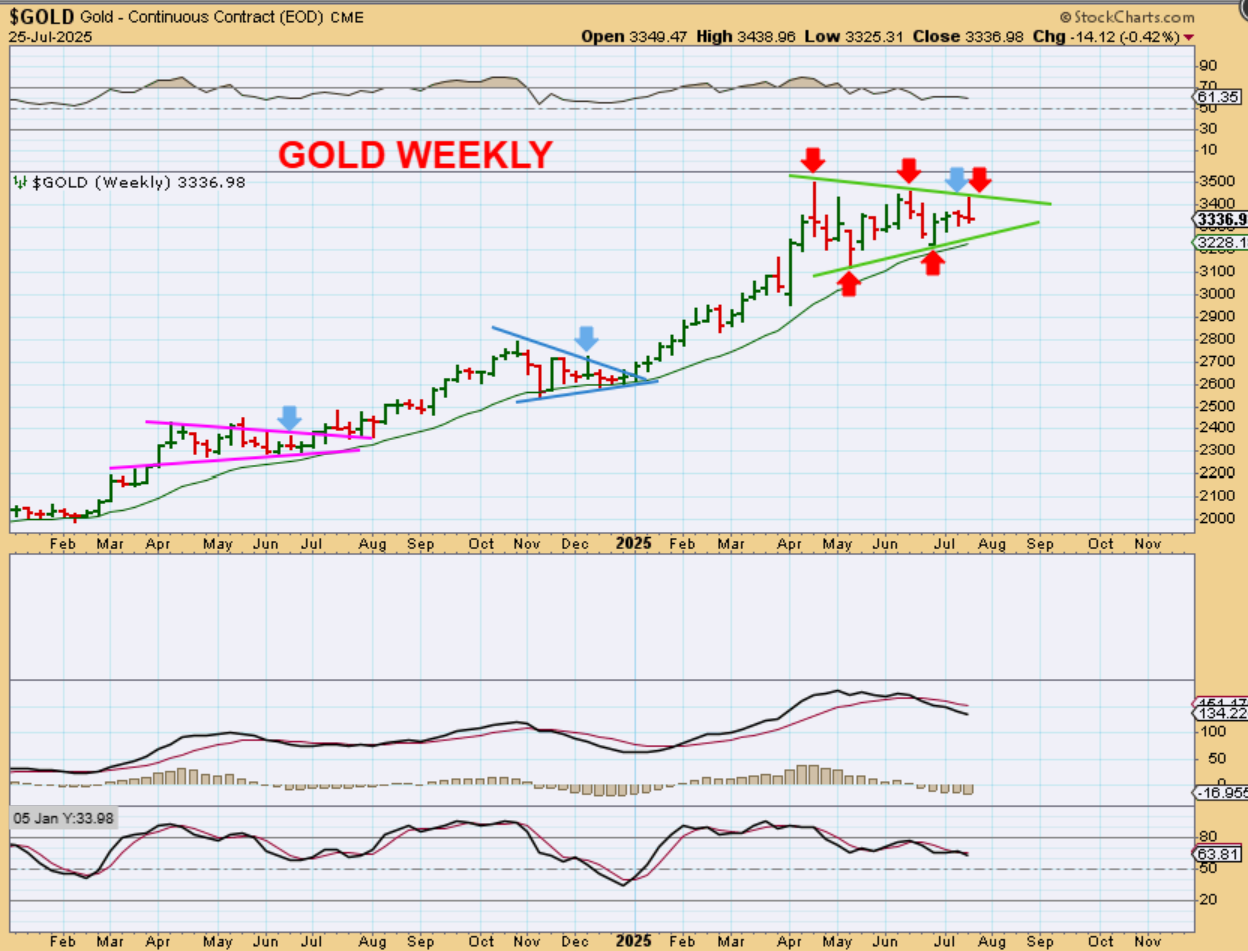
GOLD WEEKLY: The big picture shows that each rally formed pennants or triangular consolidations, and then the rally continues. Let’s zoom in…
.
GOLD is in a large consolidation at this point and was rejected at the highs again this week. Gold is coming due for a dcl on the daily timeframe and in the past when we had one of these candles at the highs (see blue arrows), we dipped and the consolidation continued a bit longer. So…
.
GOLD: So Gold could dip into a dcl and then push higher.
.
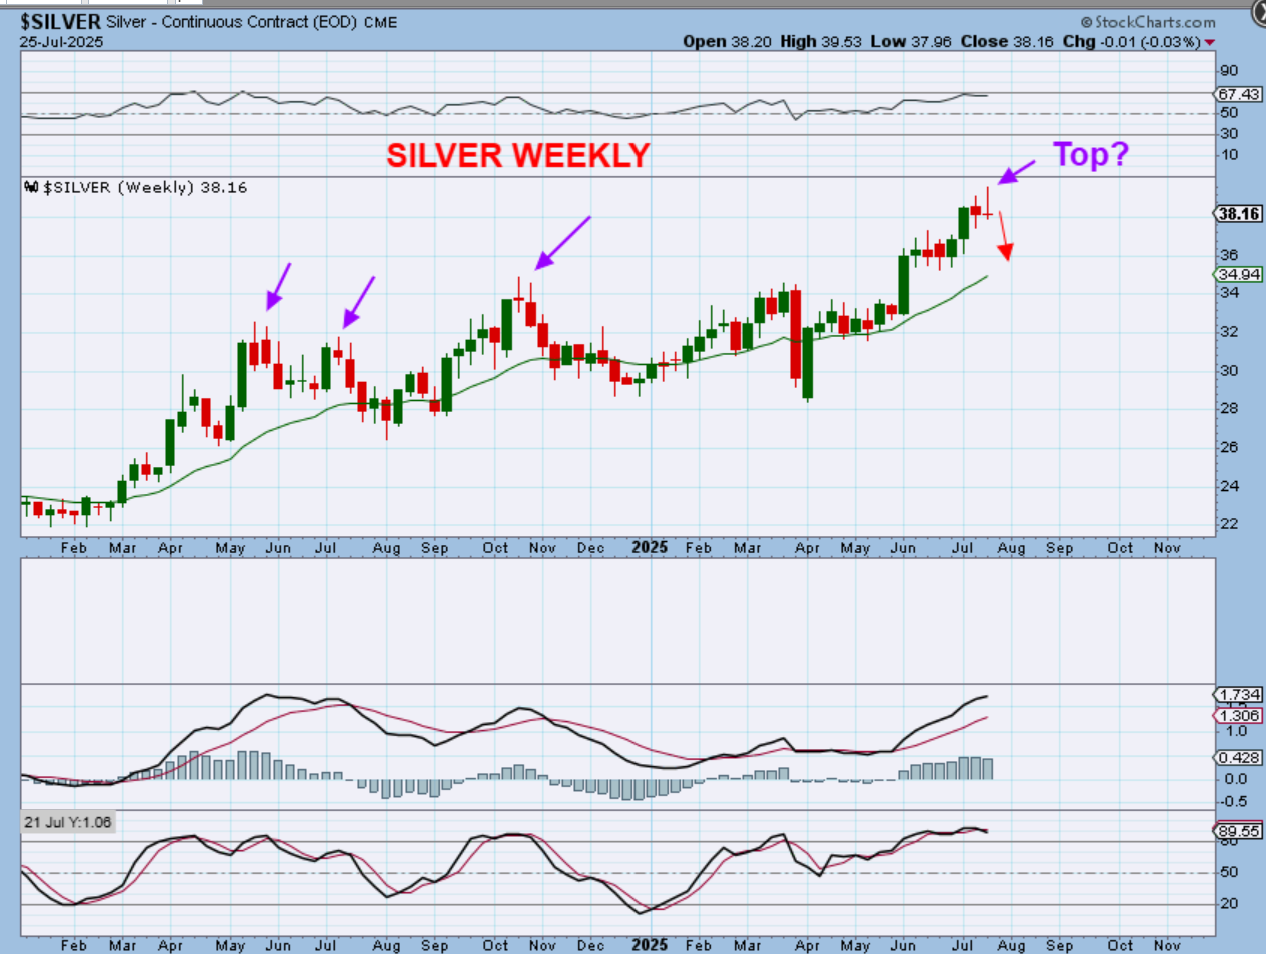
THE SILVER WEEKLY CHART has a weekly topping candle too. These are not ALWAYS followed by a drop, but often that kind of a Pop and Drop shows more selling than buyers, plus Silver also is coming due for a dip into a dcl.
.
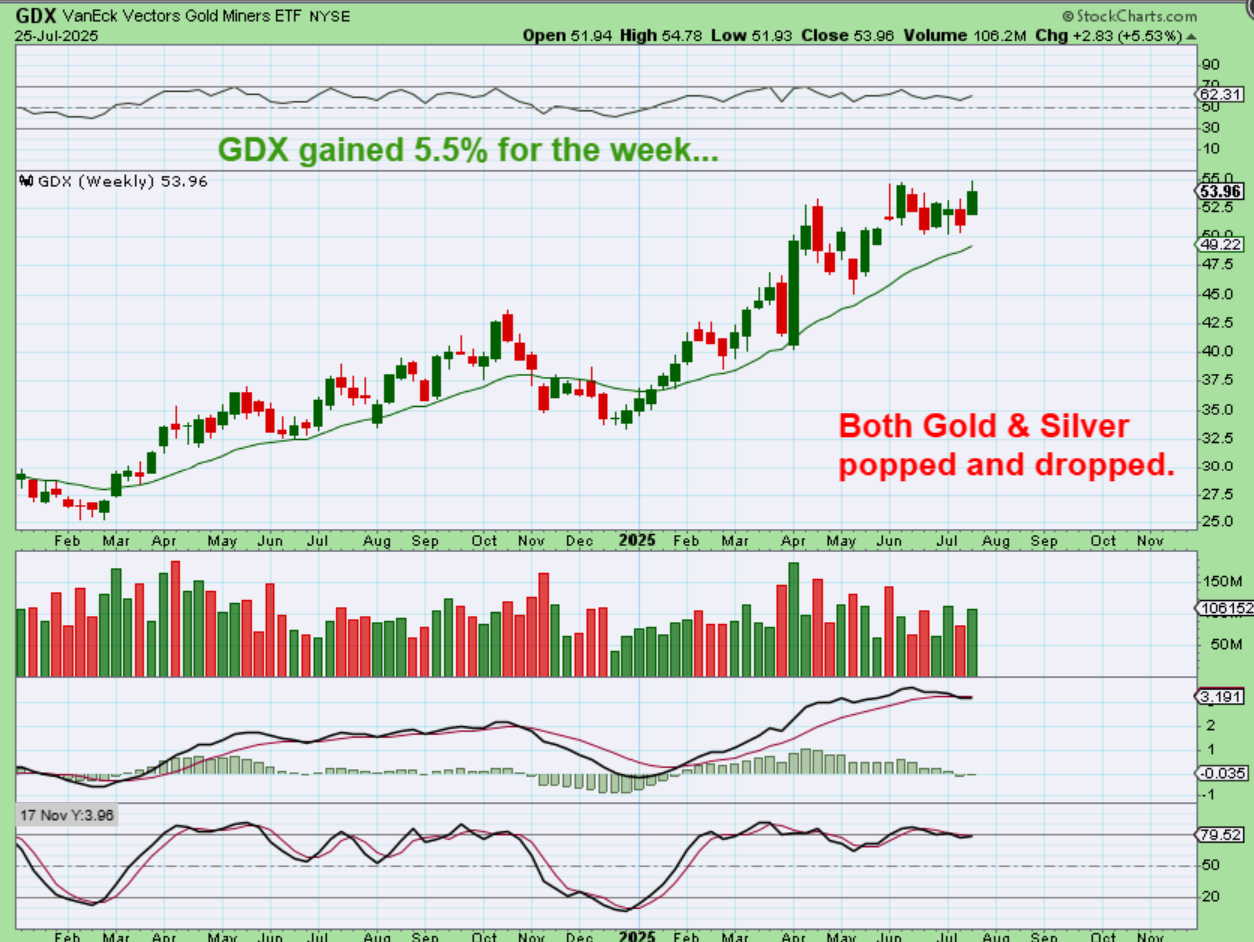
Interestingly, Miners did not Pop and Drop like Gold & Silver…
.
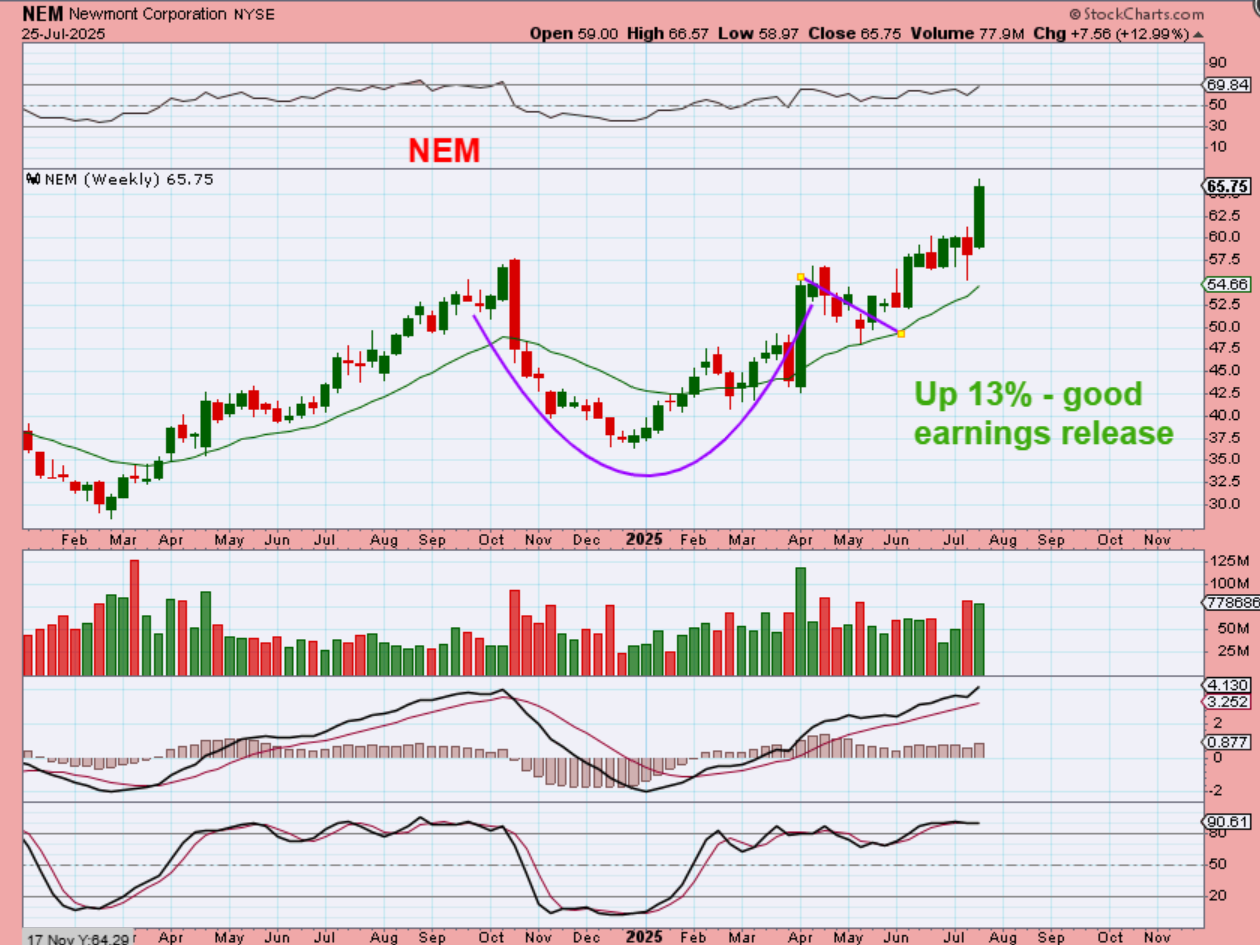
GDX WEEKLY: GDX was up 5.53% for the week. Nem released earnings on Friday and that no doubt helped GDX, but GDX was already up 6% for the week as of Wednesday. The Miners are still finding buyers and some charts like AU, AEM, KGC, EGO, etc are actually very nice set ups.
.
NEM: NEM popped over 6% on Friday with earnings and was up 13% for the week, THAT is great! That said, I just want to include this Note: KGC, EGO, AEM, AU, NGD and a few others have earnings next week, and THAT could influence this sector one way or the other too.
.
Once again, the Bulls remain firmly in control!
Enjoy your weekend and as always, thanks for being here!
.
~ALEX
.
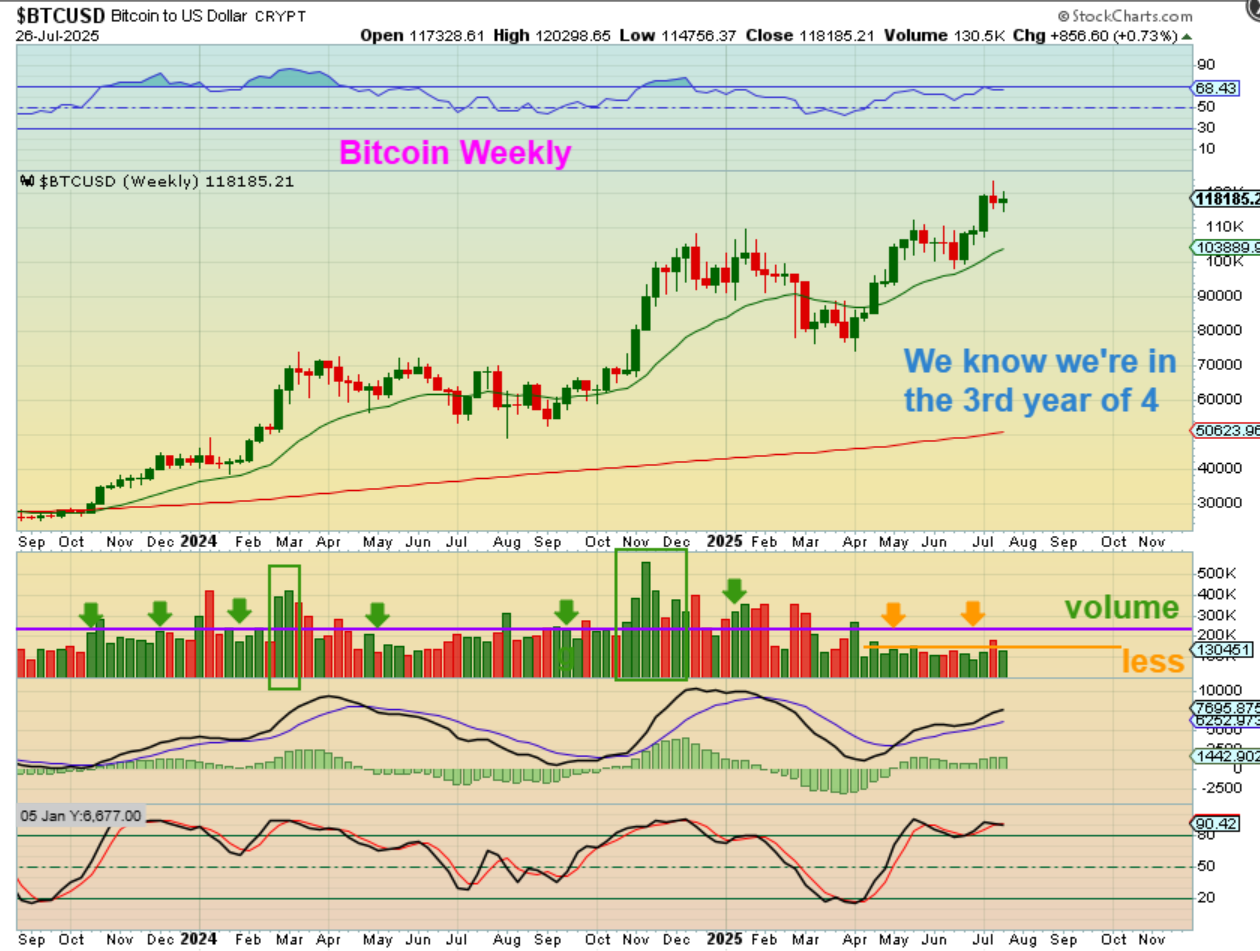
BITCOIN WEEKLY – The weekly Bitcoin chart remains bullish, and we could be seeing a small consolidation before a continuation higher, but this really doesn’t give us a lot of clues as to Bitcoins future direction or timing. The daily chart is more helpful in those areas, so I’ll repeat the daily cycle count part of the report that I posted in Fridays report. In conclusion: Bitcoin is a bullish chart, but in a 4 year cycle, it usually tops in year 3 and we are in year 3. One more rally higher is possible.
.
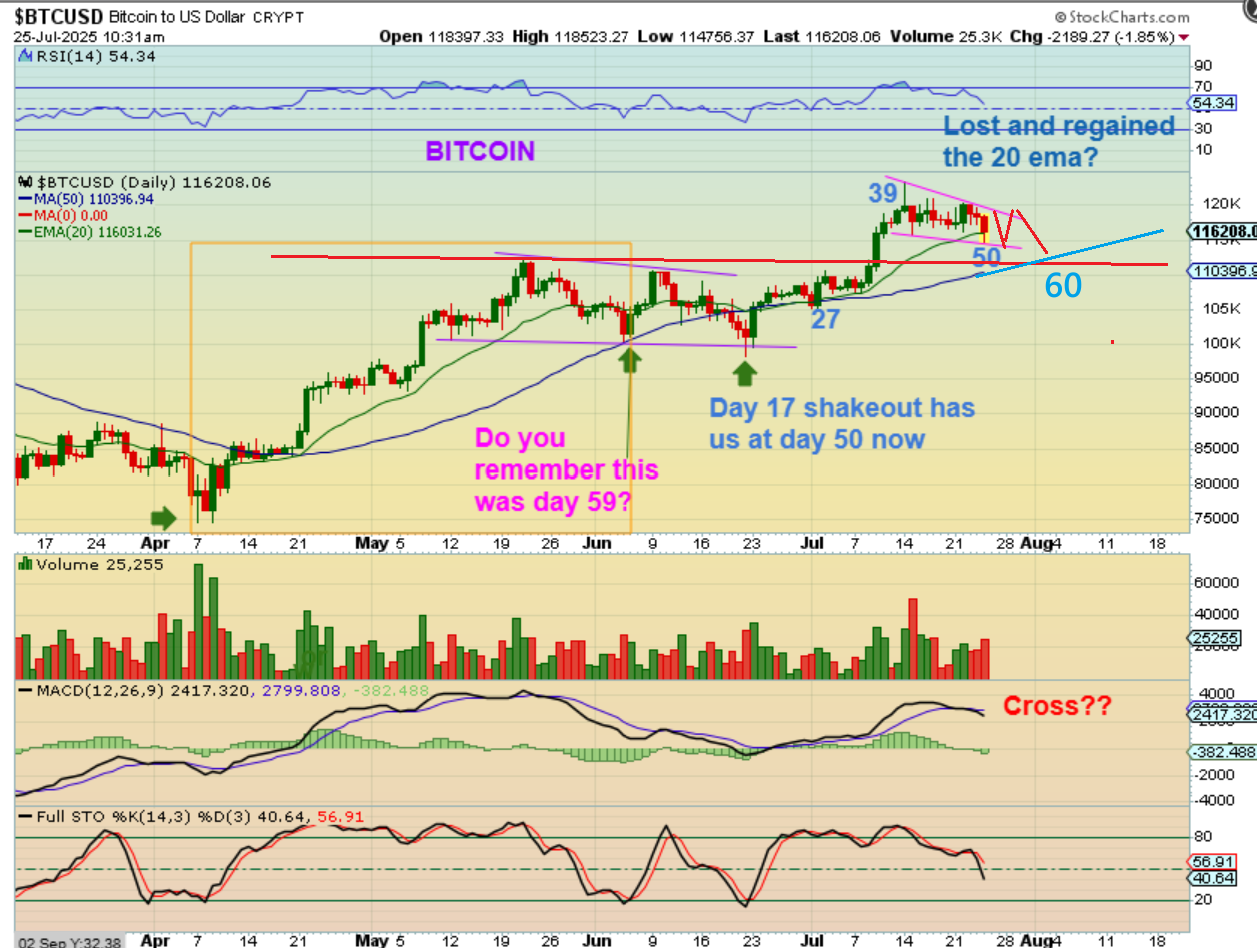
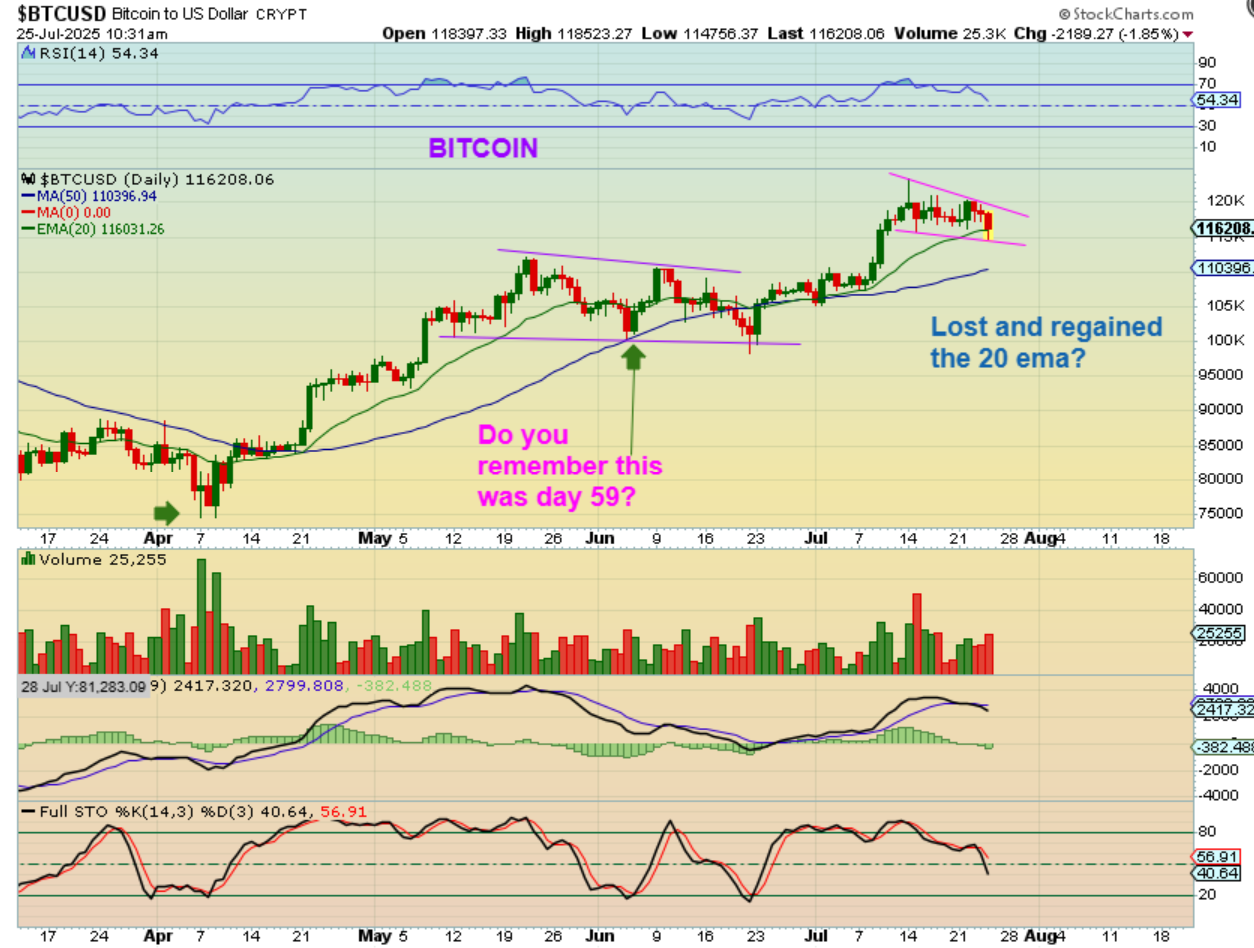
From Fridays daily report: BITCOIN dropped Thursday night and broke the 20 ema. I was expecting a breakout higher from this pattern, and that CAN still happen, but let’s discuss the cycles…
.
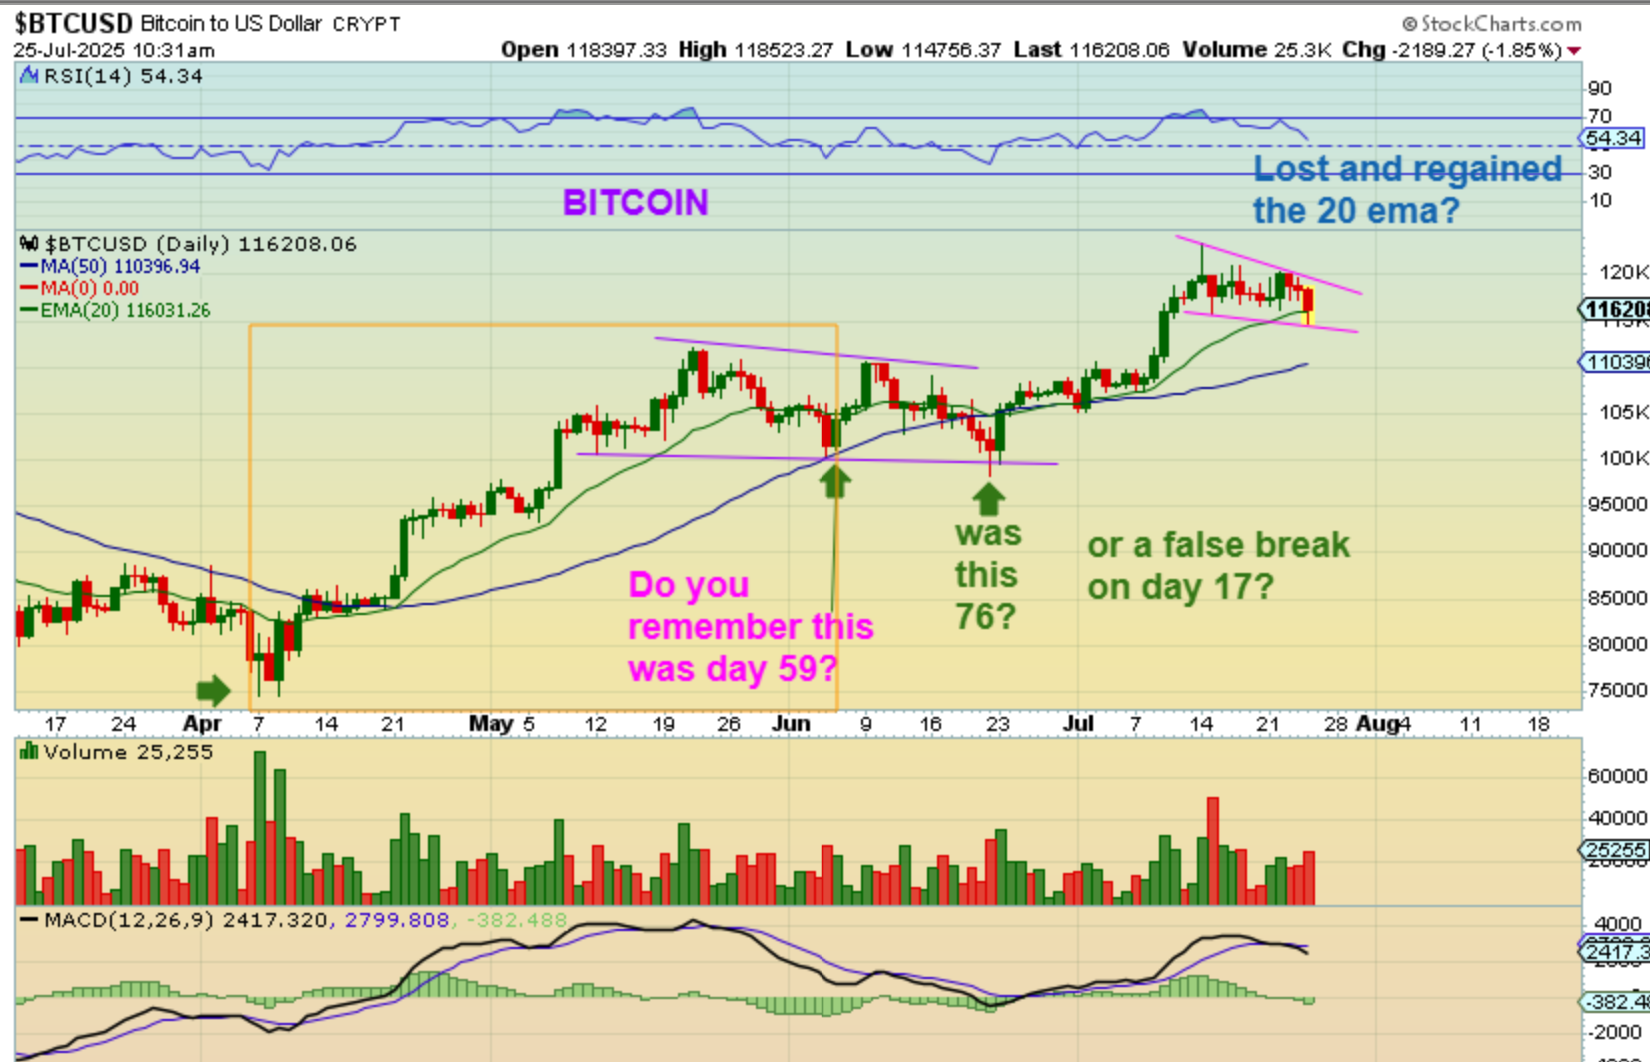
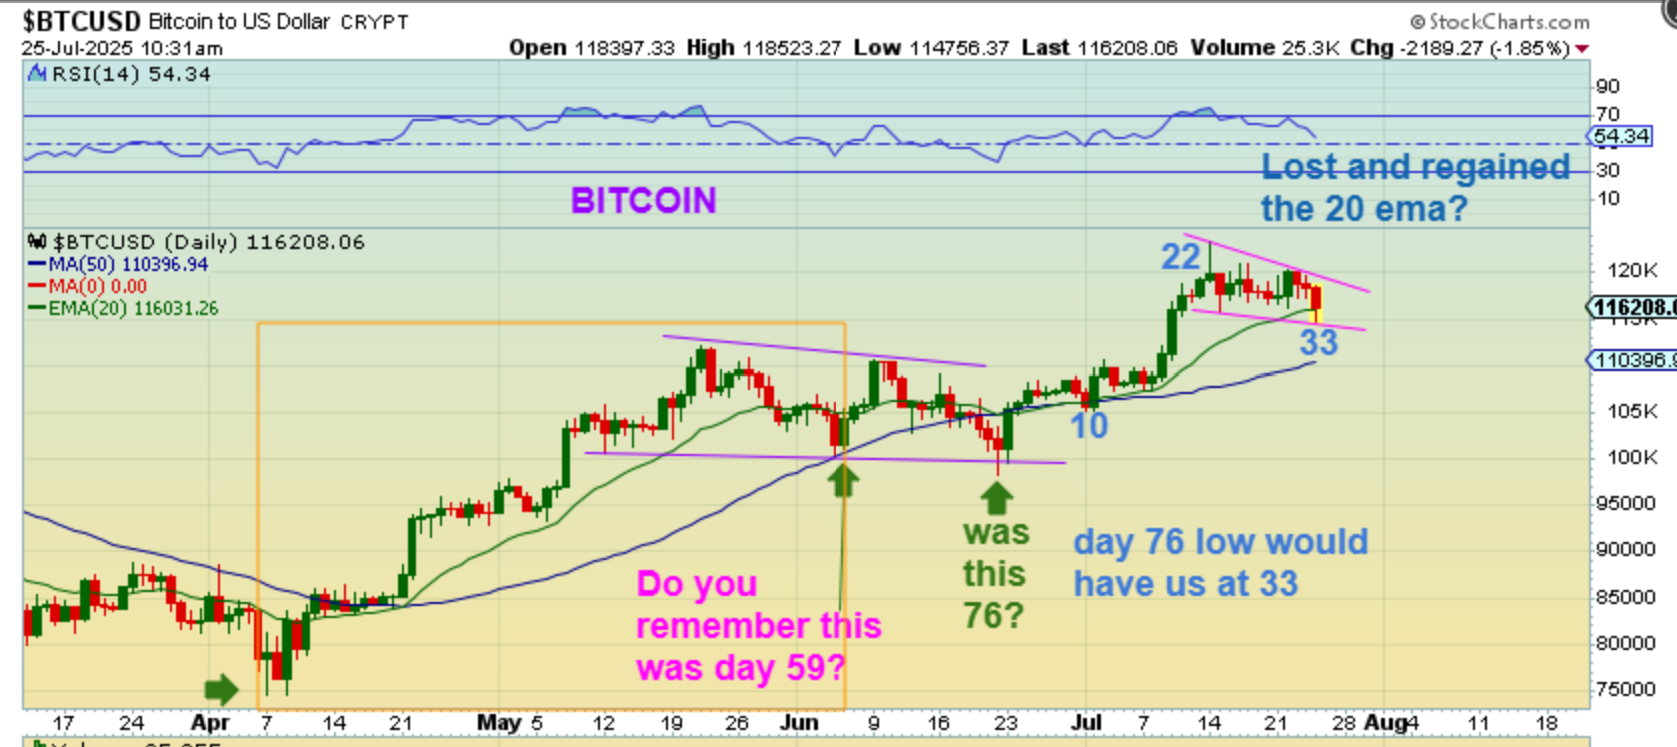
1. There has been something on my mind this entire time pertaining to cycle count and now is the time to address it. Many of you may have been wondering the same thing. “Where are we cycle-wise?” Do you remember our perfect day 59 low? See the chart. That was perfect for the 60 day cycle…
.
2. BITCOIN – I then discussed that June 23 breakdown and recover as ‘tricky’. Was it just a shakeout? Please read the chart now and then read the following 3 points. With that breakdown & recovery…
1. We have a new low at day 76?? Seems odd. See the chart, Or
2. We did a false breakdown on day 17 of a new daily cycle and we quickly recovered.
3.THIS AFFECTS OUR CYCLE TIMING PERTAINING TO WHERE ARE WE NOW? So…
.
BITCOIN – So if that was a day 76 DCL, then we would now only be on day 33, this would be a half cycle dip today. That would be bullish for a continuation higher.
.
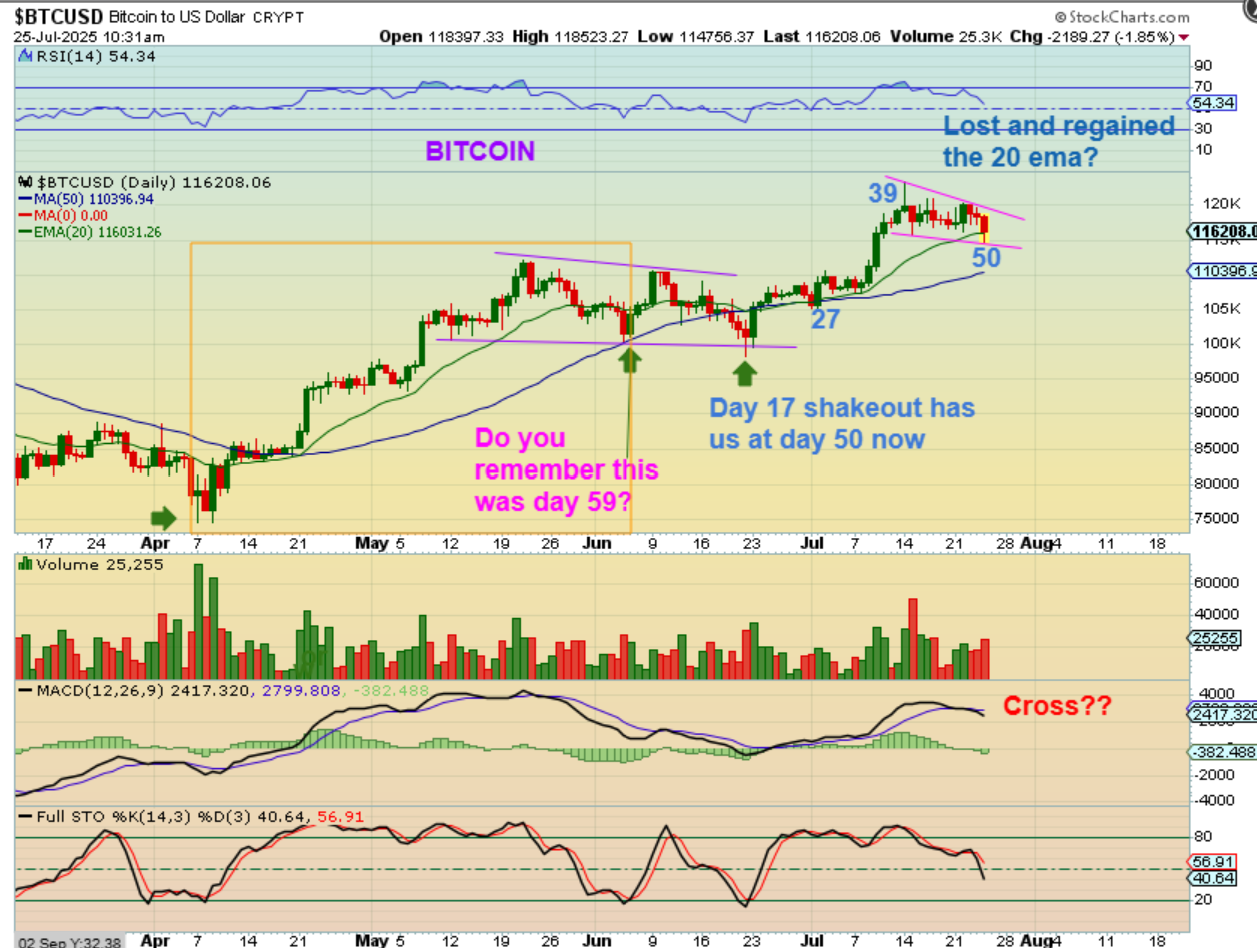
BITCOIN – However, if that day 17 was a shakeout and we just continue our count from the day 59 low, today is a dip on day 50. We could chop and dip again near day 60. We should know soon enough, but …
.
We should know soon enough, but neither is really bearish.
Will this sell off into a day 60 dcl over the weekend?
Or will this reverse here at the 20 ema and run higher over the weekend? I do not have the clear answer, but I will say this: The MACD is about to cross lower and the stochastics is midpoint and could drop to the stochastic 20 oversold mark, so this honestly can go either way right now based on cycle counts. The question is how much position size to hold (if any) over the weekend when faced with this current set up?
.
A dip into a day 60 dcl also may actually be the better outcome, since we would then be on an early count to make the run higher and maybe $140,000 – $150,000 could be reached. That dip may tag the 50sma at $110,000 and back test the consolidation breakout, so that isn’t really ugly. Only time will tell though, but STAY FROSTY going into the weekend.