July 19th Weekend Review – Bullish Scenery
This weekend report considers cycle timing as a timing guide, but also uses technical analysis, and observations based on chart patterns to gain further perspective. Enjoy!
.
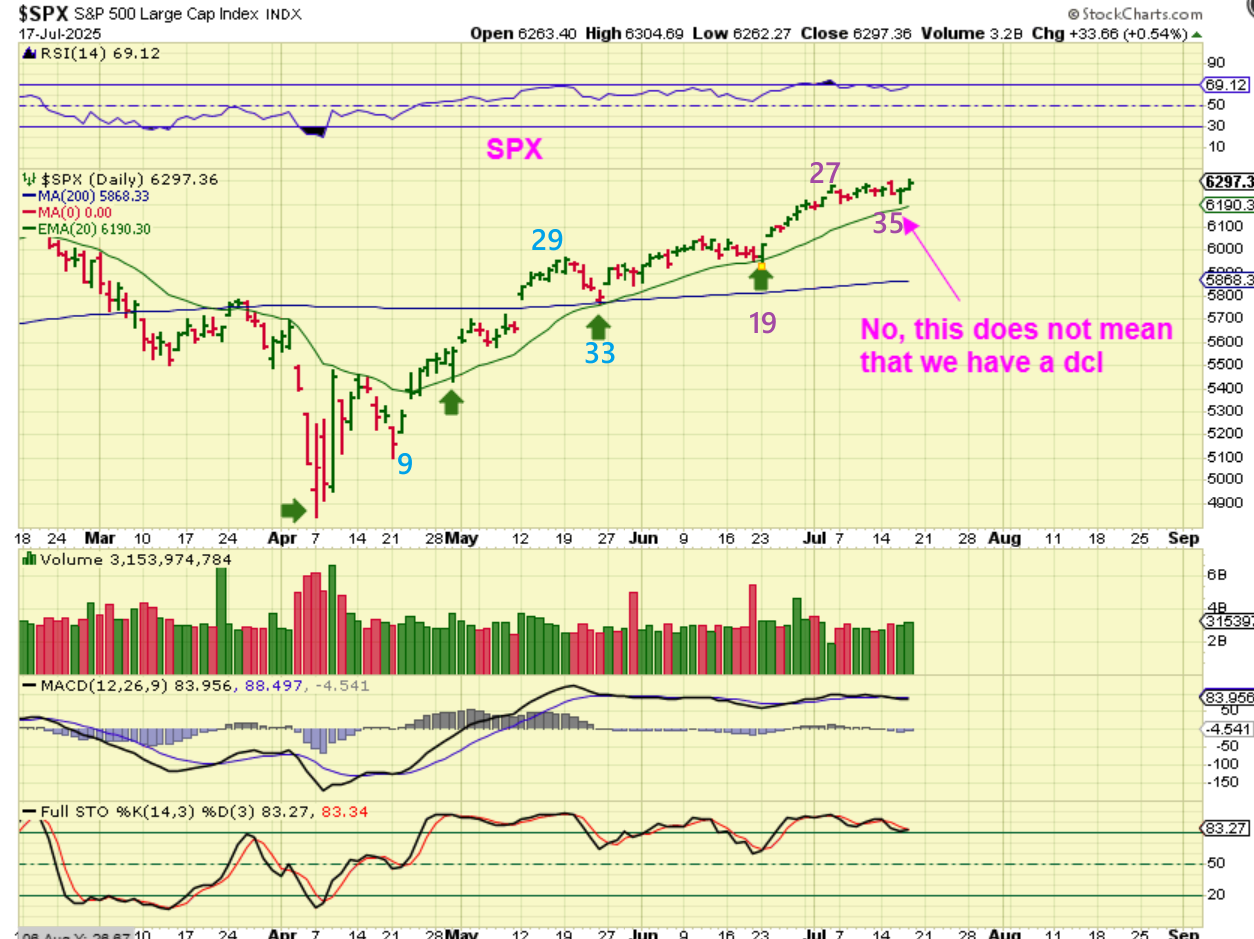
Is day 35 a dcl?
.
We know that the general markets are due for a dcl, but the recent dips (half cycle lows and dcl’s) have all been mild and bought up at the 20ema. See the green arrows please. Even though the last dcl was at day 33, that timing is used as a guide to look for the low, not a rule. I have also seen dcls at the 45+ area, so I said on Friday…
I have seen daily cycles that easily run 45+ days long too, so we may just rally and dip back to the 20 ema in a week or 2, to give us our next dcl. Let’s look at the weekly charts, I want to point something important out there…
.
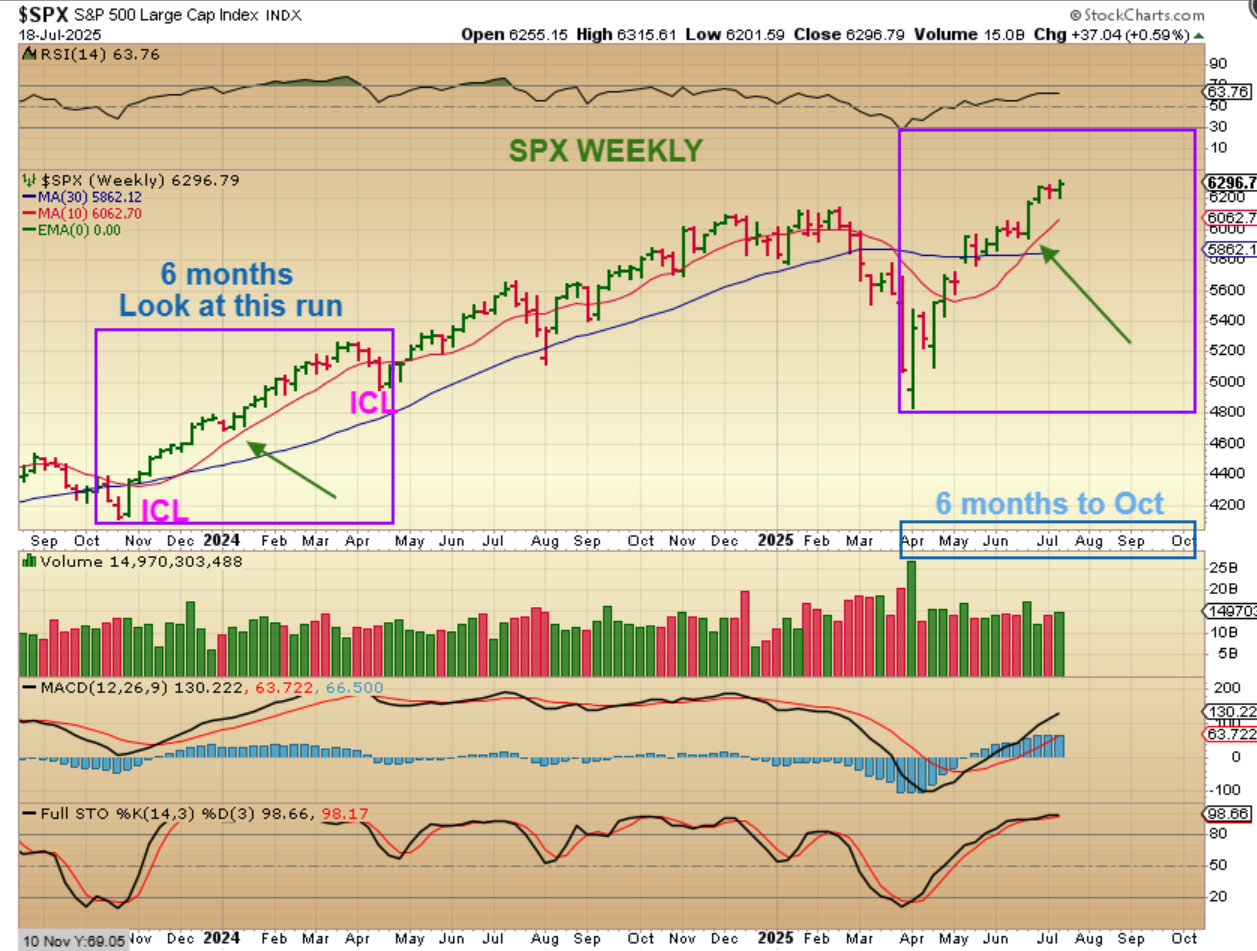
WEEKLY CHART REMINDER: Here I just want to repeat something that I said when we first formed an ICL in April. Back then I pointed to the COVID CRASH & V-Bottom recovery and mentioned how the markets can just stay really bullish out of those kinds of slam down lows. Those slam downs become exhaustion lows. Some here are ‘traders’ and others were told to ‘buy & hold’ & raising stops along the way. That turned out to be a great strategy, since many on my list of stock picks have doubled and tripled.
.
Along with that Covid crash, I want to point to another steady sell off into an ICL in 2023, and show the recovery there too, since it is similar to what we have now. Despite bad news, the selling exhausts and we climb a wall of worry. So…
.
I want us to look at The SPX rally from ICL to ICL in 2023-2024 (the first purple box). You do not see daily cycle lows, since they were mild and this is a weekly chart. The dips were quickly scooped up. I’m showing this now because that is somewhat similar to this rally out of the April ICL. In 2023-2024, the first run hardly dipped for 6 months, and if we repeat that now, we’d run from April to October with minimal dips along the way.
.
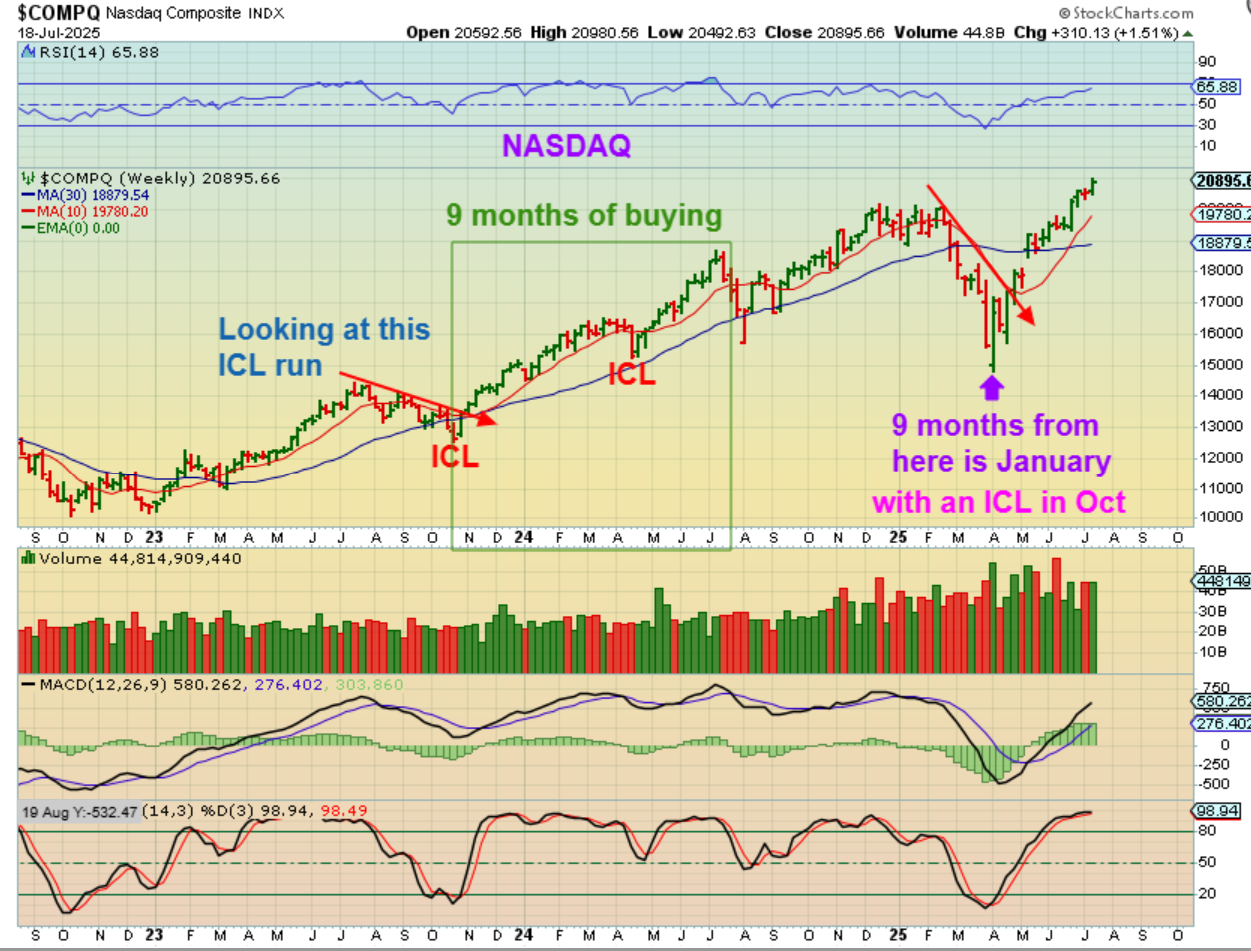
With that in mind, The NASDAQ shows us that it rallied ICL to ICL for 6 months and then added another 3 months of buying after that ICL, so we saw 9 months of gains with only 1 sharp deeper dip (ICL). 9 months from our April ICL would carry us to October(ish) ICL and then on into January. 2025 would begin with a crash and then rally into year end. So far the gains have been tremendous on individual stocks and others will play catch up, so THAT is why I wanted to bring this to your attention. This rally mode can continue higher..
.
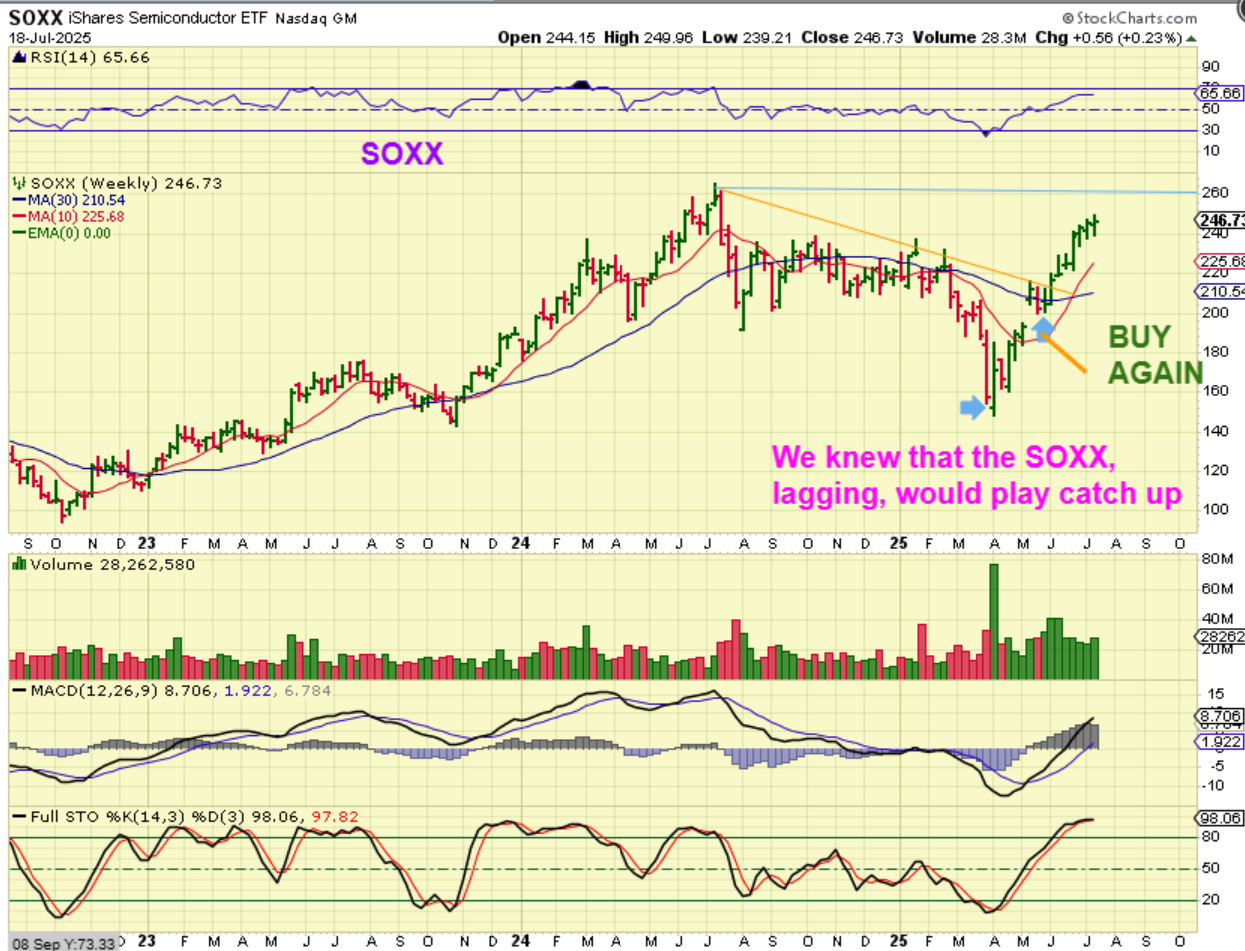
So far the gains have been tremendous on individual stocks like RKLB, NVDA, ENVX, PLTR, NFLX, AAOI, SMR, OKLO, RGTI, GRPN, QBTS, GOOG, etc etc, and others look like they will play catch up (AI, SOUN, SERV, RR, TSEM, AAPL? and more), so THAT is why I wanted to bring this to your attention. It looks like more gains are ahead and laggers may start to run better.
.
I had pointed out that The SOXX was lagging a while back, so we had a couple of buy opportunities then and now we see 8 straight weeks of gains. Stocks like AMD, MU, SOXL, etc made some nice gains too.
.
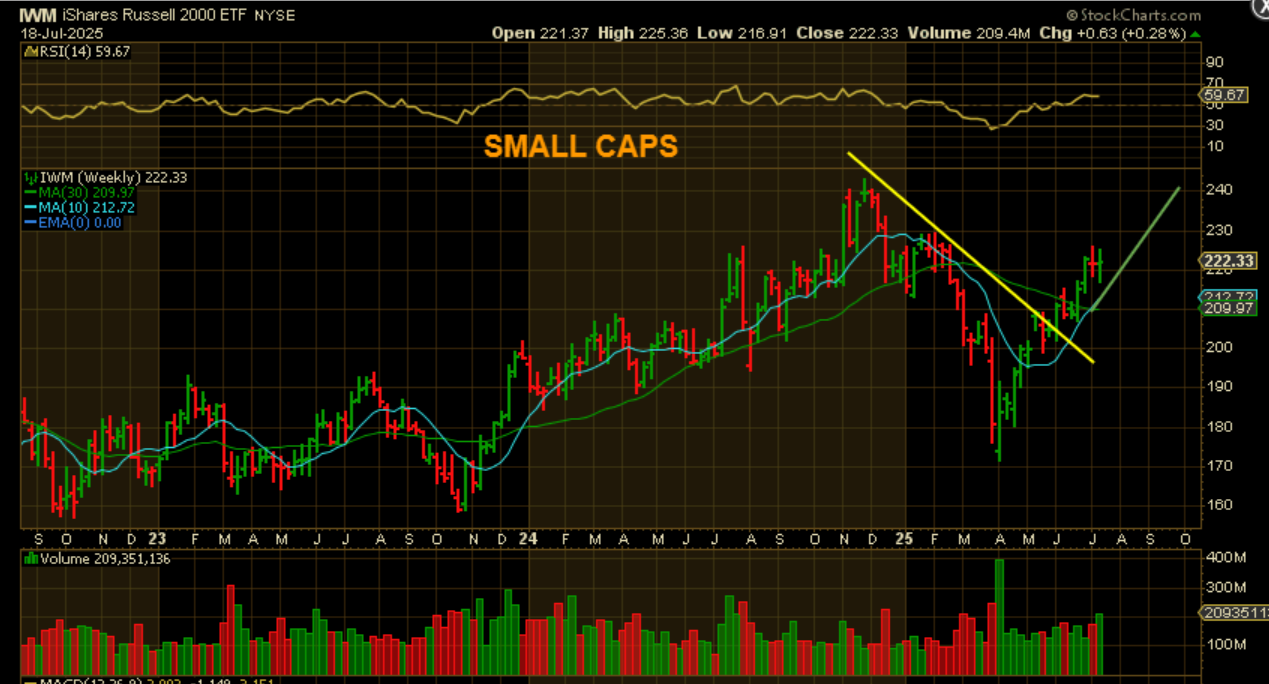
And now we see the Russell 2000 (IWM WEEKLY) also running, but it has been a bit choppier week to week recently. Hopefully that changes, since those 1 week drops were a bit difficult.
.
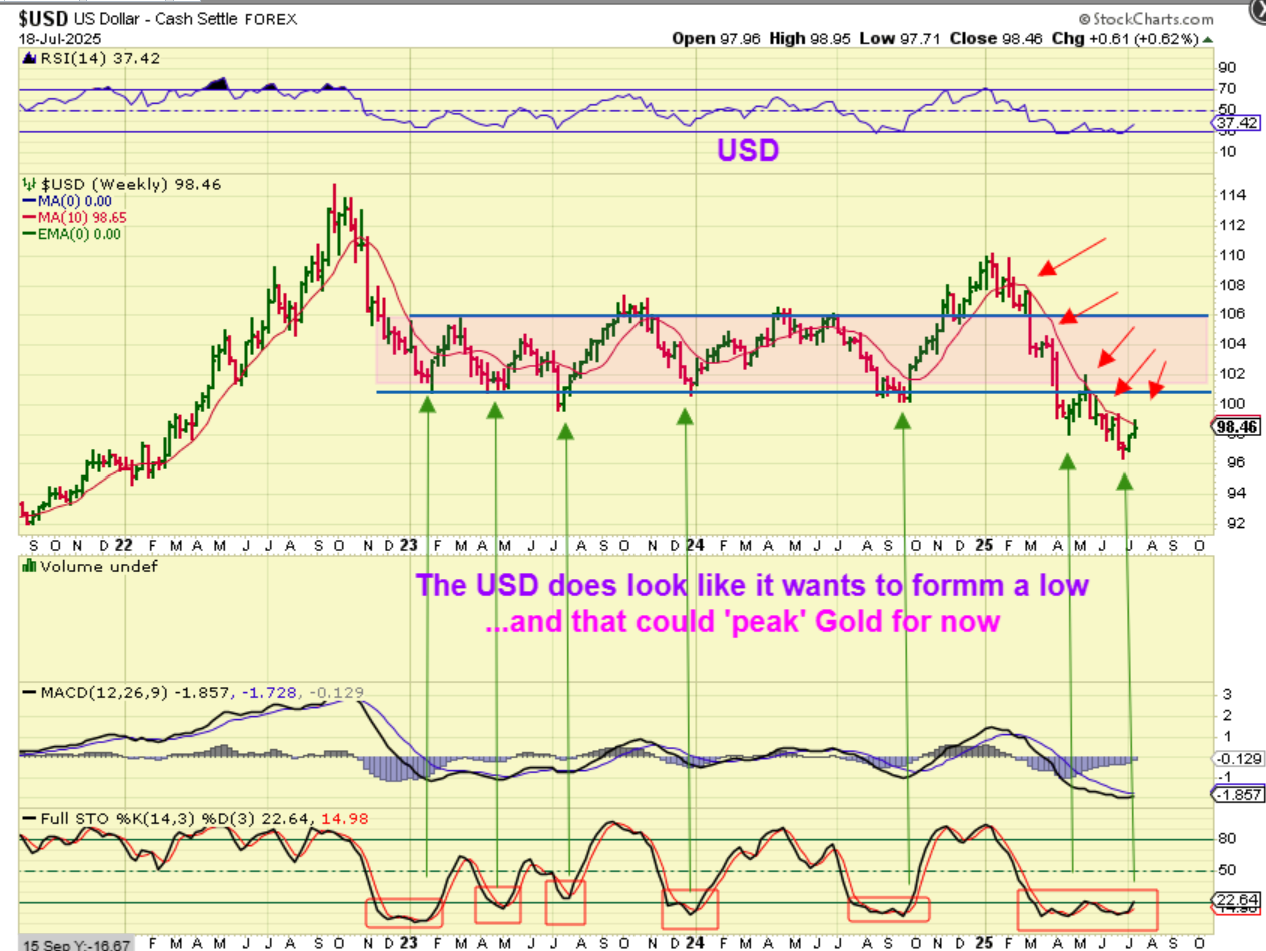
Now to the Weekly USD –
I called an ICL in April here too, with that very large slam down. It has bounced to the 10 week ma and been rejected ever since. That said, the recent low is very oversold and it looks like we MIGHT have another short-term bottom of sorts? Resistance is still holding price back at the red 10 week ma, but it is very oversold, so it is worth keeping an eye on. It is possible that a bounce here to back test the former support line could affect Gold going forward.
.
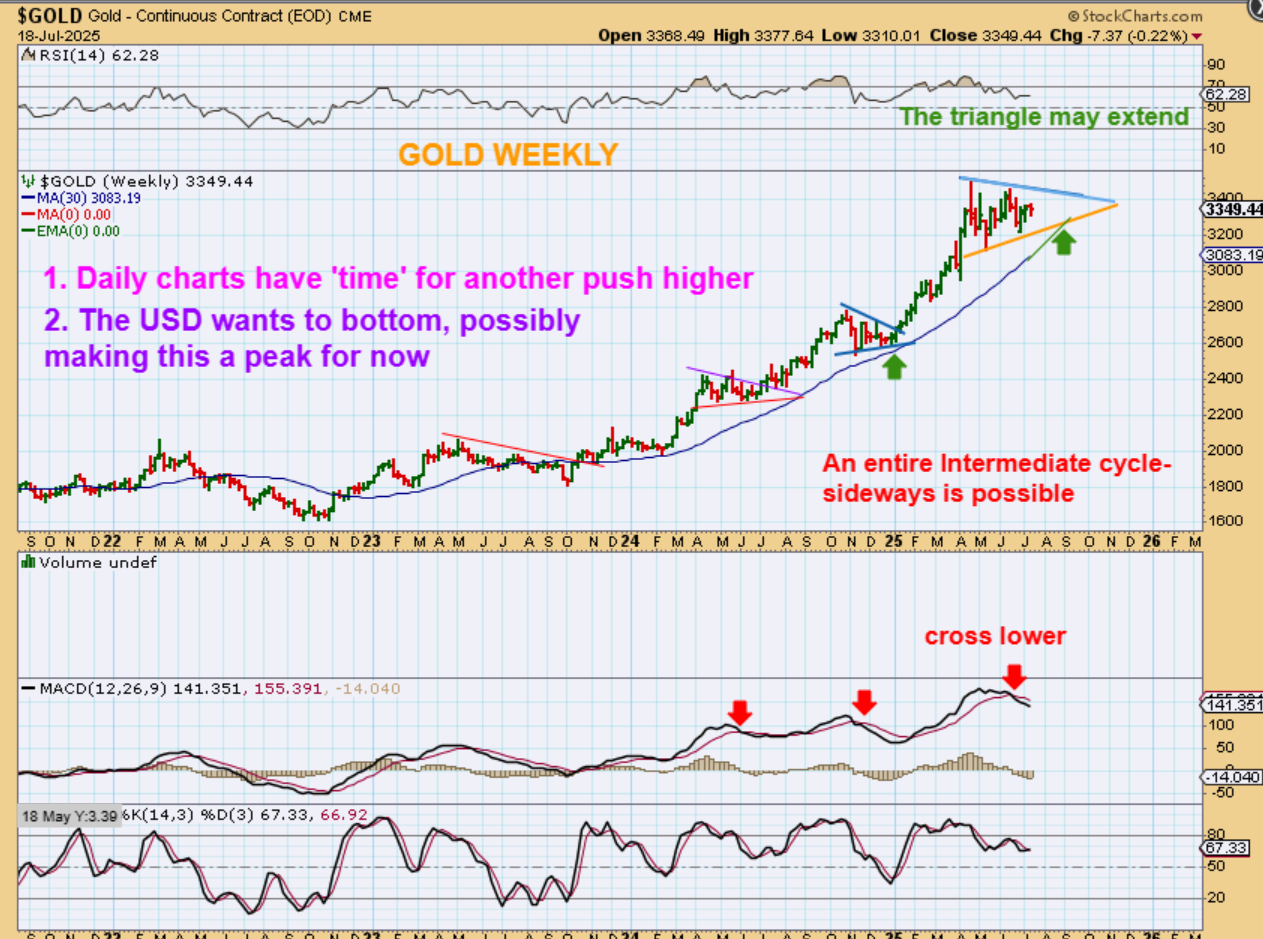
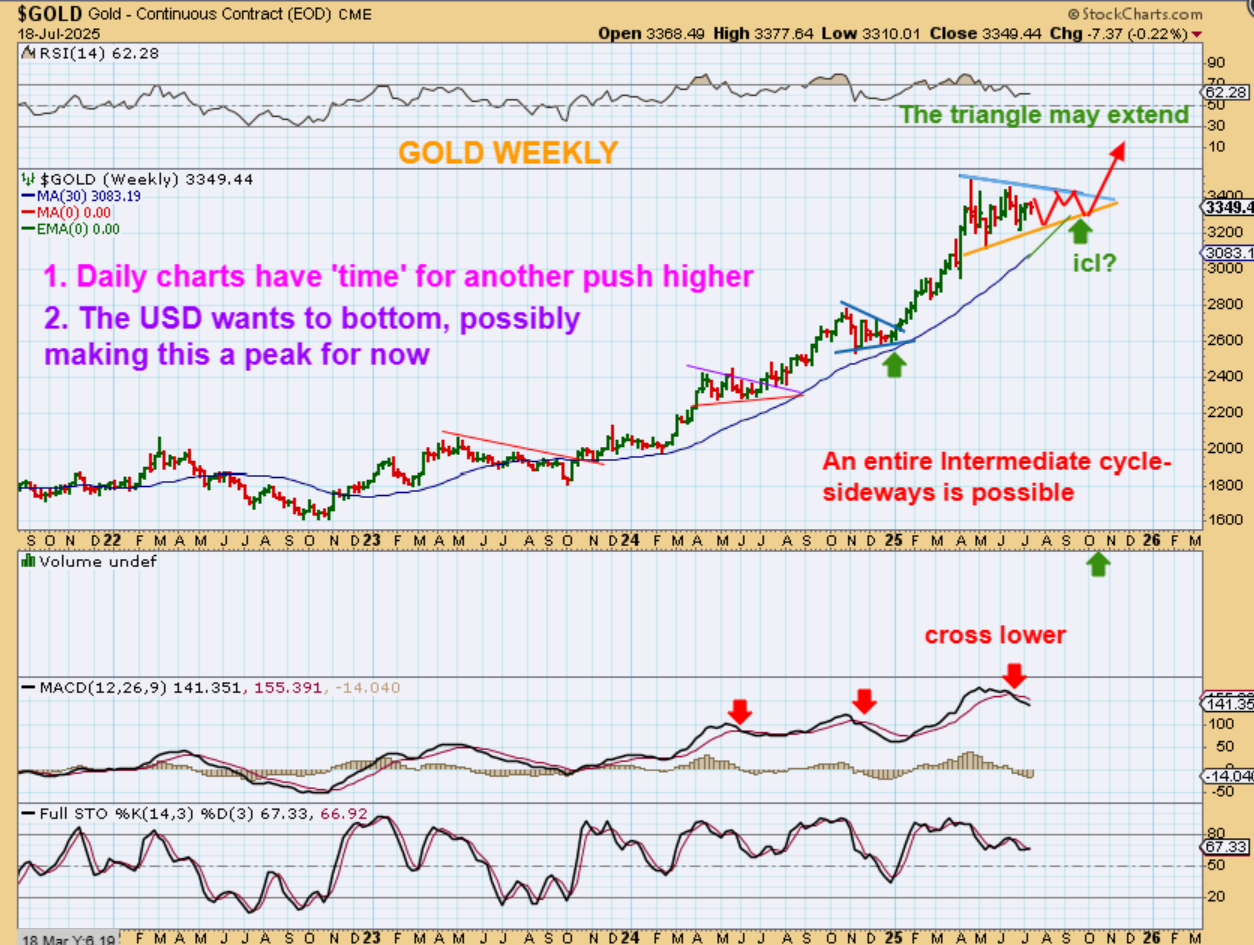
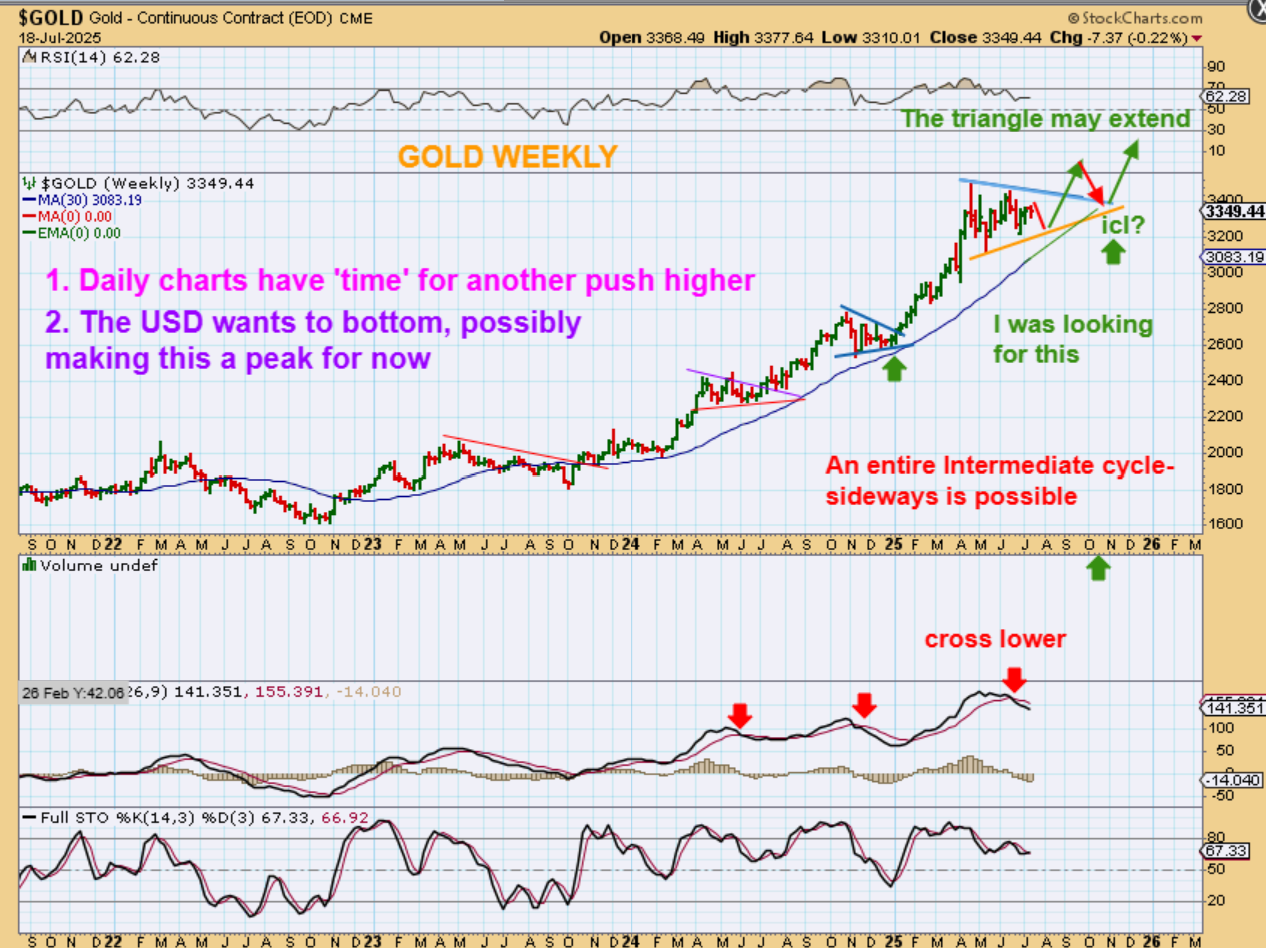
With the Gold Weekly Chart: I had called for some choppy sideways price action a several weeks ago as it double topped, and that is what we have seen. If the USD bottomed and bounces for a few weeks, that may continue. Please read the chart.
.
I am thinking that even though we would love to see Gold rally up to new all-time highs again right now, time is starting to run out.
This chart is also saying that Gold may continue to consolidate. By chopping sideways even longer, the frothy Bullish sentiment dies down, investors get frustrated, and this triangle can continue to develop as it extends price over to the blue 30 week ma. Normal bull price action.
.
This is actually what I was originally thinking that we could see, with a weak dollar after it broke down below support. I expected a possible breakout and back test at the next ICL. I guess that this COULD still happen if Gold takes off higher soon but this will become less likely as ‘time’ moves on in this current daily cycle.
.
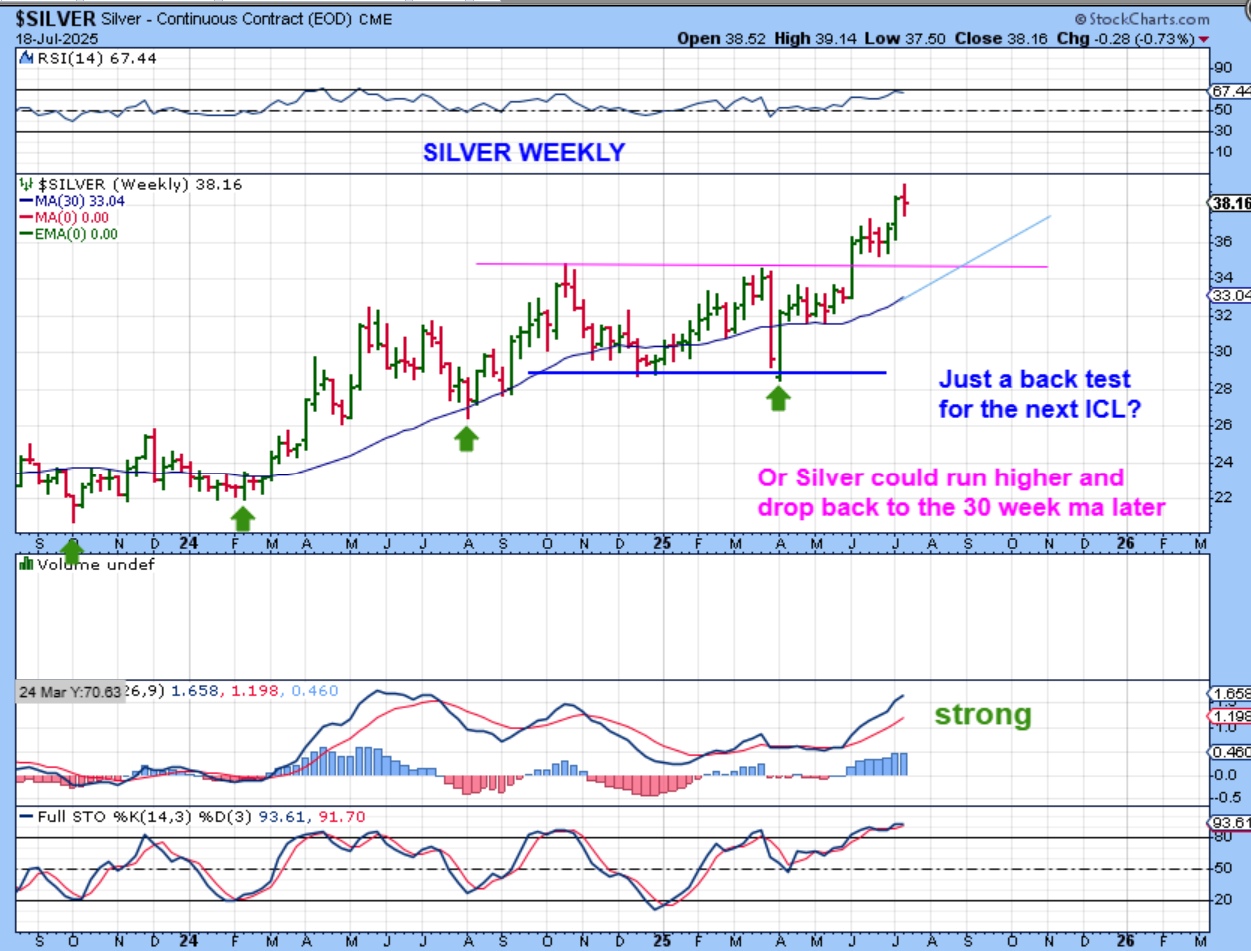
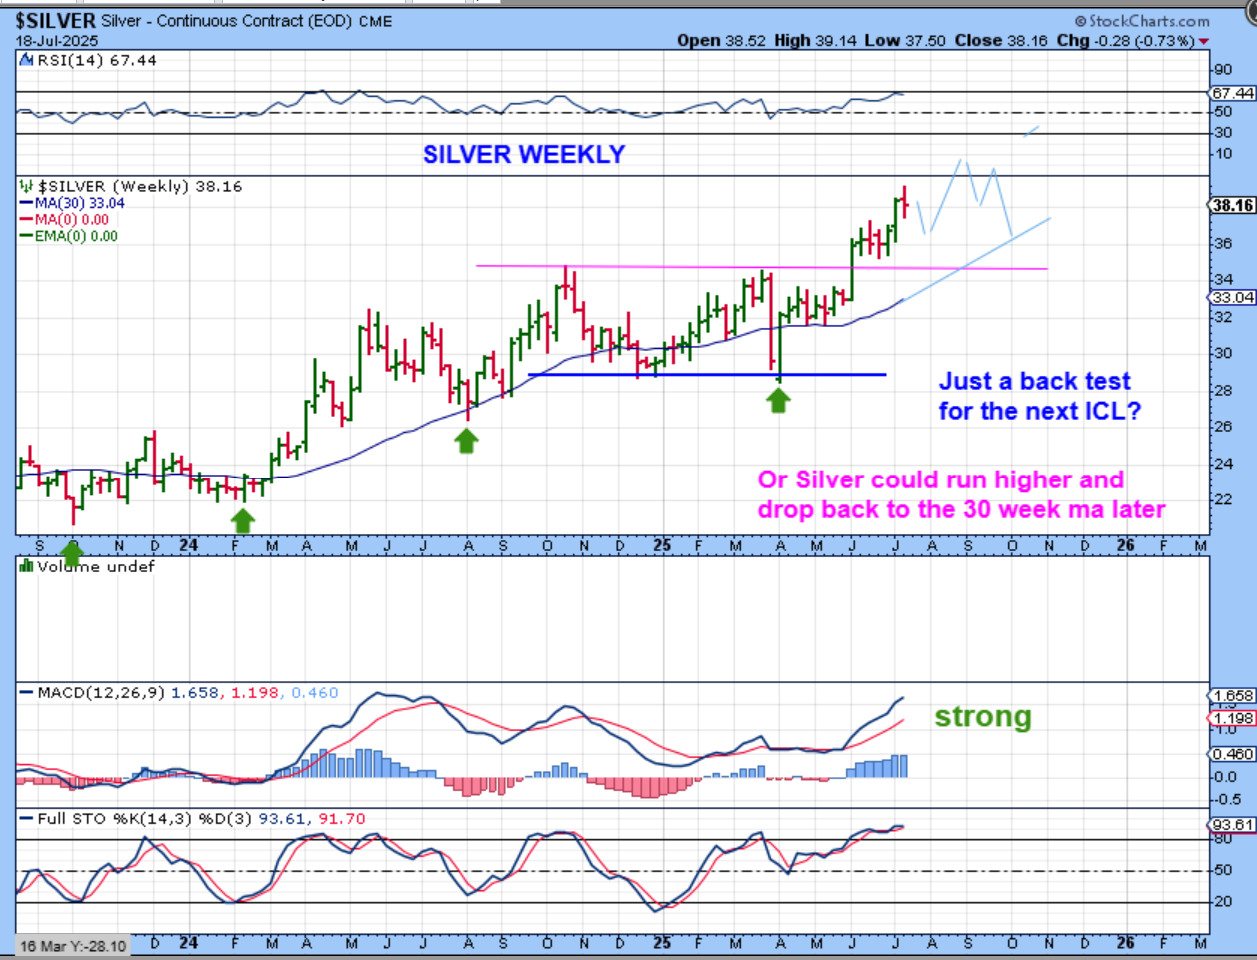
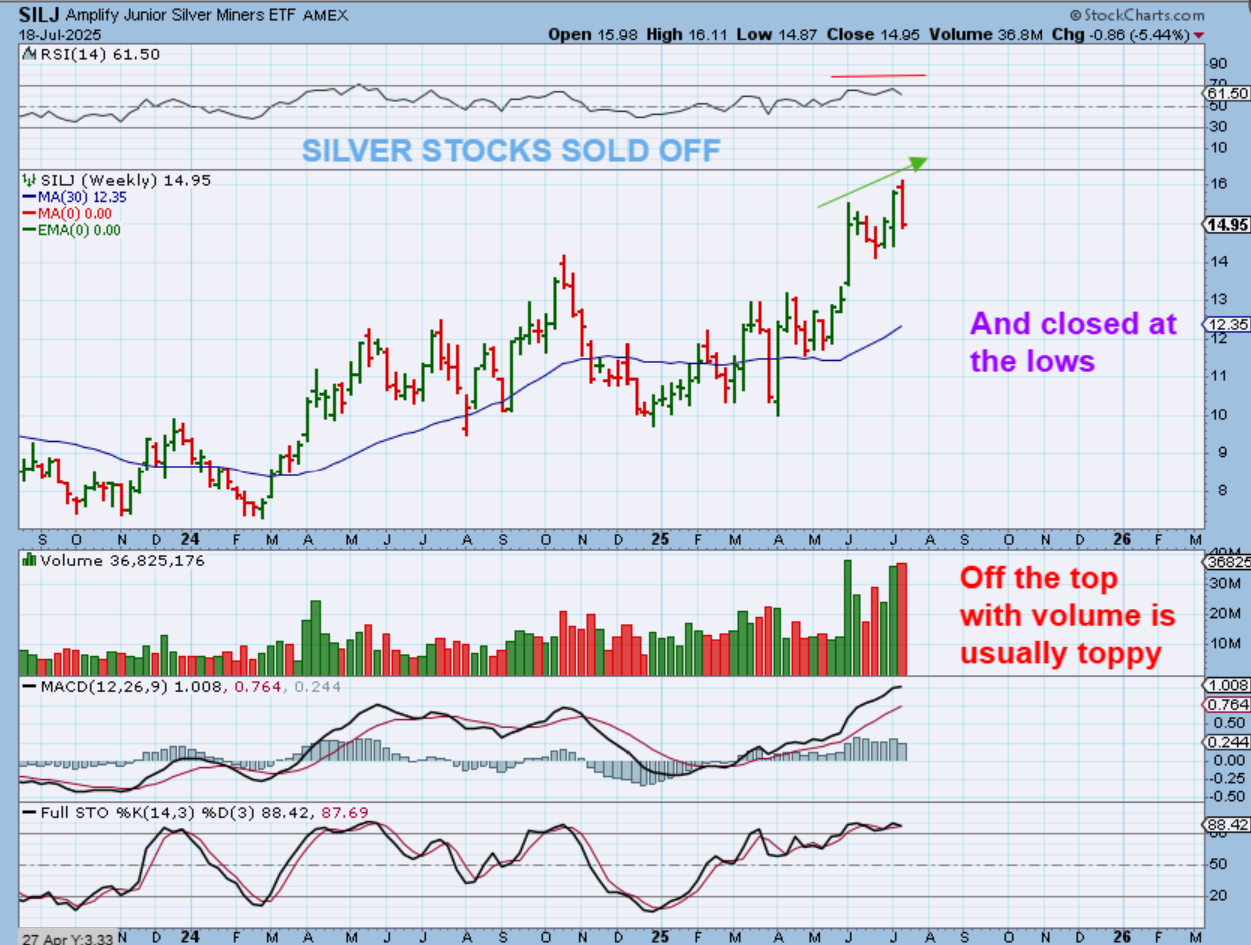
SILVER went sideways in 2025 when Gold rallied to new highs. Silver has actually now rallied higher when Gold went sideways. You can see that Silver actually put in a new high this week, but then reversed lower.
We have a doji or ‘indecision’ candle now.
Silver stocks, however, closed at the lows, and that may be a warning sign for us.
.
So Silver could still move higher, but with Silver stocks selling off, I think that it might start to dip into a dcl, bounce again, and then drop into the 30 week ma over time too. More sideways chop, like Gold.
.
SILJ – The silver stocks popped to a new recent high and then sold off to the lows, down 5.4% for the week. That took place with higher volume too. THAT makes me think that Silver is on borrowed time. Silvers current daily cycle is roughly half over. Silver stocks may just become choppy and frustrating for a little while longer (until an ICL falls into place).
.
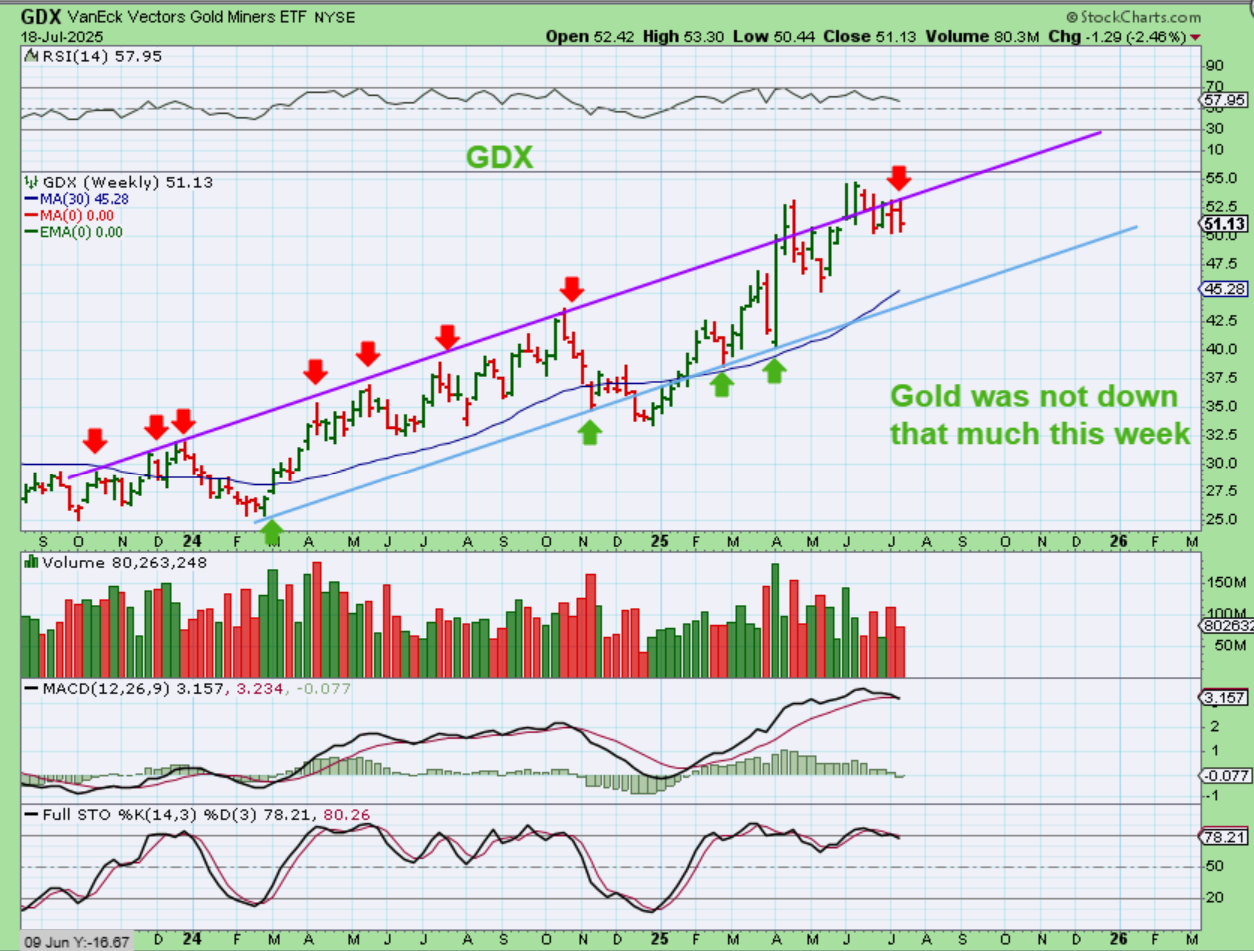
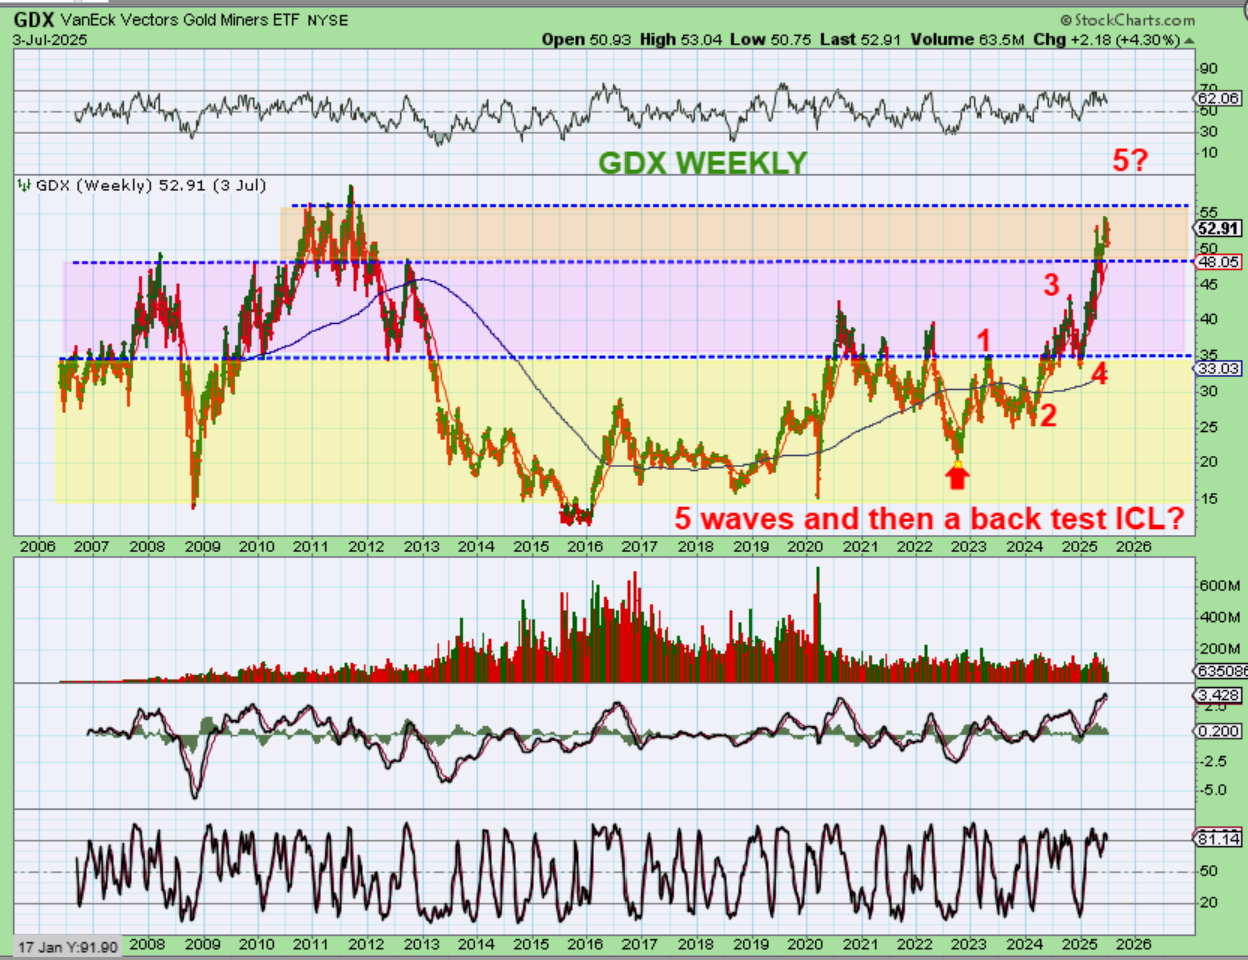
GDX WEEKLY– I was showing this channel for quite some time and the thinking was that Miners may breakout and run, then back test it, and run again. For now we have a couple of false breakouts and the choppy price action has taken us back inside of that channel. In technical analysis, you usually chop sideways or even revisit the lower channel from here. I’ll draw that for you…
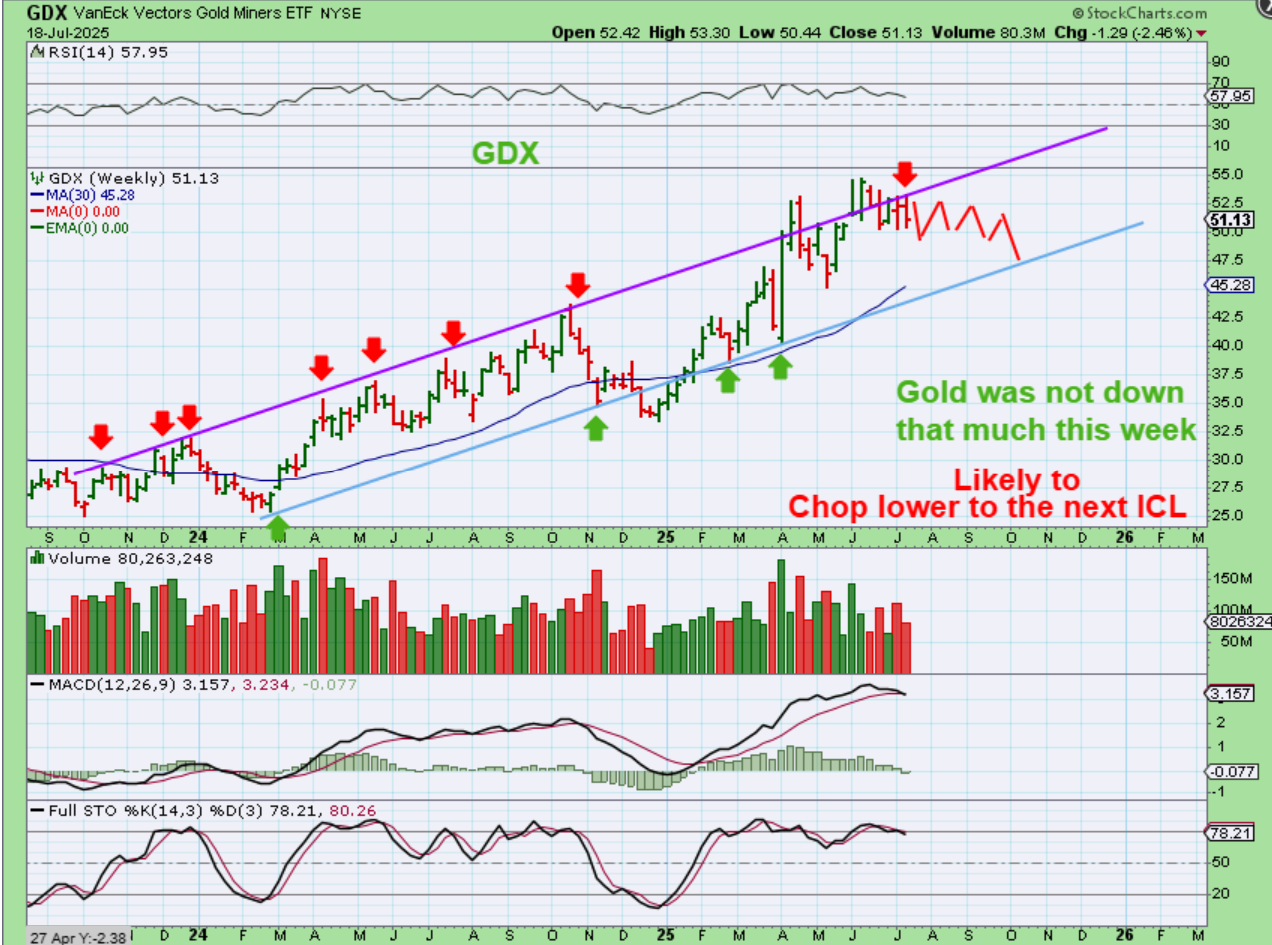
GDX could drop to the lower channel again, as shown here, but I actually tend to think that Miners will hold up better than that heading into the next ICL, so how would I draw that?
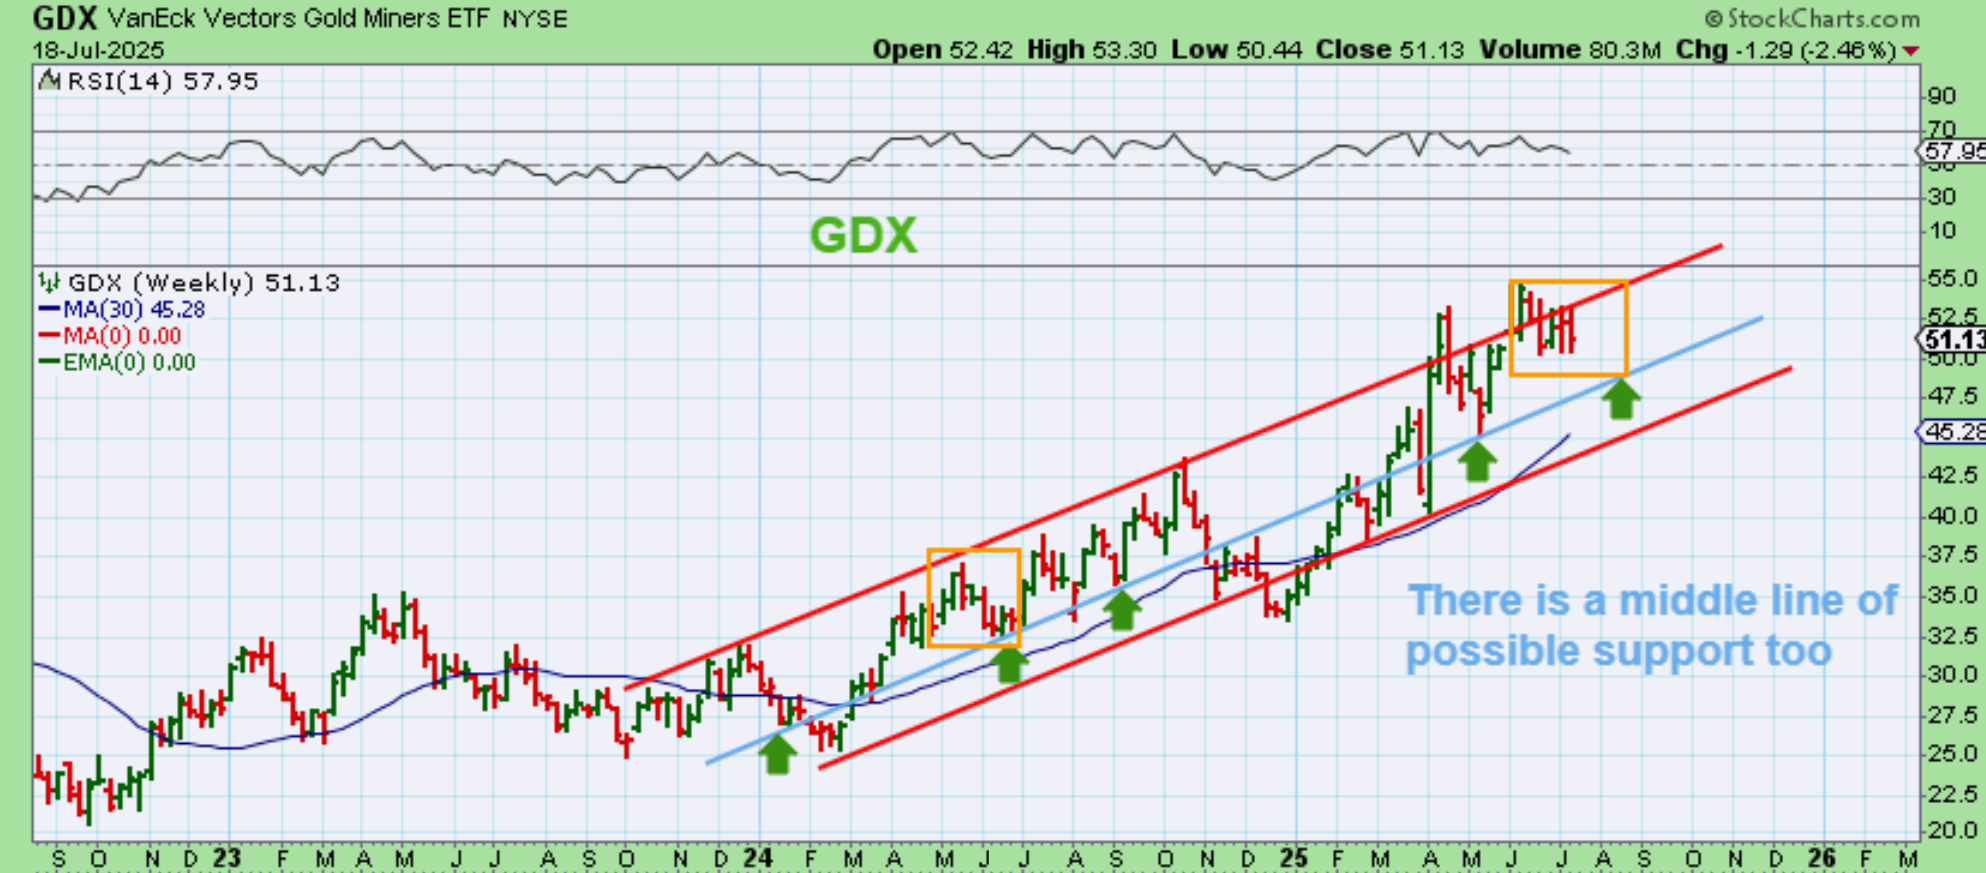
GDX – If you looked closely, there is a middle line of support too, so the Buyers could accumulate on the dips and prevent price from falling to that lower channel line, like it did in the past. This would mean that basically Miners will remain choppy, and some will outperform while others sell off lower. THIS CHOPPINESS ALL TAKES PLACE BECAUSE…
.
THIS CHOPPINESS ALL TAKES PLACE BECAUSE OF THE RESISTANCE THAT I HAVE BEEN POINTING OUT:
This is my chart from July 3 showing why the GDX struggles at times. Some resistance has been strong, but going forward resistance above $55 is pretty much nonexistent.
.
The Bulls remain firmly in control. I usually cover many of the individual stock picks and trading set ups in the weekday reports with daily charts, but I want to cover some of our winners below with Weekly Charts before covering Bitcoin. Why? To show whether these have made great gains are done with the run, or may they have further gains ahead? This was a great week for traders and investors in the general markets.
.
Enjoy your weekend, thank you for being a Chartfreak with me! See you on Monday!
a.
~ALEX
.
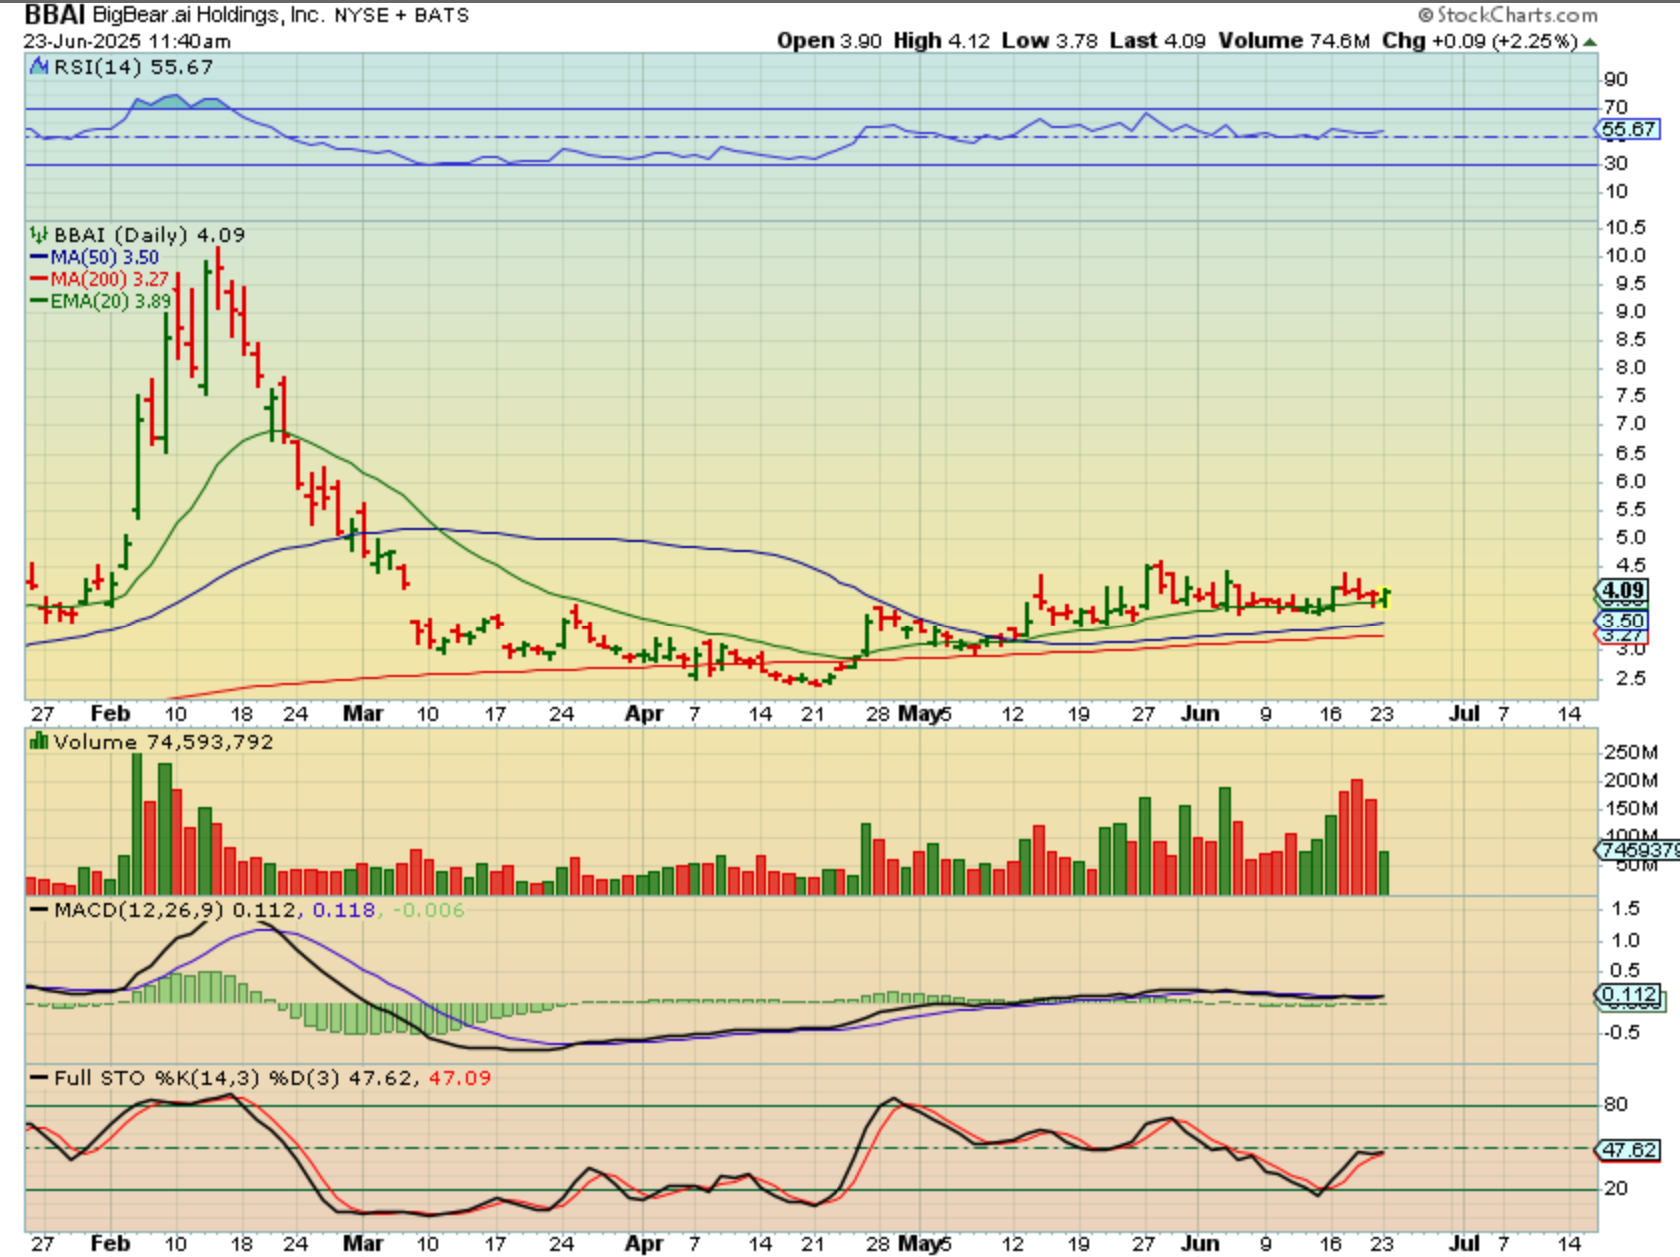
BBAI DAILY was a nice base/consolidation with volume spikes, so I was pointing it out as bullish in mid & late June…
.
BBAI WEEKLY– It has strongly rallied up 100% and yes, this can continue higher, but what about an ‘AI” Laggers? I have mentioned SOUN, GFAI, and ‘AI’…
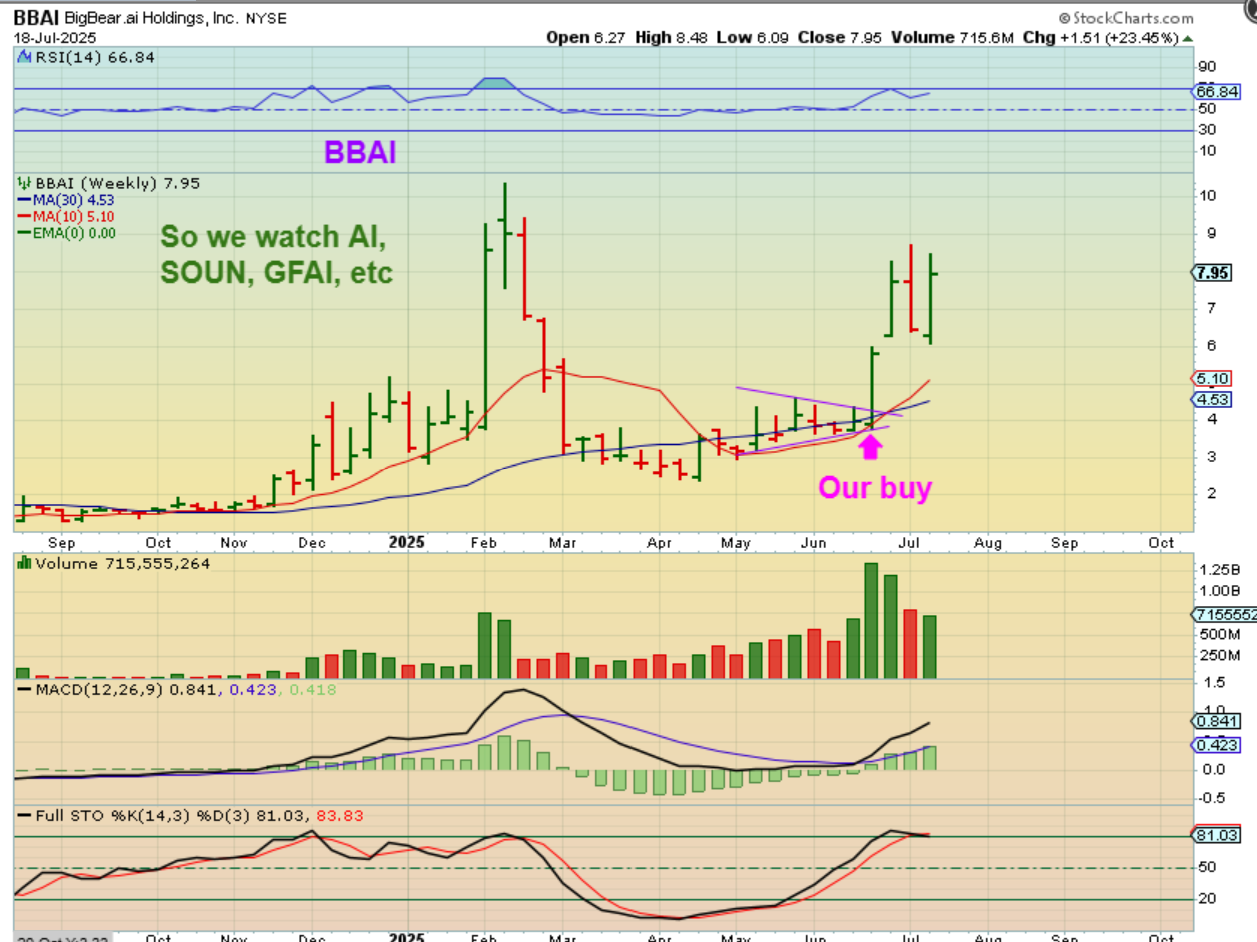
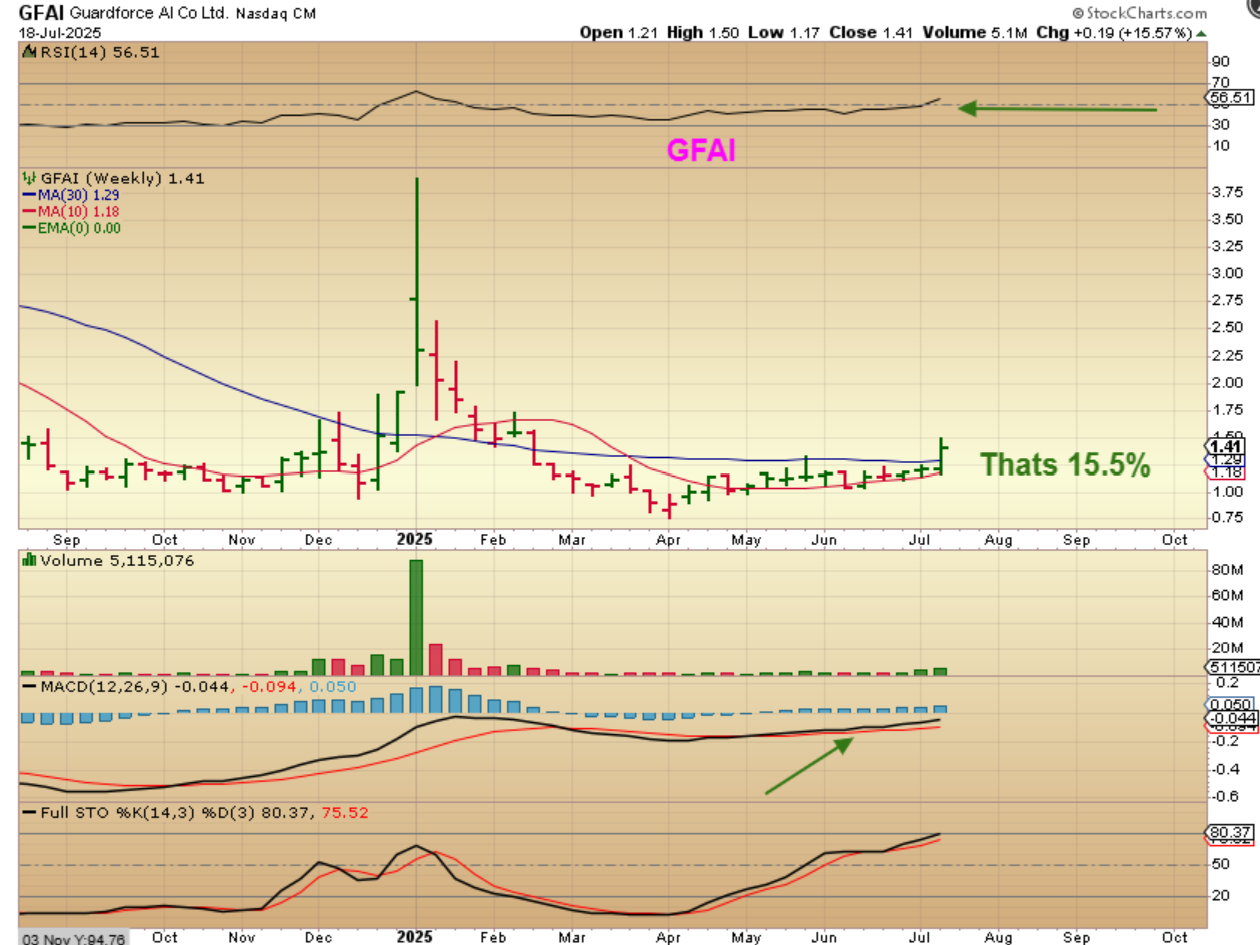
GFAI popped 15% this week, with some of us on board. You can see that similar to BBAI in June, this has great upside potential with a base or consolidation like this.
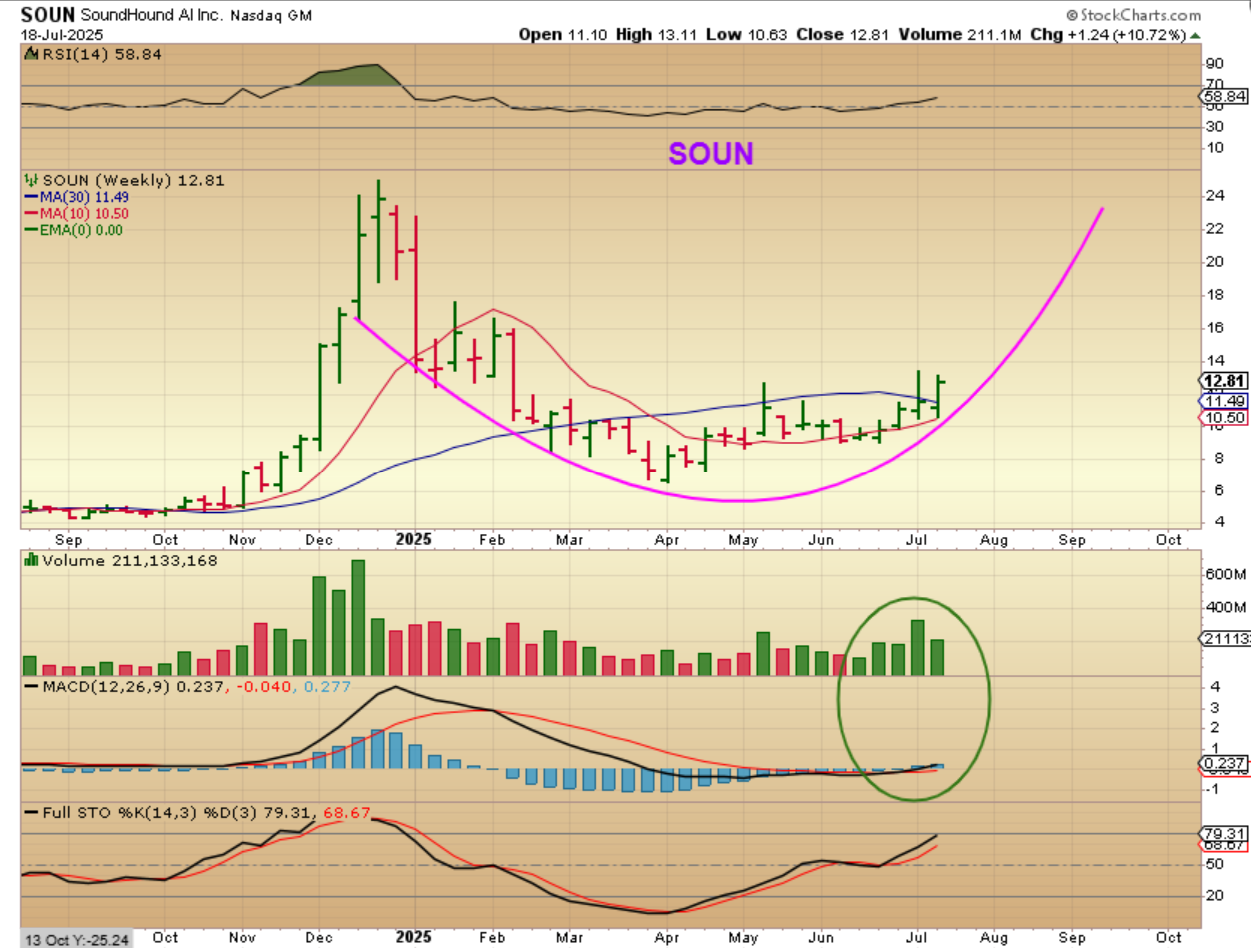
I have had SOUN in our reports and it has started to move higher out of a base from $10 to $14, so…
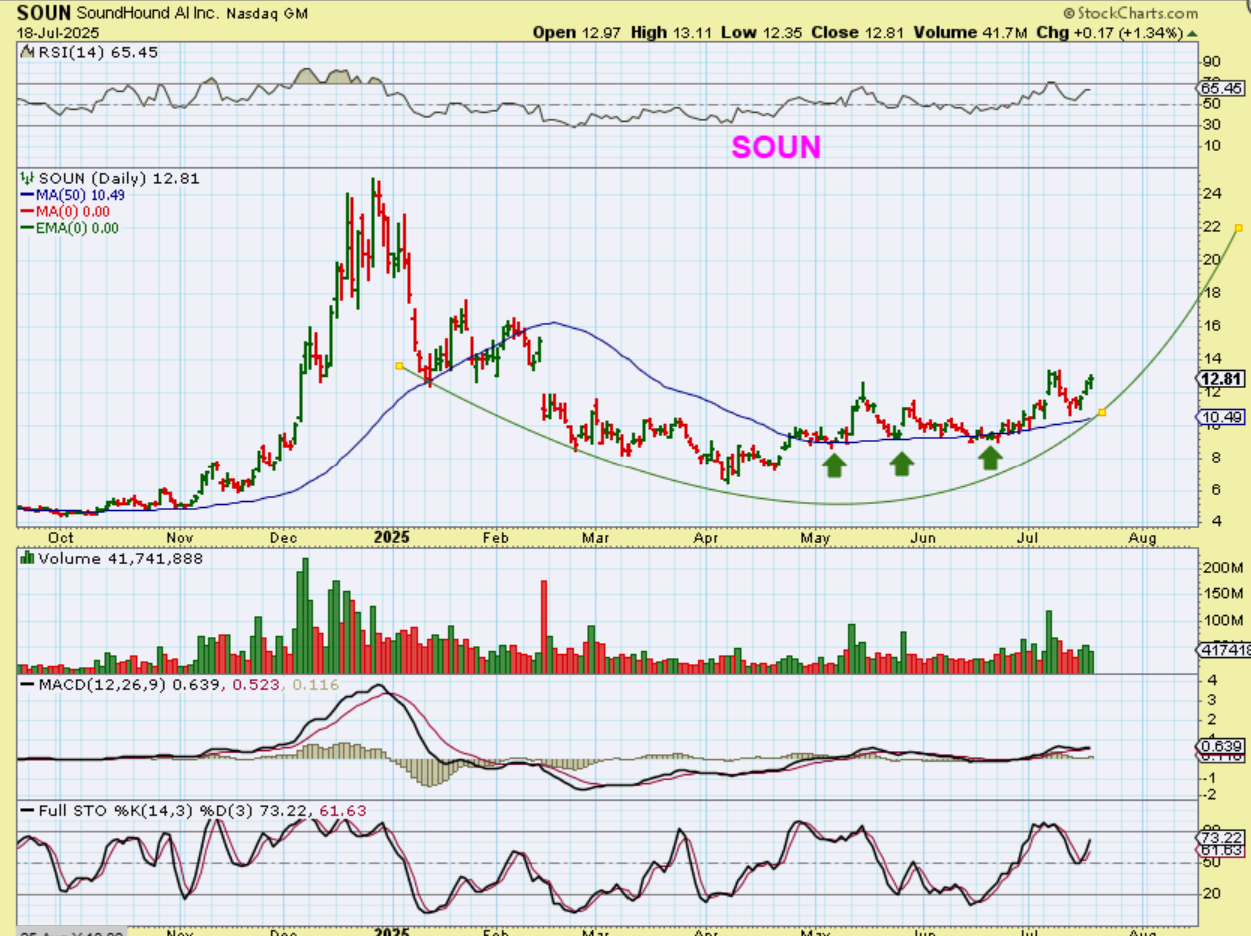
SOUN WEEKLY – I wanted to show you the weekly chart so that you can see the potential over time. This is a beautifully bullish set up at this point. This can do as BBAI did, by running up to former highs or more. That’s a $10 to $24+ run over time
We’ve been trading or doing ‘Buy & Hold’ in quant stocks too, and they’re making big gains. They’re very choppy and hard to hold, but it has paid off over time..
.
RGTI – On June 30 I posted this bullish wedge near $11, but who really knew that…
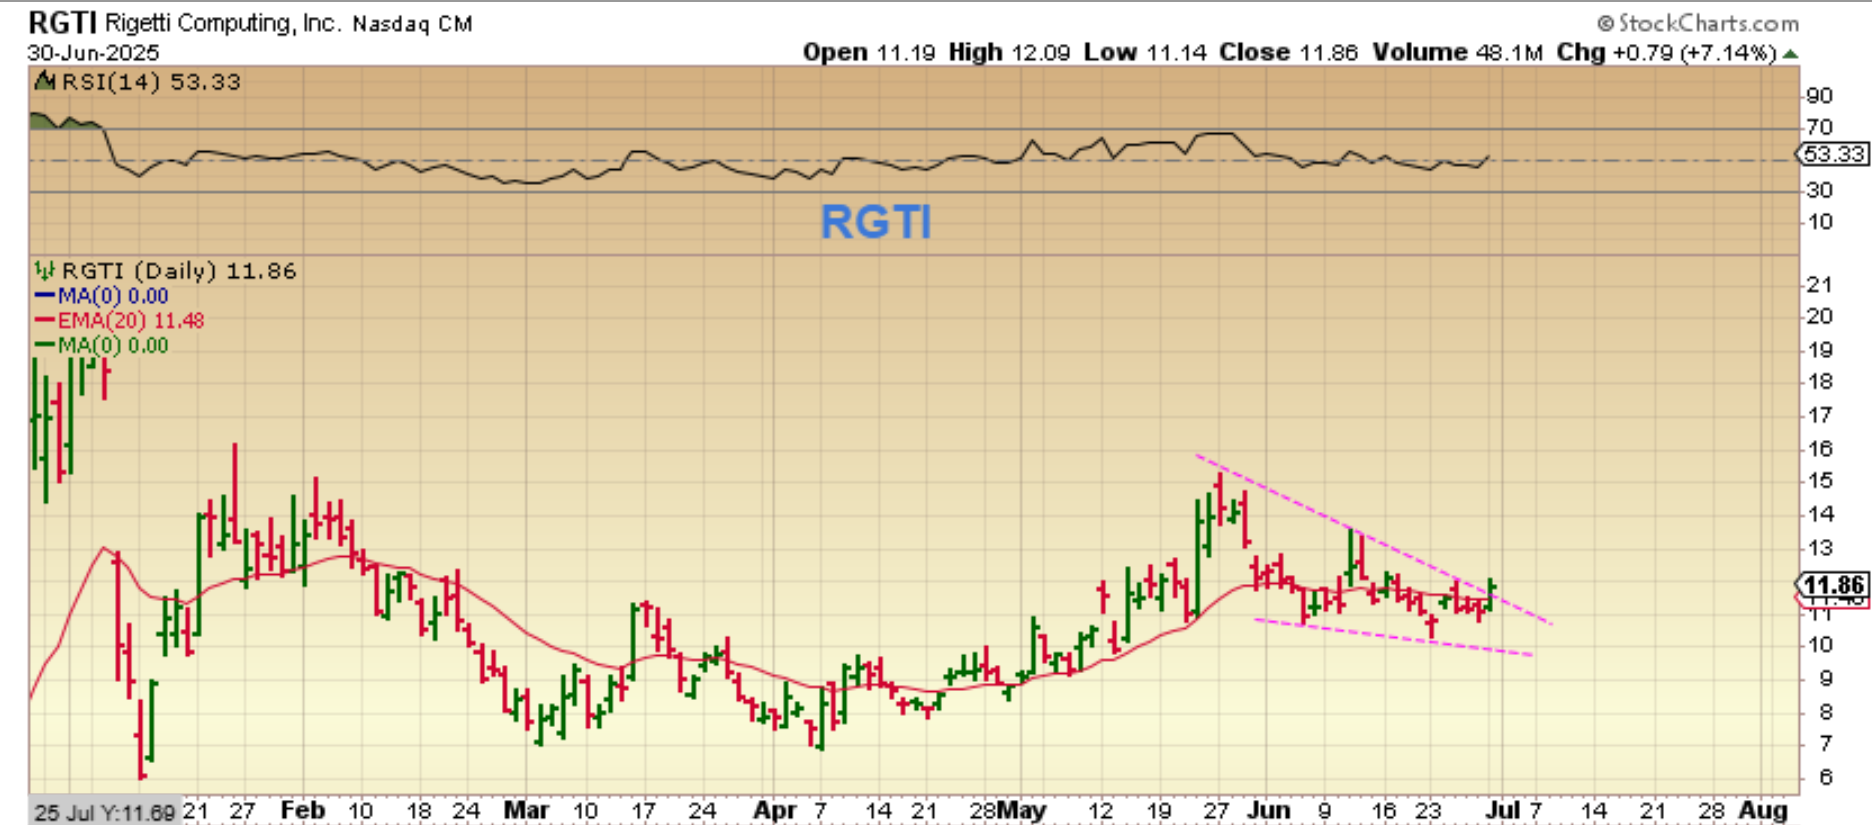
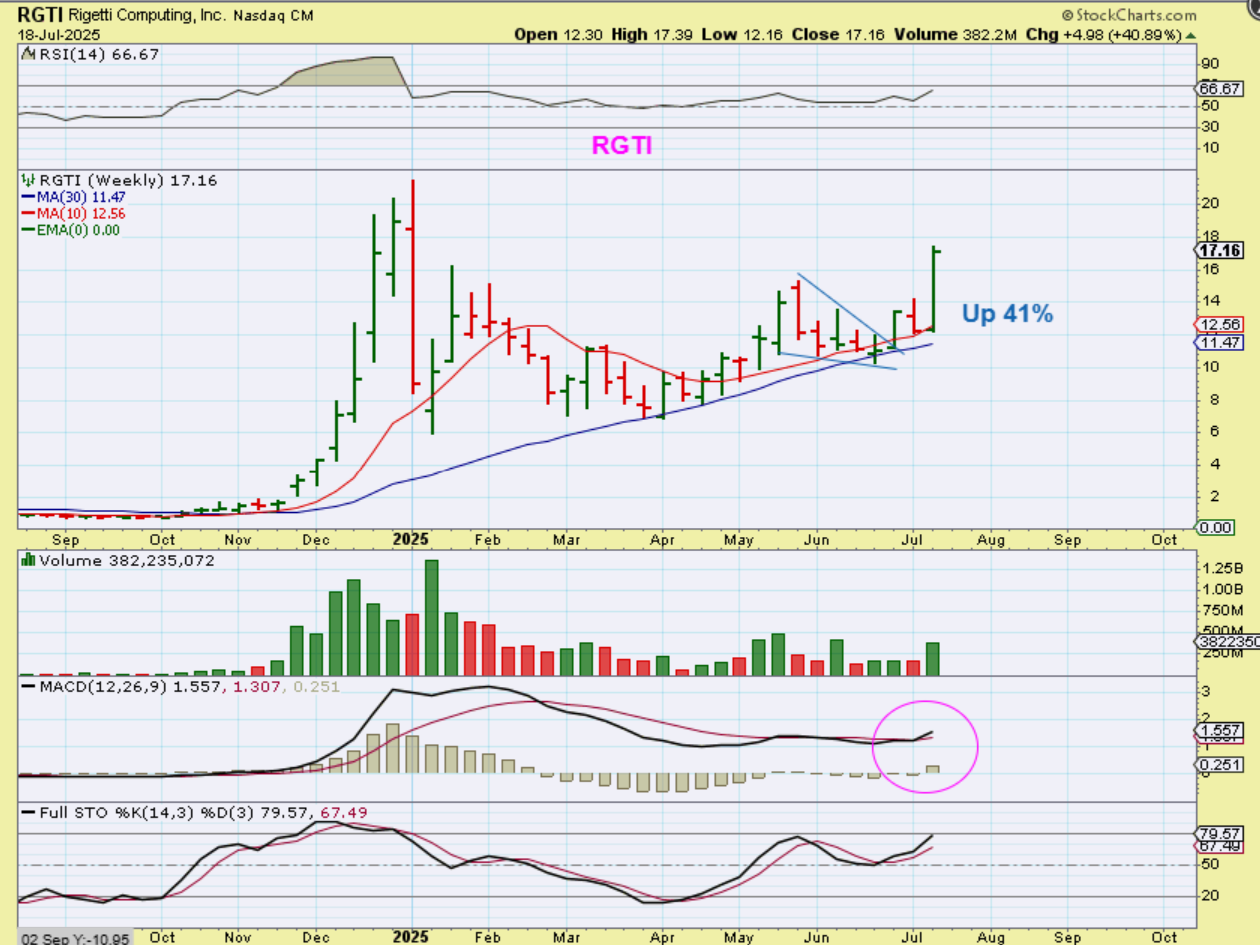
RGTI – Who knew that it would pop 41% this week alone? When you look at RGTI with technical analysis though, it rode up both the 10 week ma and the 30 week ma, and that is normal and bullish price action, so the buy was near $10 & $11
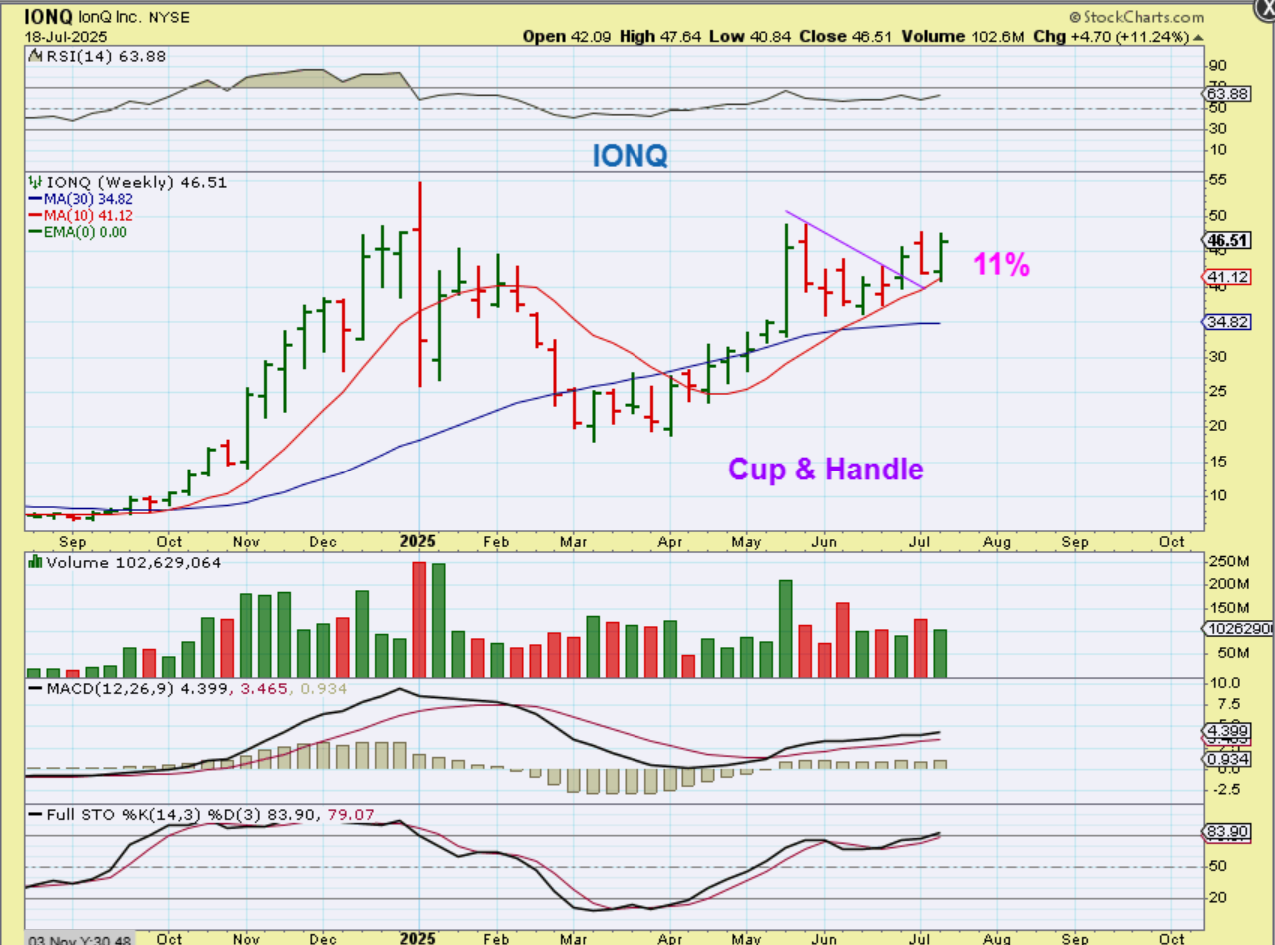
IONQ was ‘only’ up 11% this week, and we had that in the reports over the past couple of weeks. Look at that red 10 week ma. Price is bullishly climbing it too. I’ve also covered QBTS, QUBT, and ARQQ. QMCO has been a real lagger in this sector, but I’ll keep looking for signs of life there as time goes by.
And what about these NUKE STOCKS? These are hard to buy and hold at times, because of the deep pullbacks, so I have traded them, but Buy & Hold would have been great. Stocks like SMR, OKLO, NNE, and LTBR have been my favorites.
.
.
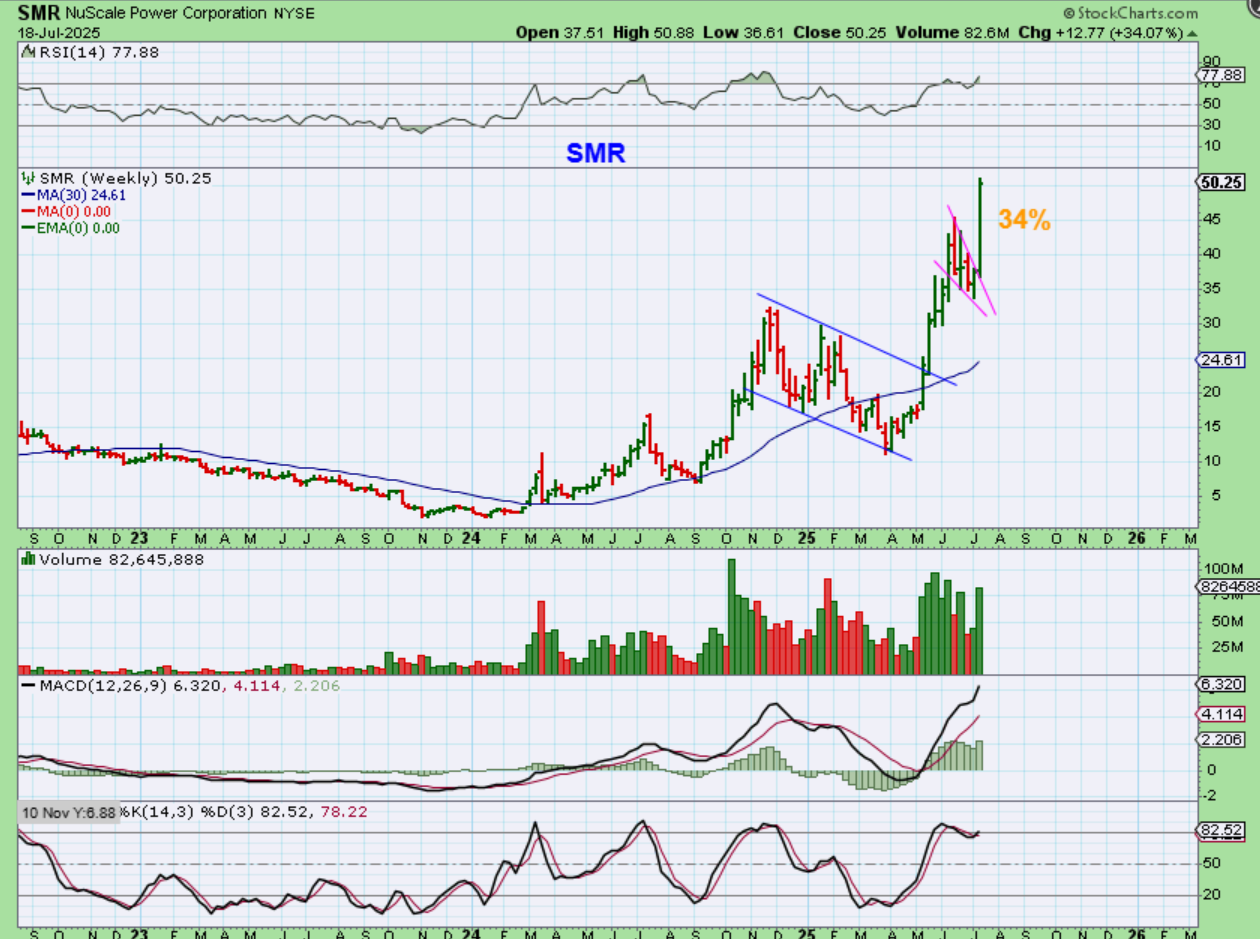
SMR shot up 34% this week, and unfortunately I had sold mine in that bullish descending wedge! The chop was big and the drop was $45 to $35, so I stepped out for a bit to buy other set ups like OPTT, WWR, SERV, SOUN, etc, but congrats to any that held on!
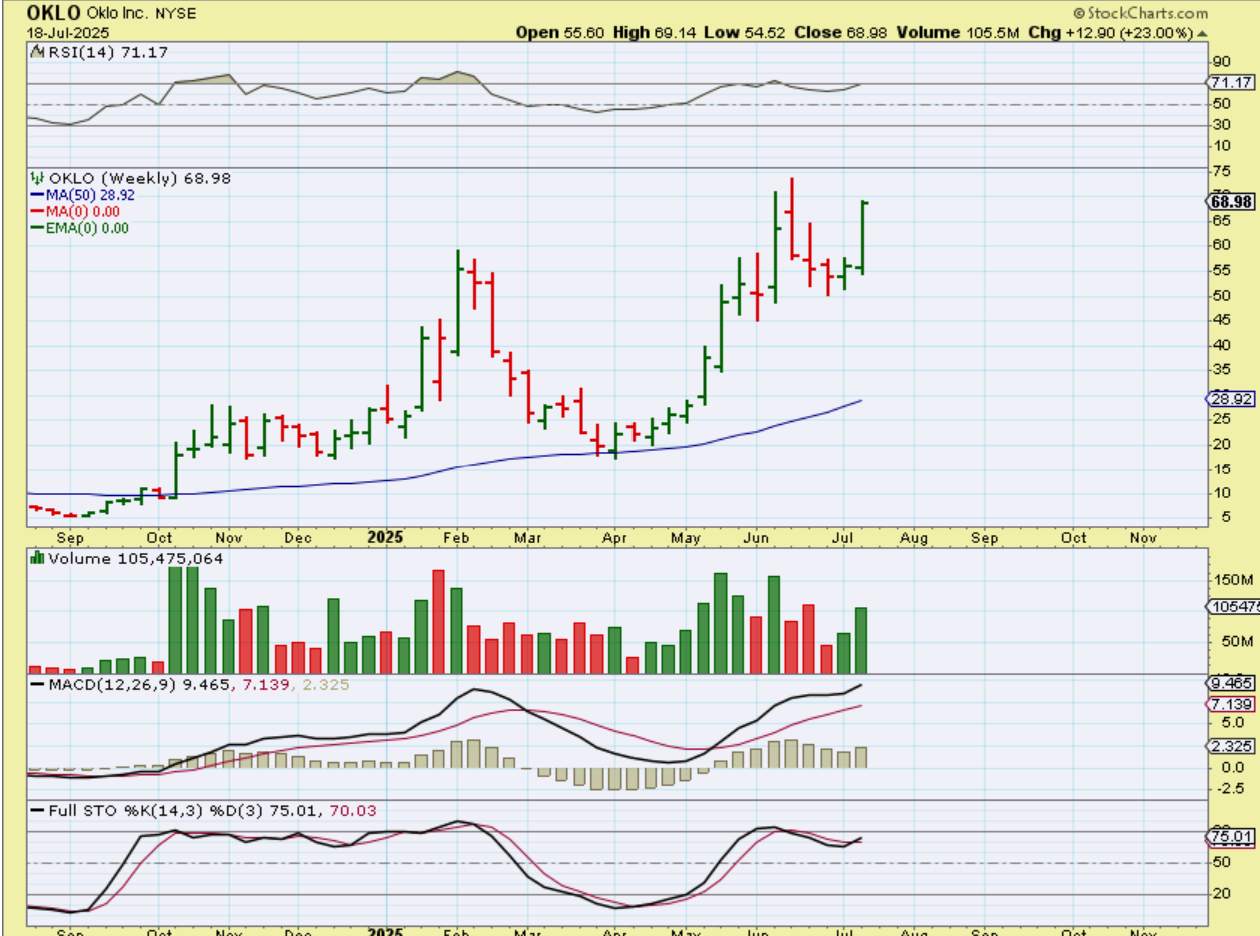
OKLO has been incredible, but I missed the first part of that run from April to June. I did discuss the recent dip and it surged 23% this week. What a bullish week the general markets had. Can this run higher? IT ran for 9 or 10 weeks out of that April low, so this current 2 week run should not be the ‘peak’.
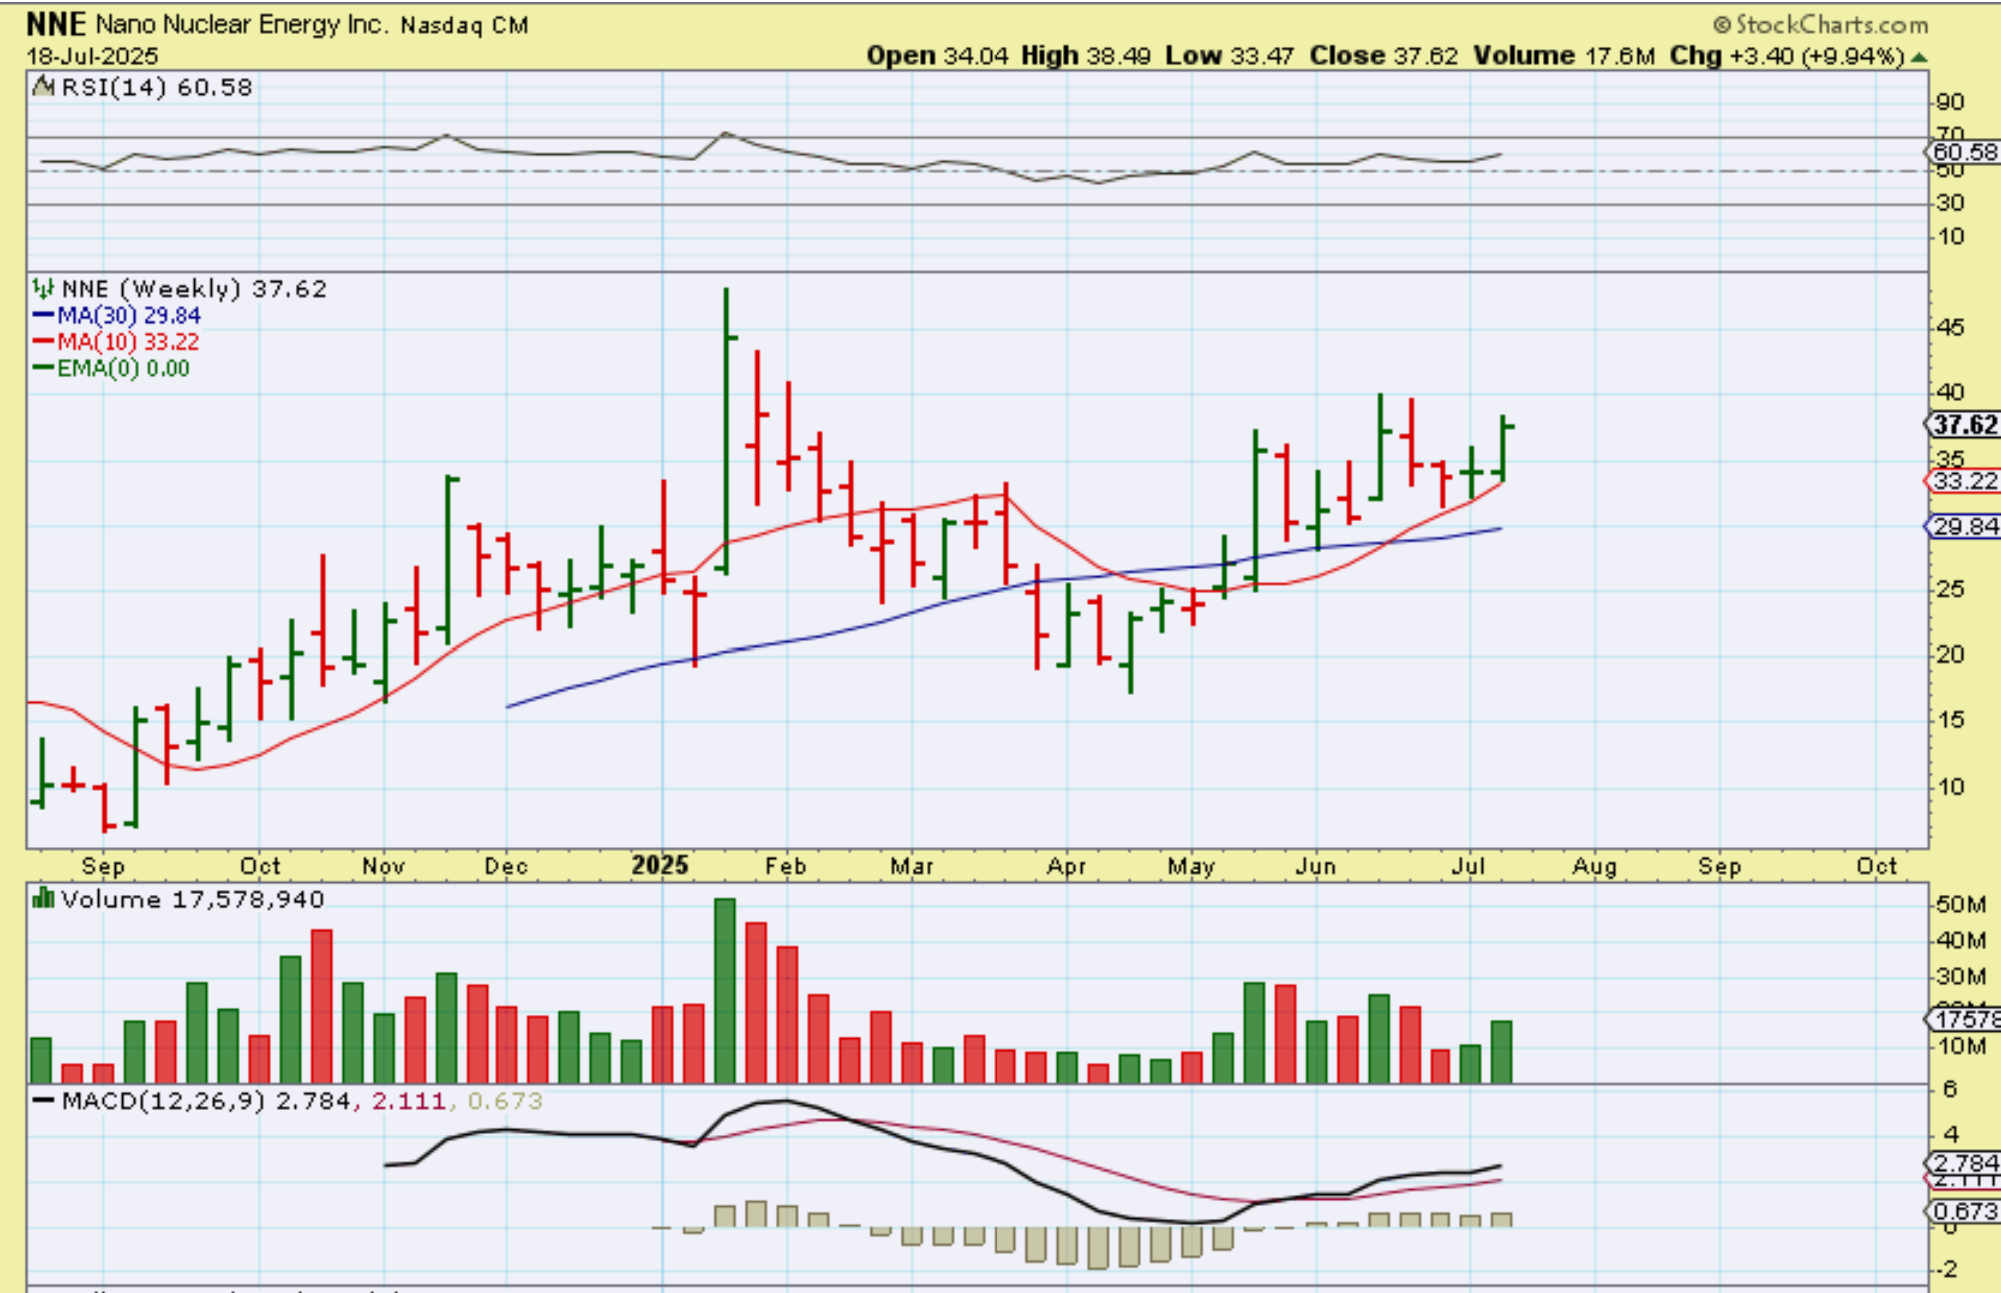
NNE is the lagger, but it did pop up 10% last week, so this may be ready to go even higher. I like the volume on up weeks and a weekly MACD Cross with RSI at 60 is bullish. NOTE: You can see that the normal ‘chop’ here has been roughly $30 to $40 to $30, so these are not easy ‘buy and hold’, but the weekly charts do remain bullish. NNE reversed at the 10 week ma 3 weeks in a row.
,
I will continue to cover bullish set ups in the weekday reports, lets discuss Bitcoin here.
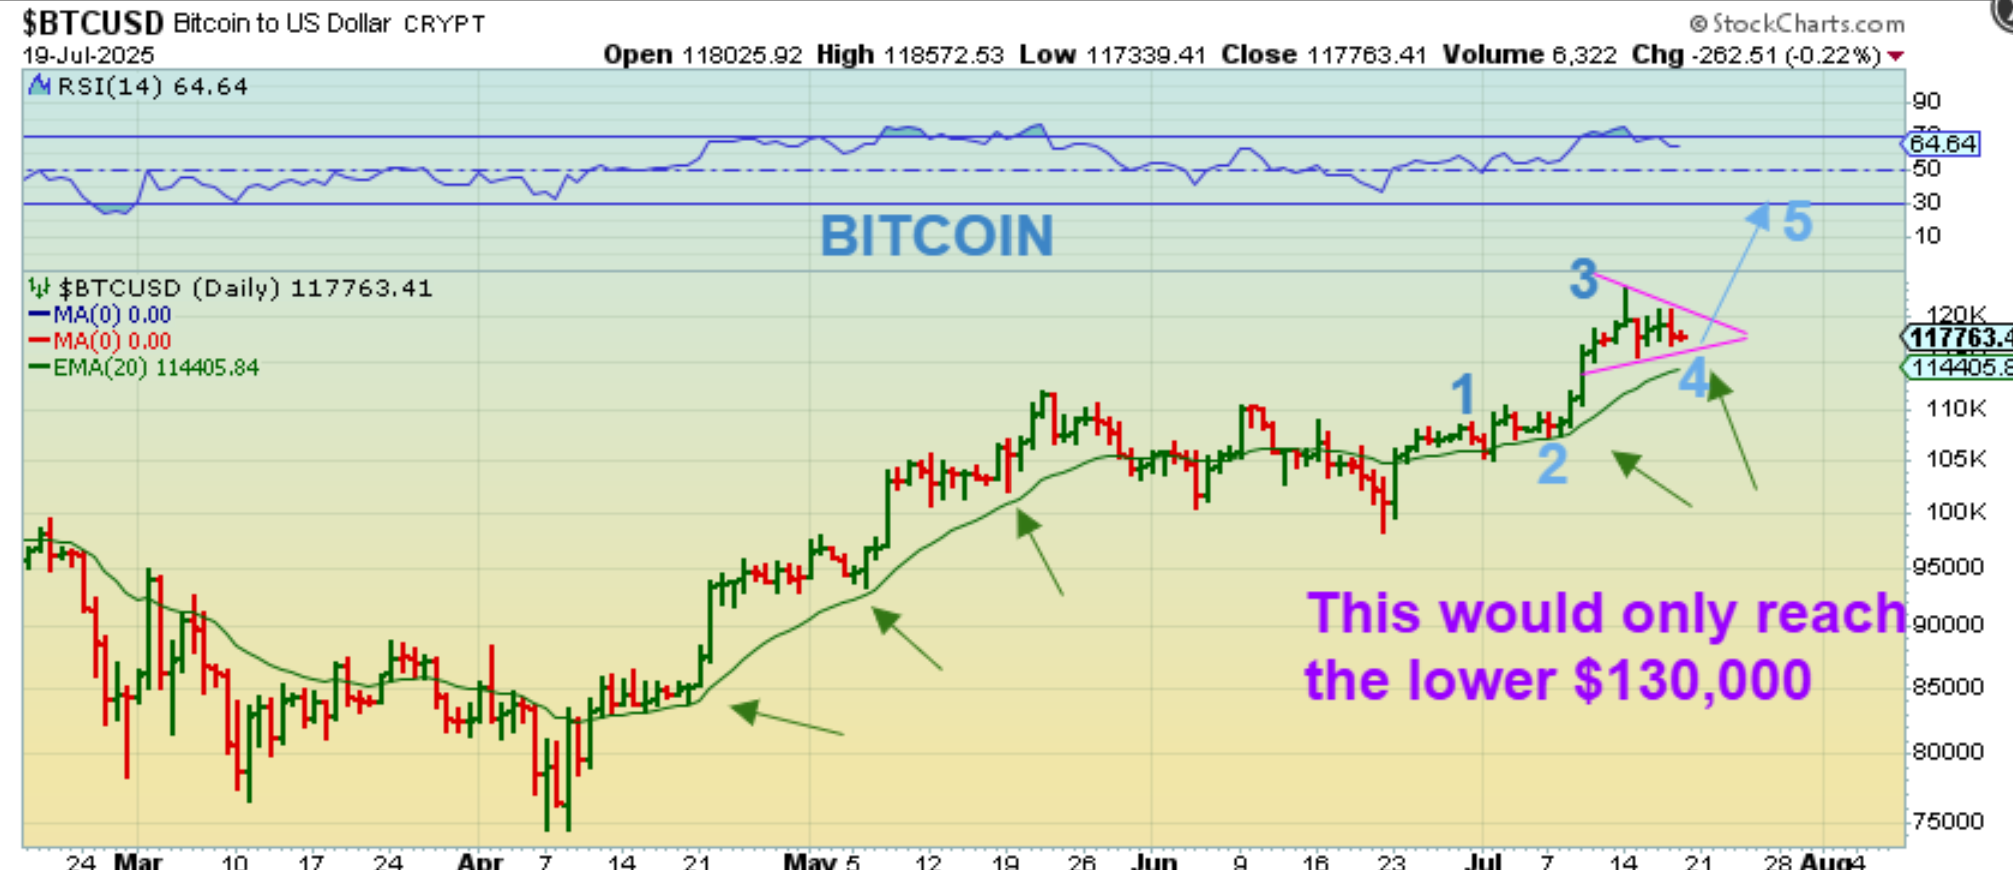
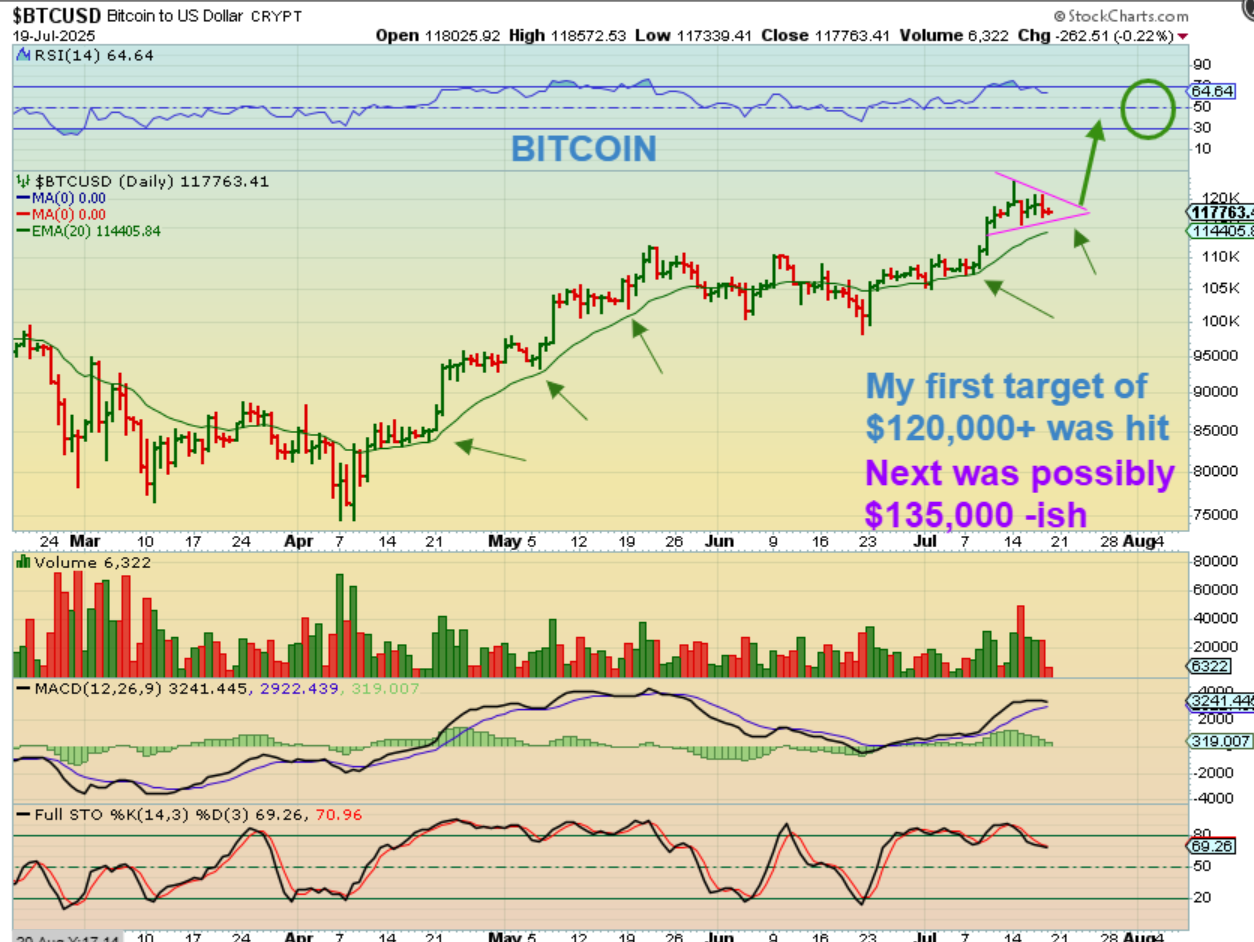
BITCOIN : In prior reports we have repeatedly discussed the 4 year cycle (bigger picture), the 60 day cycles, and the 30 day time-periods, so I think that we all know where we are. I had my $120,000 and ‘$135,000-$145,000 plus’ targets from long ago. The $120,000 was hit, let’s just pick it up there…
.
BITCOIN shot up above the $120,000 area and then pulled back to around $115,000 again. Target #1 was hit, but we seem to be churning into a bull pennant. I have pointed out the 20 ema as a place where this sideways chop may stop and…
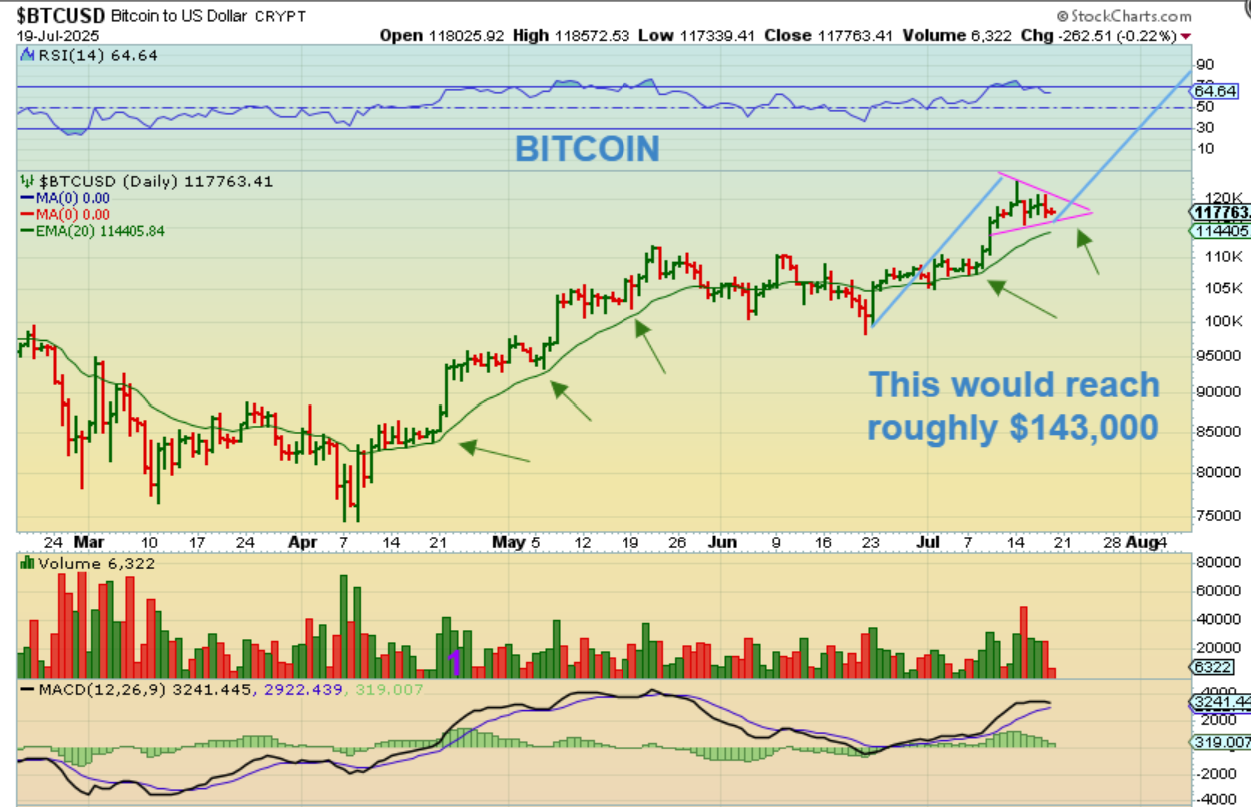
BITCOIN : If I draw a length from the June low to the July peak, and add that to the triangle/pennant, we could see a run to over $140,000. Another measurement has it a bit less…
BITCOIN : If we draw a 5 wave up and measure from 2-3 as the length for 4-5, we would go from the current $117,000 area to $130,000 – $135,000 (which was my original second target). Bitcoin is almost at the 20 ema and I think that we DO have time for the next leg up in this daily cycle. Cryptostocks have been moving higher, and I cover those in the daily reports.