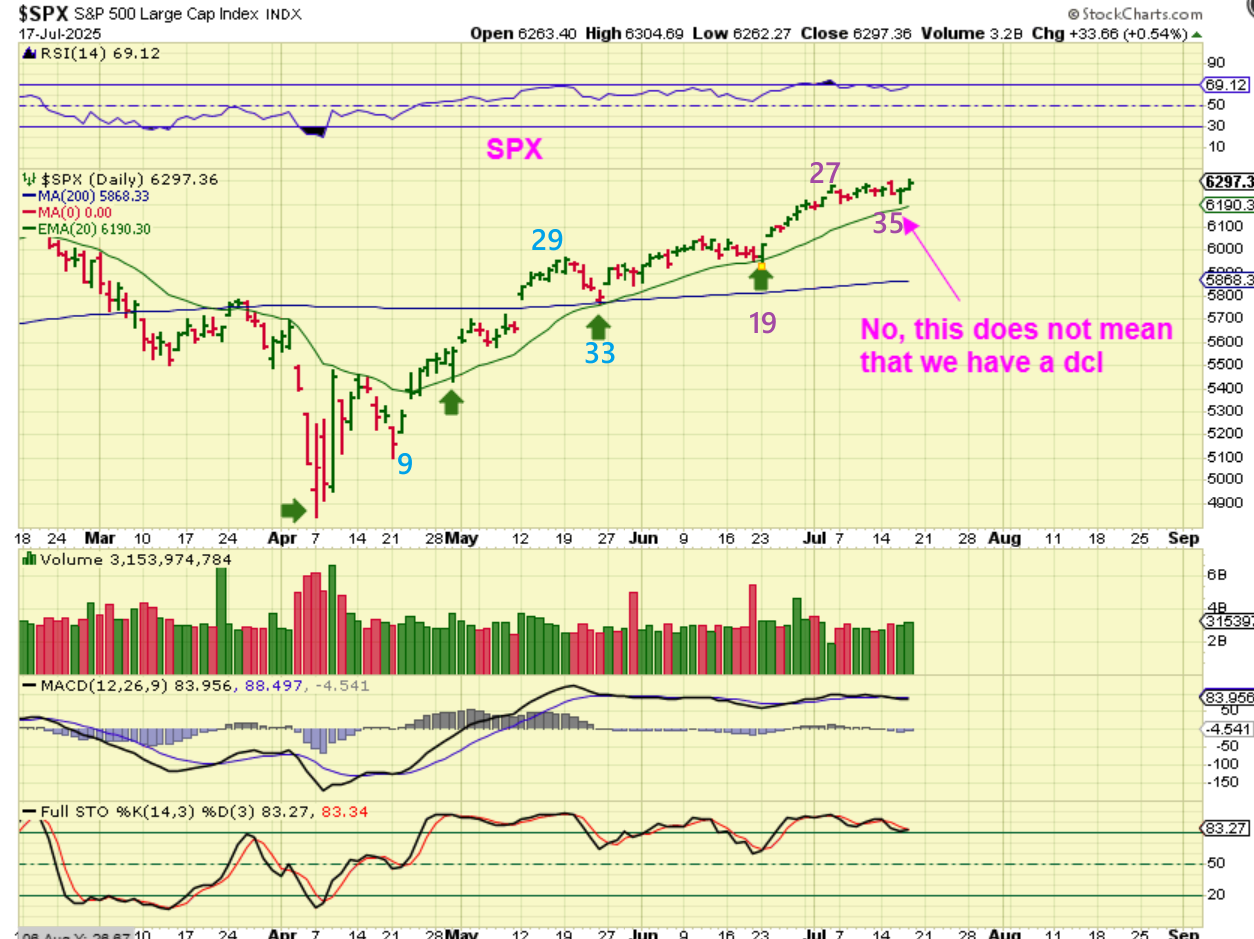
Question from reader: Now we know that we have the dcl in place, correct? Because we turned at the 20 ema again and moved higher like the last times?
Answer: NO, not necessarily. It’s still a very bullish market though. I’ll explain.
.
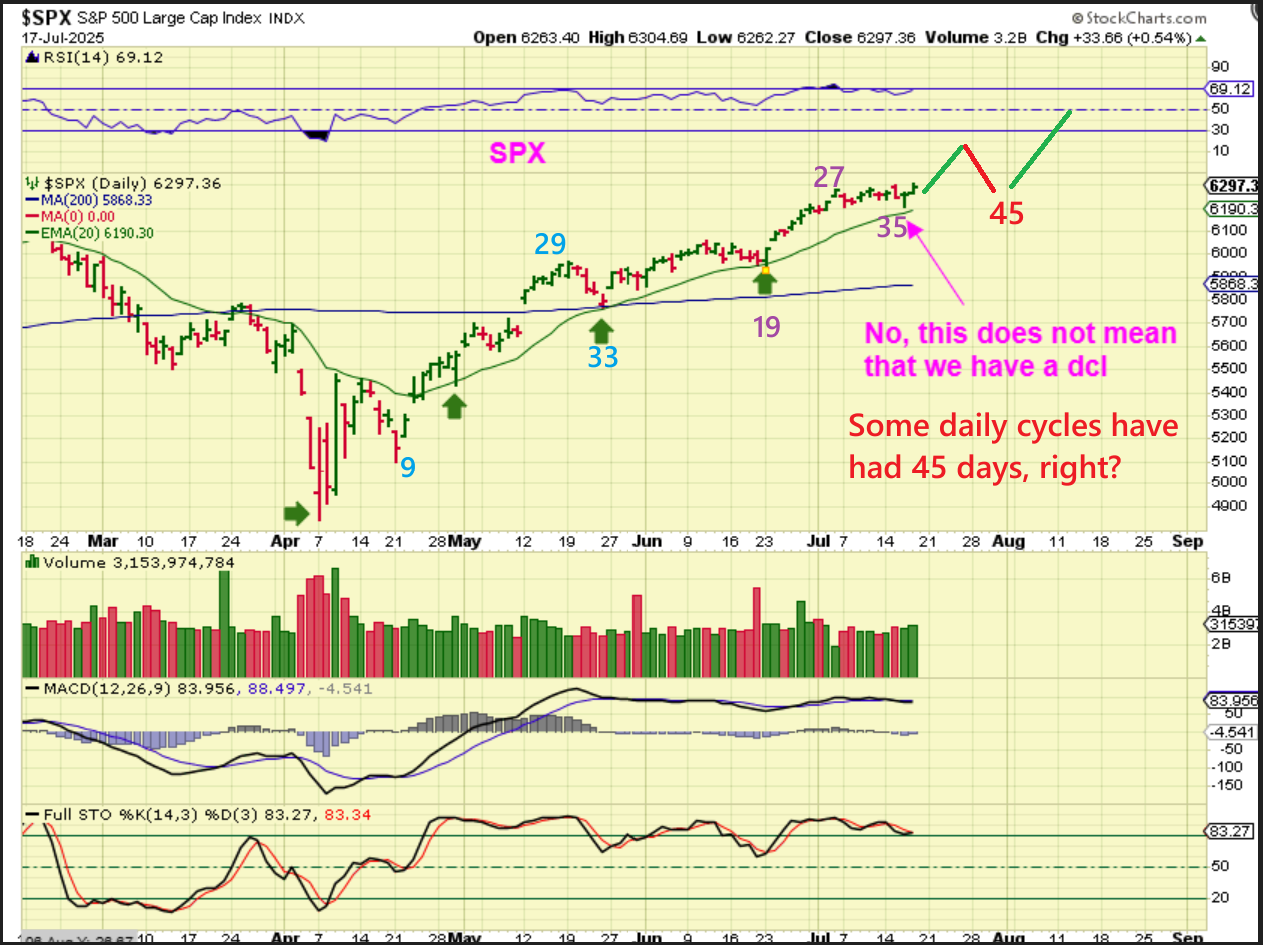
The SPX has definitely been respecting the 20 ema, and that is quite bullish with dips being so mild. That said, I have seen daily cycles that easily run 45+ days long too, so …
.
As a visual, We could still Pop or rally into next week too, and then come back again on the following week to give us a more visible dcl, but it would be around day 45. This is just a guess, since it could peak on day 38 or day 42 etc, but yesterdays move simply does not yet tell us that we have a dcl. It can be ahead. We’ll see, but what I am saying is: “We can rally and drop in the next week or 2 and get a more visible dcl, because there is still ‘time’ for it.“
.
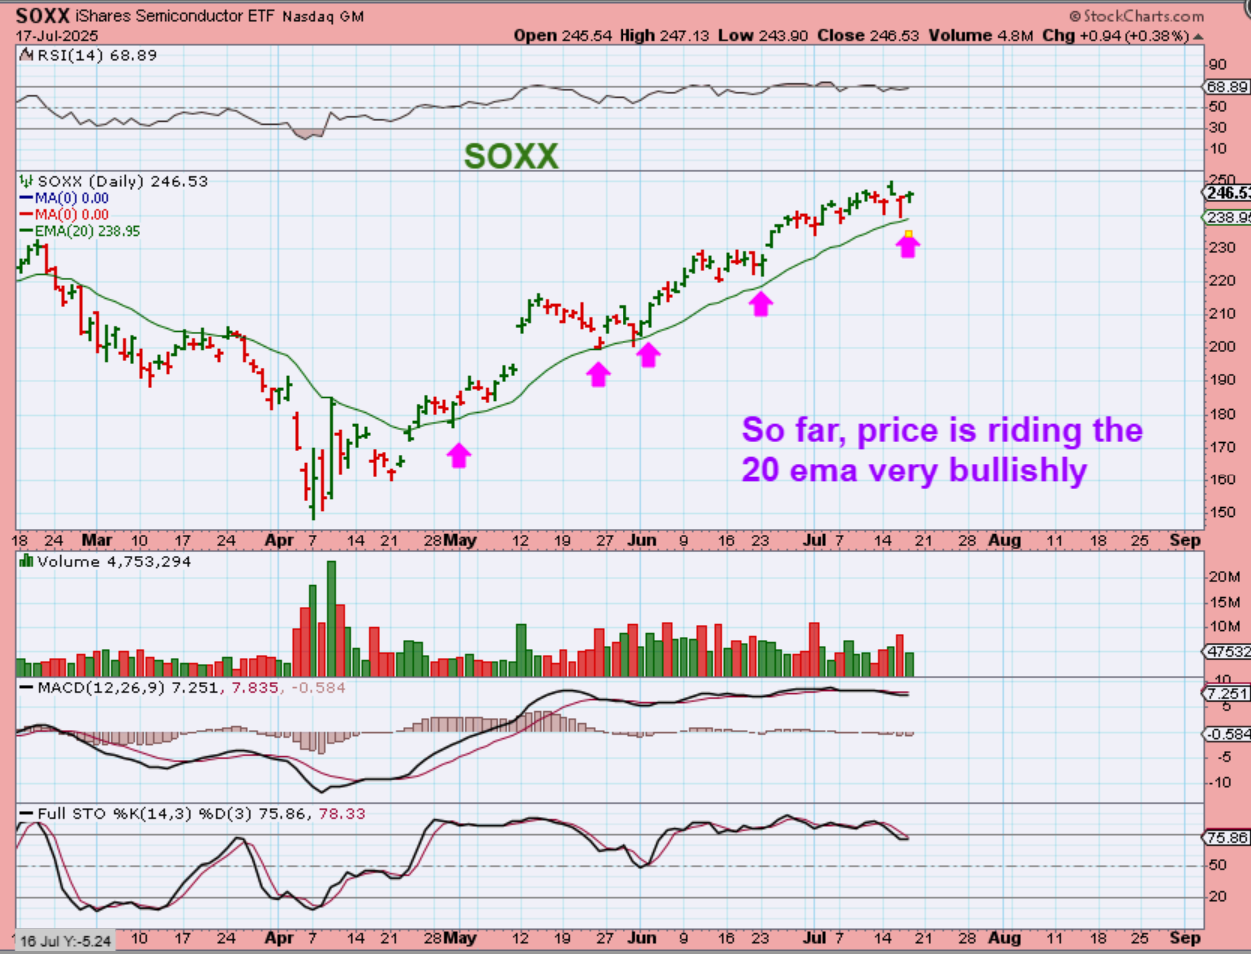
SOXX (& NASDAQ) – All of the general Market sectors have become quite bullish, with buyers stepping in at all of the dips.
.
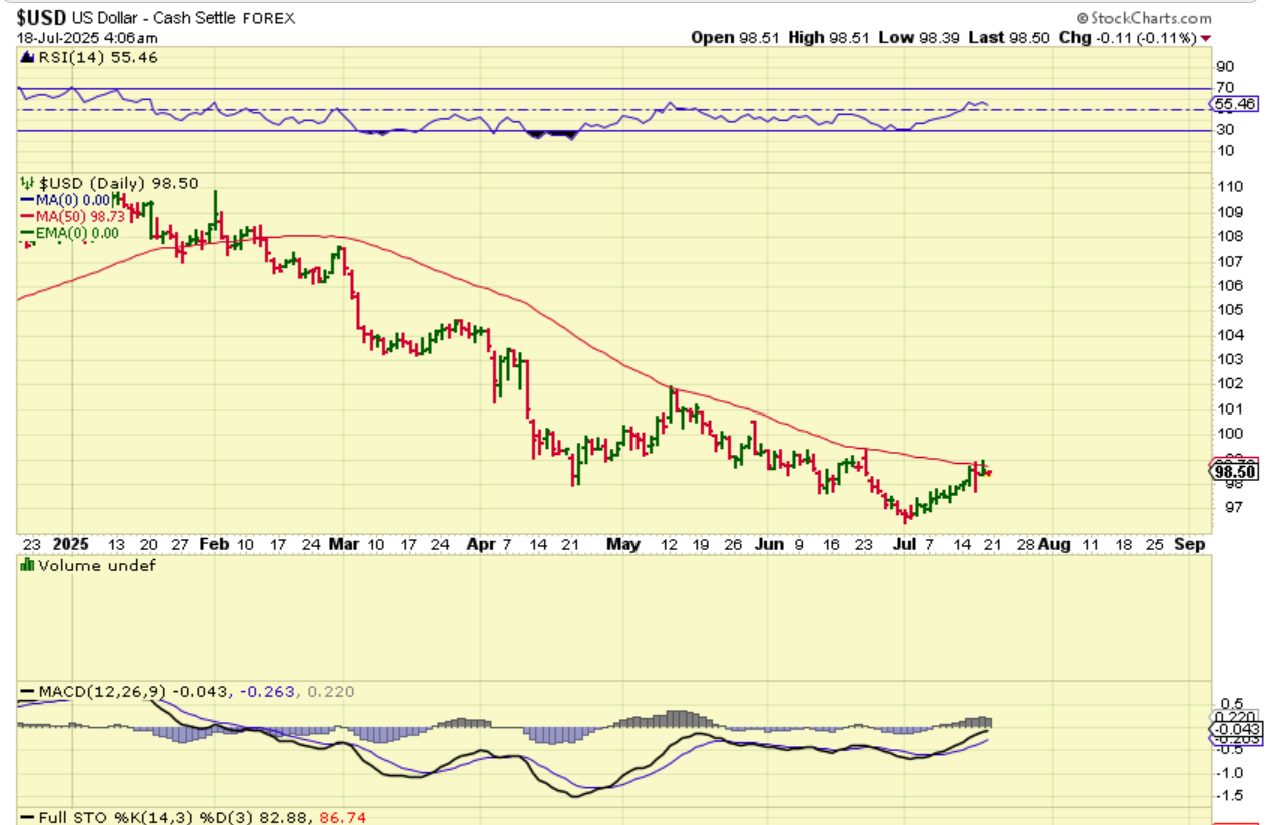
THE USD stalled at resistance and has not changed from my last 2 reports. That MACD is quite strong though, so this may actually breakout higher.
.
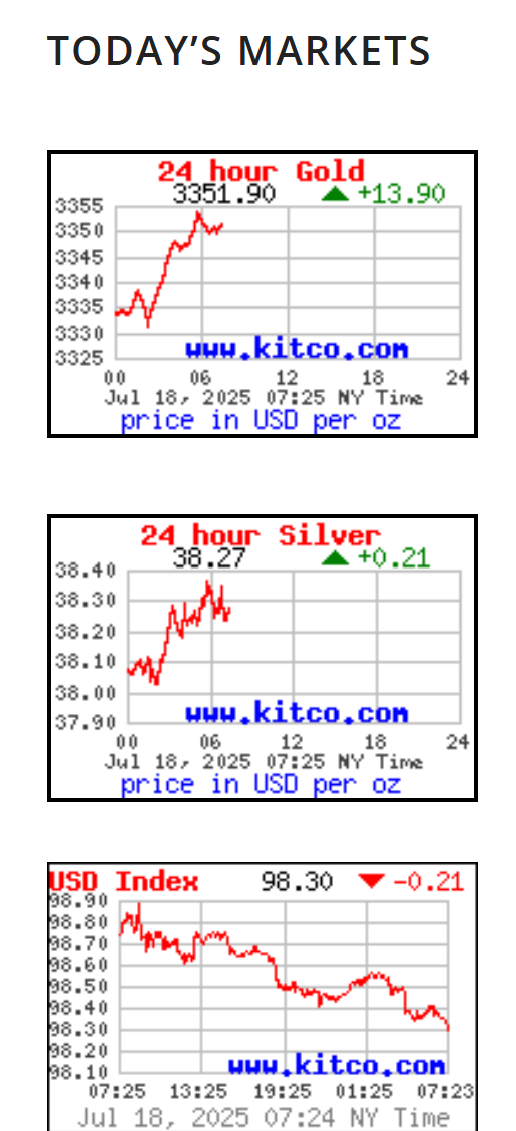
PREMARKET: Gold and Silver are up, The USD is dropping away from that 200sma.
.
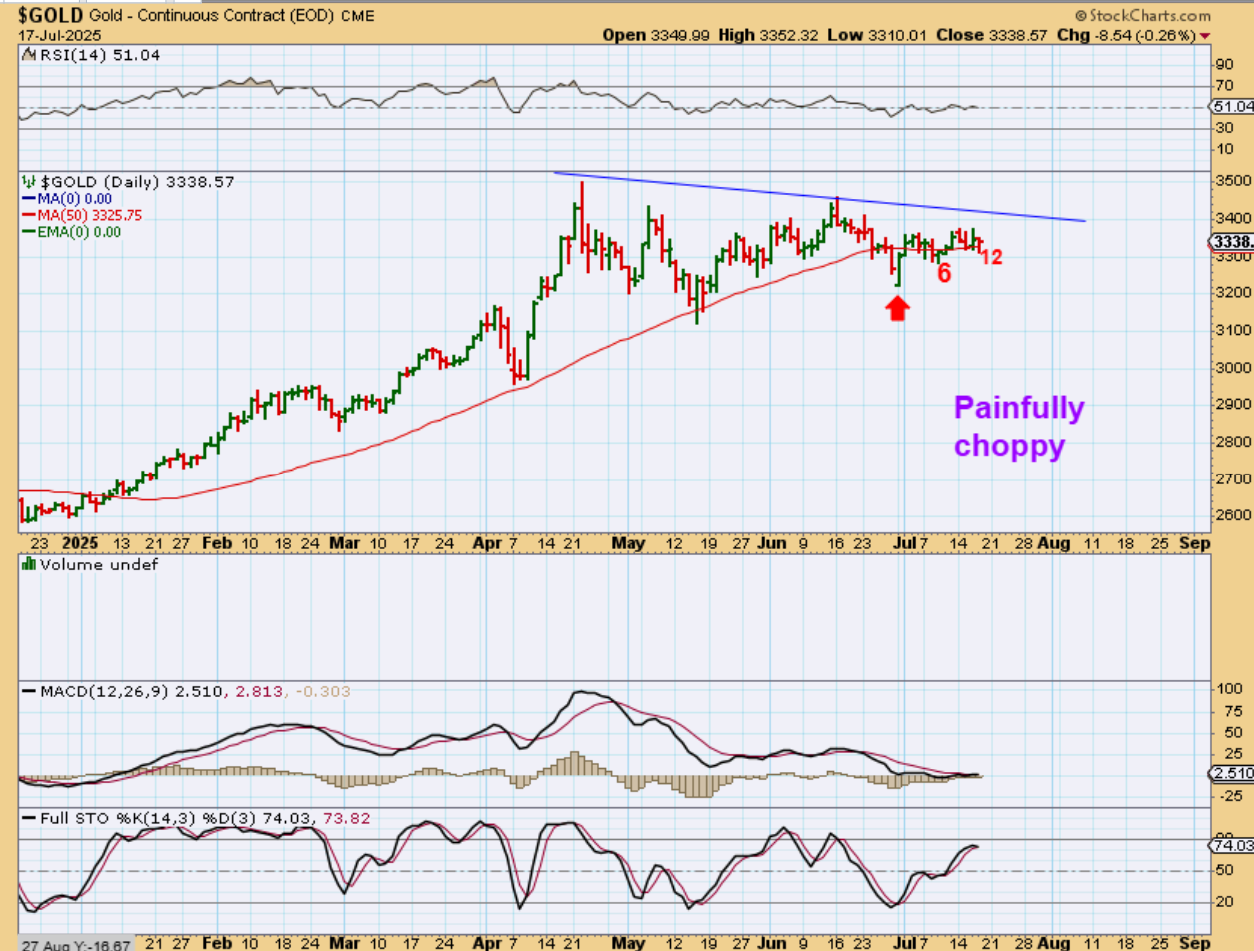
GOLD is still just a sideways choppy pattern. On day 12, we need to see movement upward sooner than later, since ‘time’, more often than not, plays into the strength of a daily cycle.
.
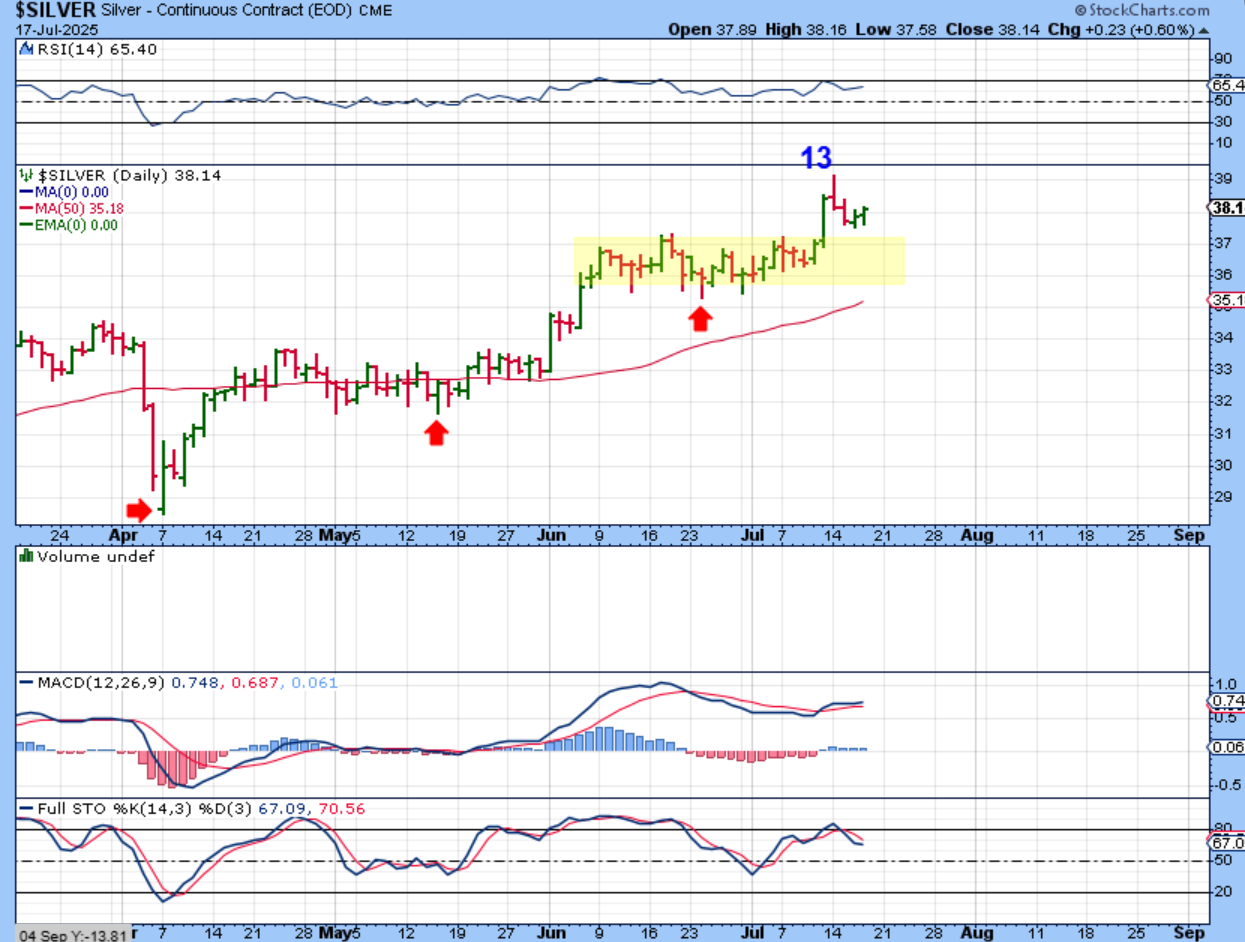
SILVER still looks bullish, even with the sideways chop that it has been putting in. That has actually given the MACD time to flatten and turn up with price. MY only SLIGHT concern was that Silver turned up like this yesterday and many Silver stocks did not go green. EXK, AG, MAG, SSRM, ASM turned upward, but stayed Red, so we’ll see what happens next…
.
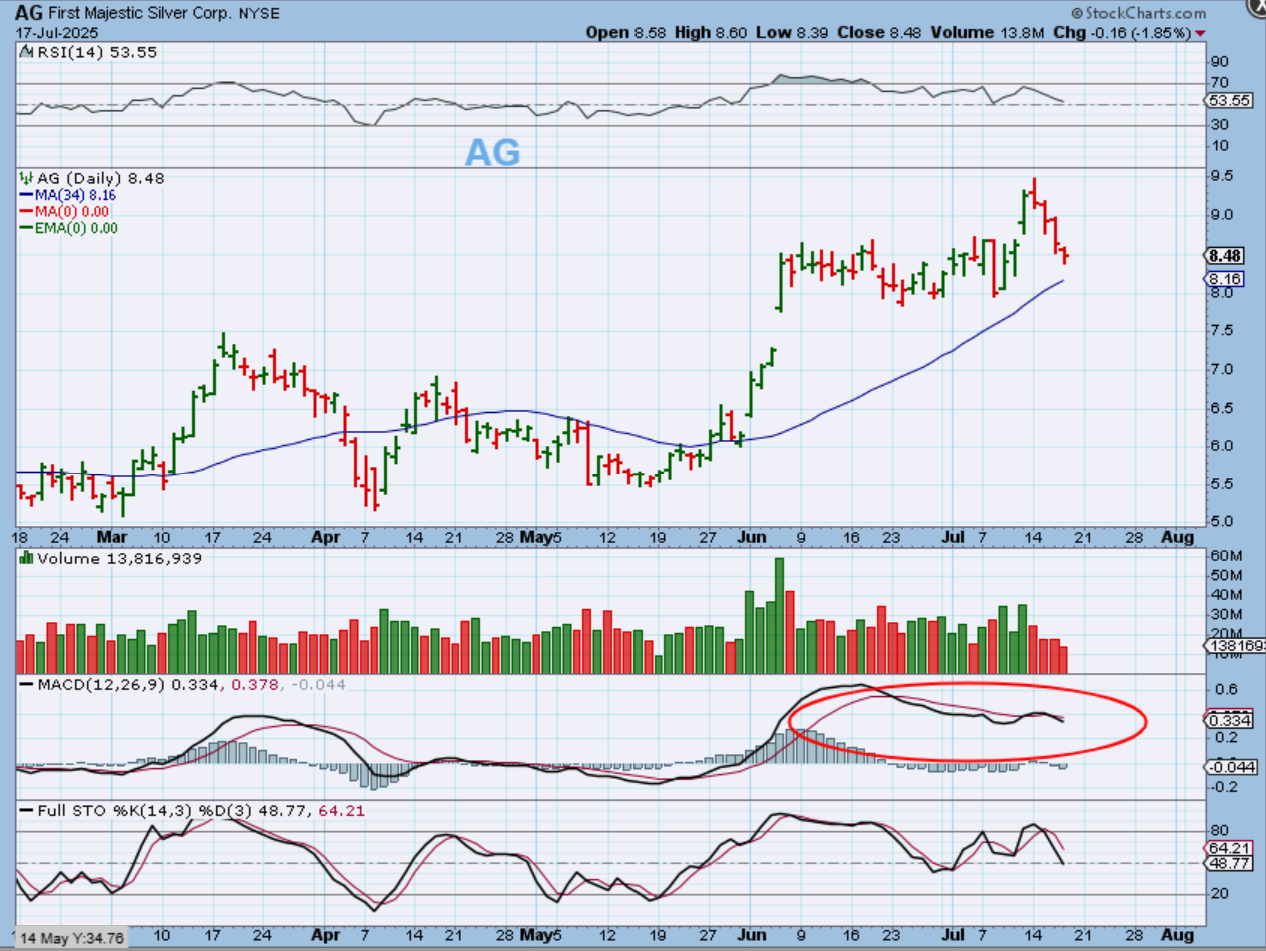
AG started to bounce, but it still dropped almost 2% and the MACD is curling over, so it needs upside price action soon, in my opinion.
.
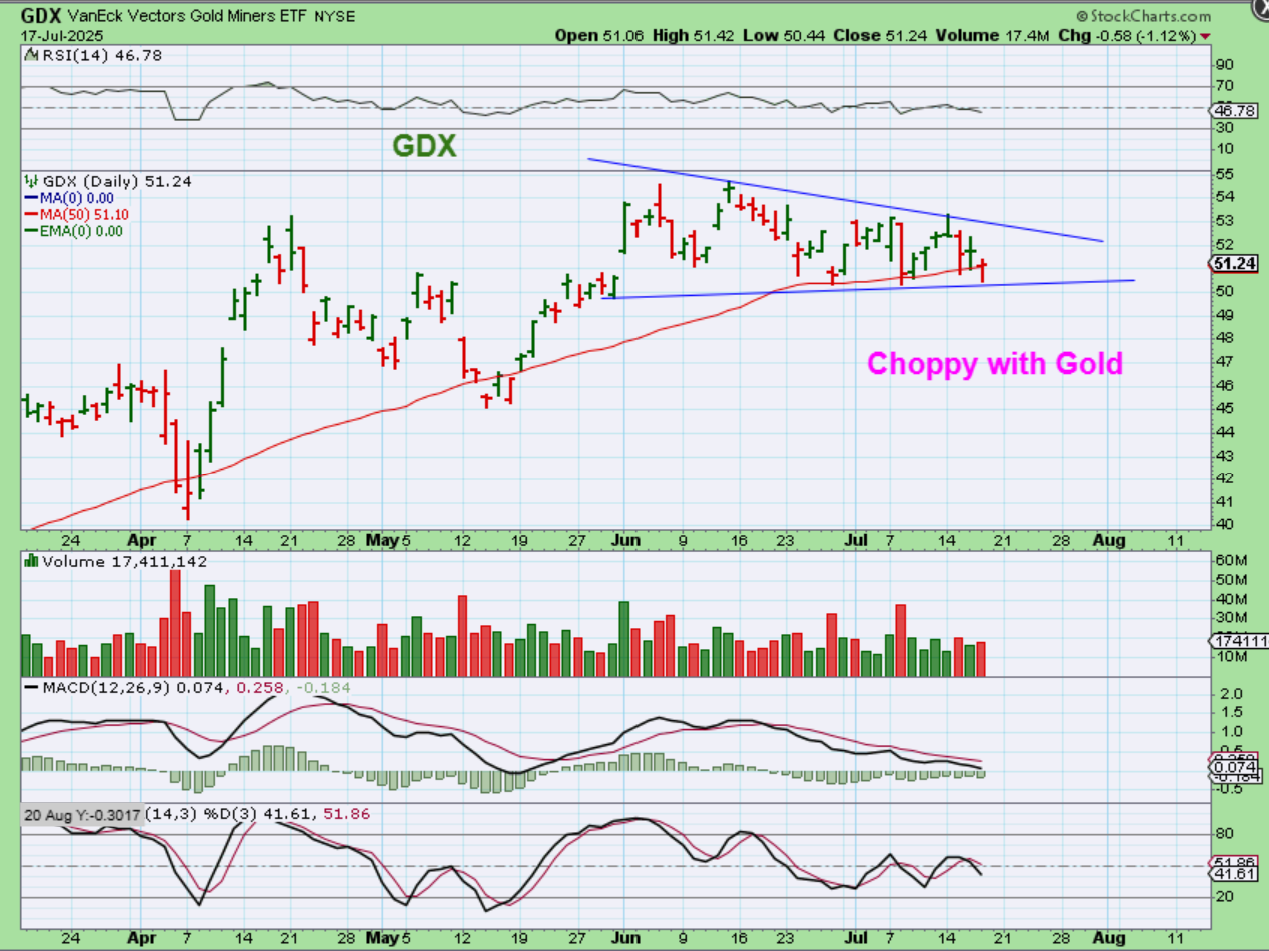
THE GDX also continues to go sideways. It lost and barely regained that 50sma again.
.
So nothing major has changed with the Precious Metals, but as time goes on we really want to start seeing some buying. Why? That would make this a half cycle dip and not a L.T. daily cycle that has already peaked. BOTH of those scenarios are still possibilities at this point.
.
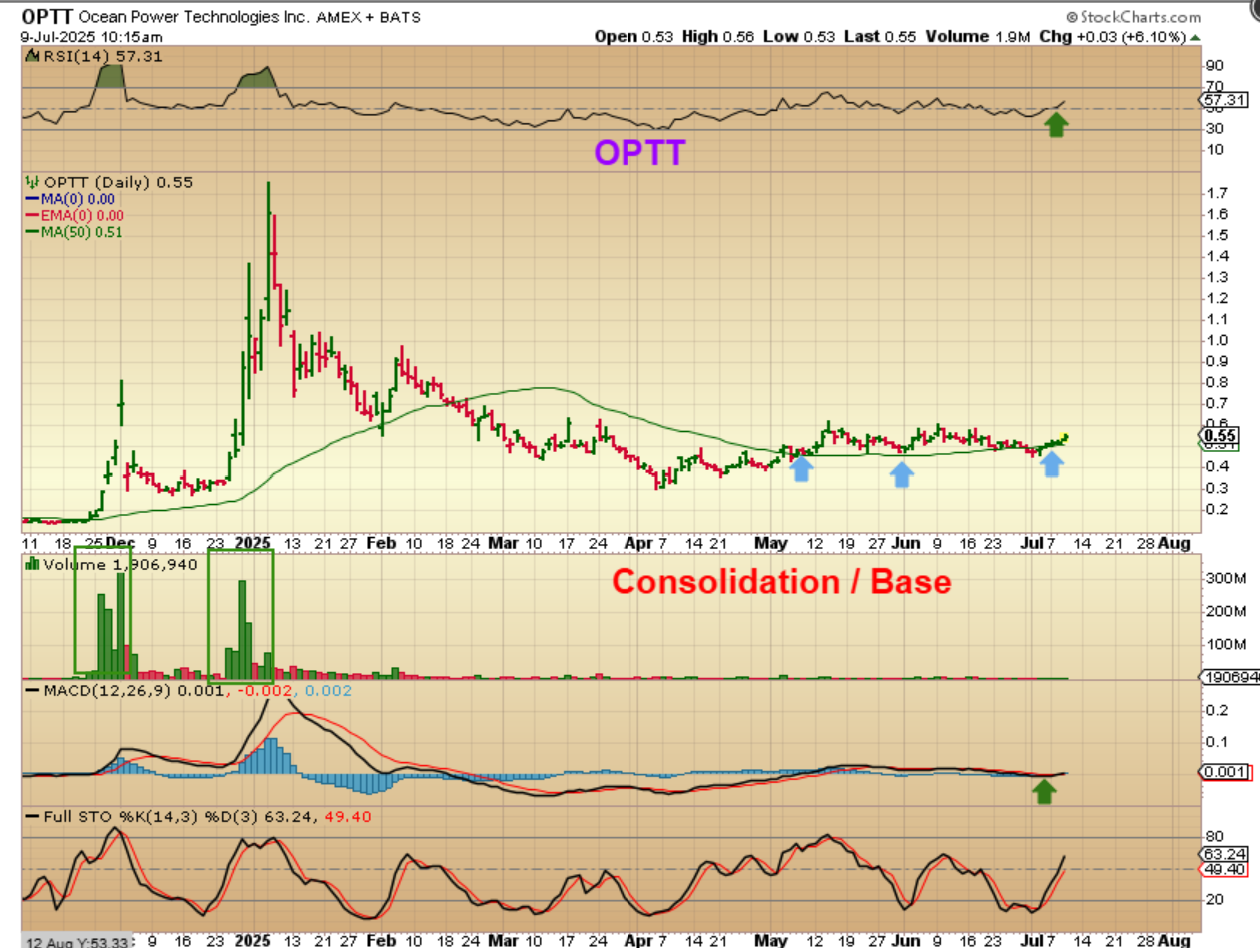
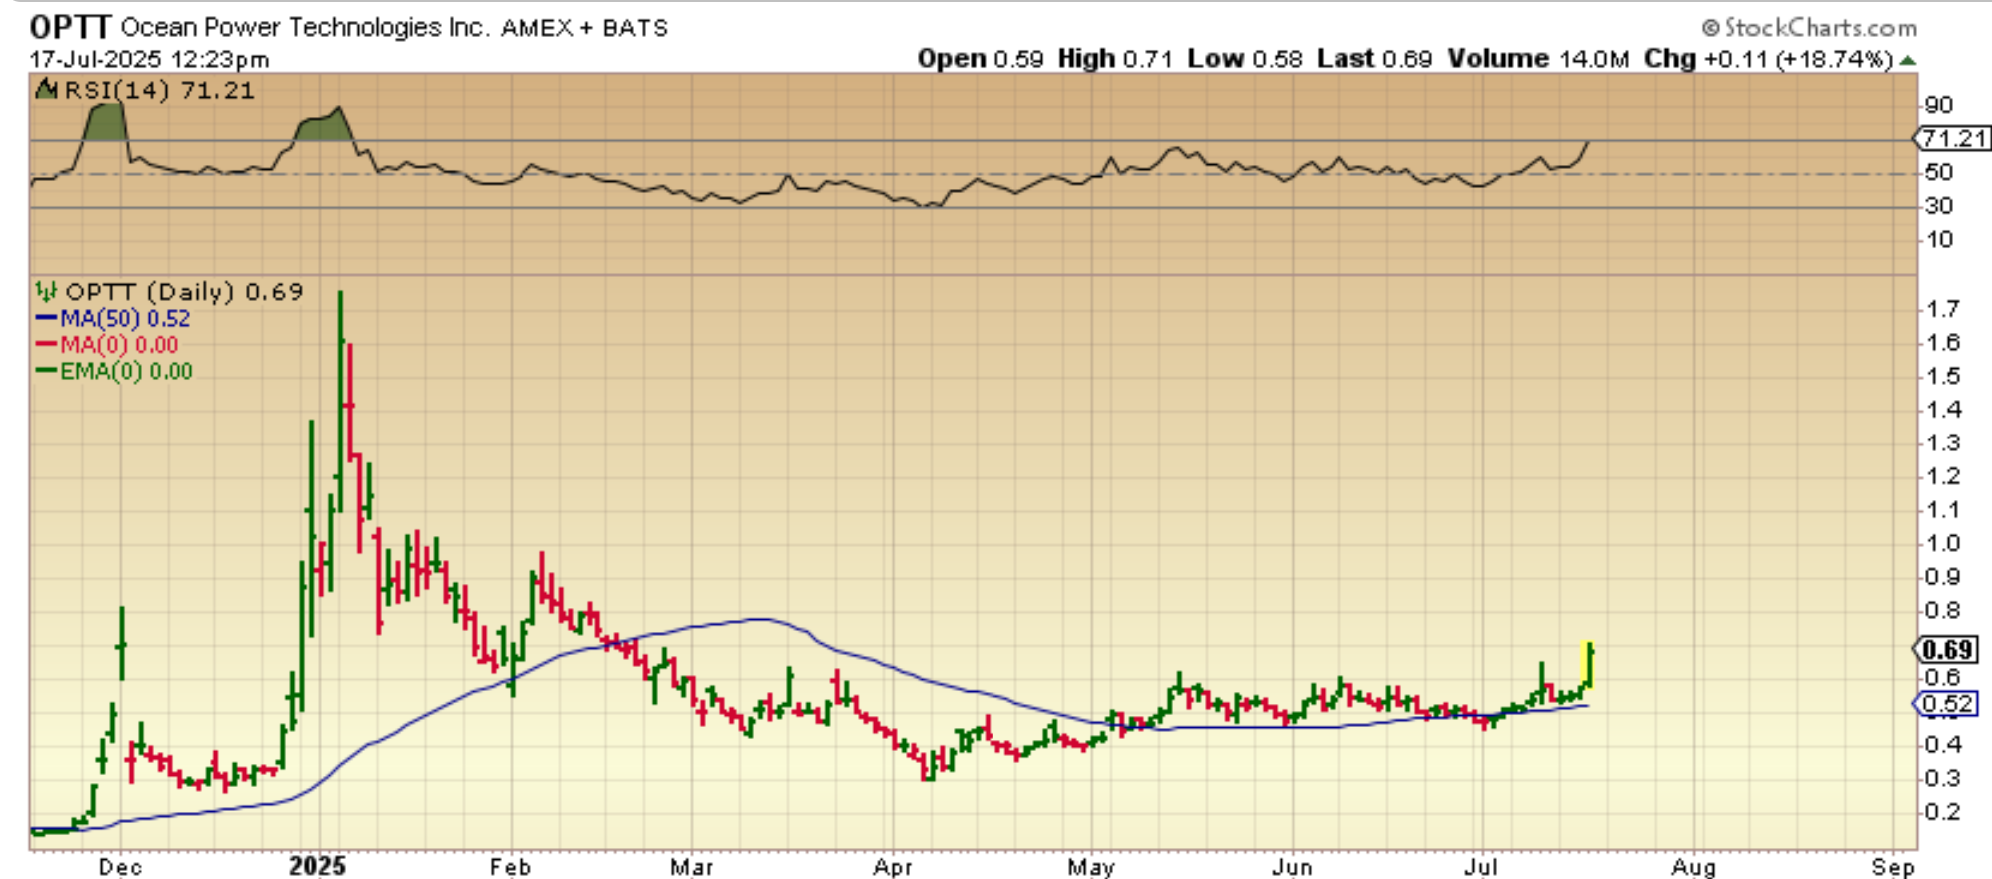
OPTT was a buy on July 9 as it started to curl up on the 50sma.
.
OPTT Popped, dipped lower to back-test, and then rallied. It was up over 20% at one point yesterday. Congrats if you bought it, and you can lock in gains if you desire to, but the upside potential is still much higher.
.
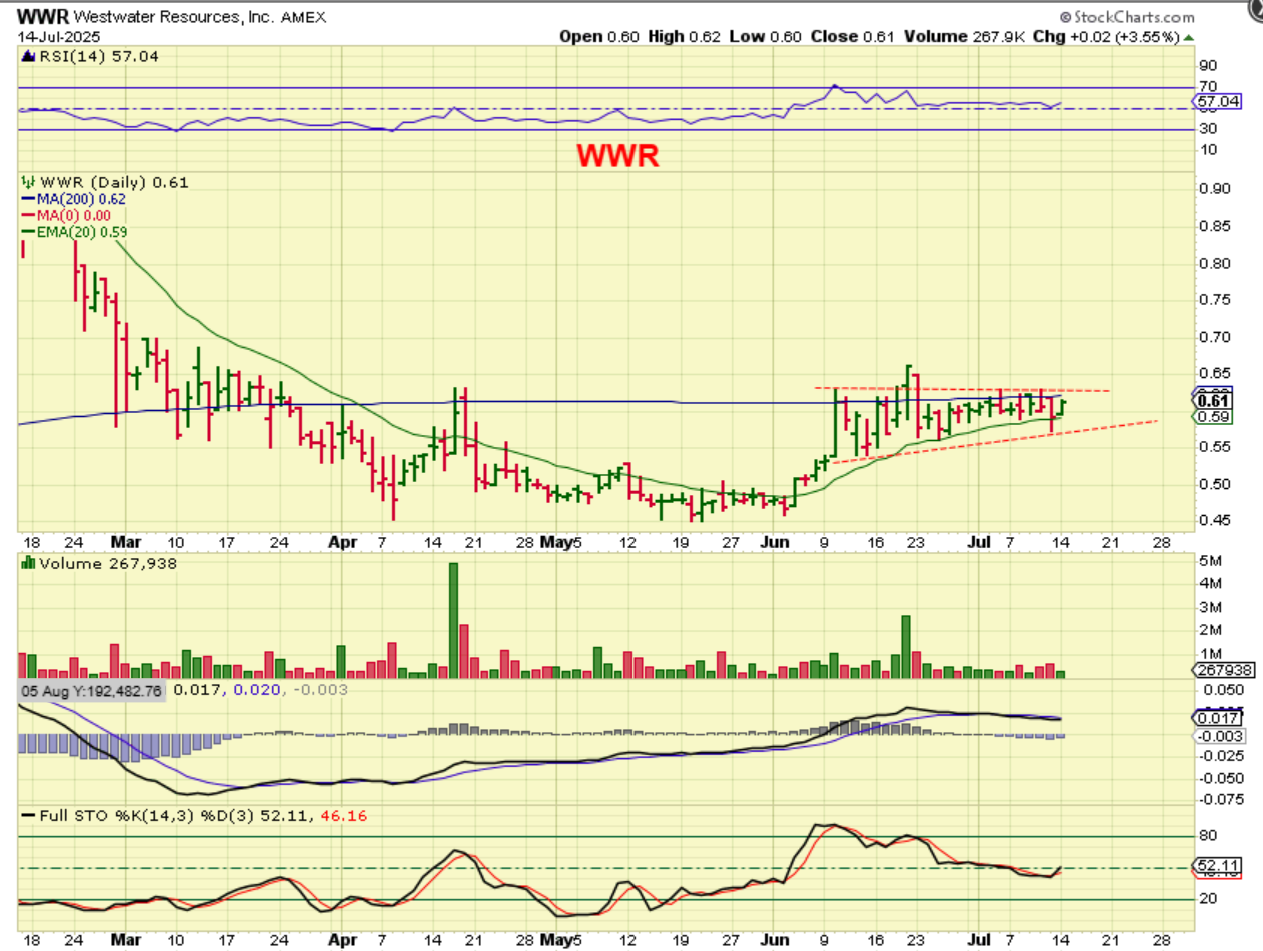
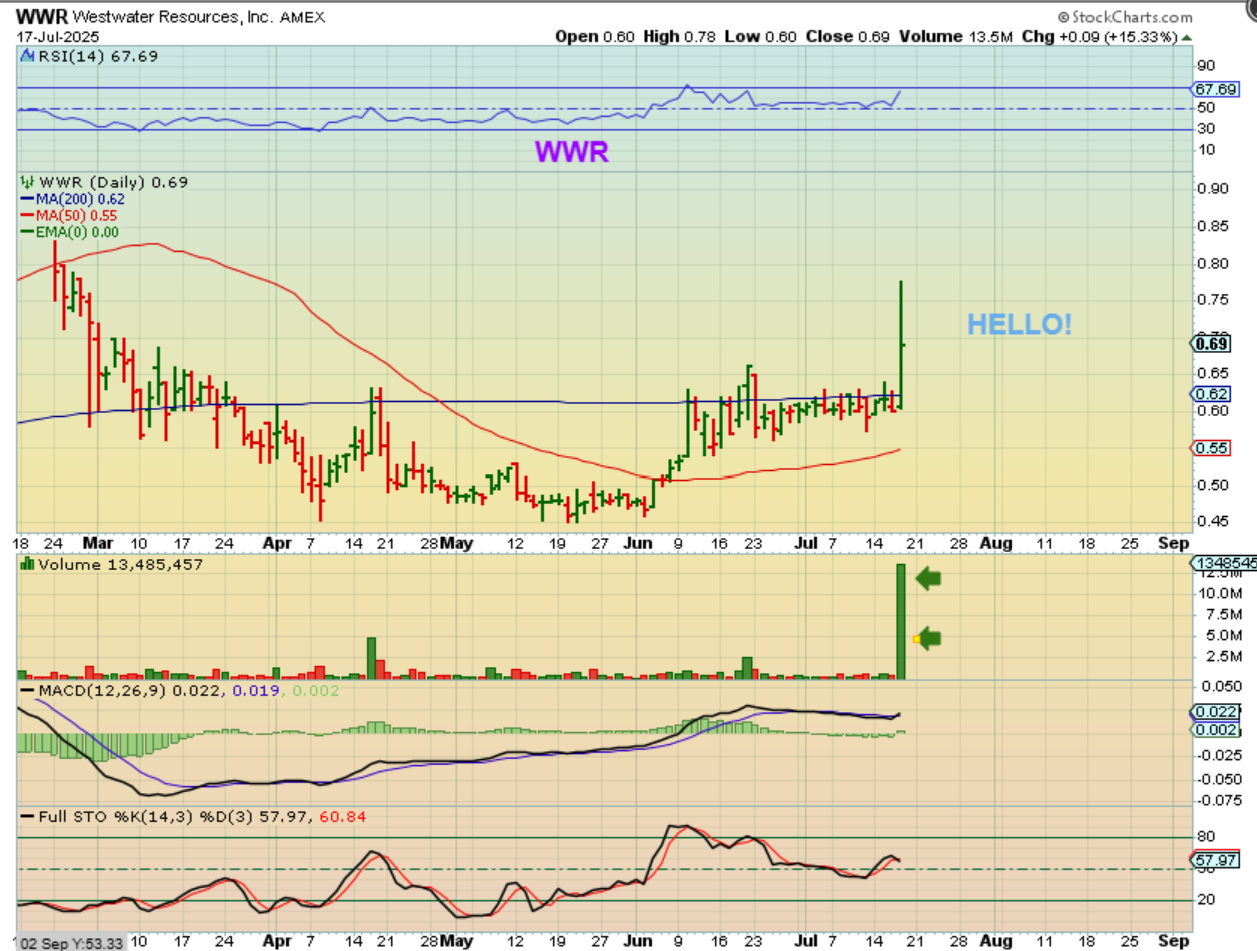
WWR – I pointed out this tight squeeze as a buy and hold with a stop, or buy the breakout. It is a bullish set up in a bullish sector…
.
WWR went BOOM yesterday. The good part was that it was slowly climbing to the 200sma all morning and didnt really break out until midday, so an alert at the 200sma may have allowed entry too.
.
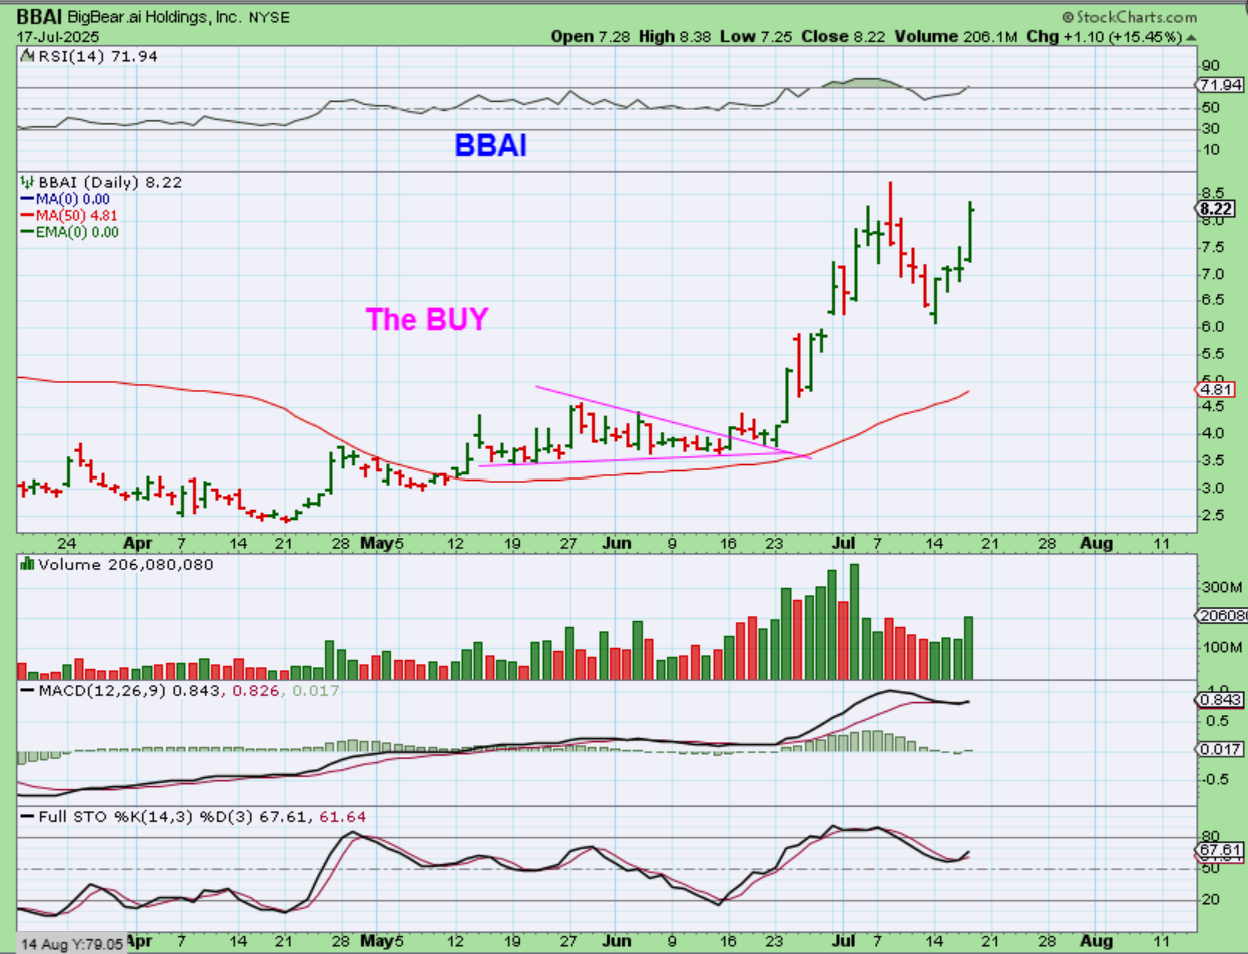
BBAI has been one of our better gainer, since it was pointed out in June and took off. The AI Sector has good set ups, so…
.
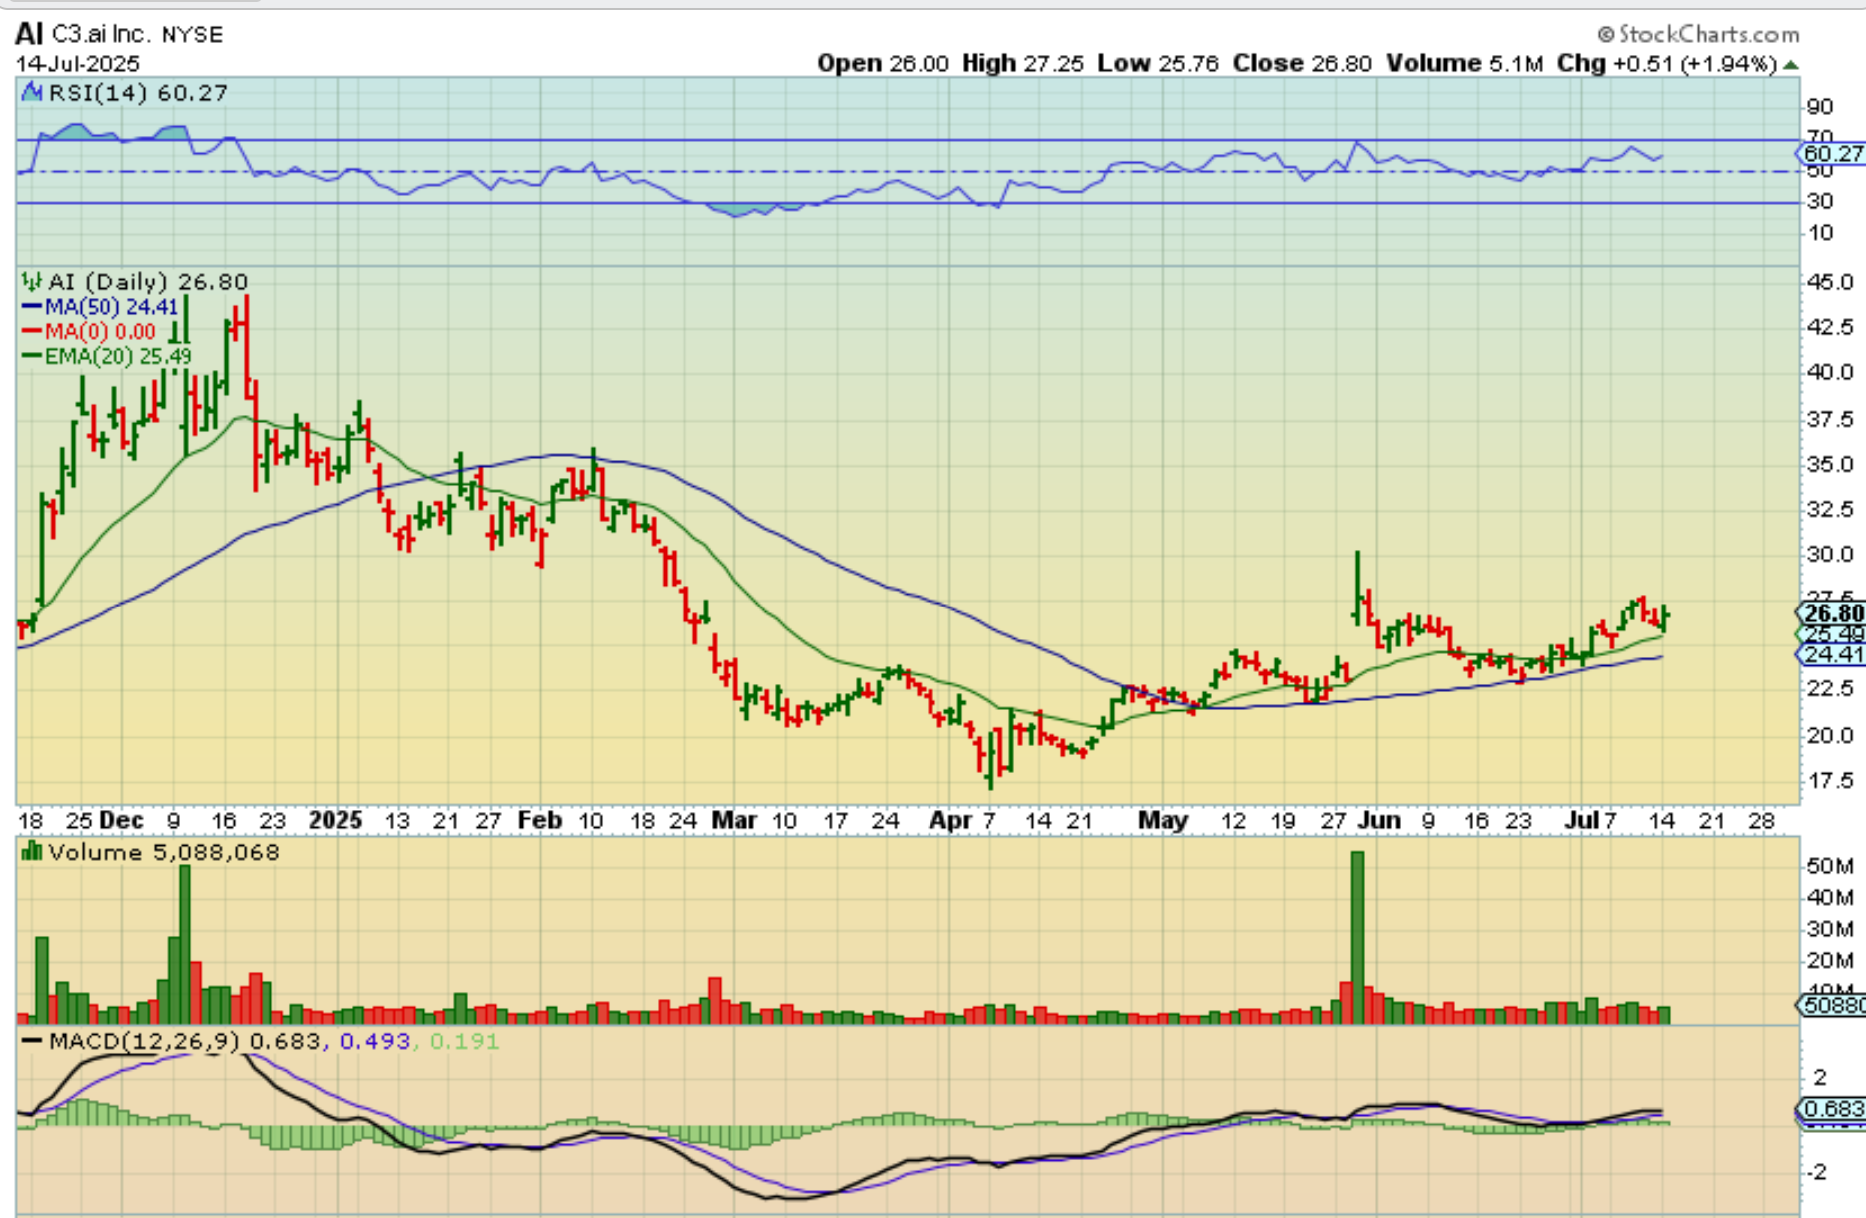
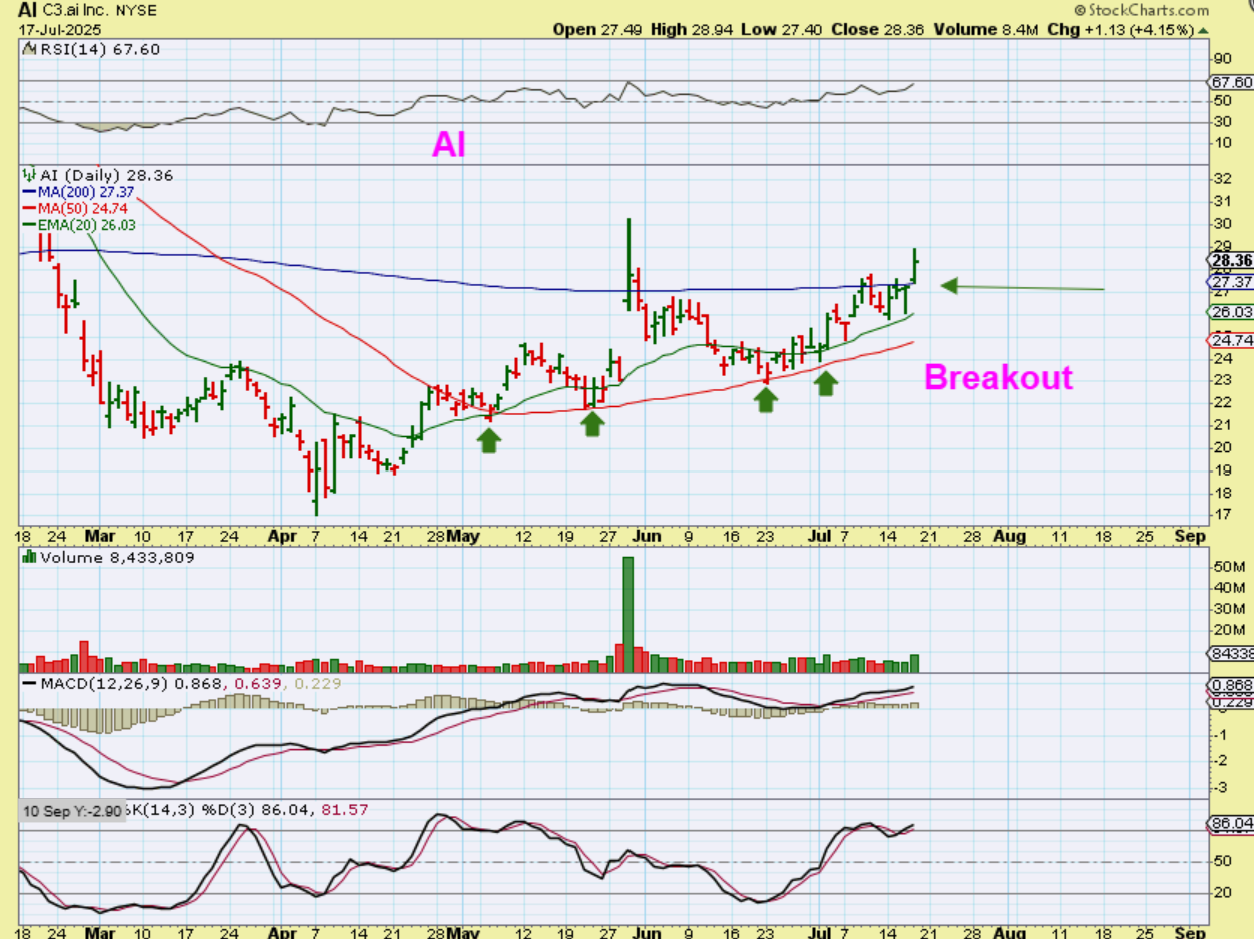
So I mentioned on July 14 that AI was a bullish set up climbing higher above the 50sma and the 20 ema, under the 200sma.
.
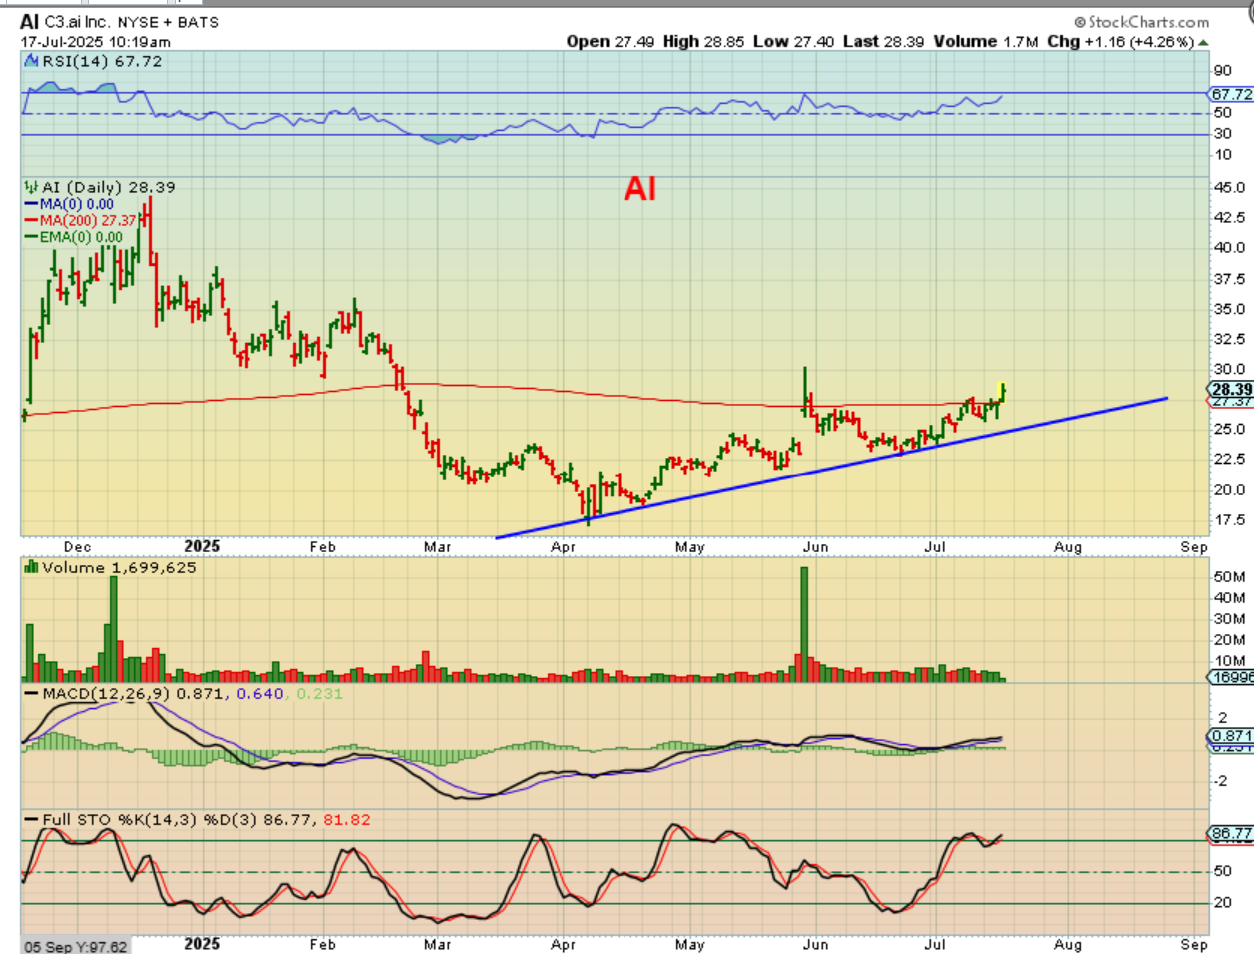
AI broke out yesterday in the first hour, so I posted this chart.
.
AI at the close: It wasn’t a huge 10% 1-day gainer like BBAI, SOUN, and GFAI have had, but a day like that could be ahead after a breakout becomes recognized. I would say that this is still a ‘buy’, with a stop at the 200sma too.
.
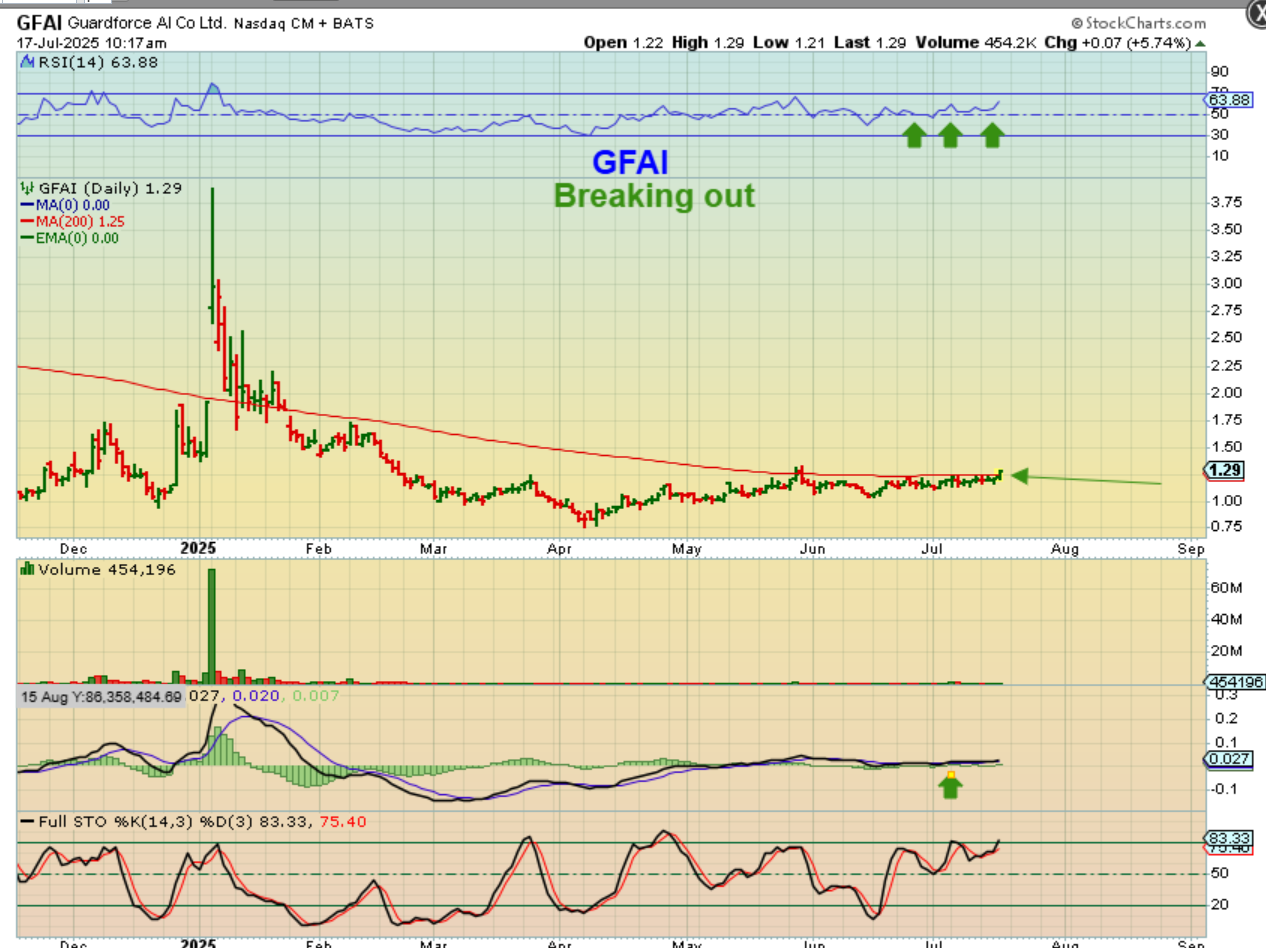
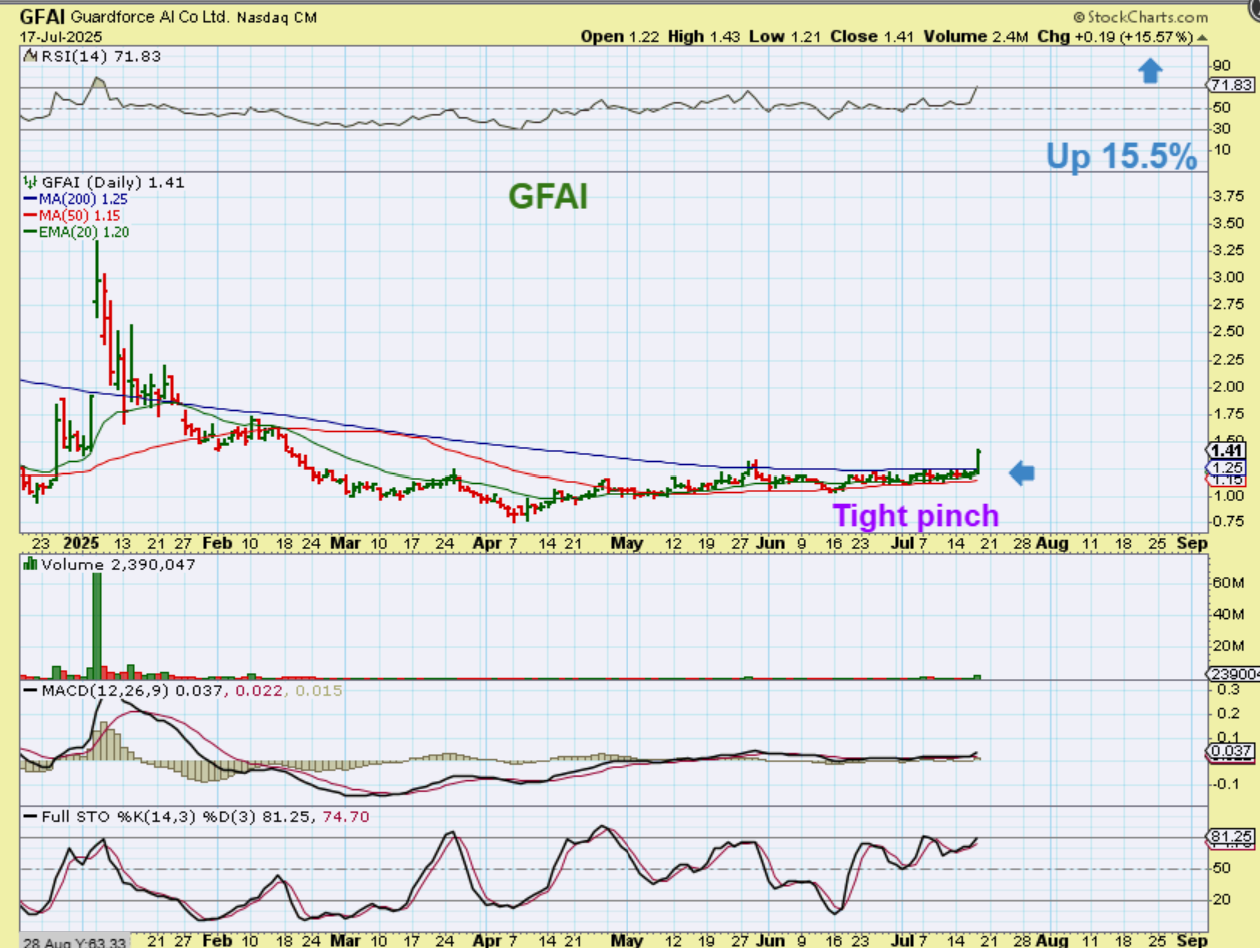
GFAI was pointed out in the first hr of trading too, because it was a long base breaking that 200sma (same AI Sector).
.
GFAI ended the day with 15.5% gains. You could have done a nice day trade with that, or ‘buy and hold’, since the upside is seen as having good potential over time.
.
I have been pointing out QUANTS for a while, and we saw what happened to RGTI recently.
.
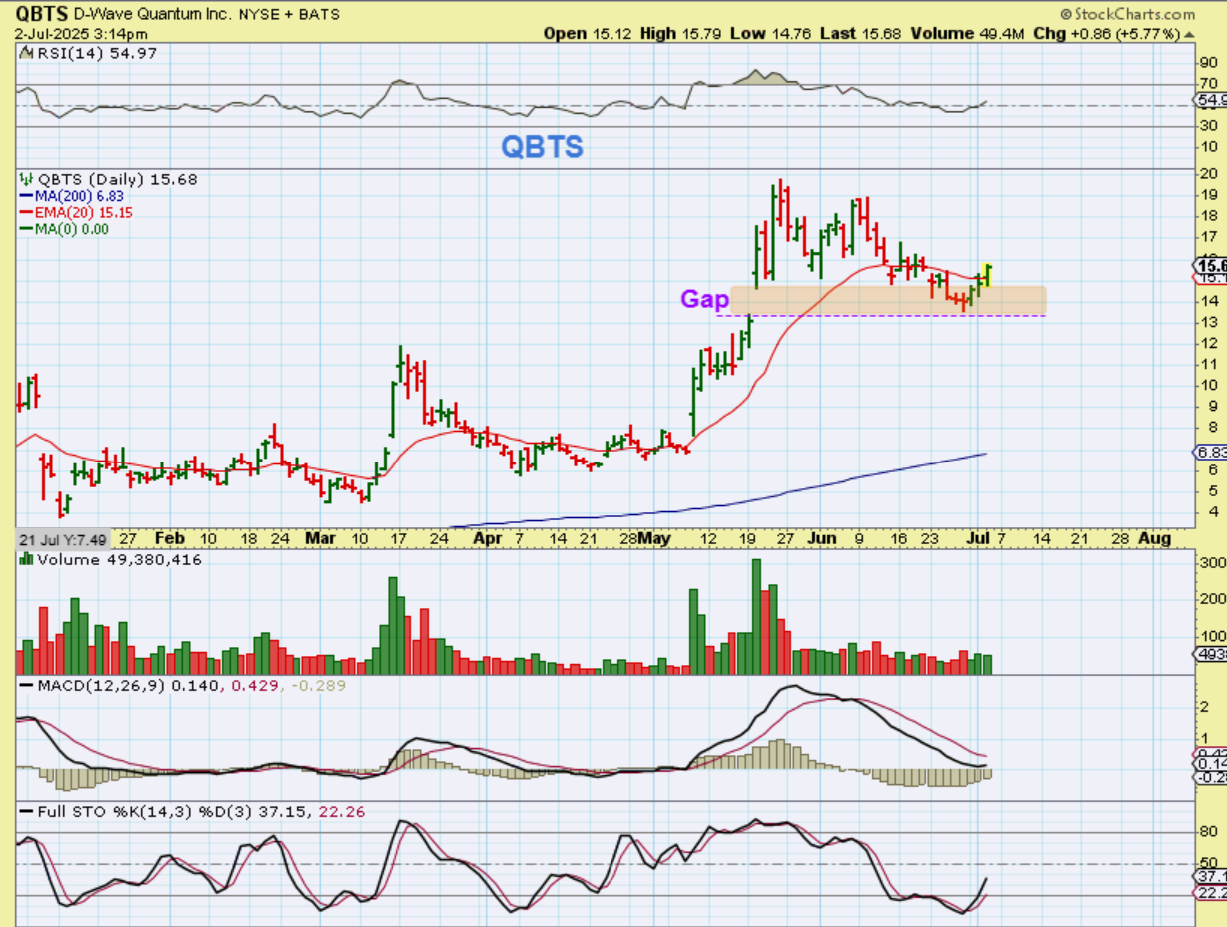
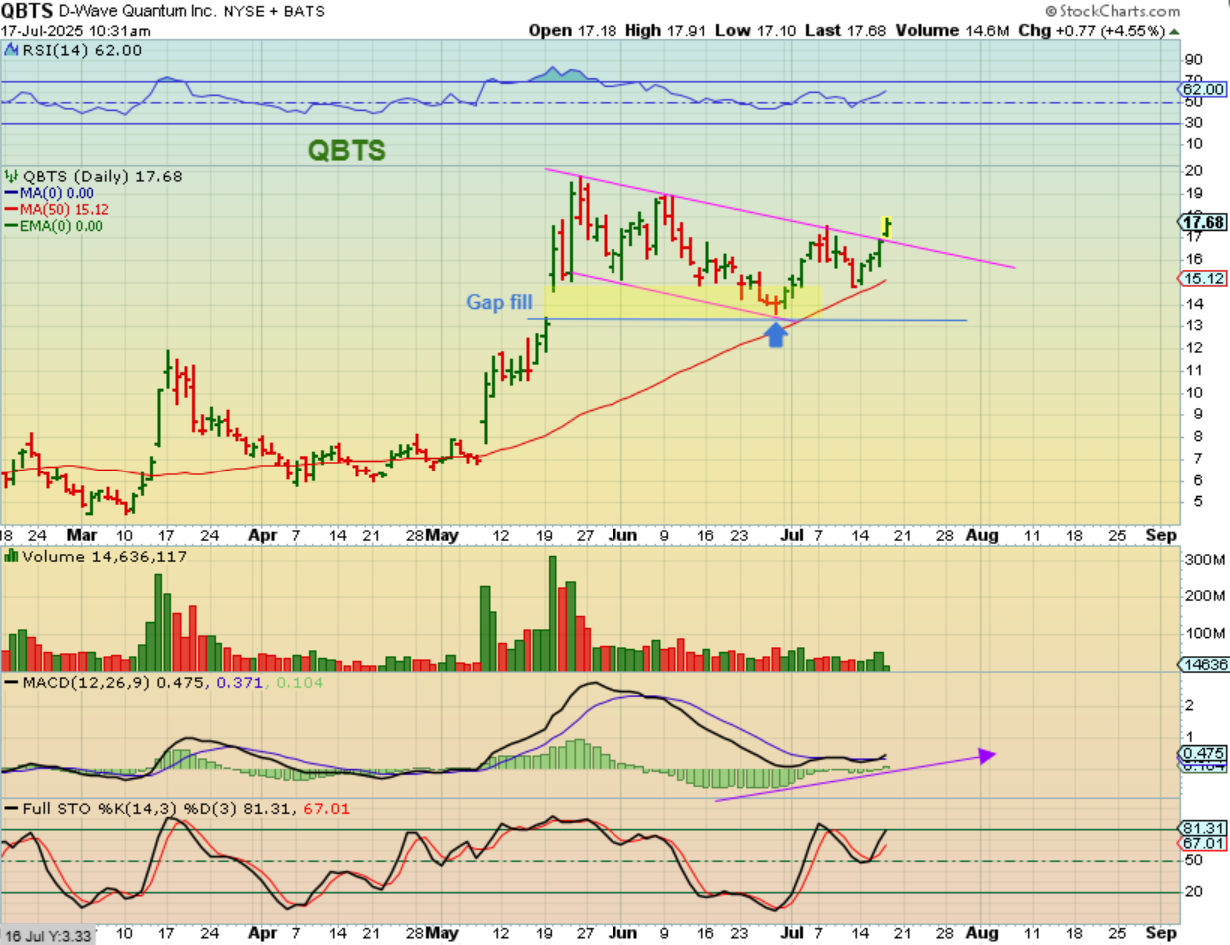
QBTS is the one that filled the gap perfectly and reversed higher as a buy. That gap was at the $13 area…
.
QBTS rallied, pulled back, and broke from a downtrend yesterday at the open. I posted this at 10:30am and you could buy the breakout…
.
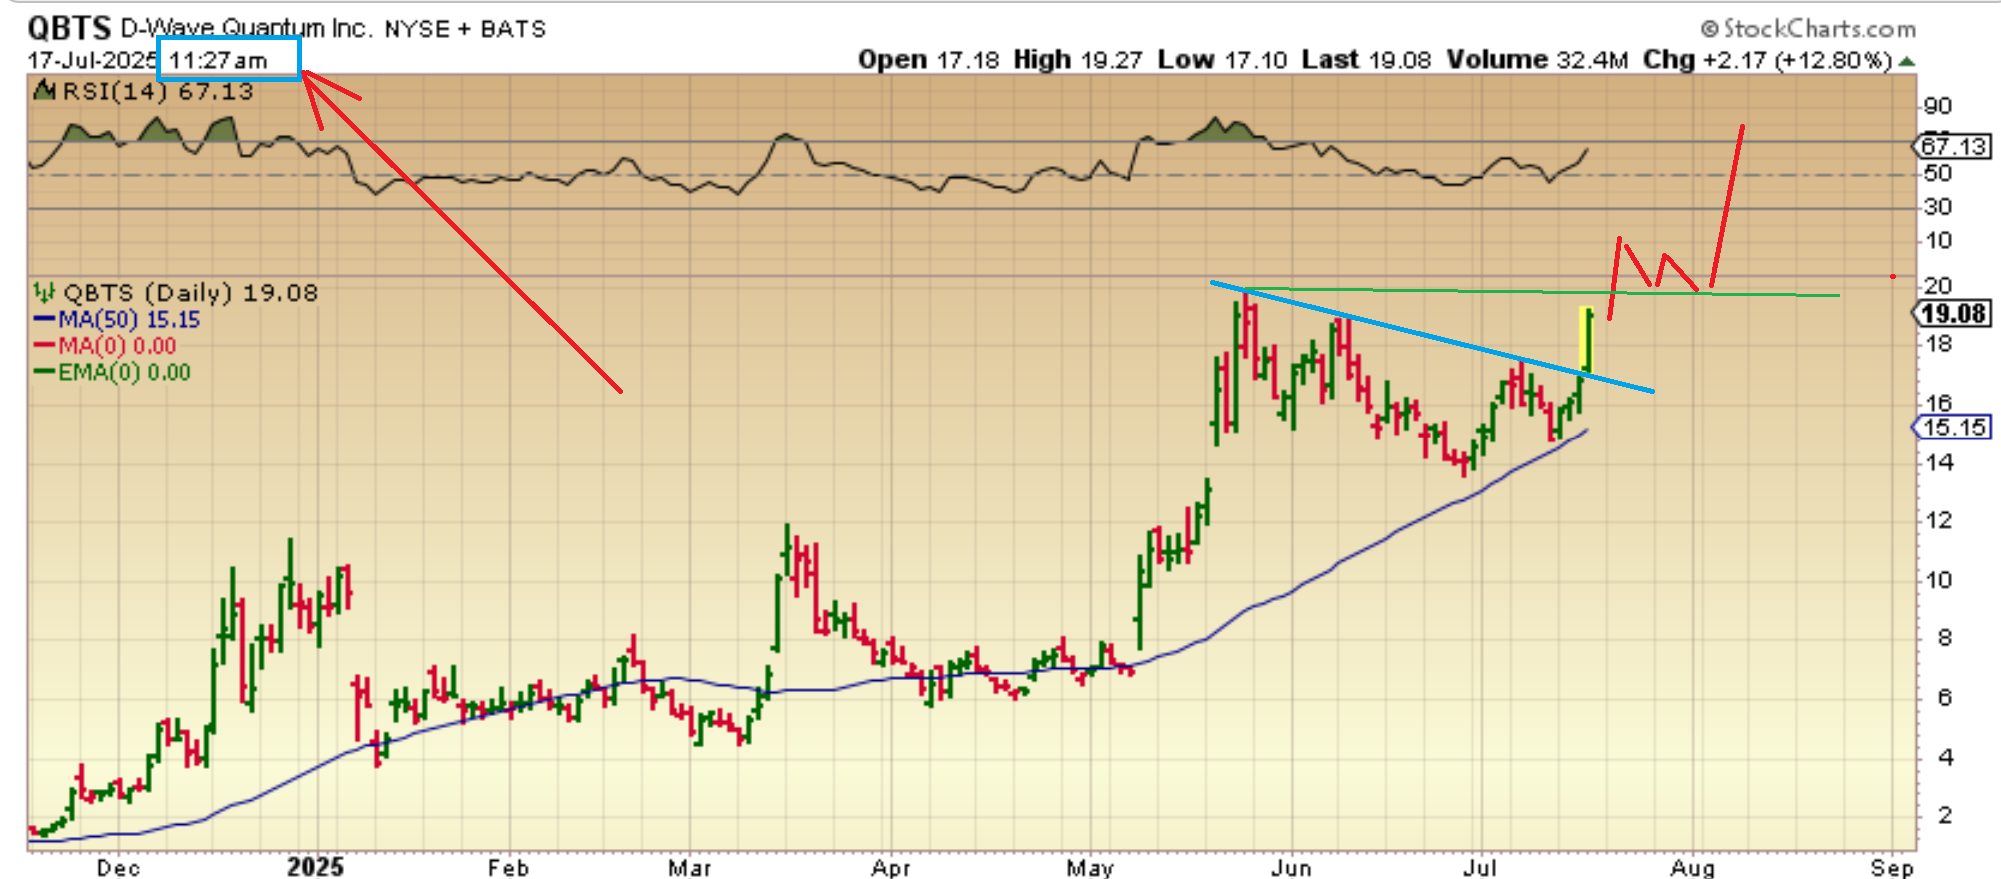
QBTS continued to rally up over 12% in the next hr alone. This chart was 11:30 a.m. It closed up almost 14%
.
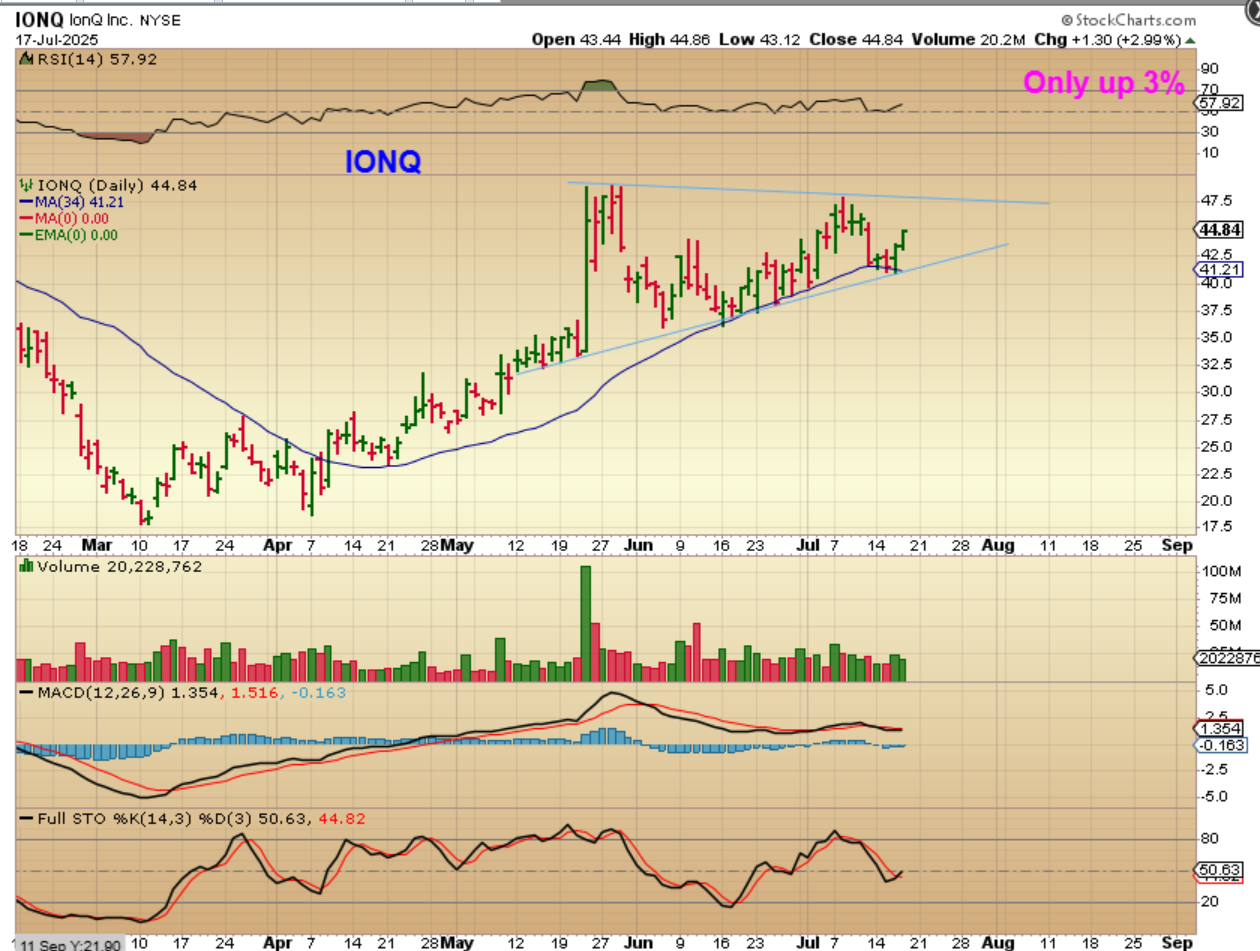
IONQ is what we could call a lagger. It isn’t really doing bad, but these often run up 10-20% in a day and IONQ was only up 3%.
.
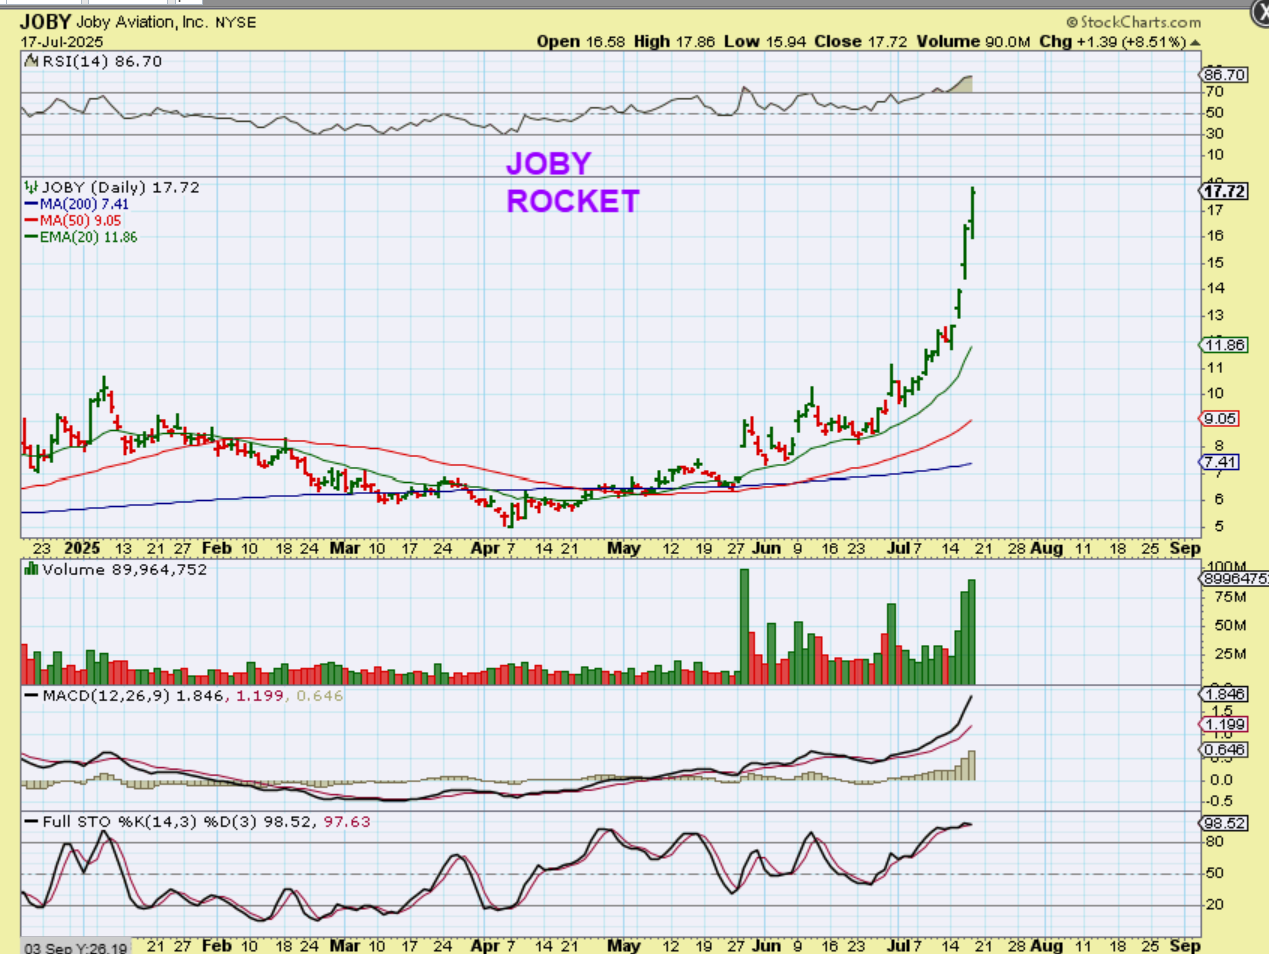
The Aviation or Aerospace sector has been running rapidly. Let’s look at JOBY & RKLB for examples in that area:
.
JOBY was making a nice bullish stairstep higher, but suddenly demand caused it to go parabolic.
.
RKLB was one of my favorites, and it started to just go straight up too, so how are others in this sector doing?
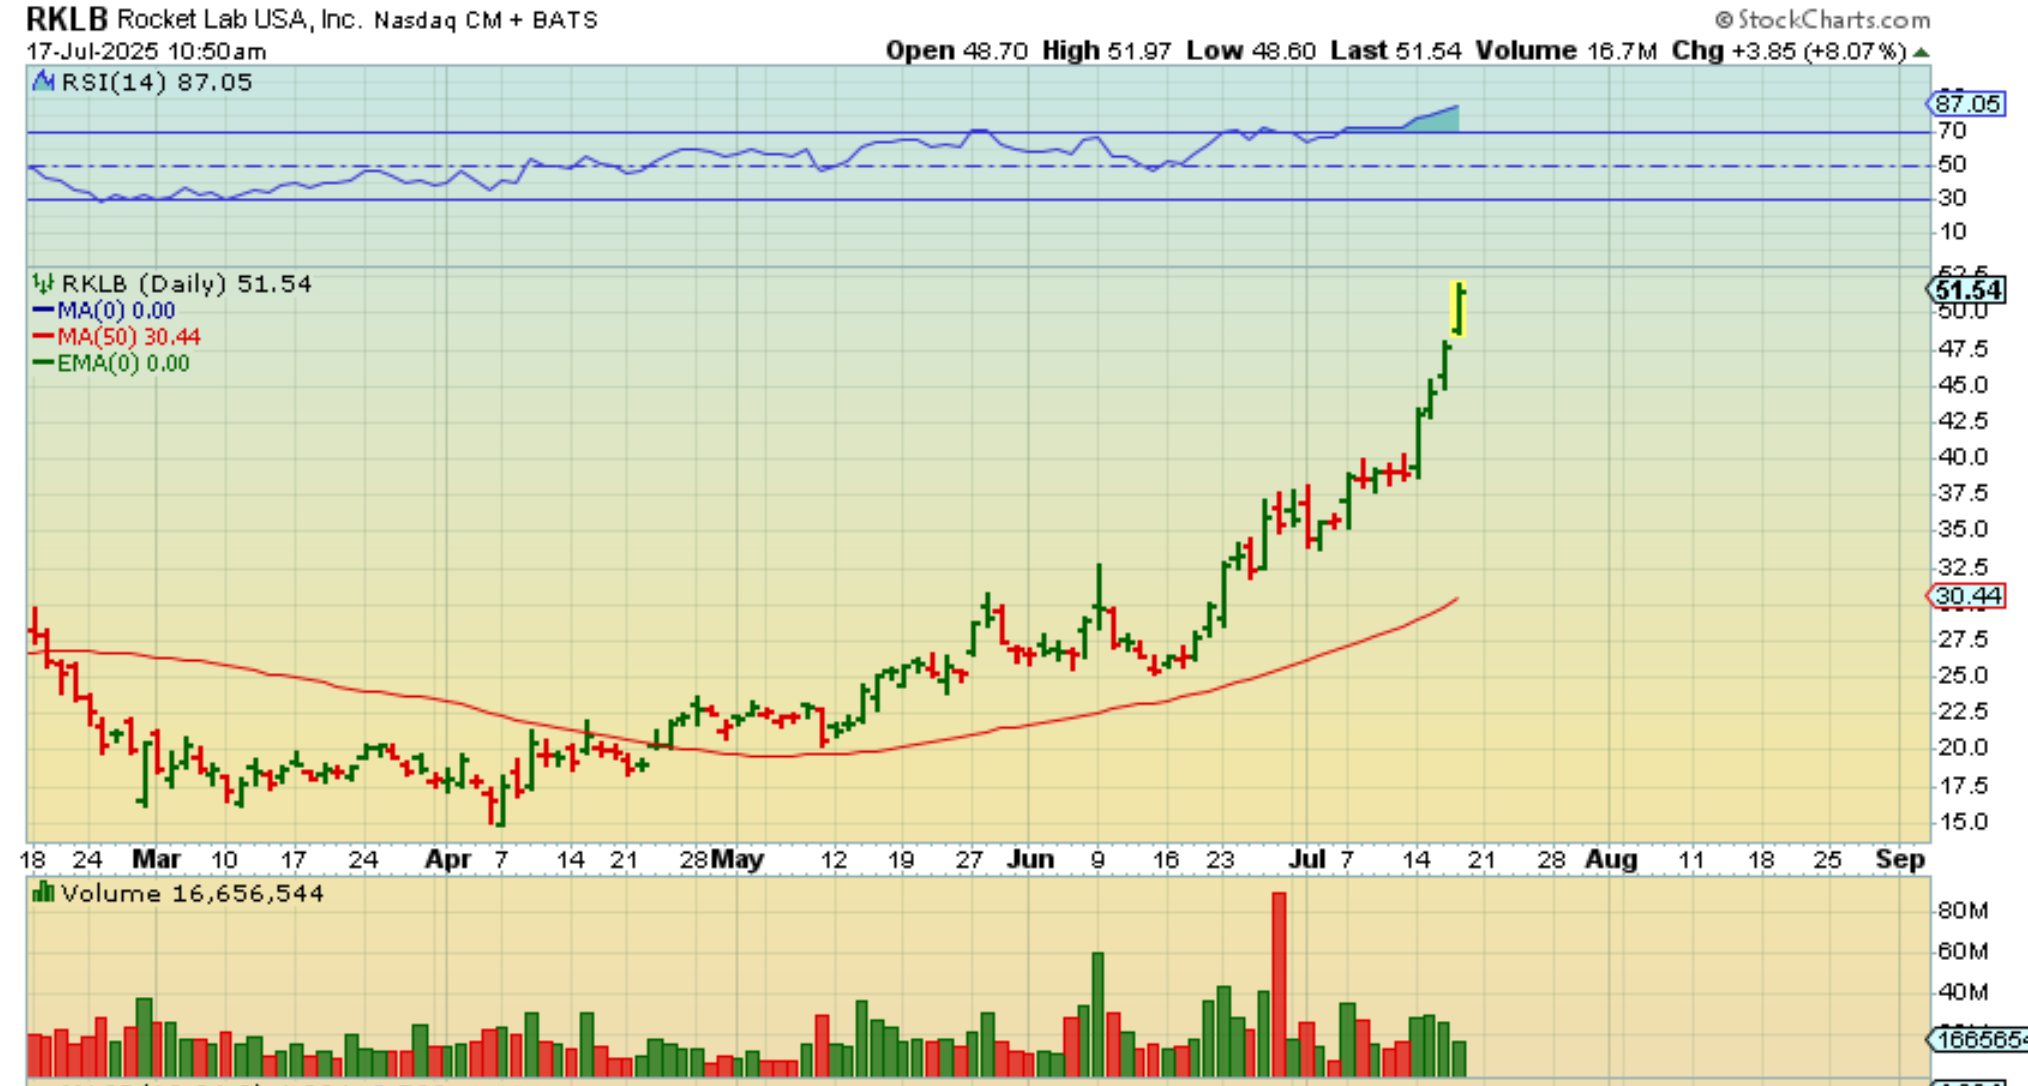
The next 3 patterns are very similar, but ACHR is about 1 or 2 days ahead of the other 2.
.
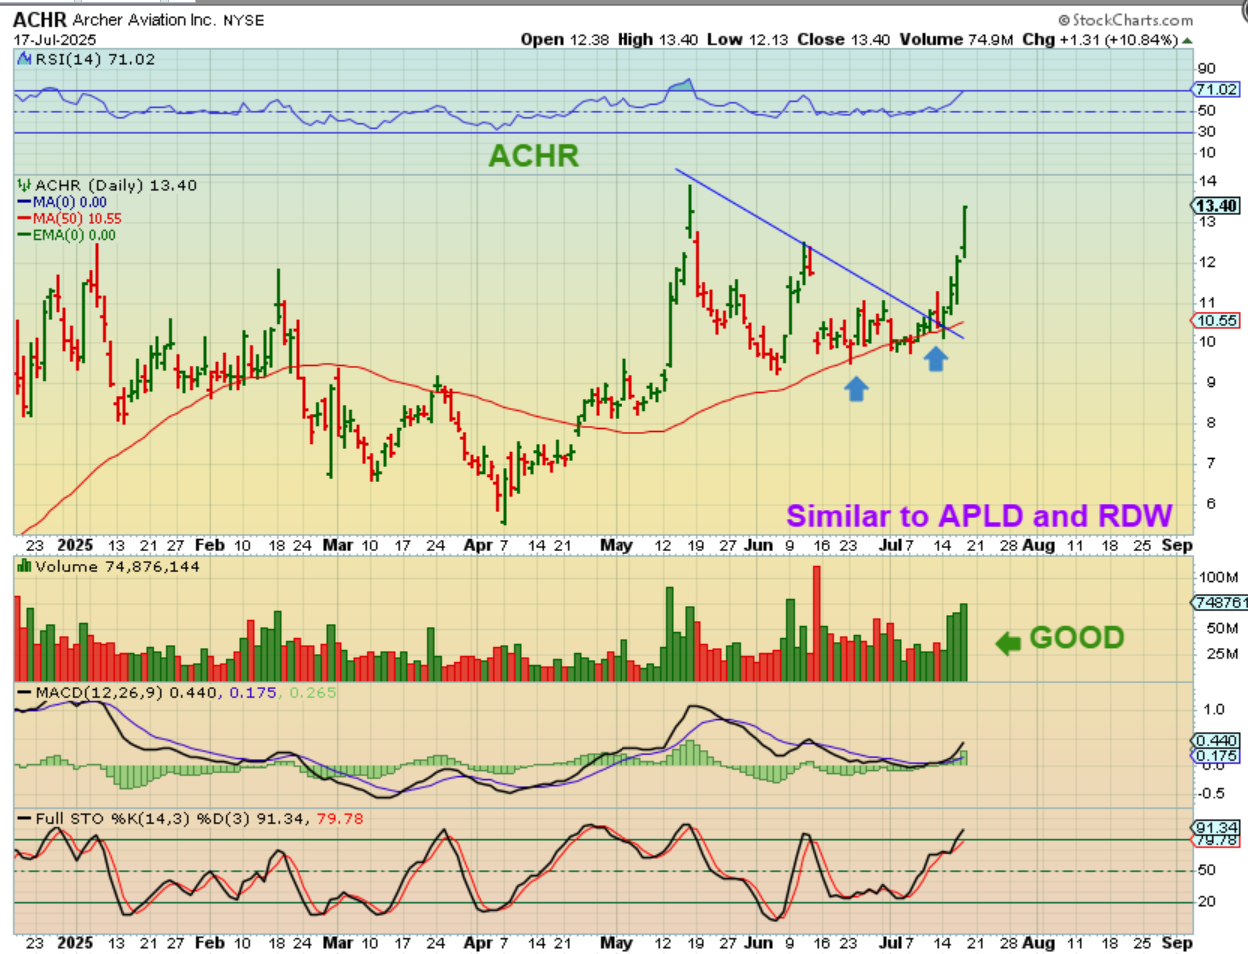
ACHR AVIATION is the leader of a rally from a downtrend break.
.
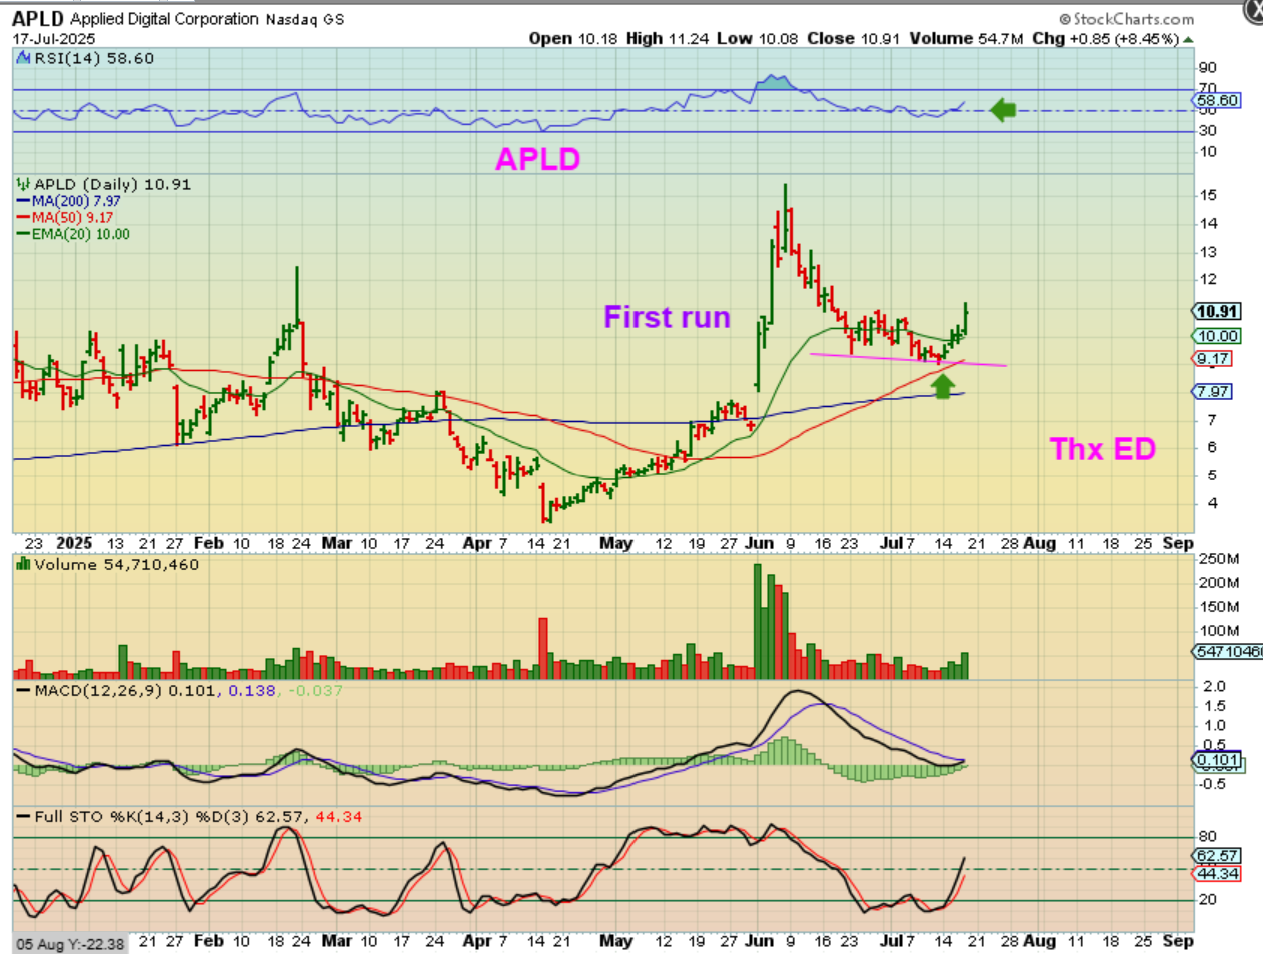
APLD was pointed out by ED, and it has that same pattern, but notice that it is just starting to head higher. A run to prior highs or more is what often happens when buyers step back in.
.
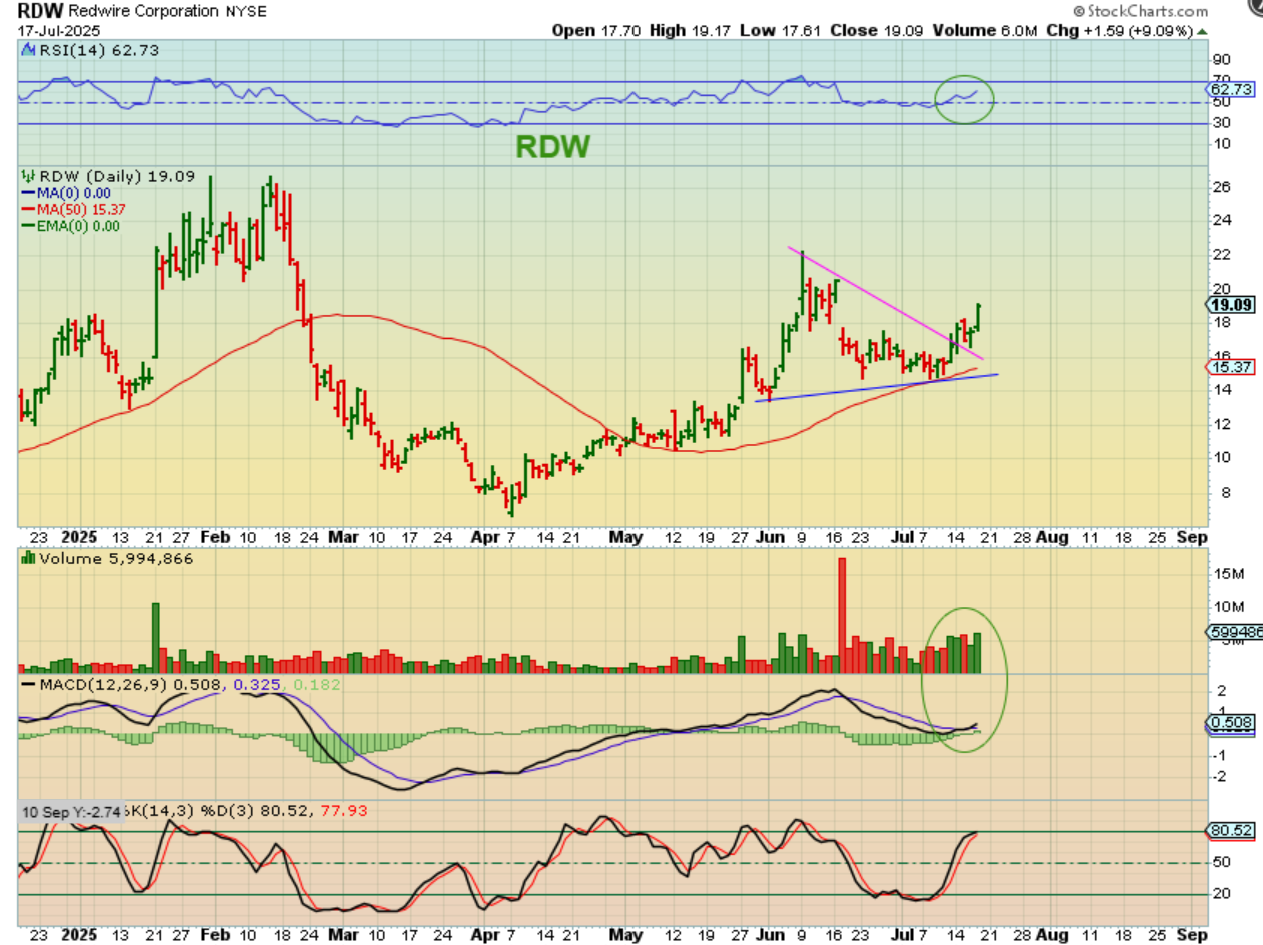
RDW was one that I liked and was on my watchlist, so I mentioned it to ED yesterday when he mentioned APLD. It too is lagging ACHR, but it broke out and looks to be on its way higher in a very similar pattern.
.
What can I say? Yes, the bulls remain in control, but in some areas they are running bulls, and other areas are seeing a pause. It has been a very good week for the general markets and many sectors, hopefully we can close the week with a green Friday too. Enjoy your Friday trading!
.
~ALEX
.
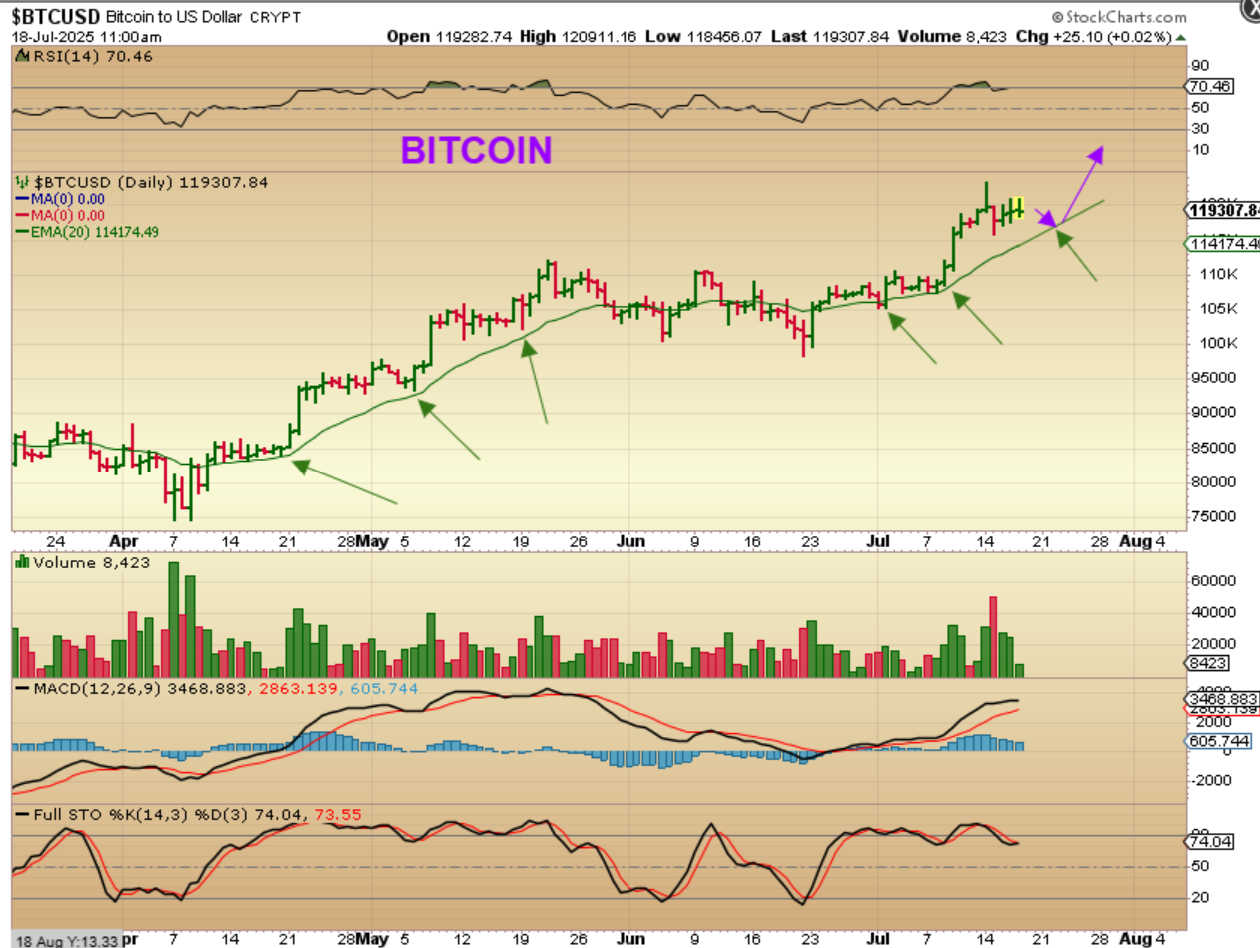
BITCOIN continues churning sideways and it still has time to reach the 20ema and then pop higher. It also doesn’t have to tag that 20ema, it is just something that I could picture happening based on past movement. The Many of the Crypto stocks are holding up and churning sideways along with Bitcoin.
Thursday July 17th 
 July 19th Weekend Review – Bullish Scenery
Scroll to top