Tuesday June 17th – Still Bullish
.
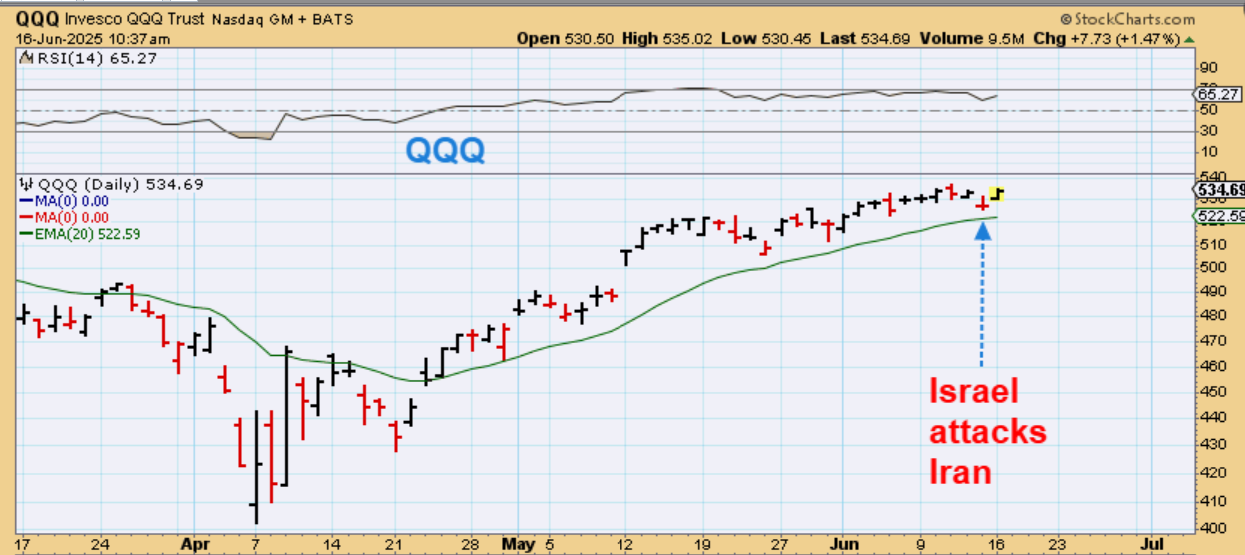
GENERAL MARKETS – On Friday the markets dropped on the news that Israel attacked Iran. Would it be a knee jerk reaction or would it really hurt the markets? So far it was just an immediate reaction. The selling stopped and the markets gapped higher on Monday.
.
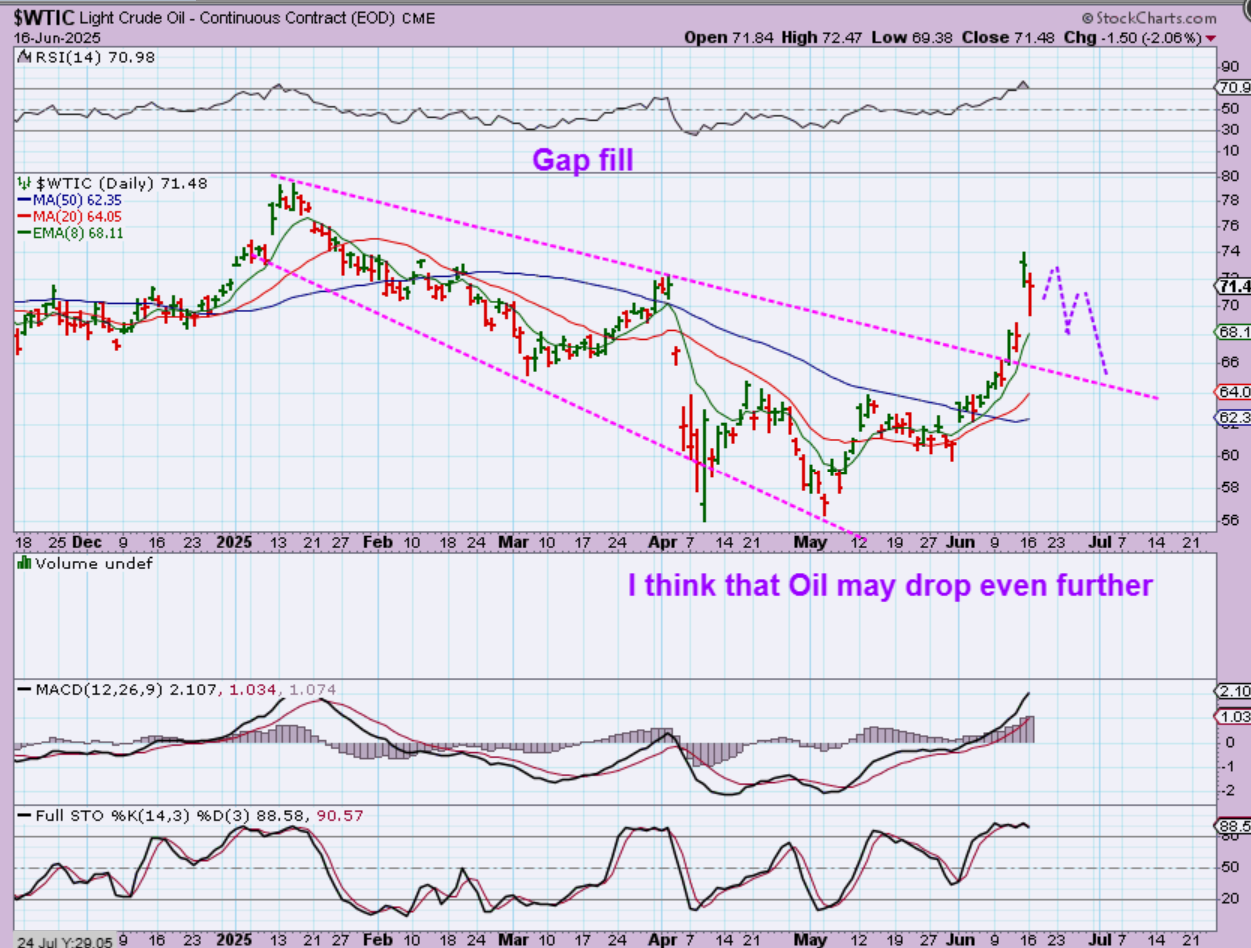
WTIC – We saw Oil gap up 10% with that news and on Monday Oil dropped lower and then started to bounce back. Oil closed down 2% and it could start to sell off lower as shown, even back-testing the trendline that it broke through, or…
.
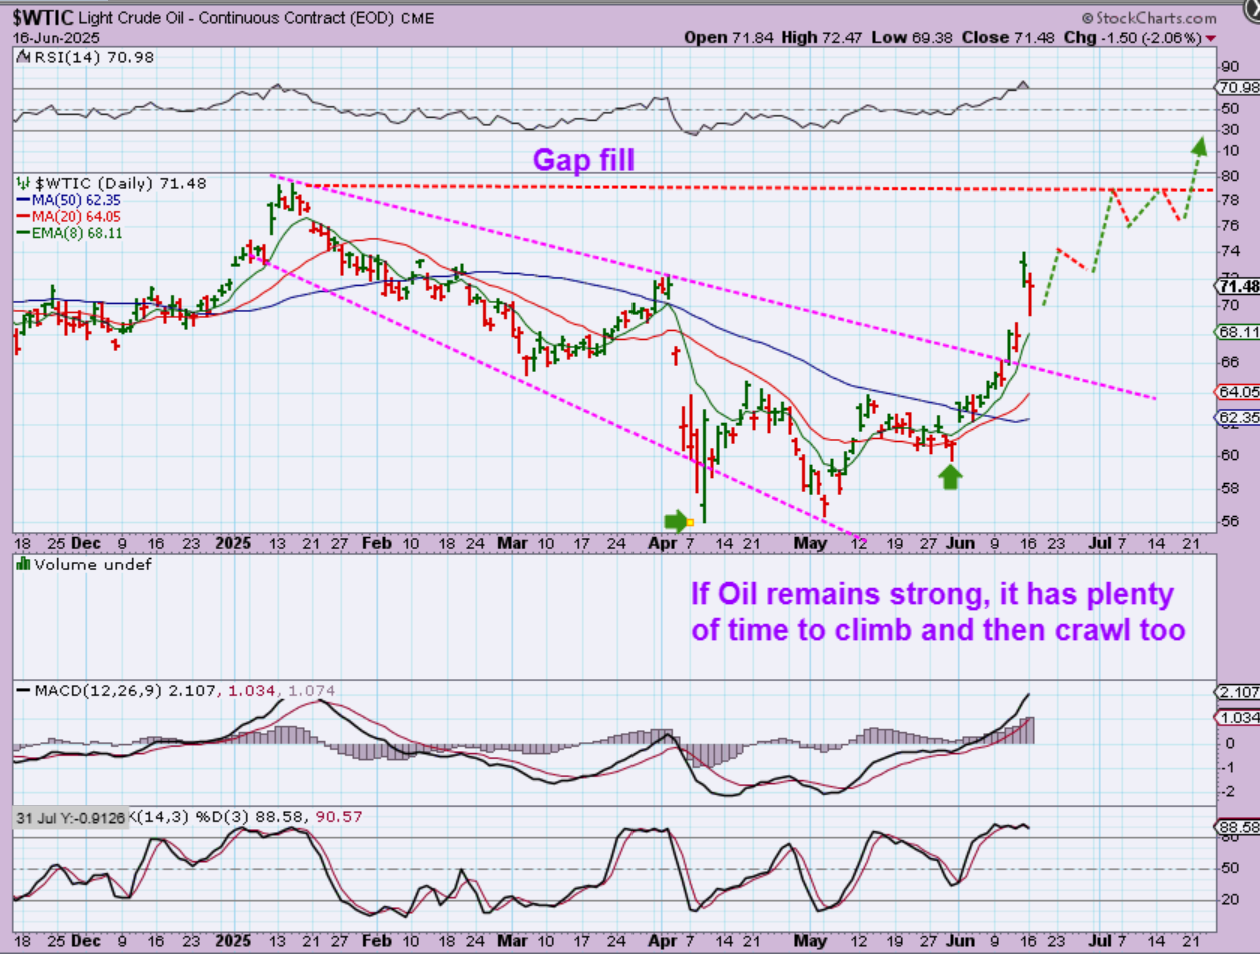
WTIC – If the war continues and Oil production or sales is hindered; we could also see oil prices stay elevated and it could run to prior highs as seen here.
.
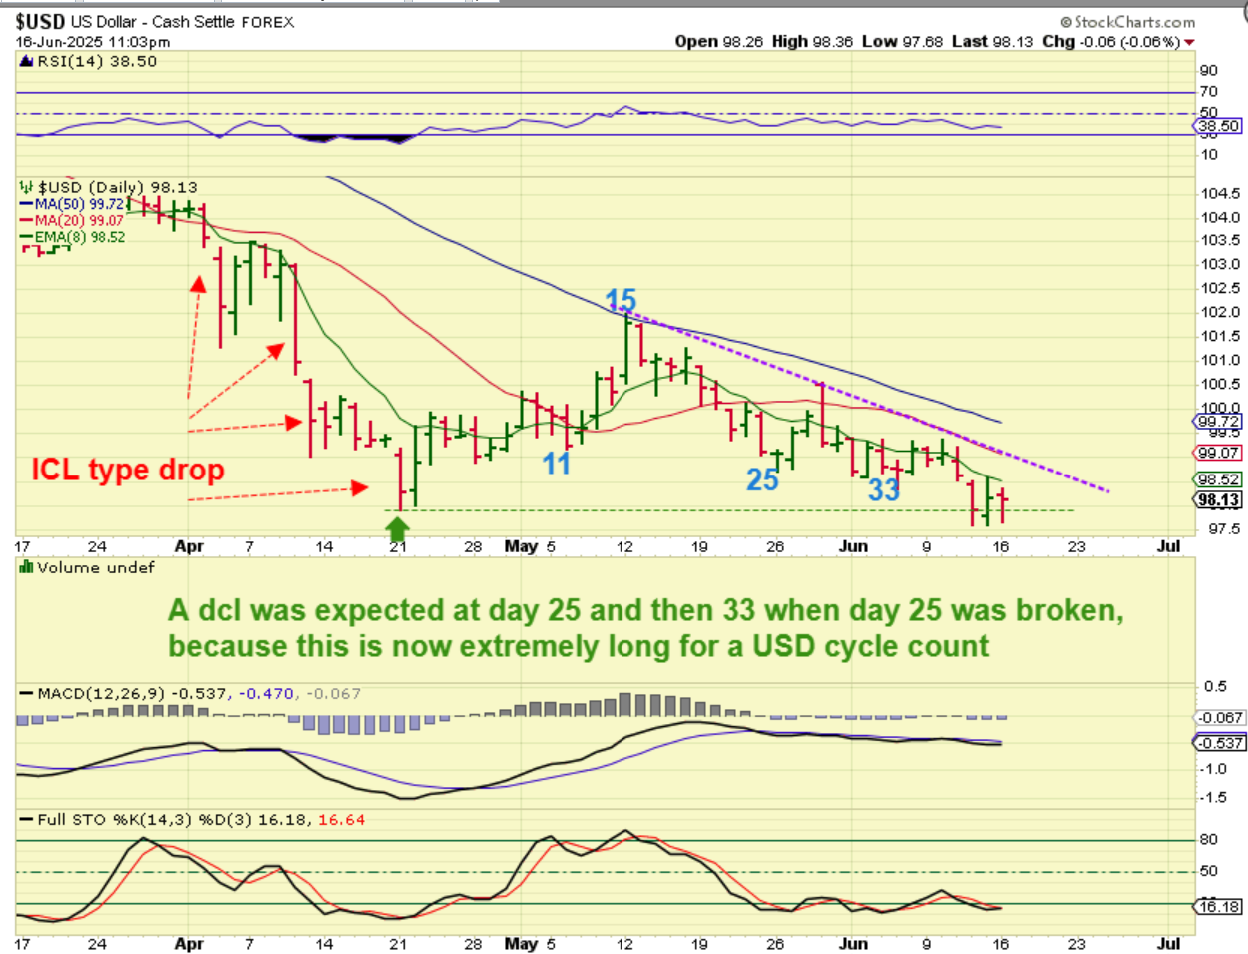
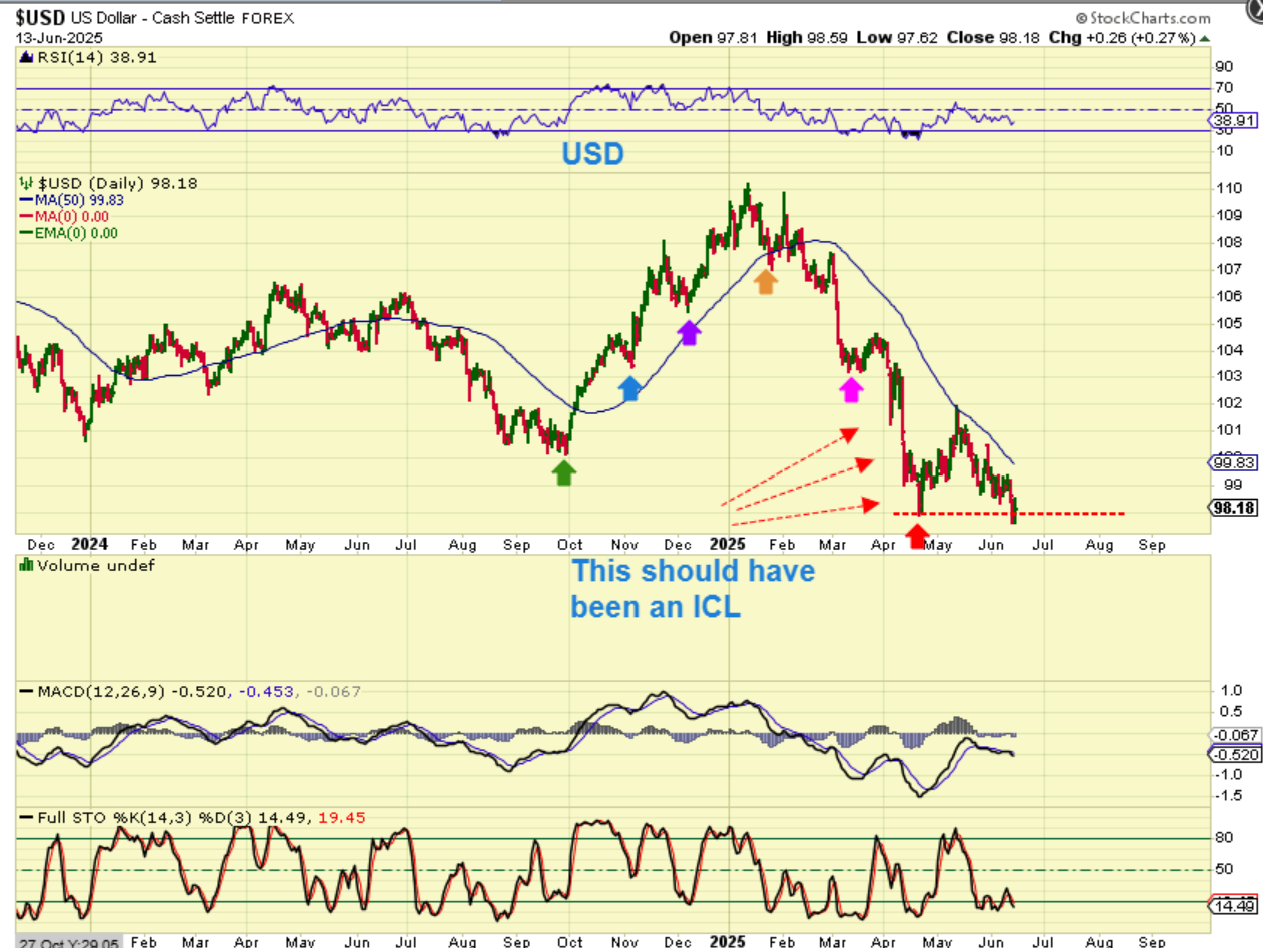
The price action of the USD did not help us in any way, after it broke the lows where an ICL should have taken place. I am going to re-post what I wrote in the weekend report about the USD. Please read this chart first…
.
I want to reprint what was in the weekend report, because the big picture is important.
.
The USD did what it should not have been able to do. It seemed to have an ICL and then after a few weeks of rising up, it crashed below that ICL with the Israel / Iran situation. Look how sharply that USD drop into an ICL became from March to April was. The selling dried up and the MACD rose sharply in May. Let’s zoom in…
.
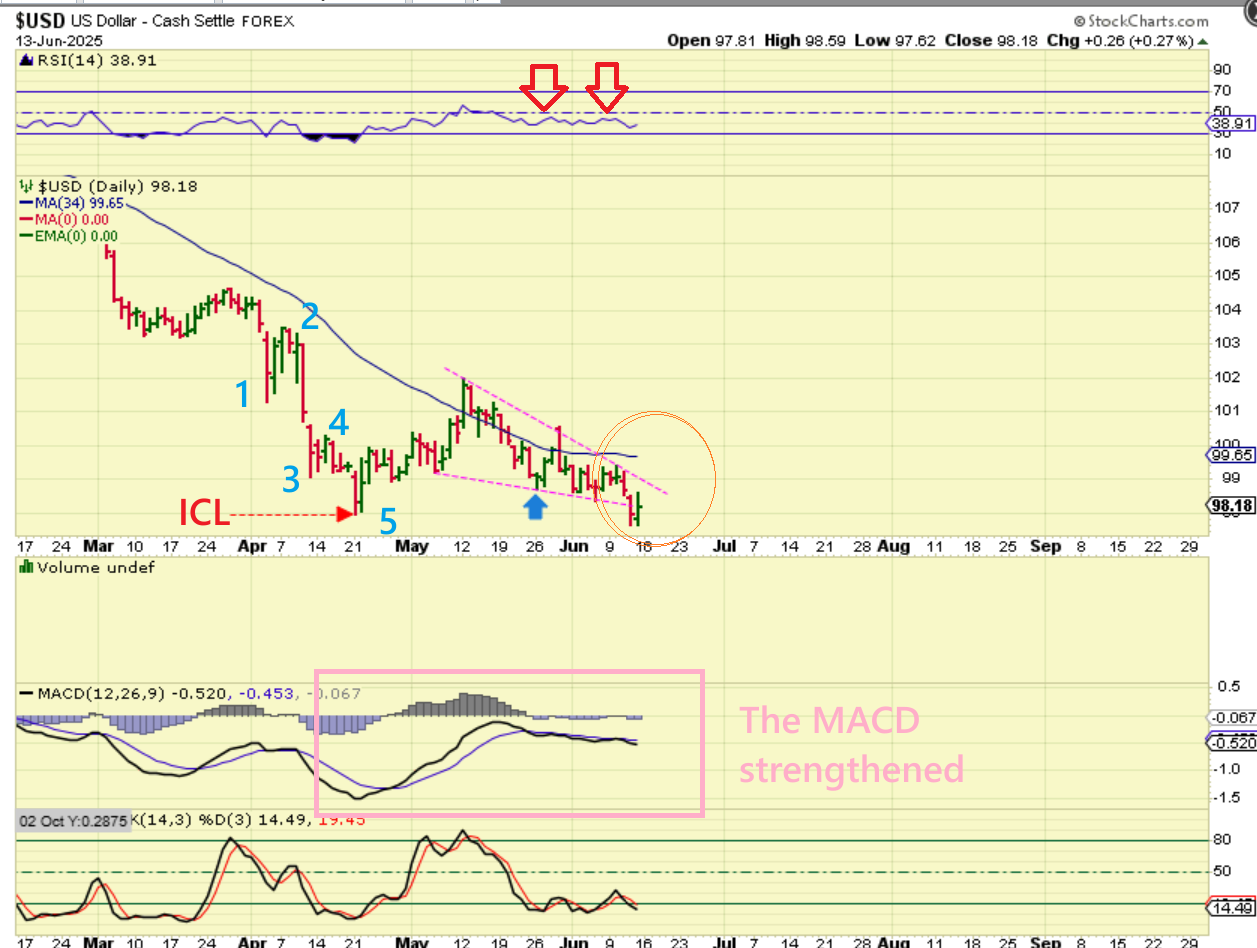
THE USD rallied out of what should have been a 5-wave ICL crash and formed a bullish wedge.
1. It is possible that the bull wedge simply formed too close to the bottom when ‘an outside event’ dropped it sharply into a false break down.
2. Notice that it then recovered on Friday to resume its current set up.
3. That would be a 1 day shakeout, so if I see the USD rise above the Majenta downtrend and the 34 sma, it still should be viewed as an ICL in April and a longer-term low is in place. If it continues lower?…
.
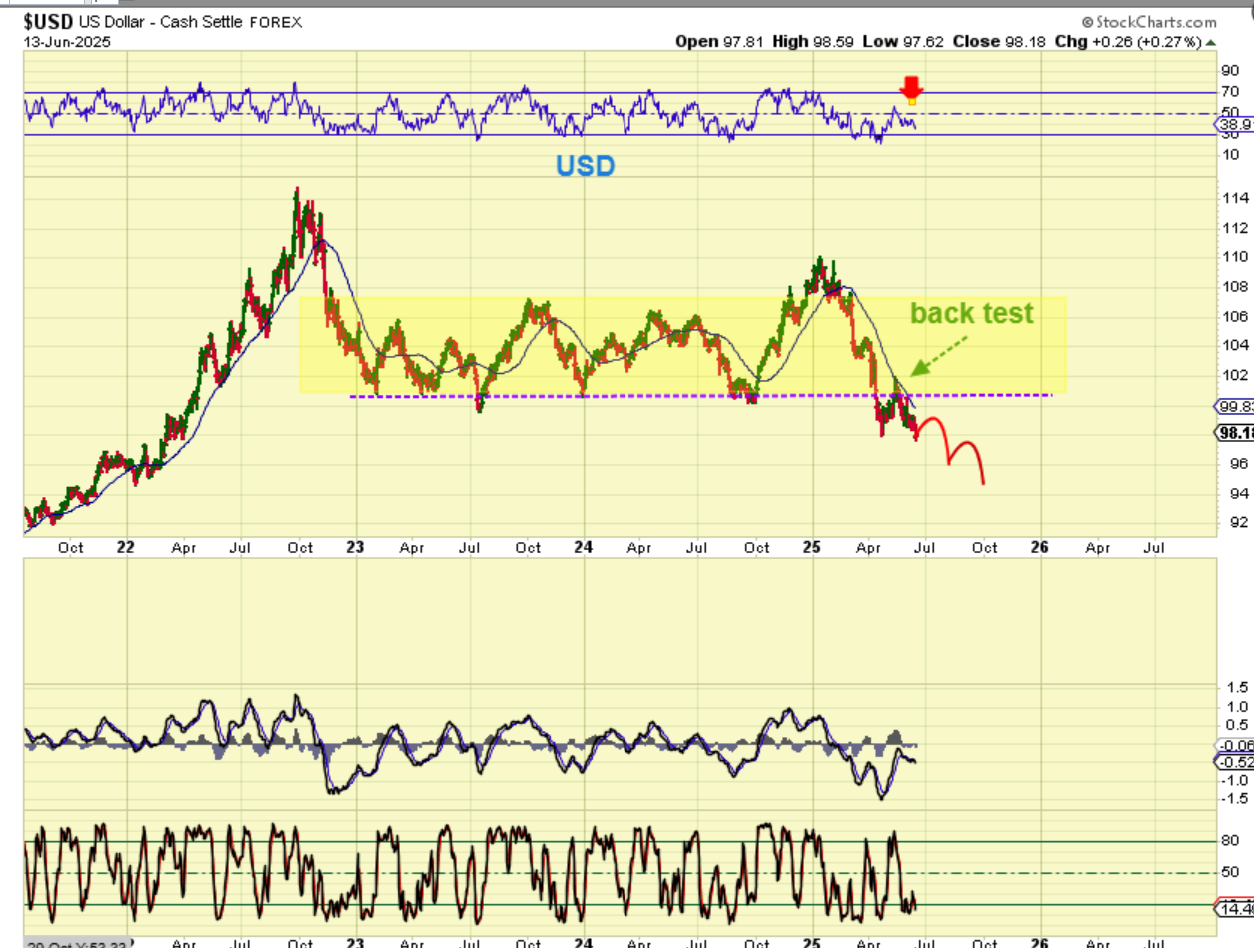
If it continues lower?… Then the USD may have some serious problems by failing on the second daily cycle after that May ICL. This does make sense, because GOLD & SILVER look ready to continue higher.
.
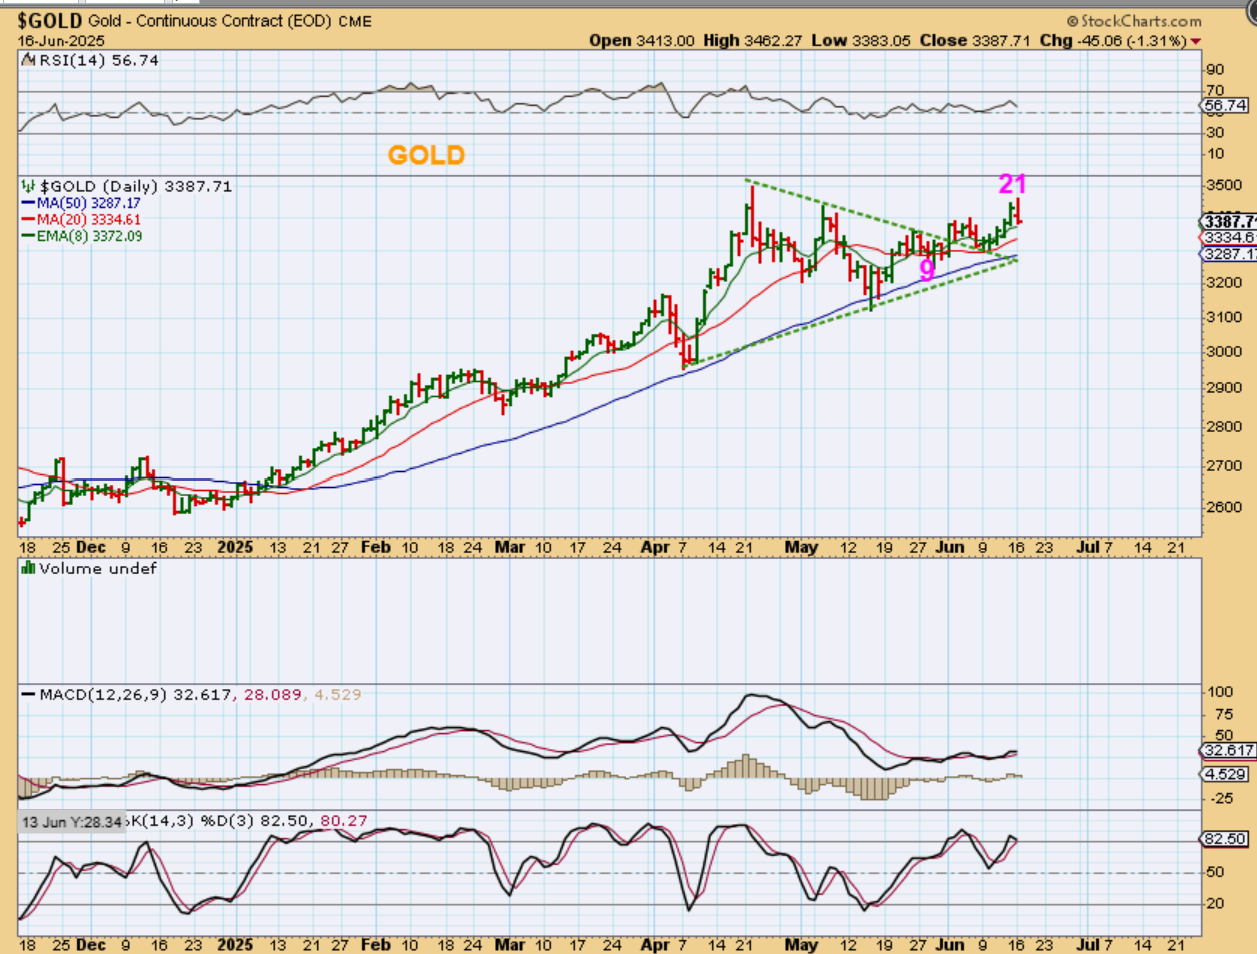
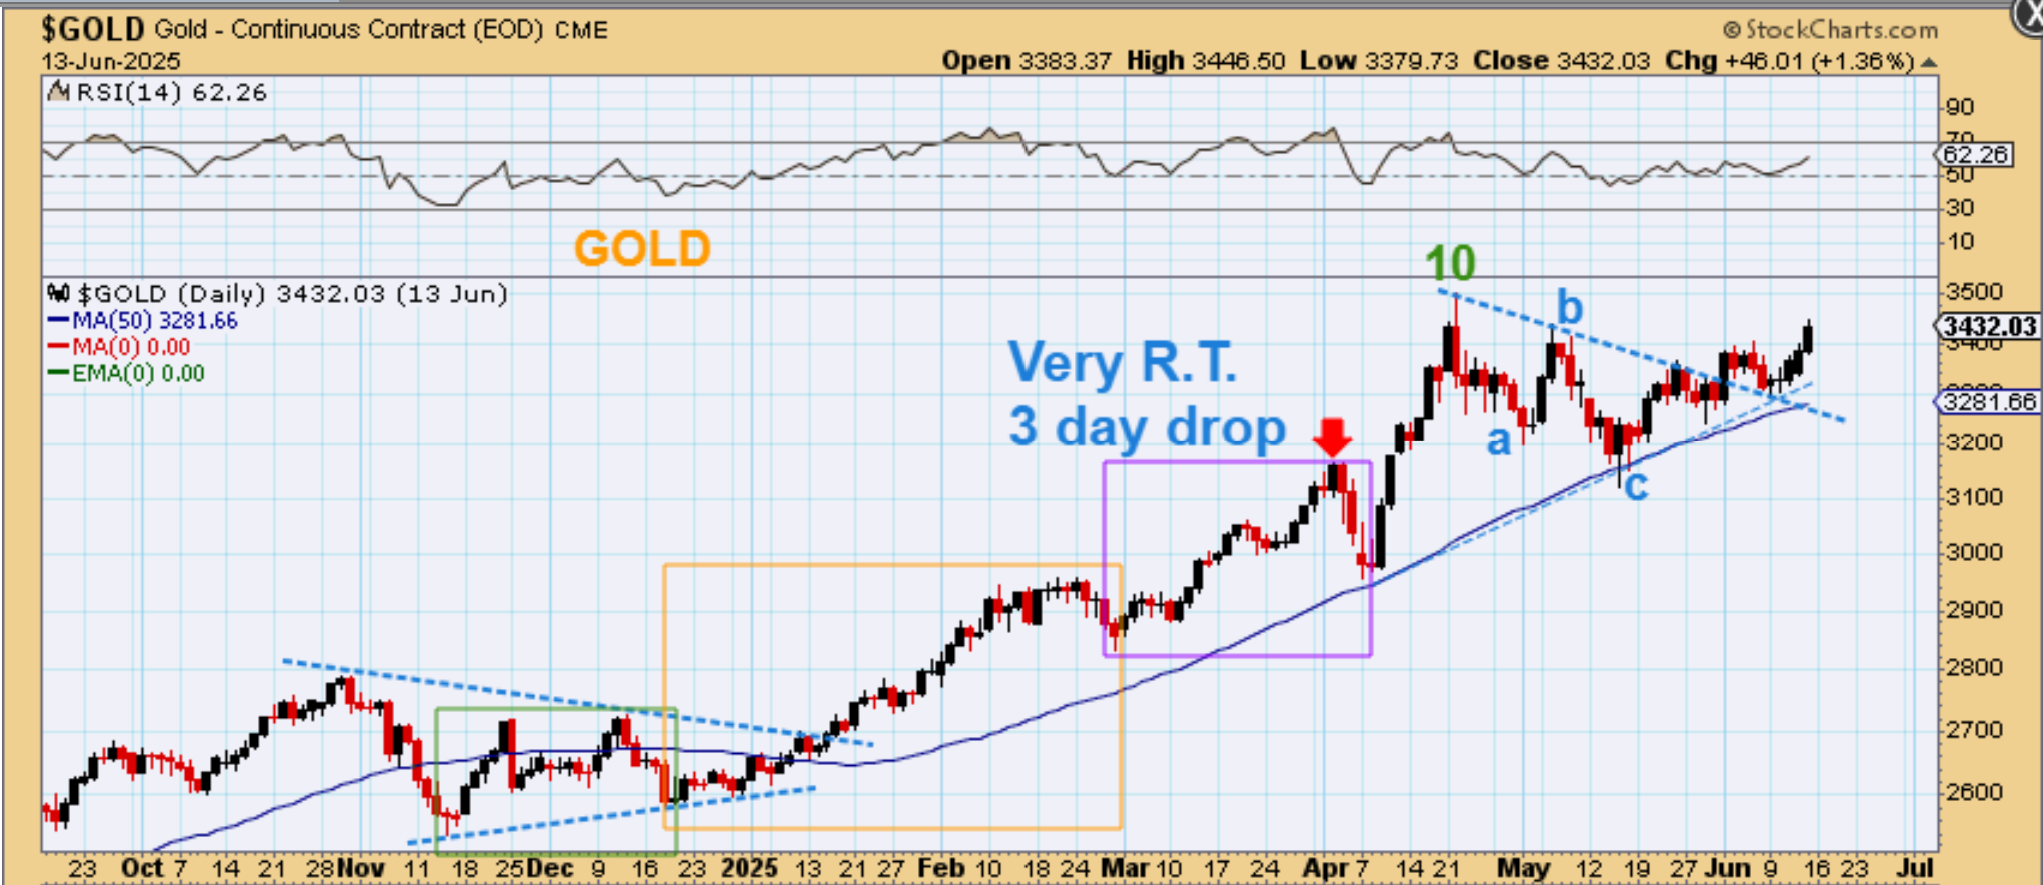
GOLD made a new peak on day 21 and then it sold off. I have been saying for a while that I see Golds ICL as being in this triangle in May. I was asked why it isn’t in April, I will explain that later in the report.
.
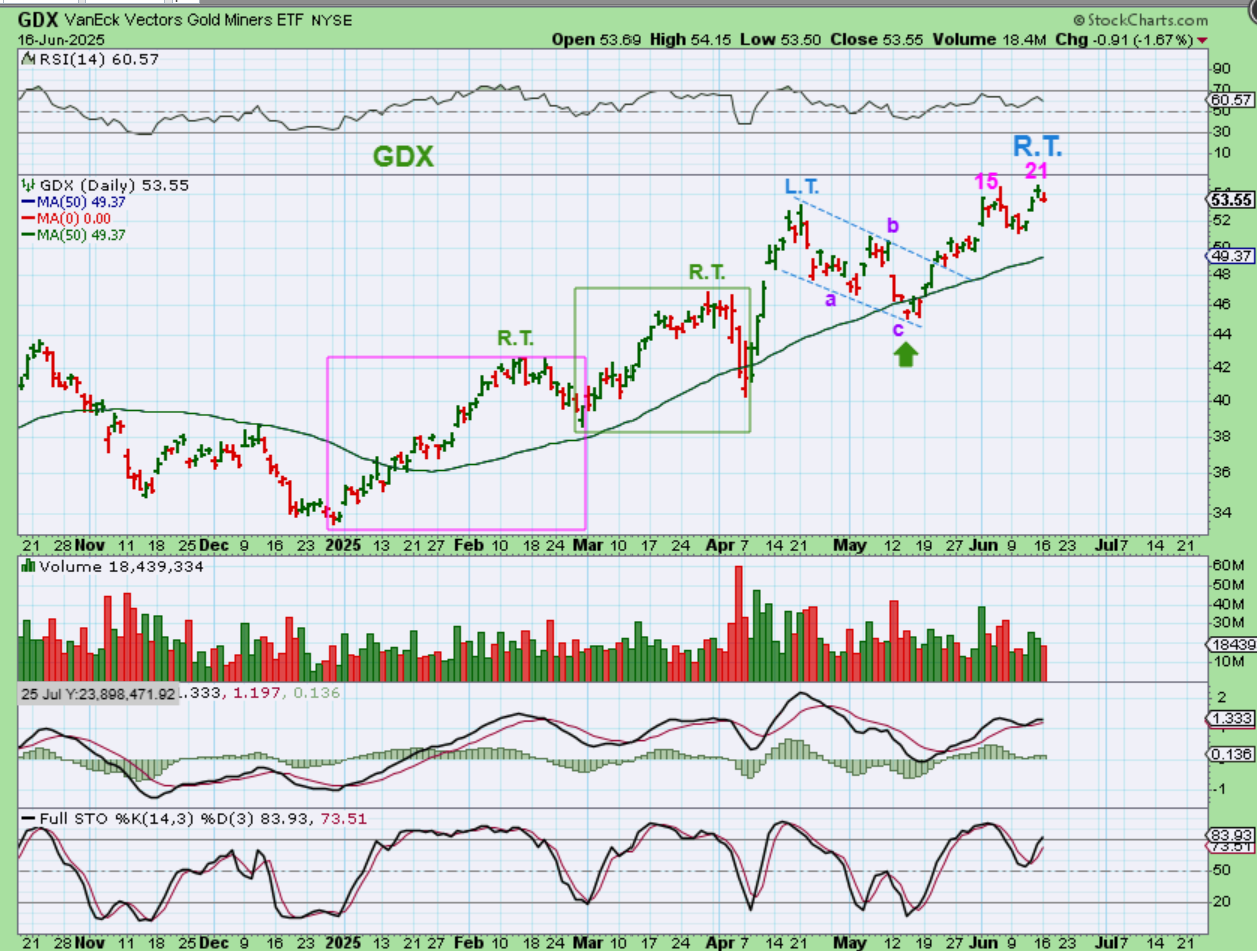
I have also been saying that GDX is following Gold more than Silver, so now we see that the GDX also popped and has a peak at the day 21 area (so far).
.
So now I’ll discuss the ICL more, and I will discuss it with you as though WE ARE STILL TRADING REAL TIME IN APRIL.
I’m sure that you remembered that the General Markets crashed deep into an ICL with tariffs, right?
.
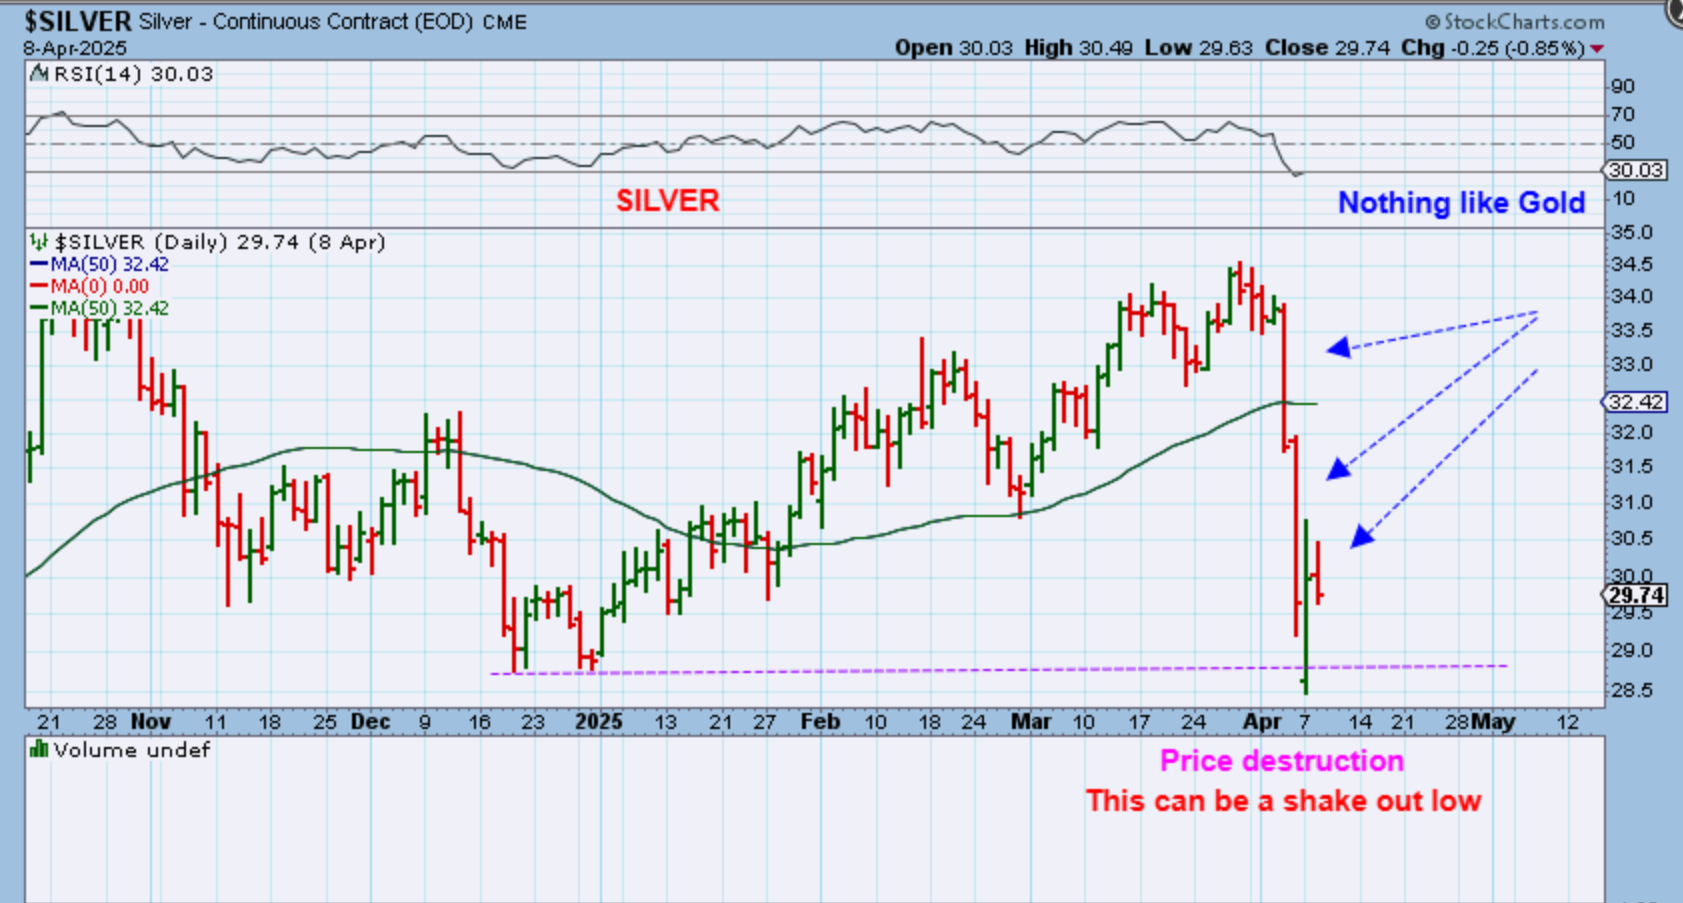
And with that, Silver crashed big time too. In just 3 days it went from a 6 month high to breaking the December lows. It sliced through the 50sma with ease in 1 day. This was real price destruction and if it turned into a shake out at those lows, that would represent an ICL Crash for Silver. What happened to Gold?
.
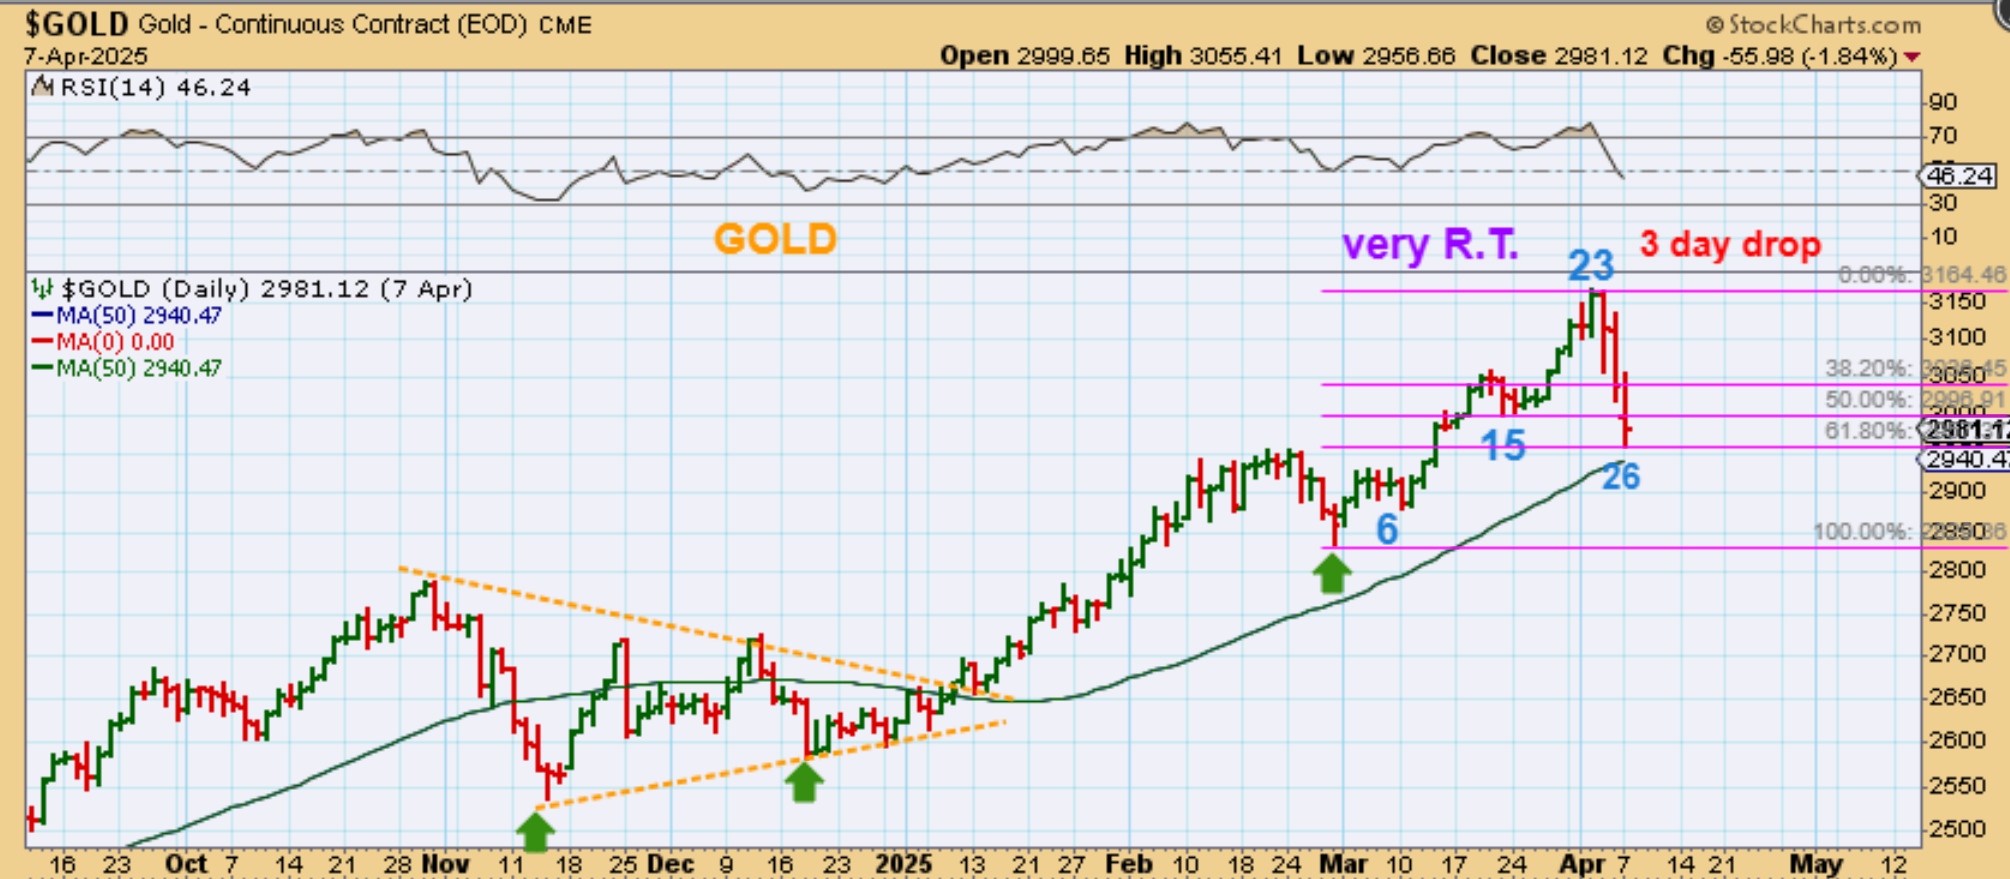
GOLD REAL TIME IN APRIL – Gold was very Right translated with a day 23 high and when the markets (& Silver) crashed, Gold did not have the same kind of price destruction. Gold did drop roughly 50% to 61%, but it only looked like a back test of the February highs and notice that Gold never even reached the 50sma. I thought that we might get a bounce and drop to give us the normal A-B-C down, but…
.
Gold just bounced higher from above the 50sma and then it dropped in an a-b-c manner in May. It also formed as L.T. with a day 10 peak. It also formed a triangle. This looked like a milder L.T. drop into an ICL and in real time I stated that if we see that trendline break, Gold may have put in an ICL 1 month after Silver ( Just like Silver put in an ICL 1 month after Gold in the past).
WITH THAT TRIANGLE IN MIND, we usually count the last low as an ICL. We did that at the very end of December. Keep that in mind, Golds last ICL would be marked at the very end of December, right? WITH THAT MAY ICL now in Mind…take a look again at the GDX, that had been following Gold and not SIlver….
.
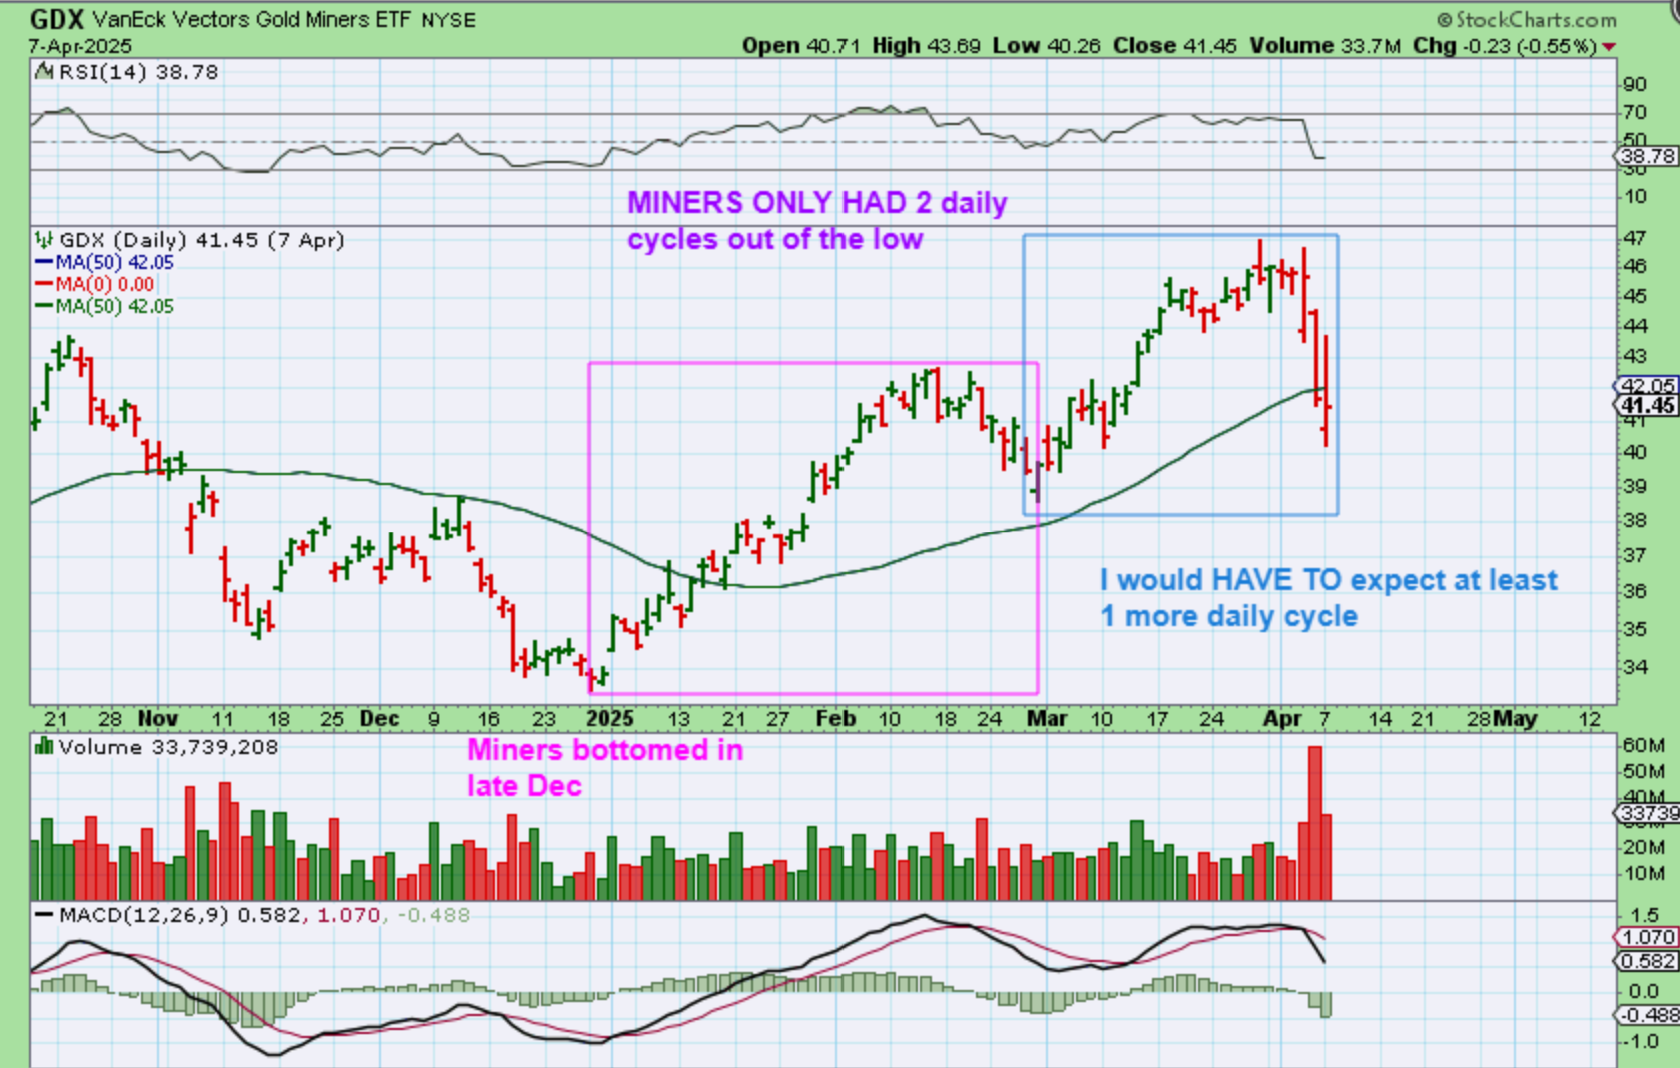
GDX bottomed at almost the last day of December (Just like Gold in that triangle seen above). That was the last low of the triangle. It had one very long daily cycle that lasted 40 days. With that April drop, we would only have GDX on its second daily cycle and also very R.T. GDX broke and recovered the 50sma, but it didn’t break the lows like Silver at all…
.
Now look at GDX. It follows Gold , not Silver now, so it did not crash to new lows in April and it has a L.T. a-b-c drop into an ICL in…MAY. I marked the triangle low in Gold in late December and the triangle low in Gold as in May. GDX matches those lows and since we trade Miners, this helped us not to be shaken out at these lower lows in Miners. SO I NOW HAVE GDX IN A FIRST DAILY CYCLE (with Gold). Silver is one month ahead of that.
.
Enjoy your Tuesday trading.
.
~ALEX
.
I put this in the weekend report:
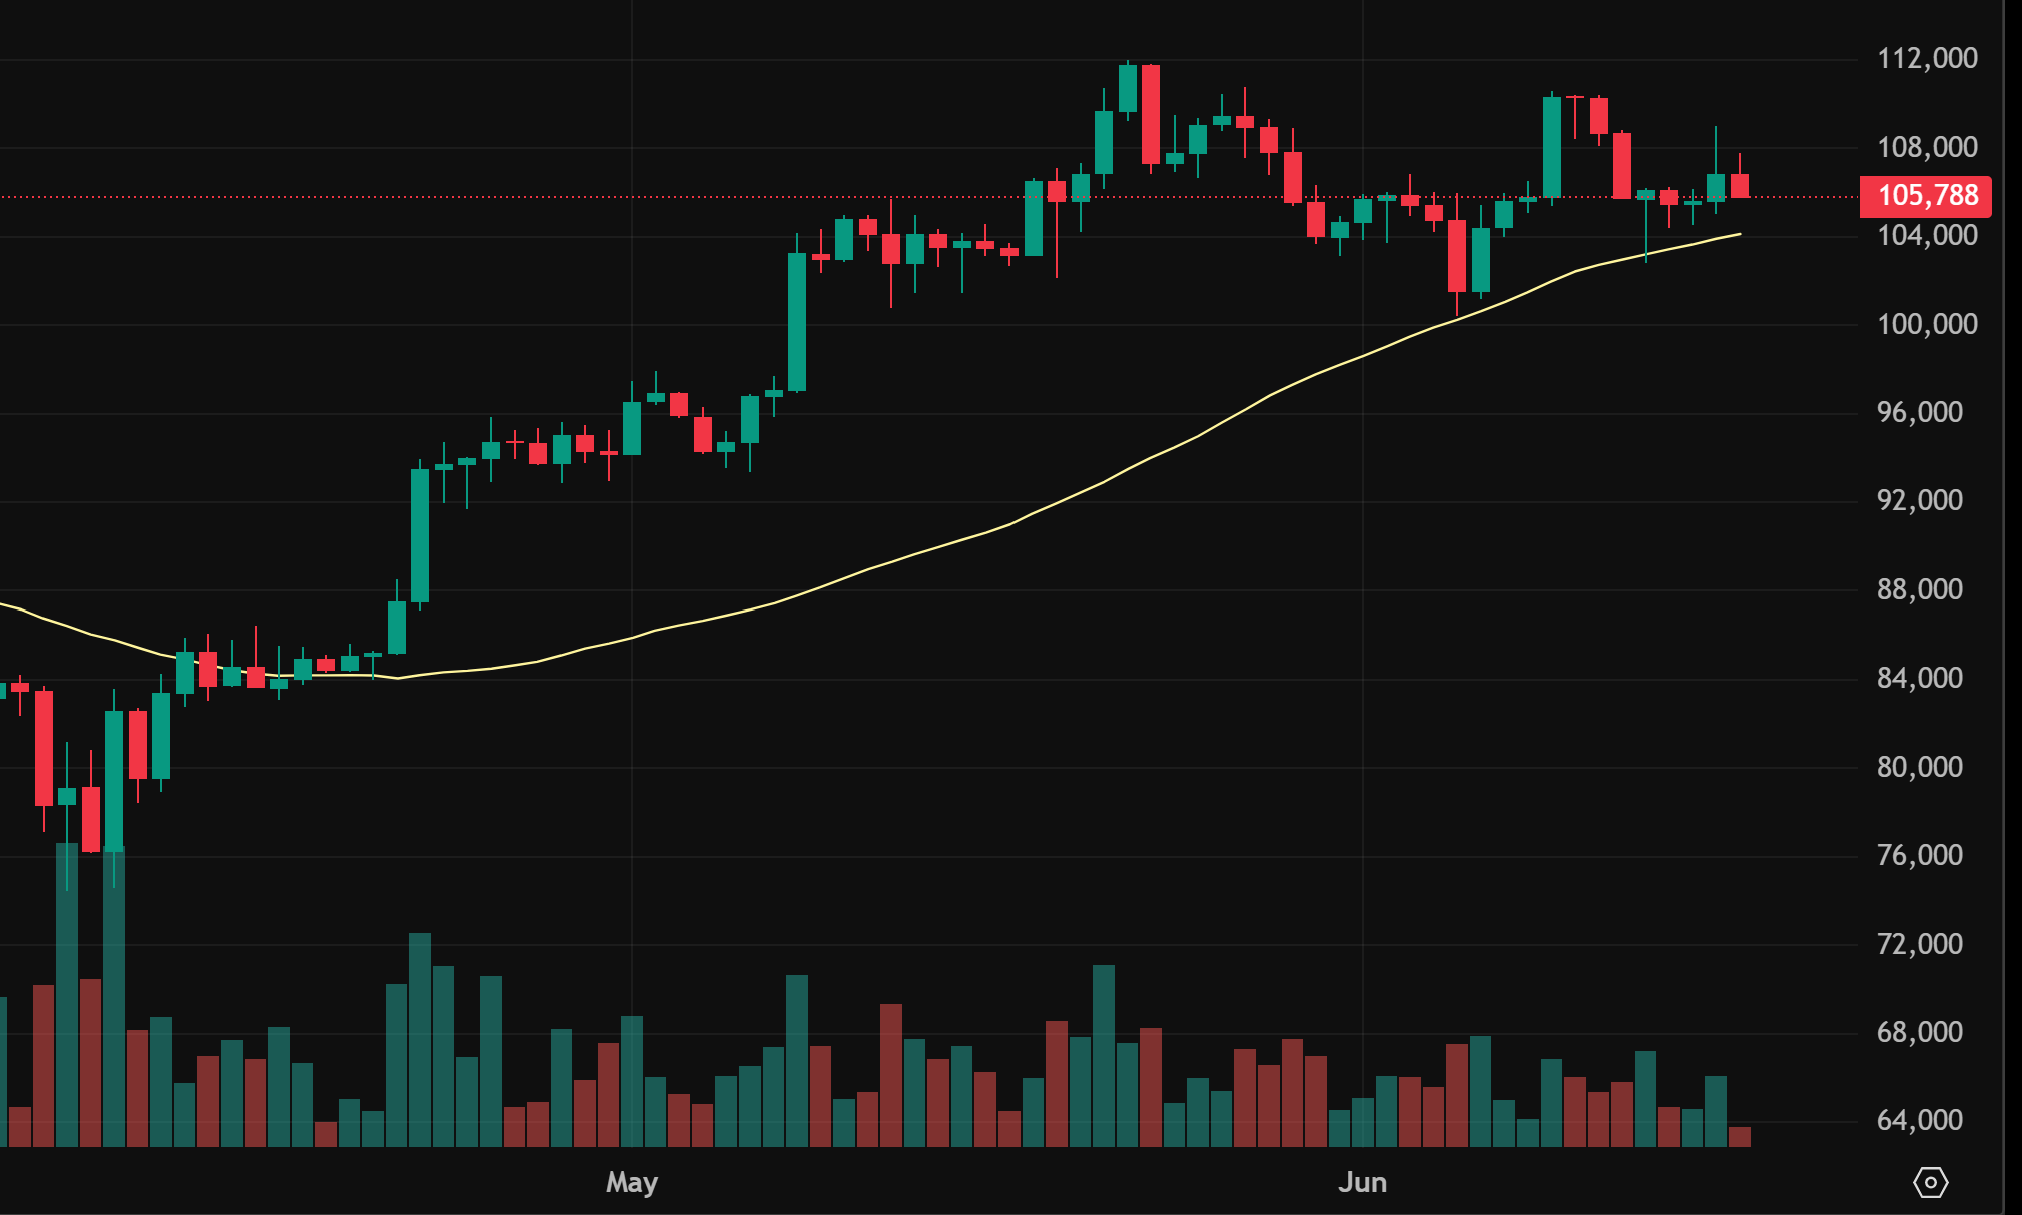
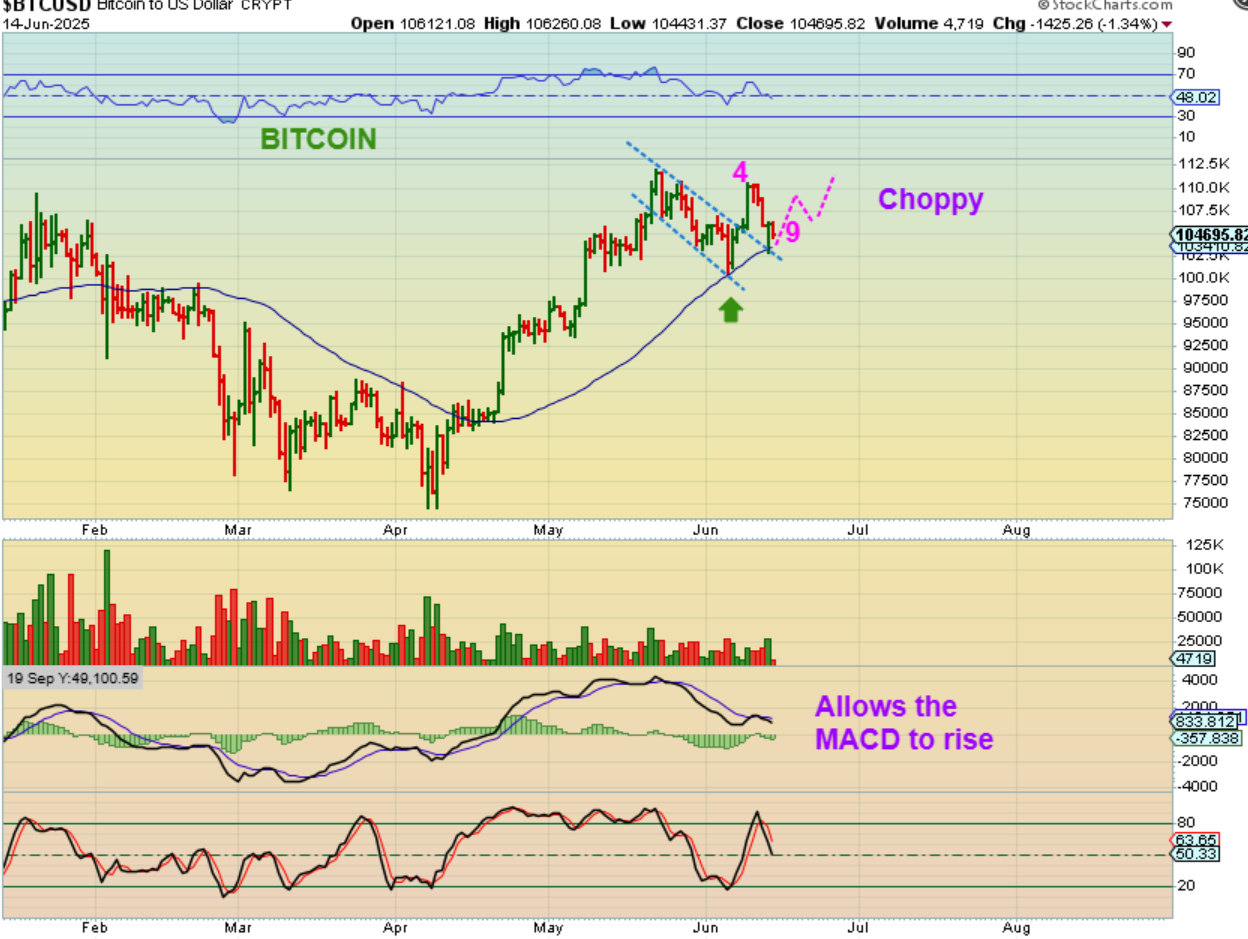
BITCOIN – More choppiness can allow the MACD to rise up and straighten out the divergence, so I am hoping to see that if or when Bitcoin starts to move higher again.
,
BITCOIN started to move higher again, and this was posted in the comments yesterday. I said that choppiness could help to lift the MACD up and relieve divergence…
.
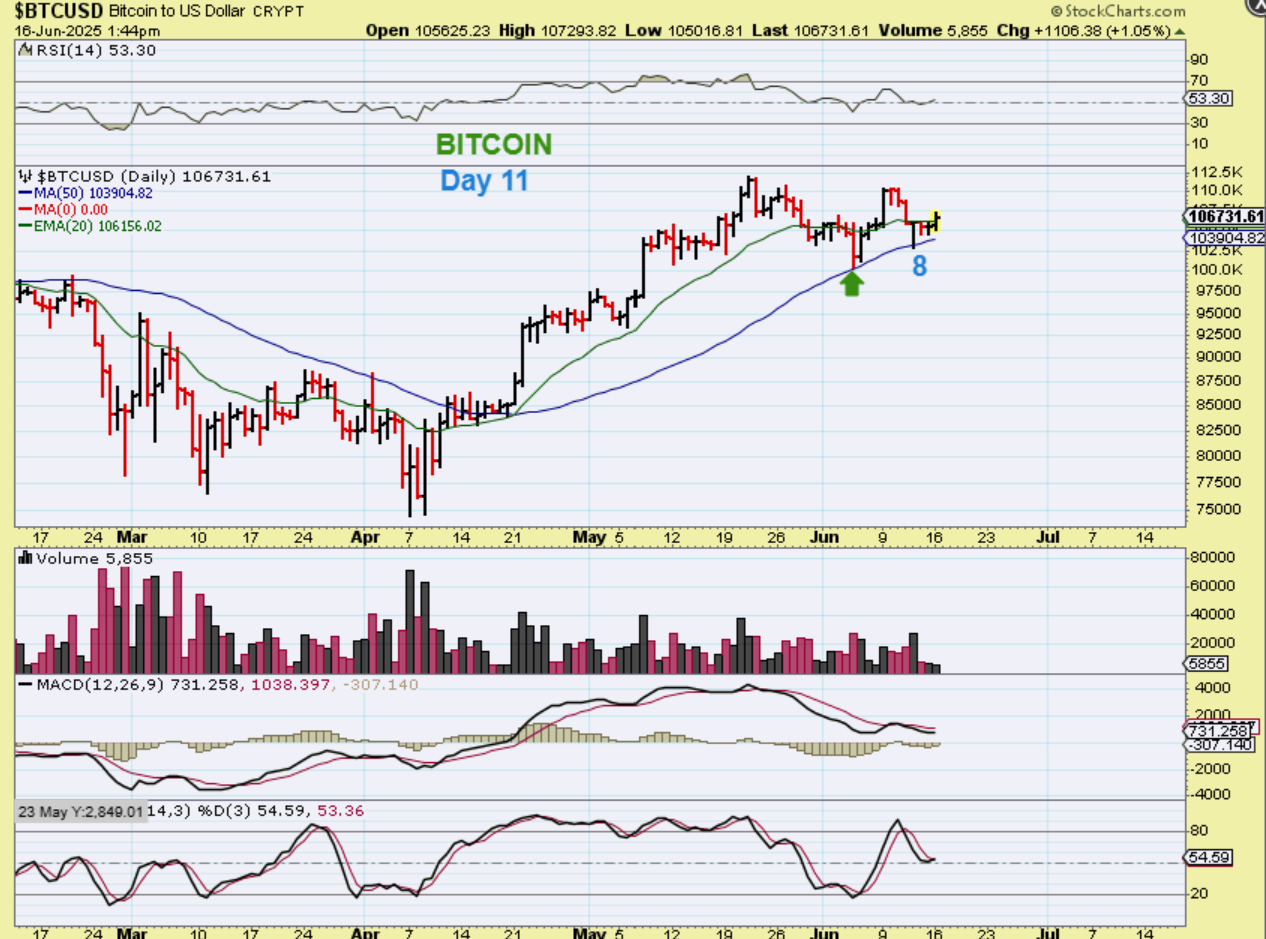
BITCOIN LIVE 7 AM:
I said that choppiness could help to lift the MACD up and relieve divergence and that choppiness is what we are seeing. This is only day 12 of a possible 60 day cycle, so we have plenty of time for this to try to resolve to the upside.