Saturday June 29th Weekend Report
I’m going to do a little extra reporting on Gold this weekend; you’ll find it titled ‘The Lesson’ in this report. This is a long report, and I’m trying to share with you what I see or how I see things as they unfold, so you may want to make sure that you have time to absorb it when you read through it. Enjoy!…
.
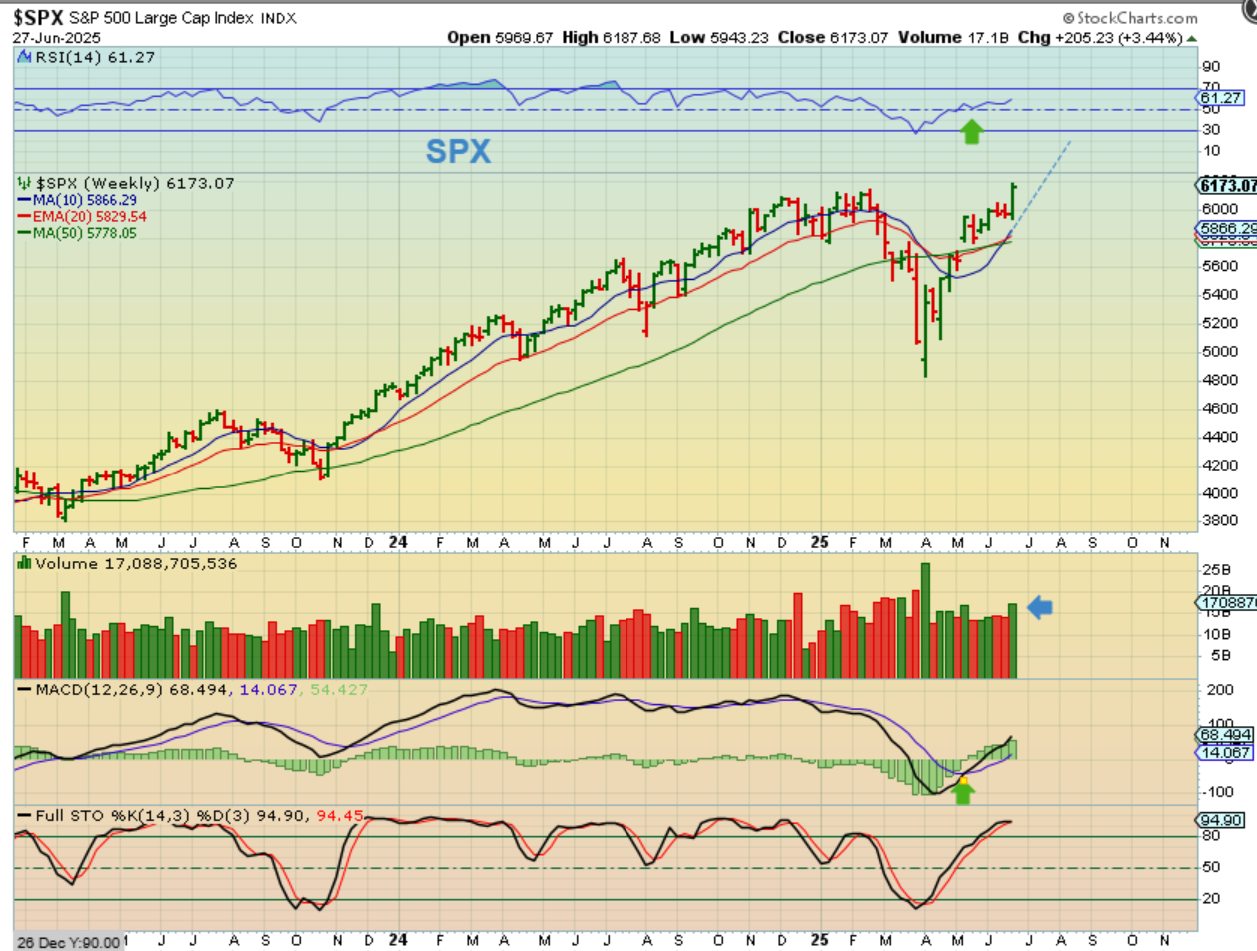
The General Markets, as seen her with The SPX, put in that half cycle low and surged higher. The markets are now at new all-time highs and remain bullish.
.
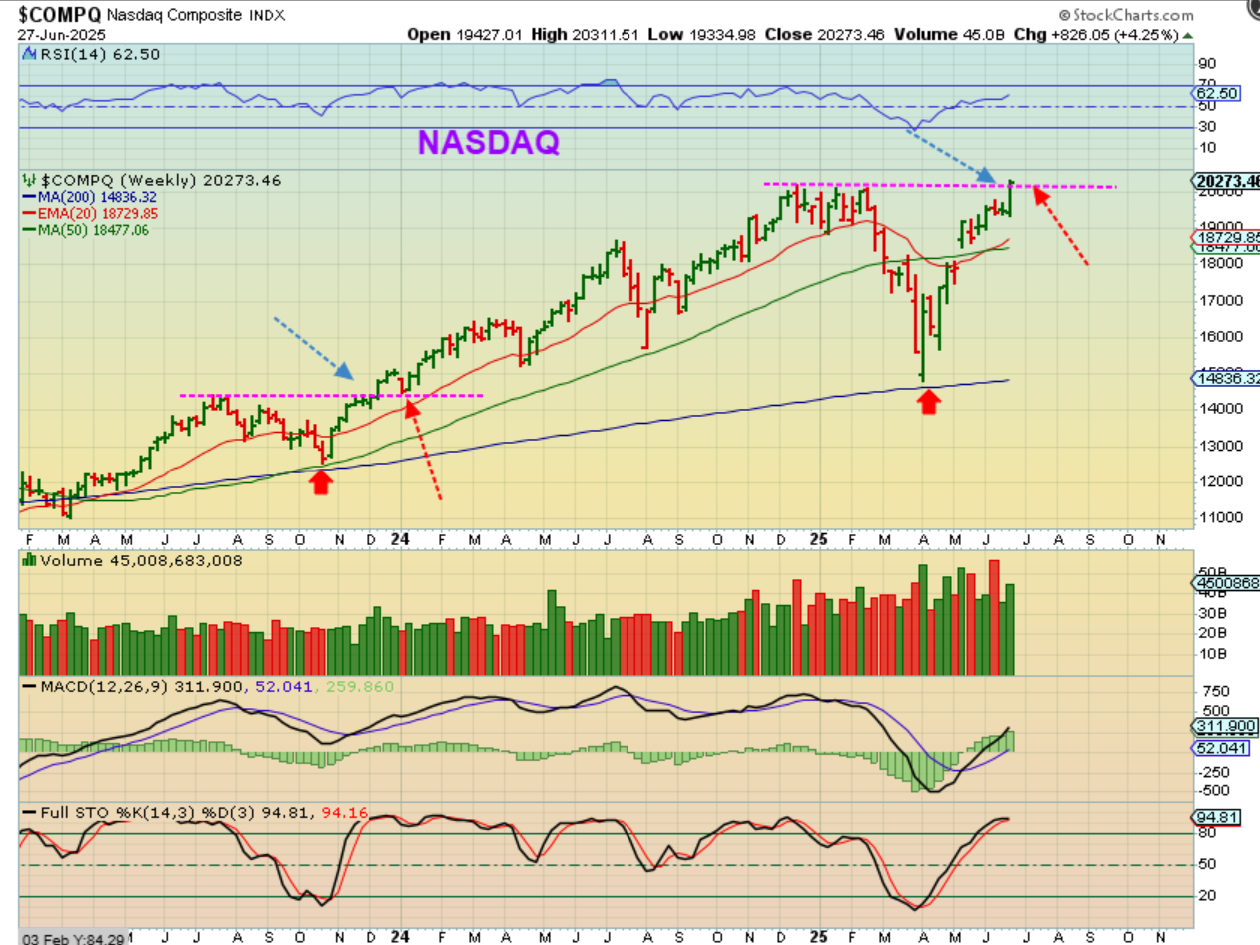
THE NASDAQ also broke out to new all-time highs in the second daily cycle here too. A dcl may be a back test of this area in a couple of weeks, as seen in 2023-2024 (See the Majenta lines)
.
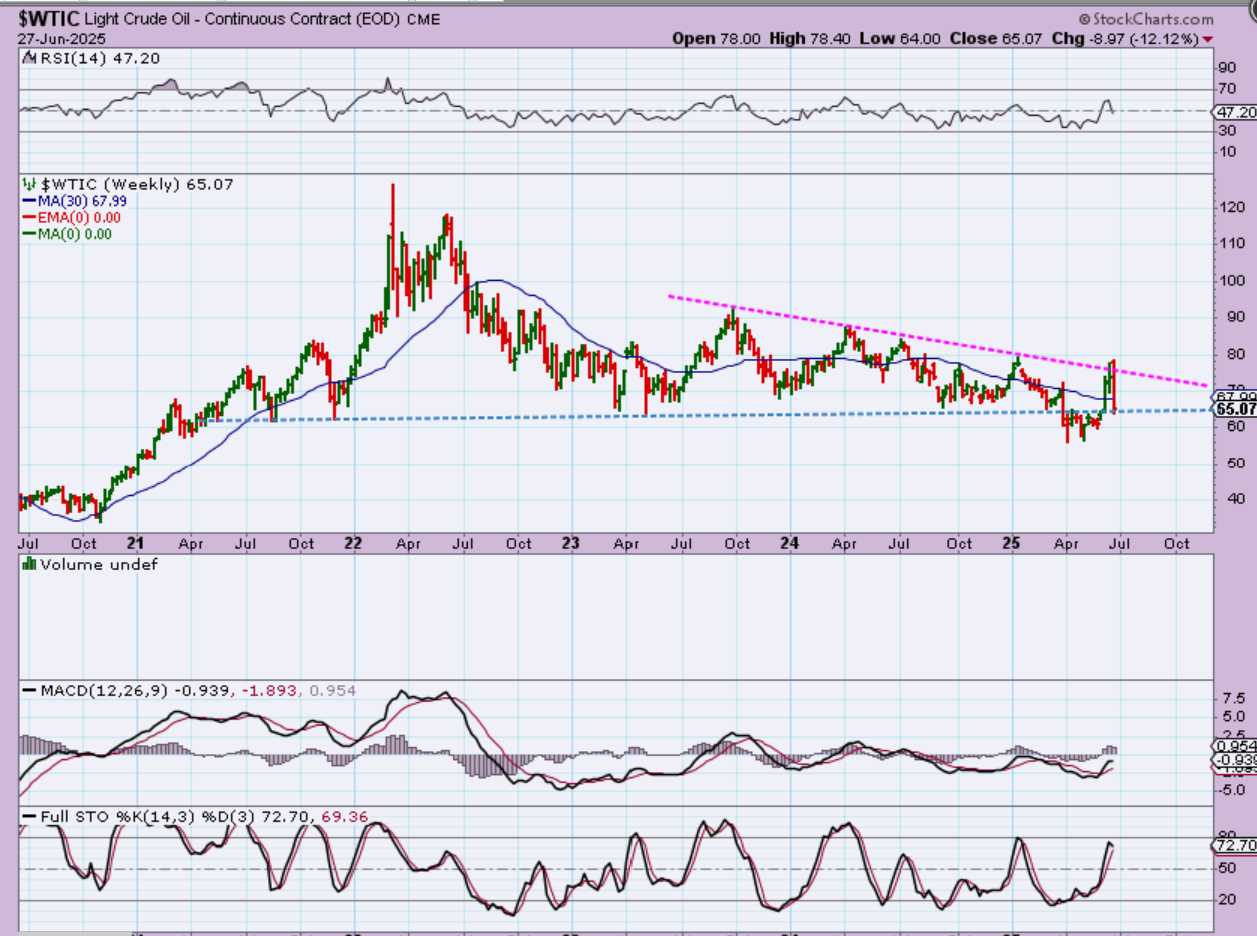
WTIC – Oil put in a very large reversal candle (lower). It lost the 30 week ma again and remains unstable.
.
Take a look at The USD. It broke down in April and lost all support, bounced back to the resistance of the 10 week ma, where it has bounced around a couple of times, and then it rolled over again last week. The USD hit new 3 year lows. I was expecting this to cause Gold to hit new highs, but…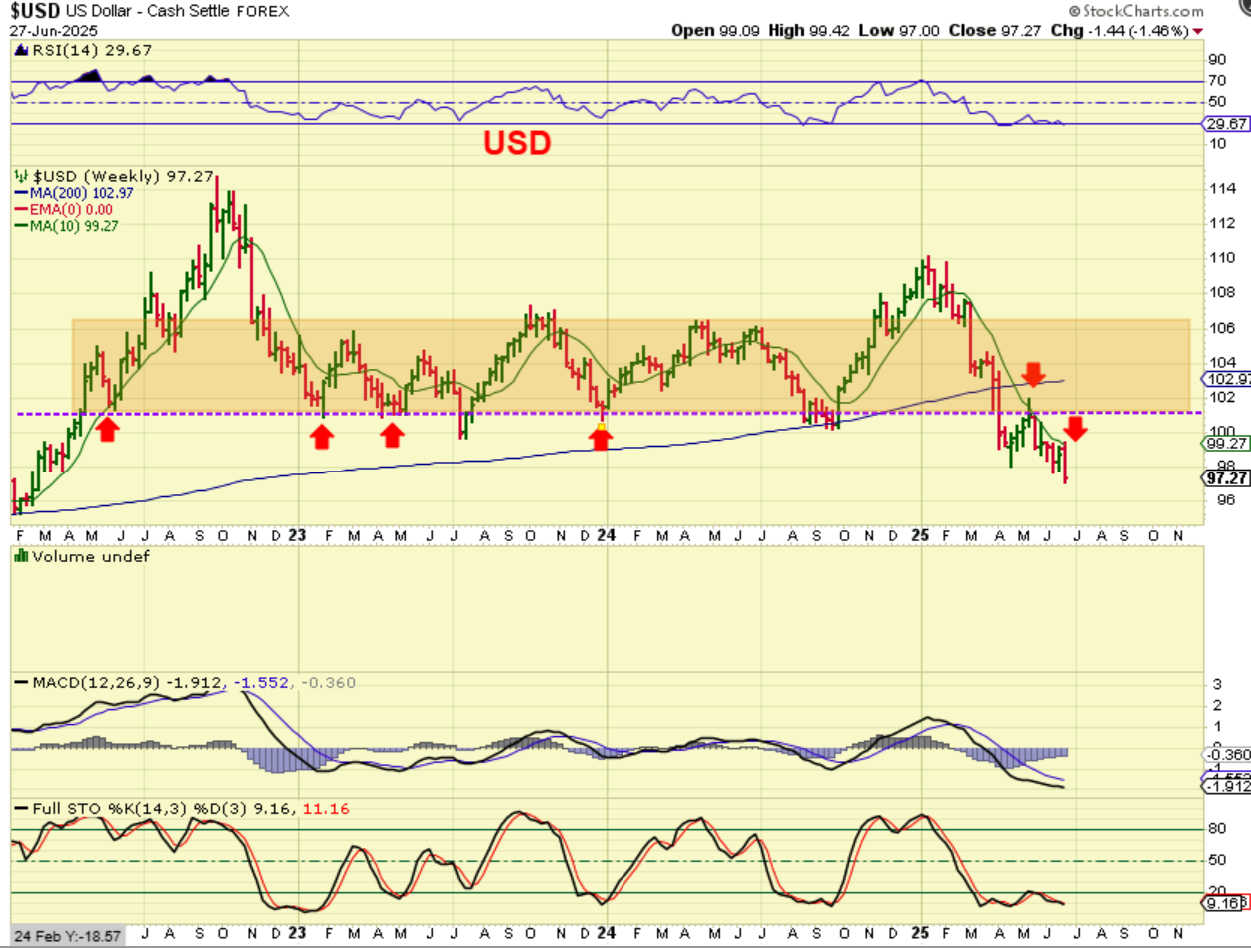
.
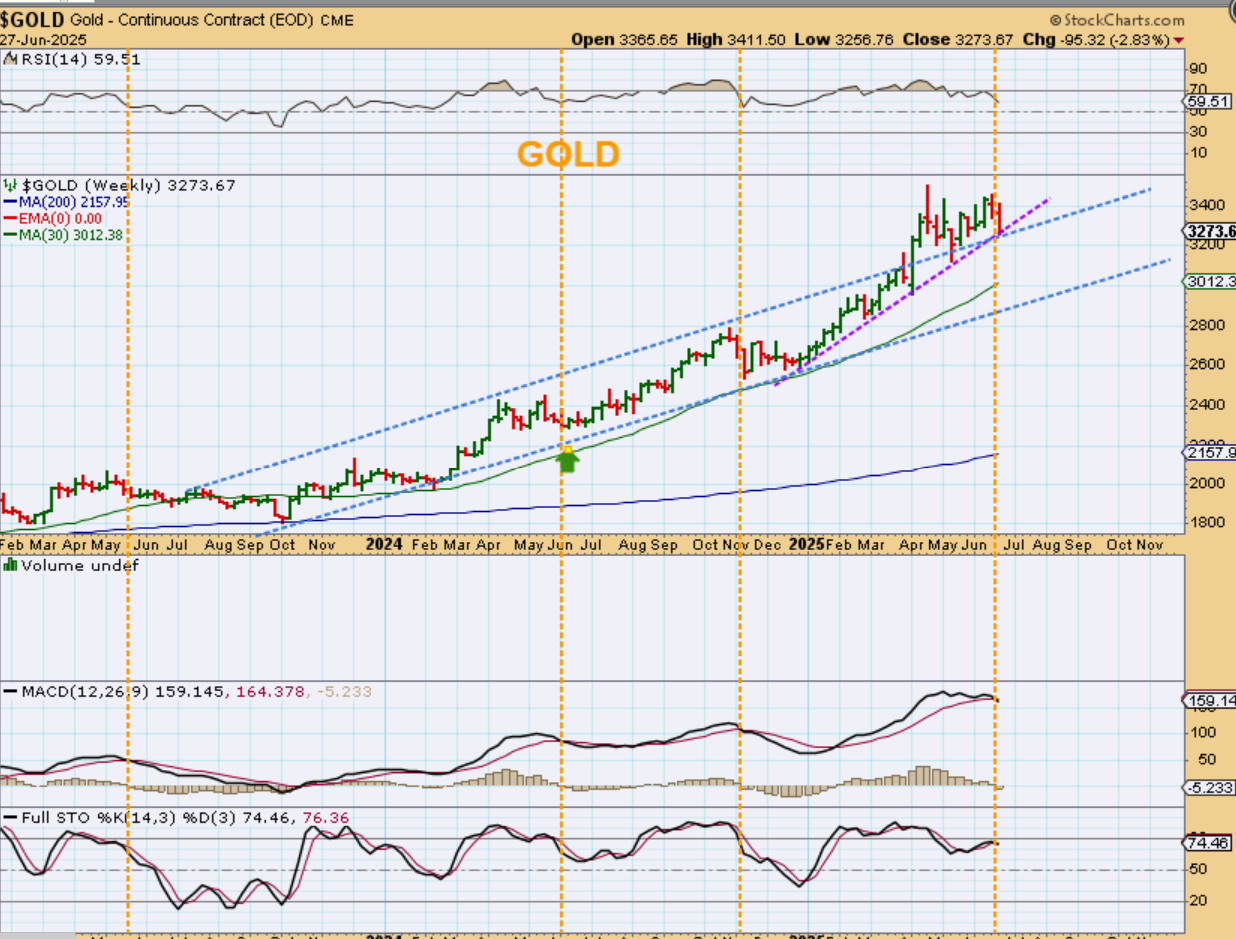
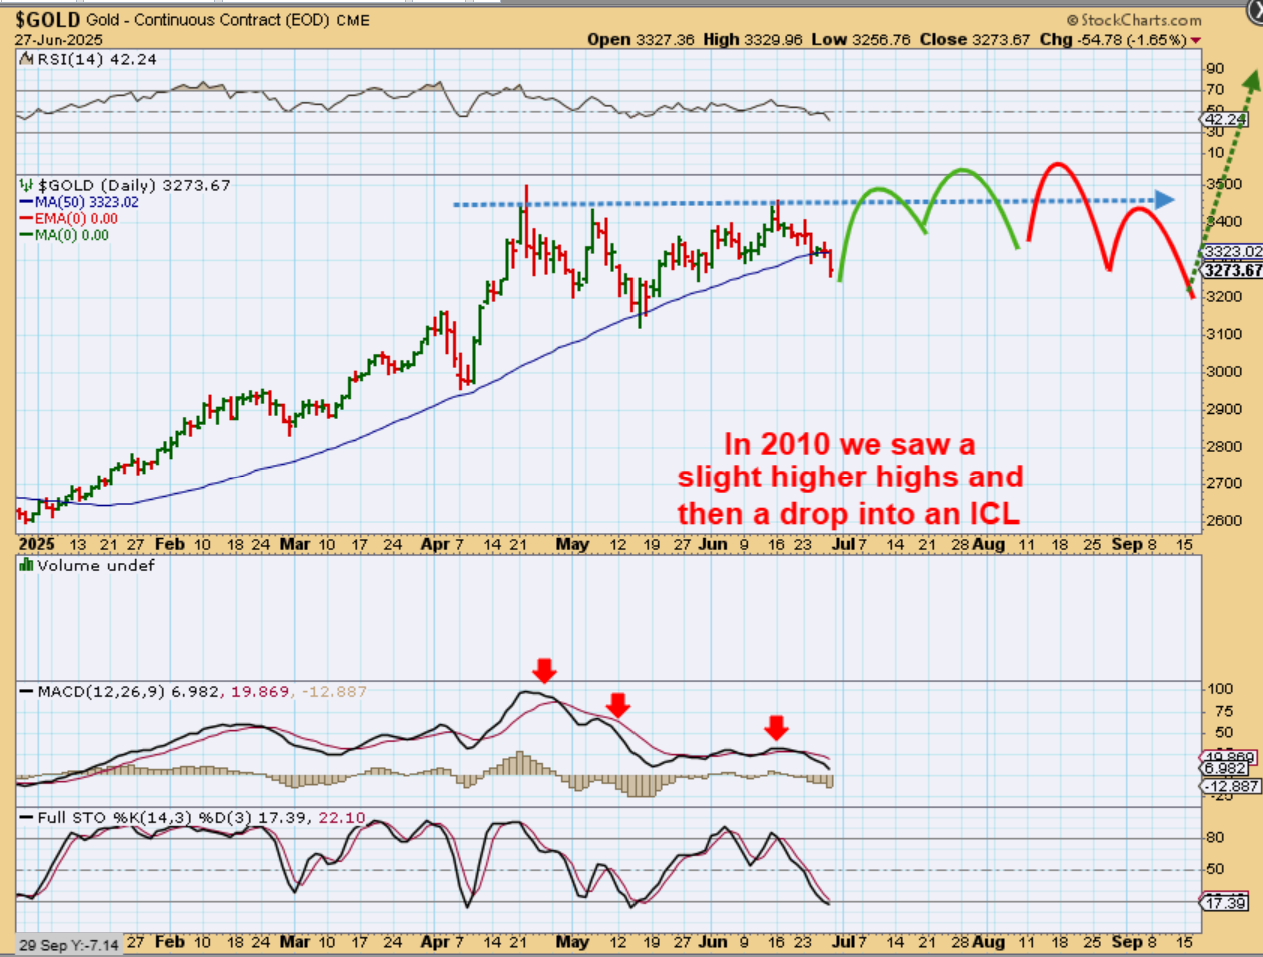
GOLD has been choppy and it actually sold off this week too, but this was mainly because it is due for a dcl on the daily chart. Gold has reached the purple trend line and that may be where we find that low. I am going to discuss Gold further a later in the report too.
.
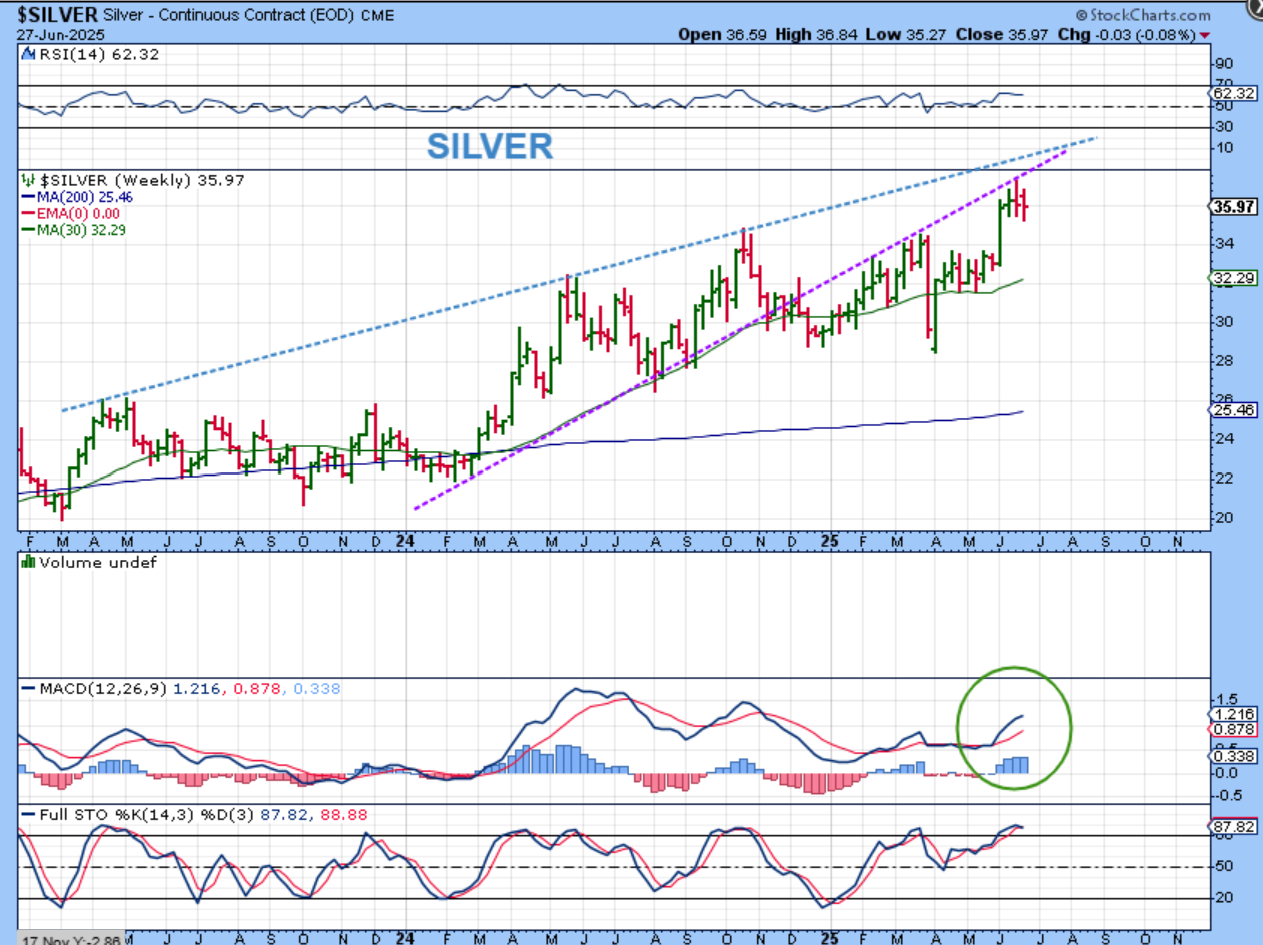
SILVER – The weekly MACD for Silver is bullish and continues to open up as it moves higher. Take a look at Golds MACD and it is curling lower. Silver currently looks bullish but is chopping sideways as a possible flag before moving even higher. Silver is due for a dcl too.
.
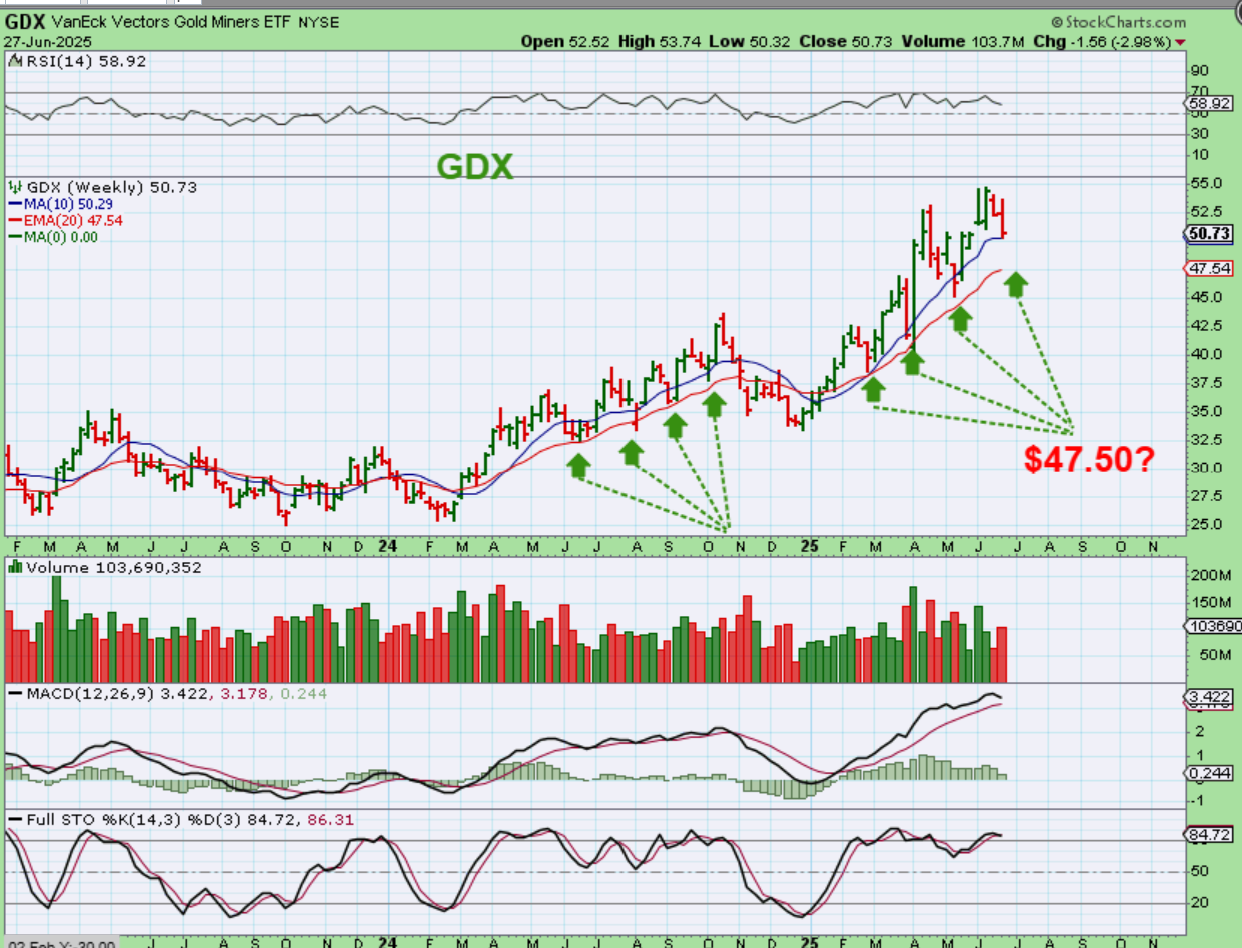
THE GDX ETF is also due for a dcl and it dropped right to the 10 week ma. It COULD move lower to the red 20 ema , since it has tagged that area repeatedly in the past, so we’ll just have to see what next week brings. We should be at or close to the low in this sector.
.
THE LESSON:
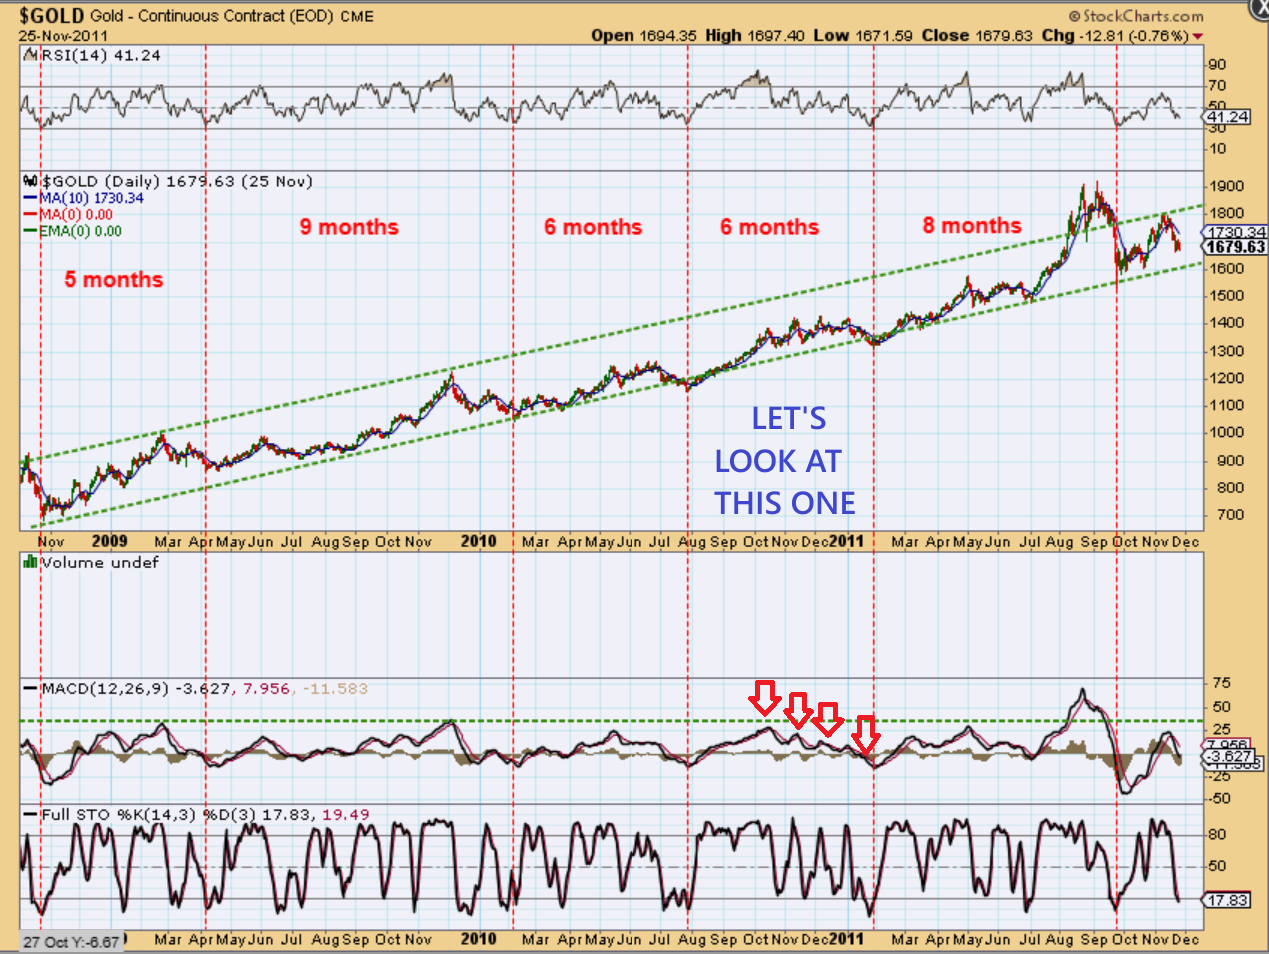
I wanted to visit the Intermediate Cycles for GOLD during a past Bull run, thinking that it may help to explain Golds recent sideways choppiness. There are so many lessons that we can learn here in this last bull run, but I want to focus on 0ne. See the chart for July 2010 through Feb 2011. Golds bull run became quite choppy then too, but then a STRONG RALLY still followed in 2011. We can discuss that, so next I’ll zoom in.
.
On the ABOVE chart, Did you notice that I was pointing out that the MACD was getting weaker for Gold with each new high that it made in 2010? It is very similar to what I was pointing out with Bitcoin a several weeks ago and I mentioned recently that when I see that-it often leads to a weaker cycle, or more choppiness. 2 weeks ago, I said that I am now seeing that in Gold again too. So…
.
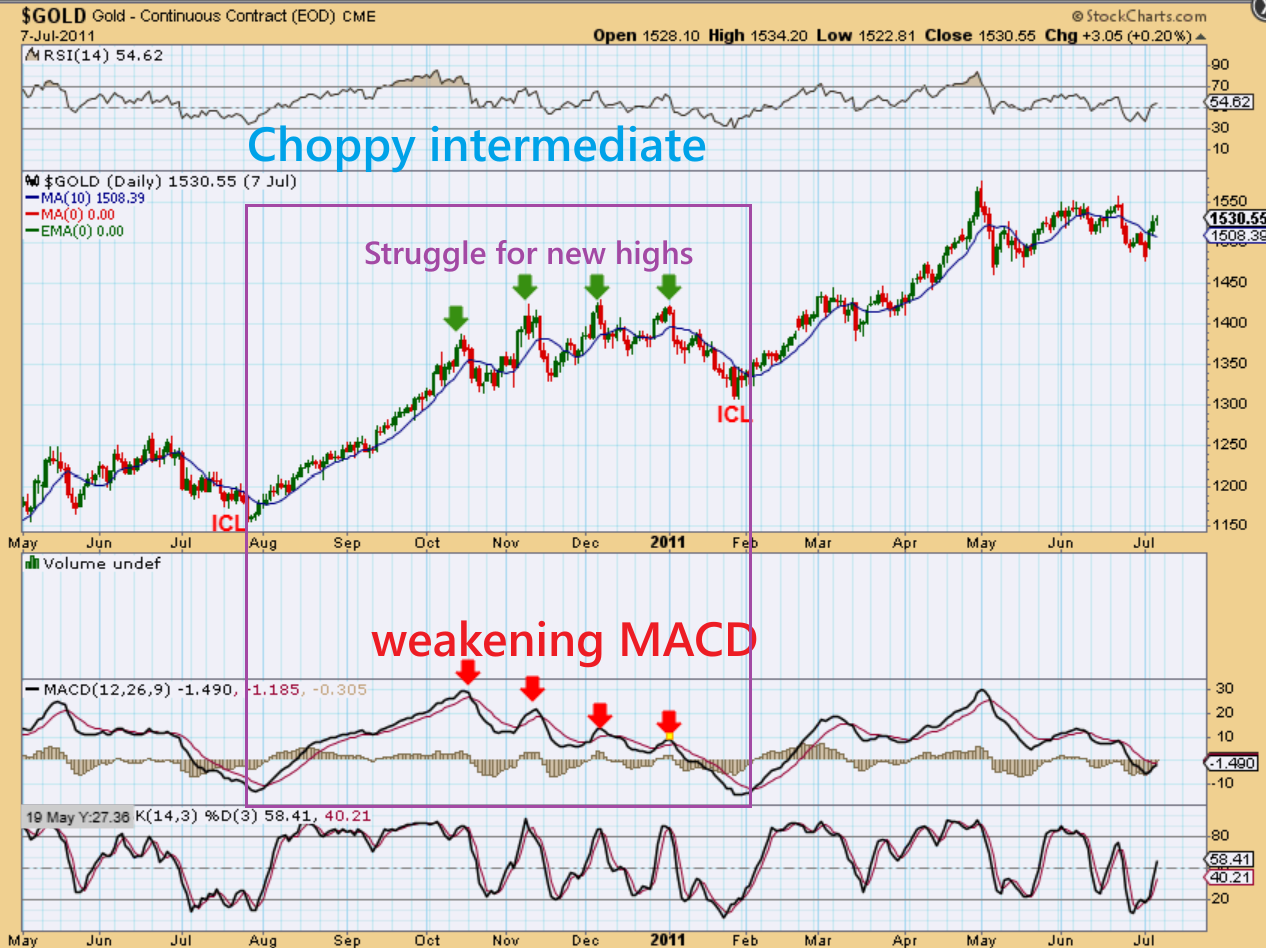
We’ll take a look here at Gold in 2010, when that MACD was not confirming new highs.
1. It struggled over and over and over again and was barely able to make new highs,
2. Gold couldn’t hold the highs/gains each time, and the MACD showed weakness in advance.
3. Eventually Gold sold off into the ICL. Please study the chart and then I want to zoom in even more…
.
Zooming in even more:
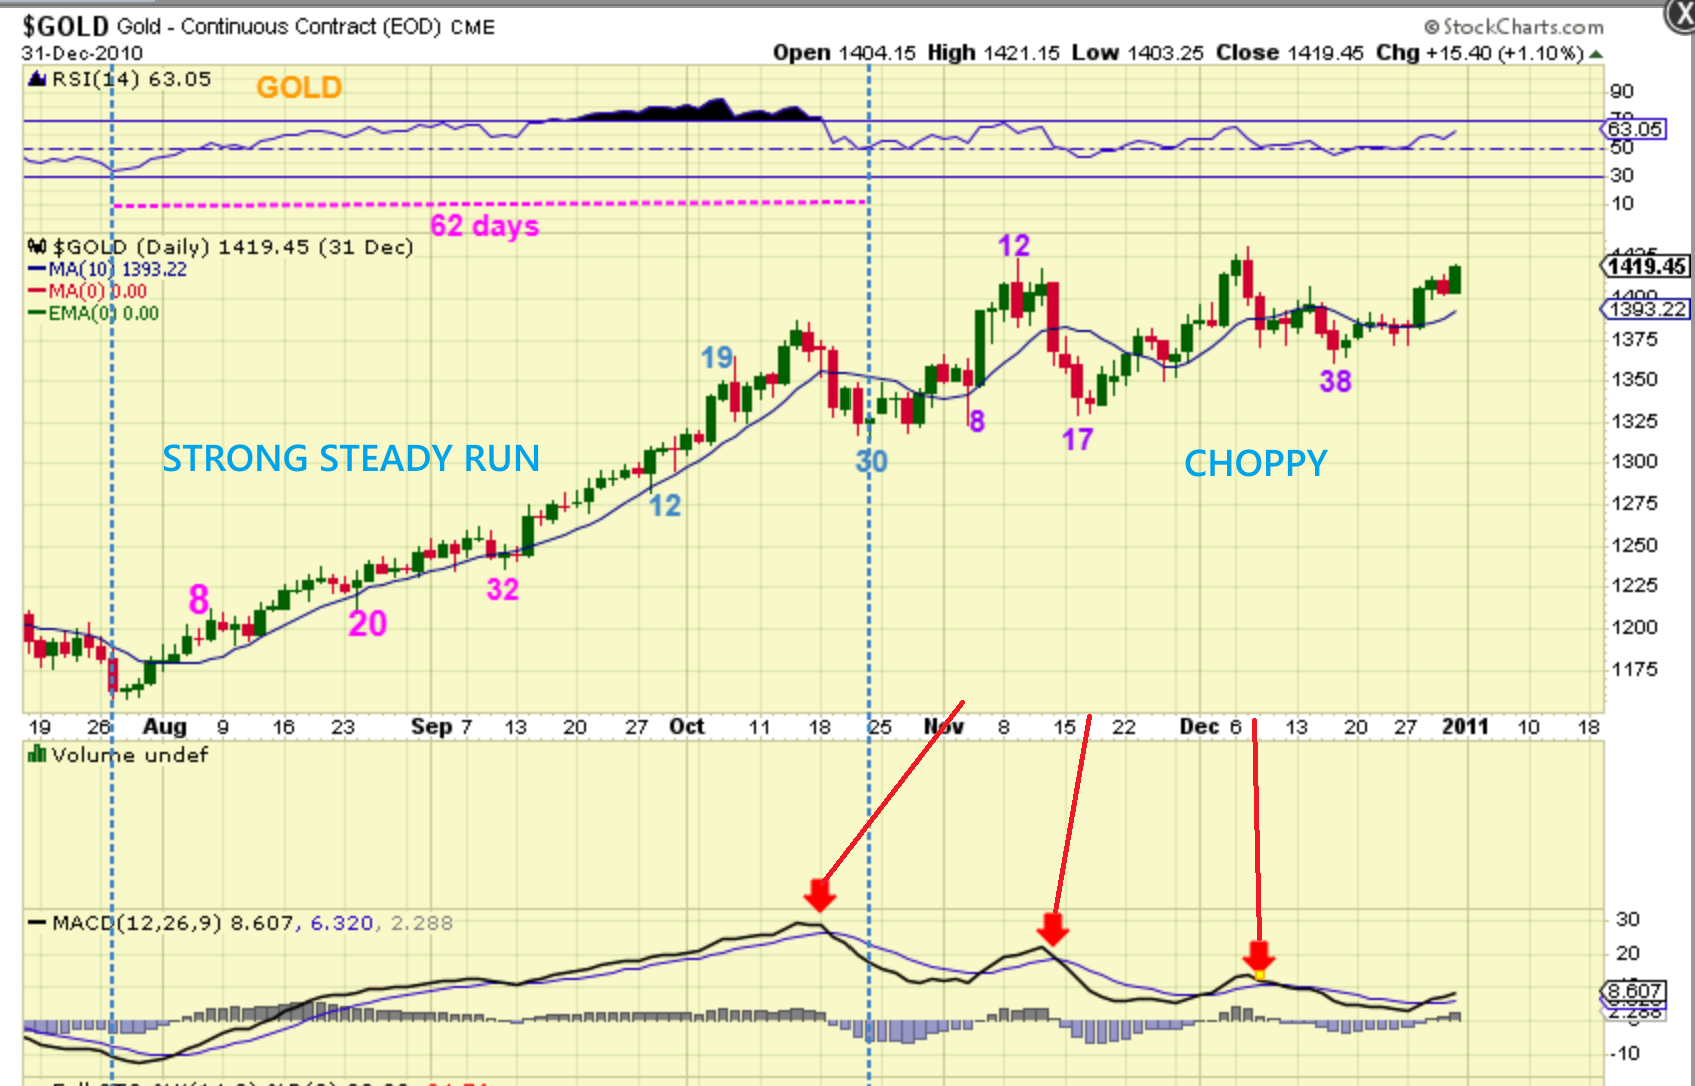
1. Here we see that GOLD had a strong first daily cycle that barley dipped in the first 25 days, and then a mild pullback into day 30.
2. After that, Gold made new highs on day 9-12 but showed MACD divergence and gold dropped to a half cycle low for day 17. It was now consolidating those gains.
3. Next Gold rallied again and the MACD was even weaker, and it sold off again into day 38. So this is a weakening daily cycle rather than a strong continuation of that Aug-Oct run. It began a consolidation period. It was temporarily topping with that MACD signaling weakness. This is similar to what we see in Gold right now, a consolidation of a good run higher..
.
Same chart: In the weekday reports I have mentioned recently that I don’t like to see Gold (& Bitcoin) rally up to former highs and at the same time see the MACD weaken. That can cause choppiness, so that is what I predicted for Gold and Bitcoin over the past couple of weeks. So…
.
THIS MAY BE AN EXAGGERATION OF TIME: I simply drew it to show that each new high may fail.
In the weekday reports I have mentioned that I don’t like to see Gold (& Bitcoin) rally up to former highs and at the same time see the MACD weaken. I said that this condition can cause choppiness, and that is what we have seen with both Bitcoin and now Gold. This is why I wanted to visit the 2010 Gold rally with the thought, “Did Gold rally after this choppiness?” And “Yes it did.” is the answer. Now I’ll raise another question…
.
GOLD did rally after this Chop and an ICL. Now notice the dates for this choppy toppy period, where Gold could NOT Hold new highs. It was in an entire Intermediate Cycle from July 2010 to Dec 2010 (& then it dropped into an ICL & ran strongly out of that Low). This was a consolidation period for Gold after a strong run, but my next question is,
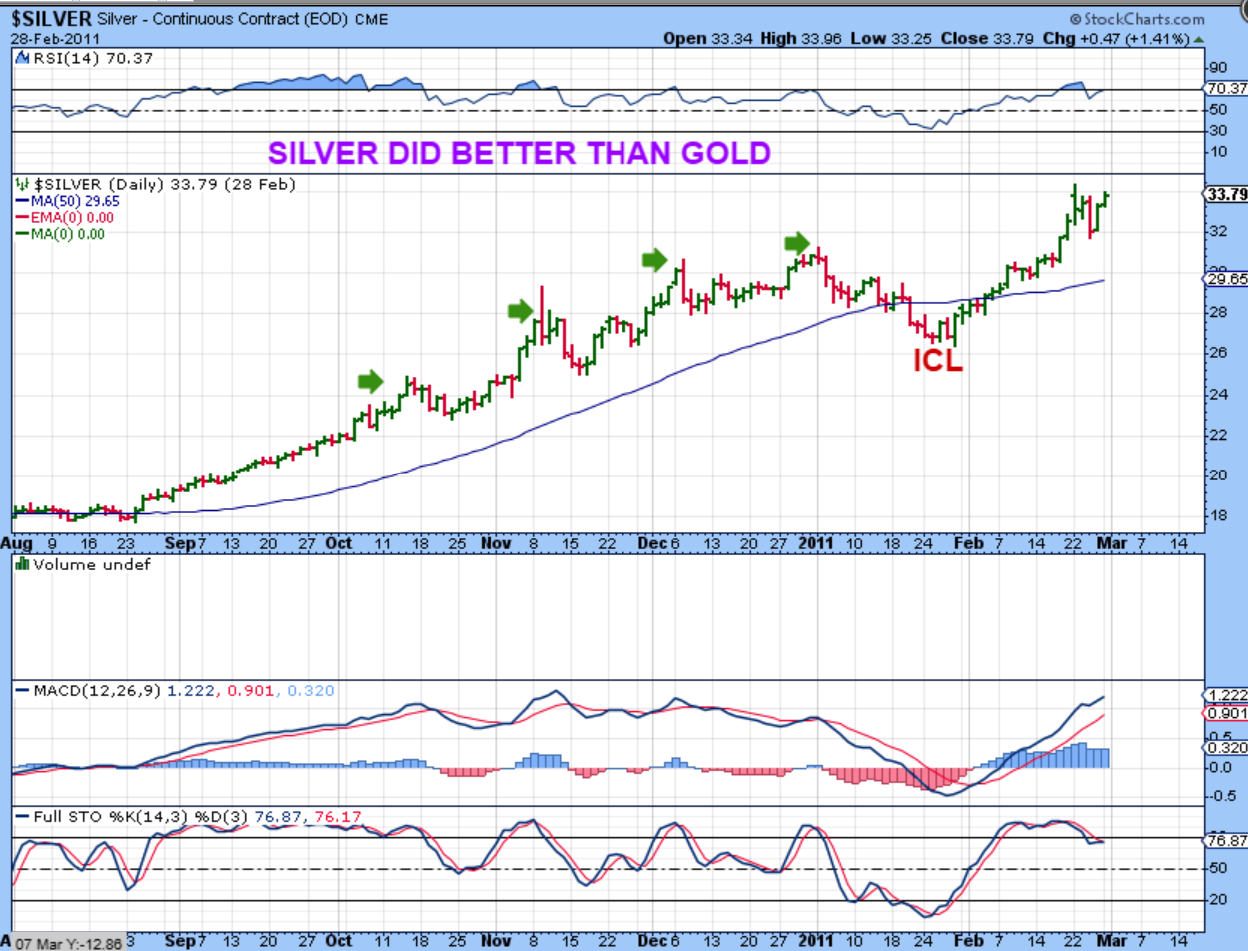
“What did Silver do at that time of July 2010 to Dec 2010?“…
.
“What did Silver do at that time of July 2010 to Dec 2010?“…
.
Notice now that SILVER from July 2010 to December 2010 was a bit choppy too, but the MACD was confirming new highs into December, so it held the gains better. Silver made gains steadily while Gold chopped sideways. It ran higher & then dropped into that ICL too. So my point here is that I think Gold is getting choppy and may be struggling to make & hold new highs, the MACD backs my observations up. If this continues in a 2nd & 3rd daily cycle, we now see that Silver can still outperform and even some Gold miners could do well. Then at the next ICL, both rallied strongly, as you can see here with Silver.
.
So the bulls continue to have control at this point, despite the small pullbacks along the way. Until that changes, we can buy the dips, especially at daily cycle lows and half cycle dips. Bitcoin is covered below, I hope all are enjoying their weekend!
.
~ALEX
.
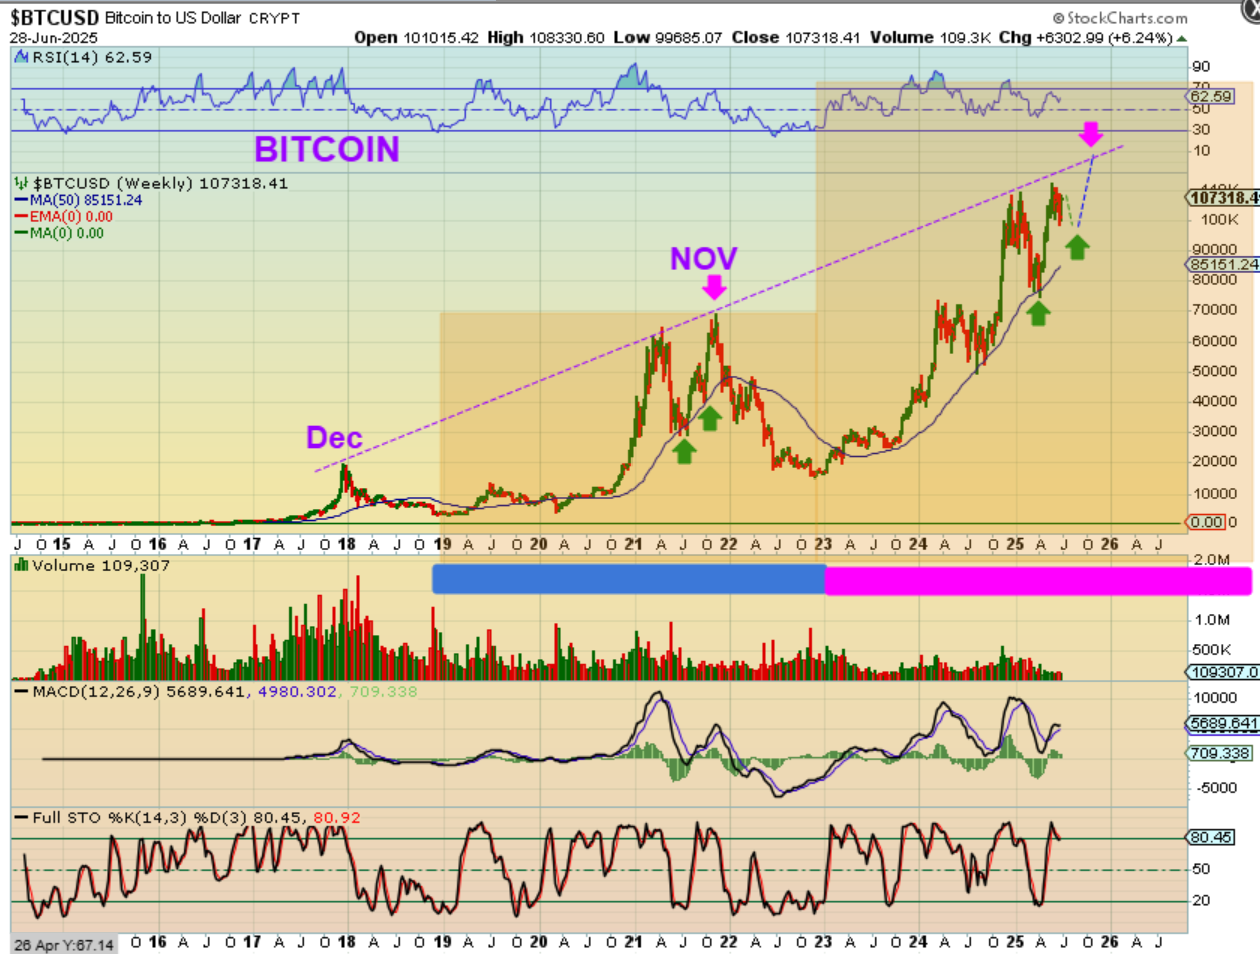
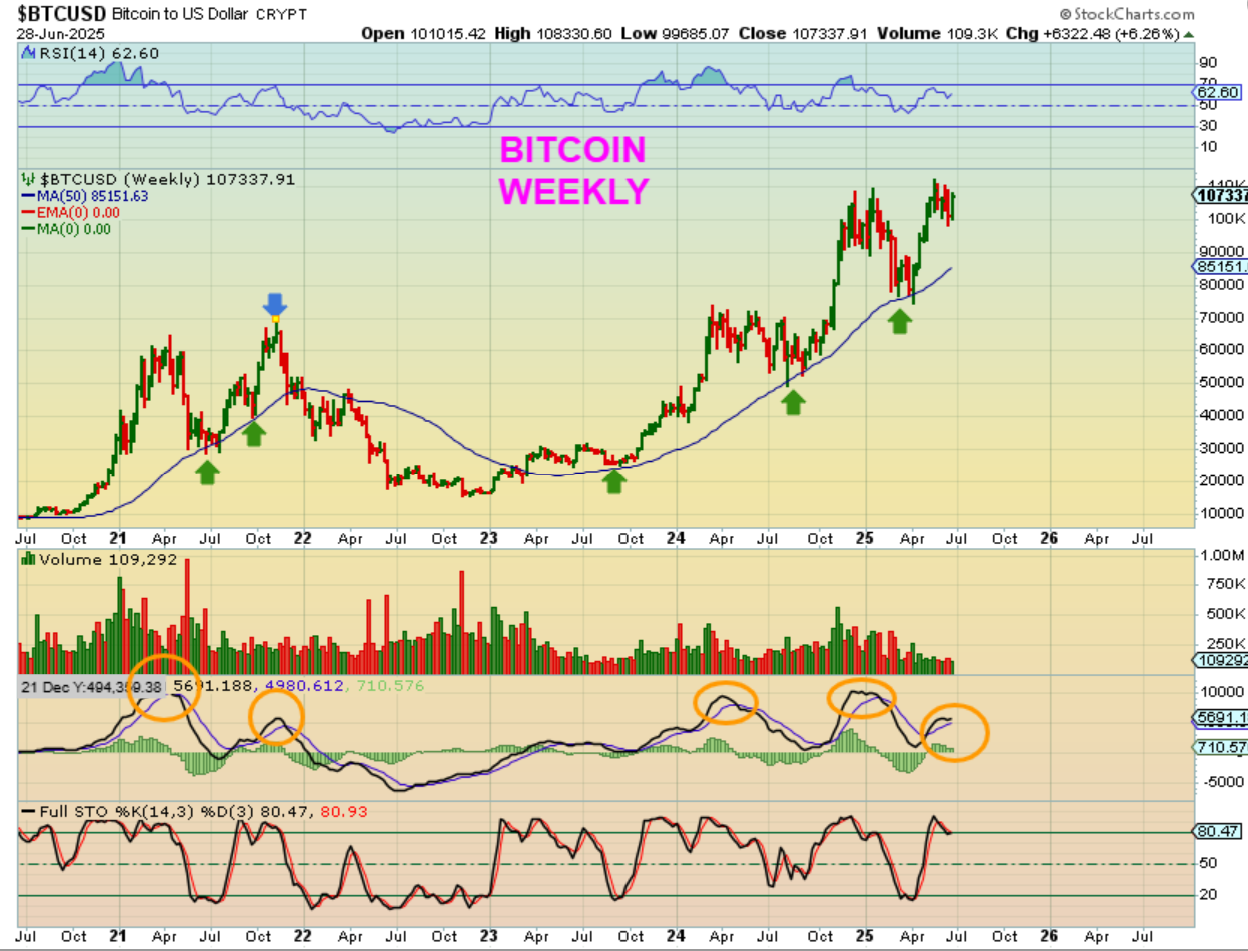
BITCOIN WEEKLY – Bitcoins big picture has it rising up out of that 4 year cycle low in 2022, and on bigger consolidations or dips, it bounces off of the 50 week ma. That remains bullish, but I did call for this recent choppiness that we see taking place now. Bitcoin was up 6% this week…
.
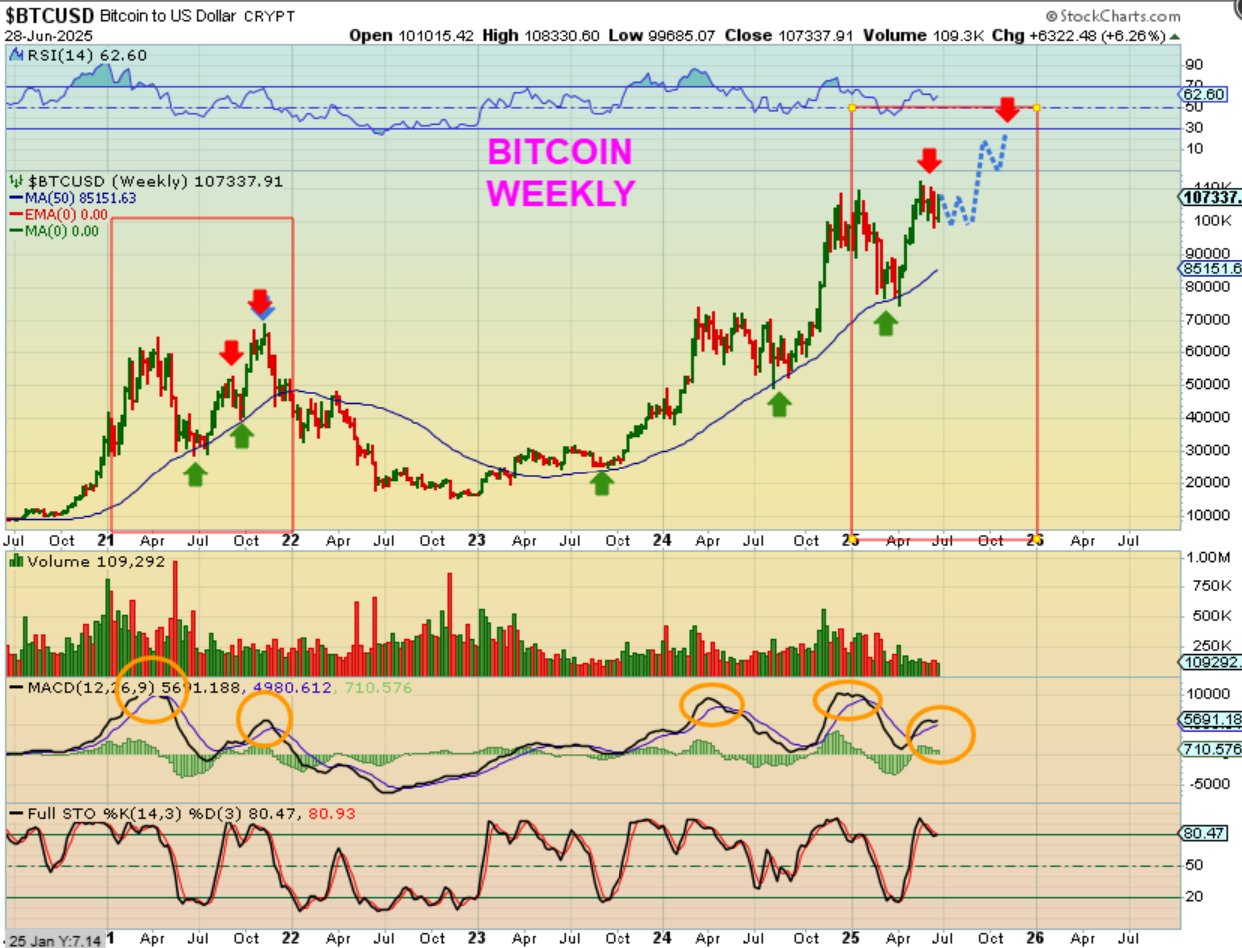
BITCOIN was also showing us (on the daily chart) a run higher where the MACD was not confirming it, so I called for choppiness and that is what we have. When that ends with the end of this cycle, we could still run higher to that $120,000-$130,000 target that I have had for months. I drew that possibility here and we do have time in 2025 for that to happen.
.
Interestingly, as time moves forward for BITCOIN, we reached the top of this channel. This could be a double top where the run ends, similar to what you see in 2021, however a run to $120,000 would also bring us there 1 more time. We DO have enough time left in 2025 to make 1 more run in the 3rd year though, so as always, I will be reporting on this in the daily reports as well as future weekend reports, along with the crypto stocks like RIOT, CIFR, IREN, MARA, CLSK, HUT, WULF, etc etc ..