June 14th Weekend Report
Note: I want to release this without taking the time to proofread it, so that I can release it tonight instead of in the morning. I am on my way out, so please excuse any typos at this time. Thanks!
.
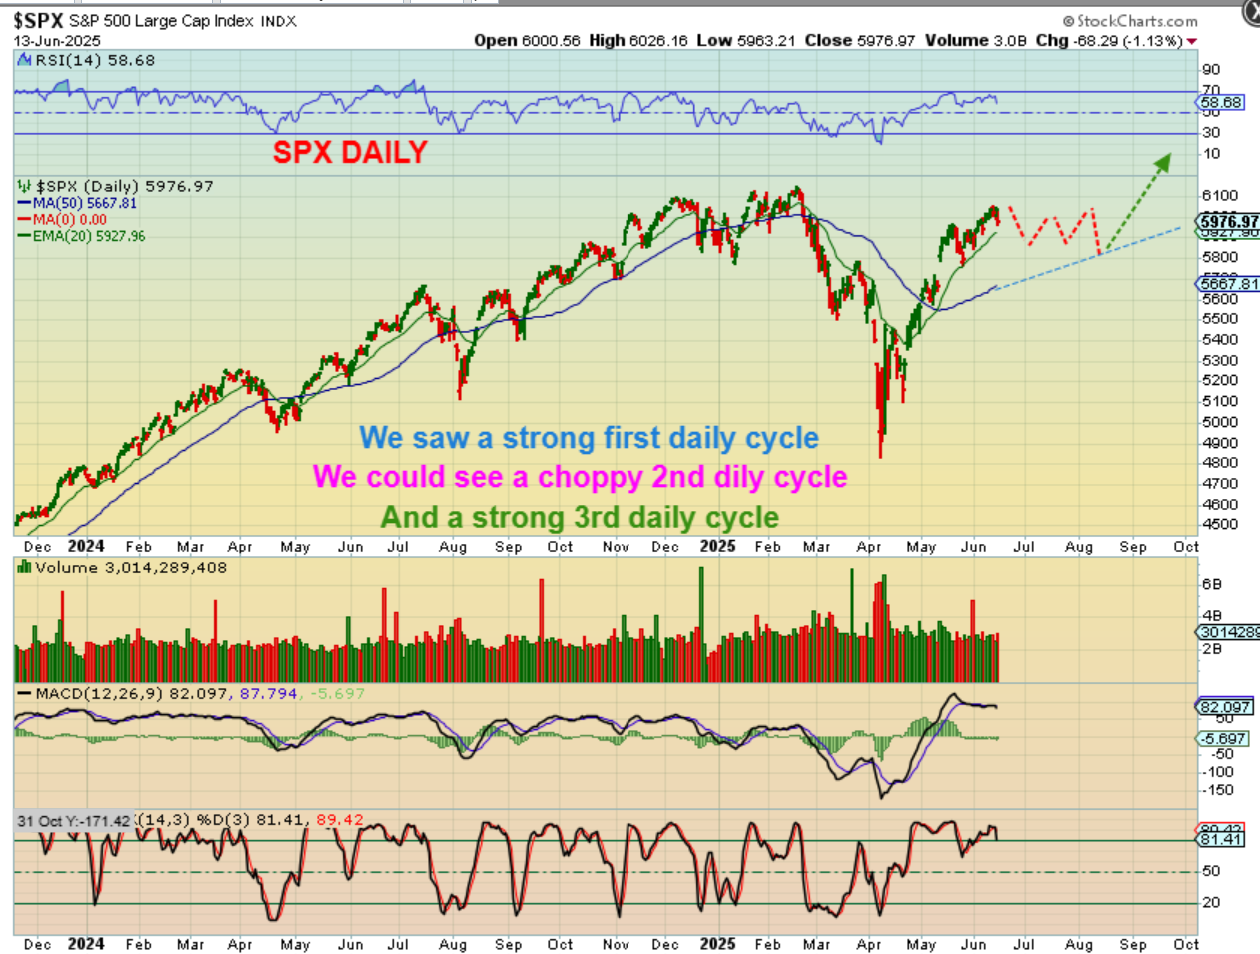
The SPX was only on day 14 Friday, and it dropped. The first daily cycle out of the ICL was strong, and it is possible that the 2nd daily cycle will be more or less sideways, and then a 3rd daily cycle could be stronger. (I probably should have drawn this a little shorter into July, not August).
.
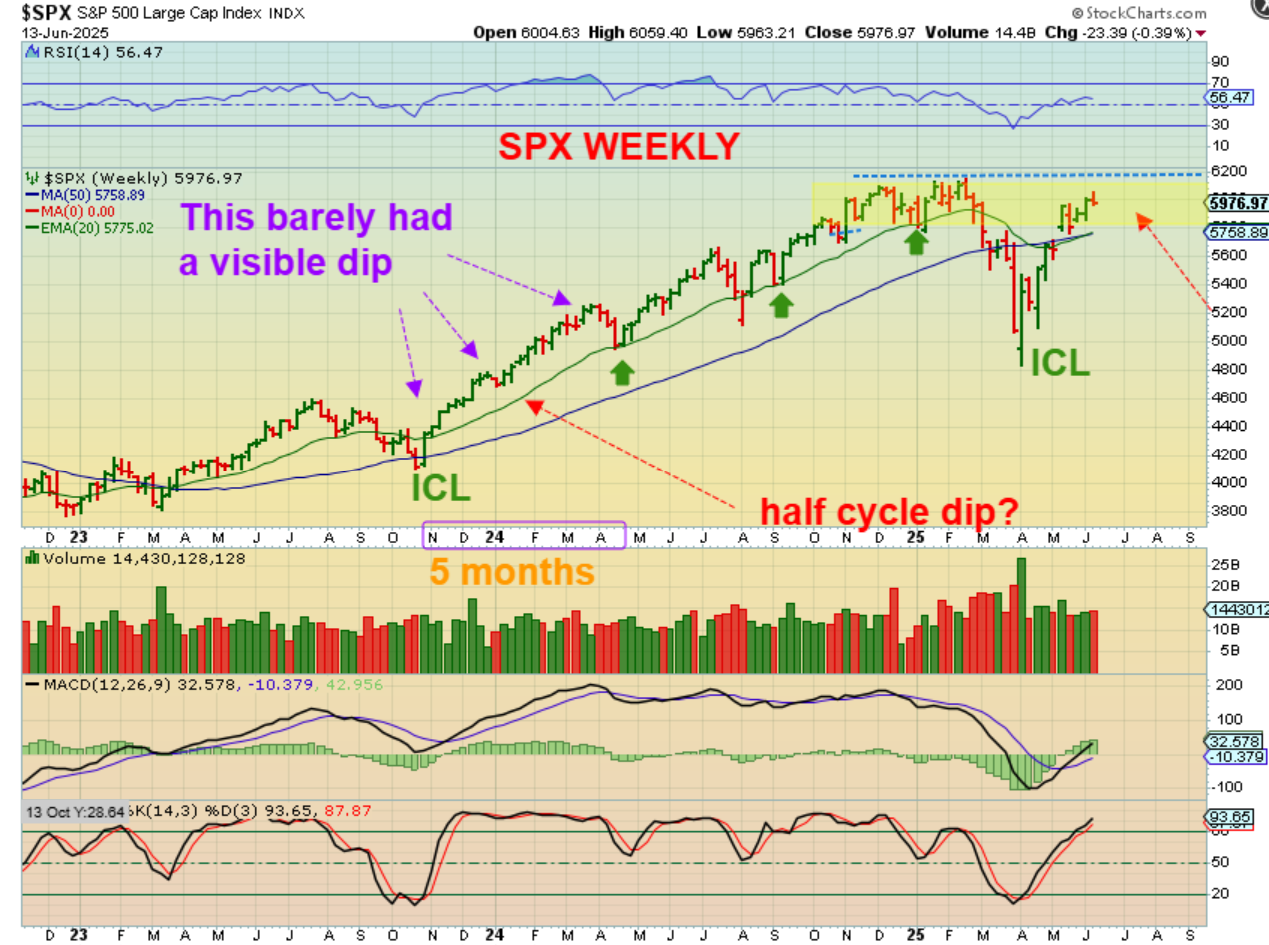
SPX – In the past runs out of the ICL, the ‘half cycle low’ is hardly detectable, and we may have that here too, with a dip on Friday from the news of another military attack breaking out.
.
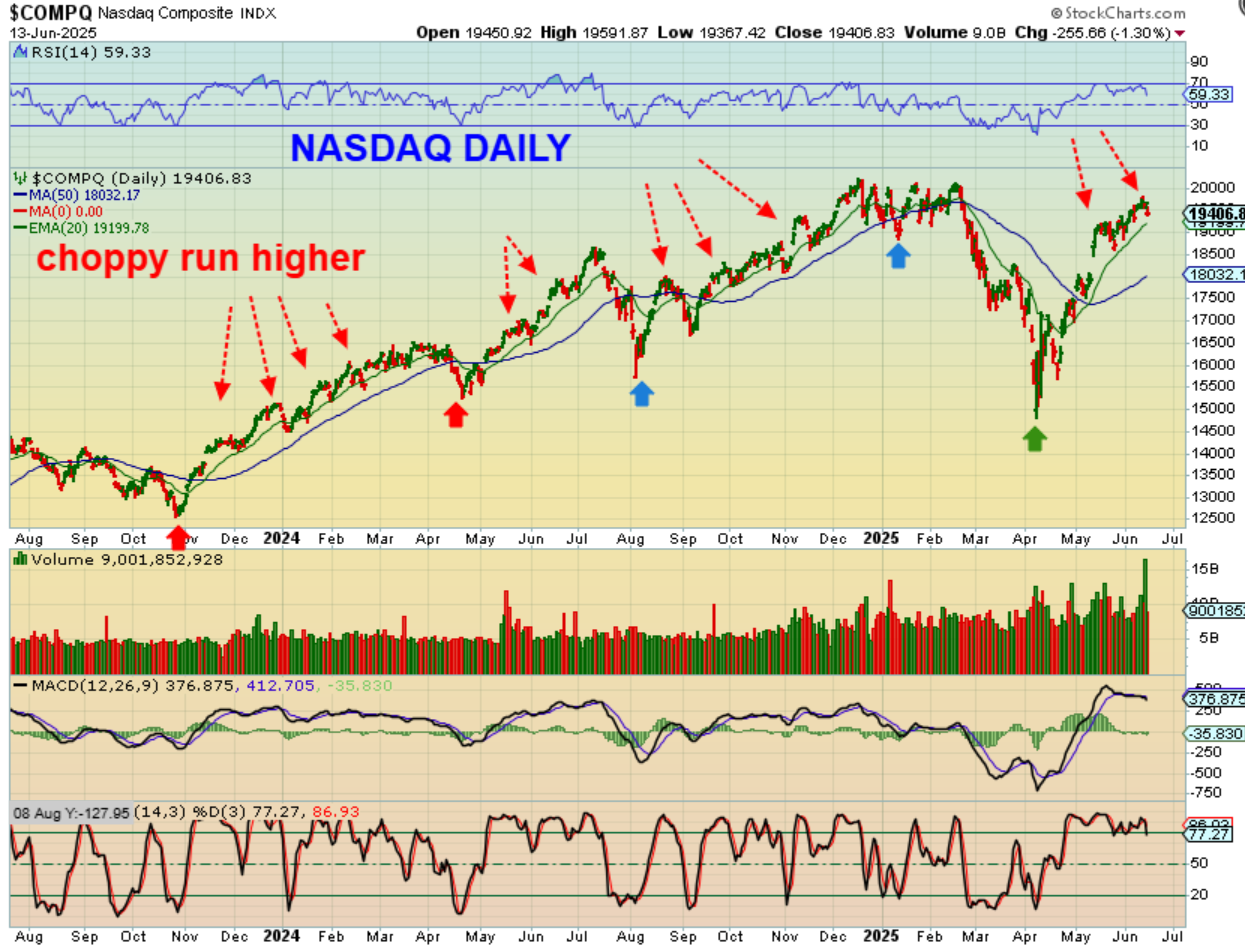
You can see that this market dip is not entirely abnormal. The NASDAQ was very choppy in past rallies higher, but it was still considered a strong bull run. This is not abnormal at this point.
.
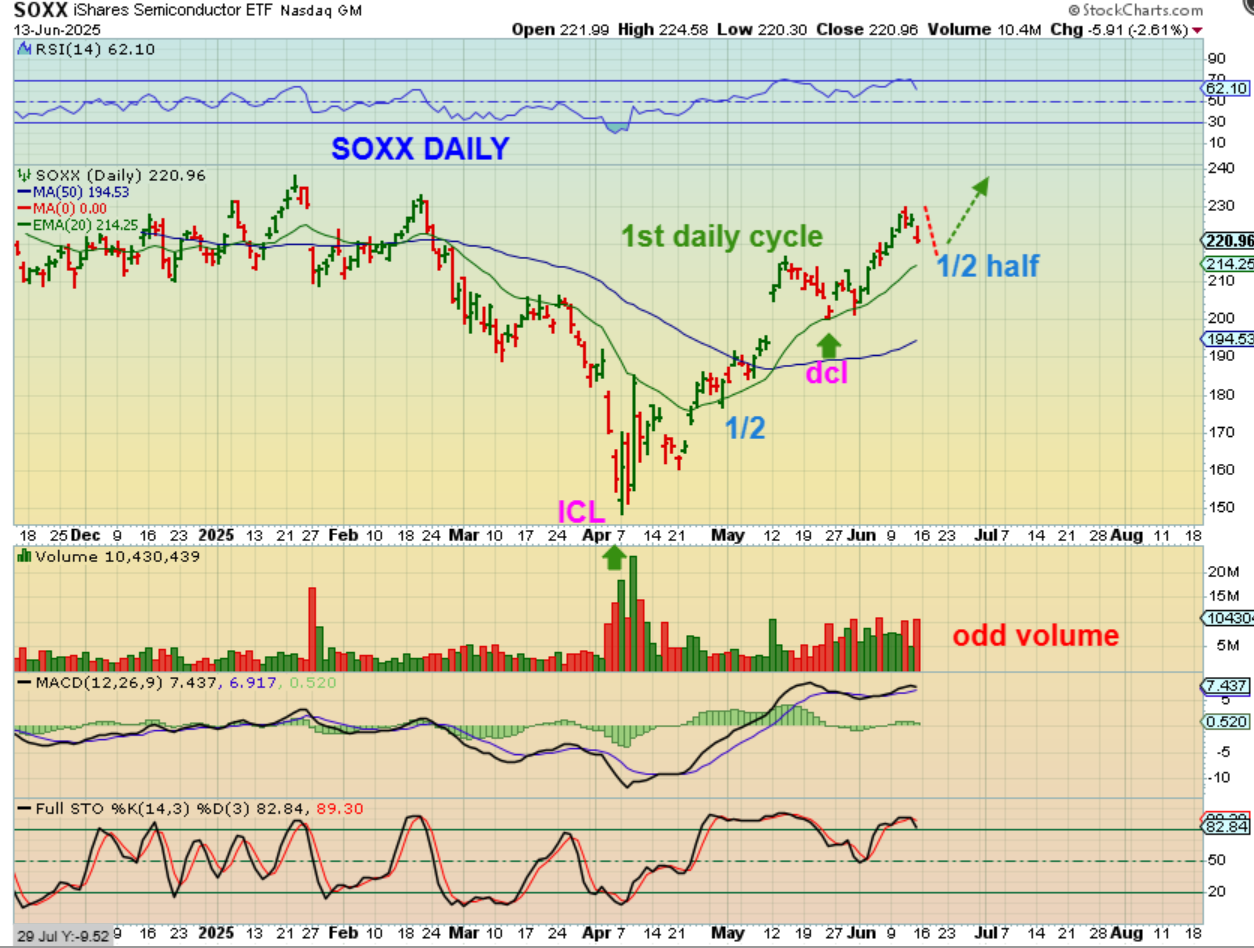
THE SOXX was a buy 2 or 3 times as it lagged and started to play catch up. You can see how a dip like this, if it is short-lived and only drops to the 20 ema, can simply be counted as a half cycle low.
.
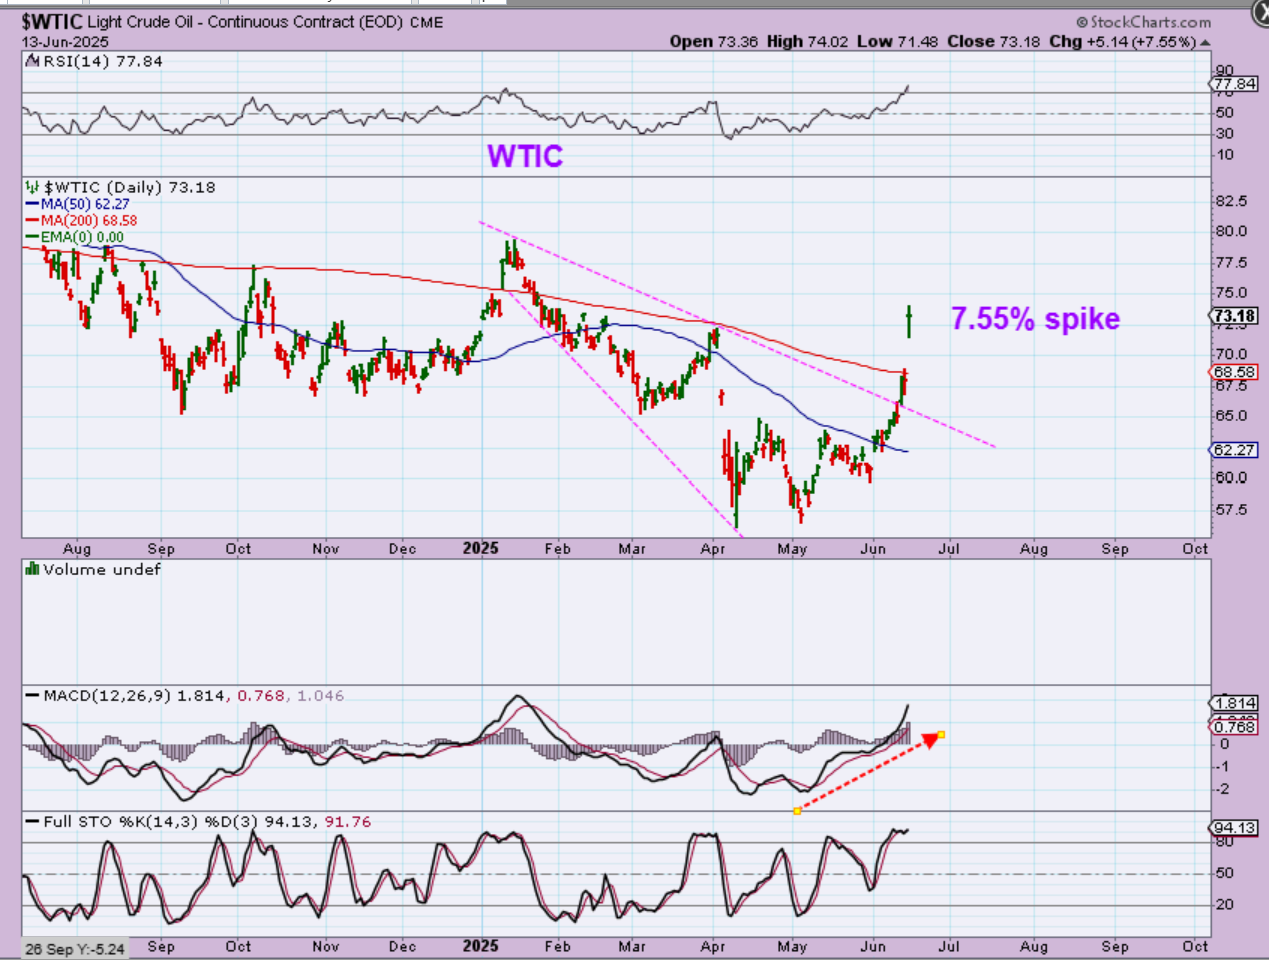
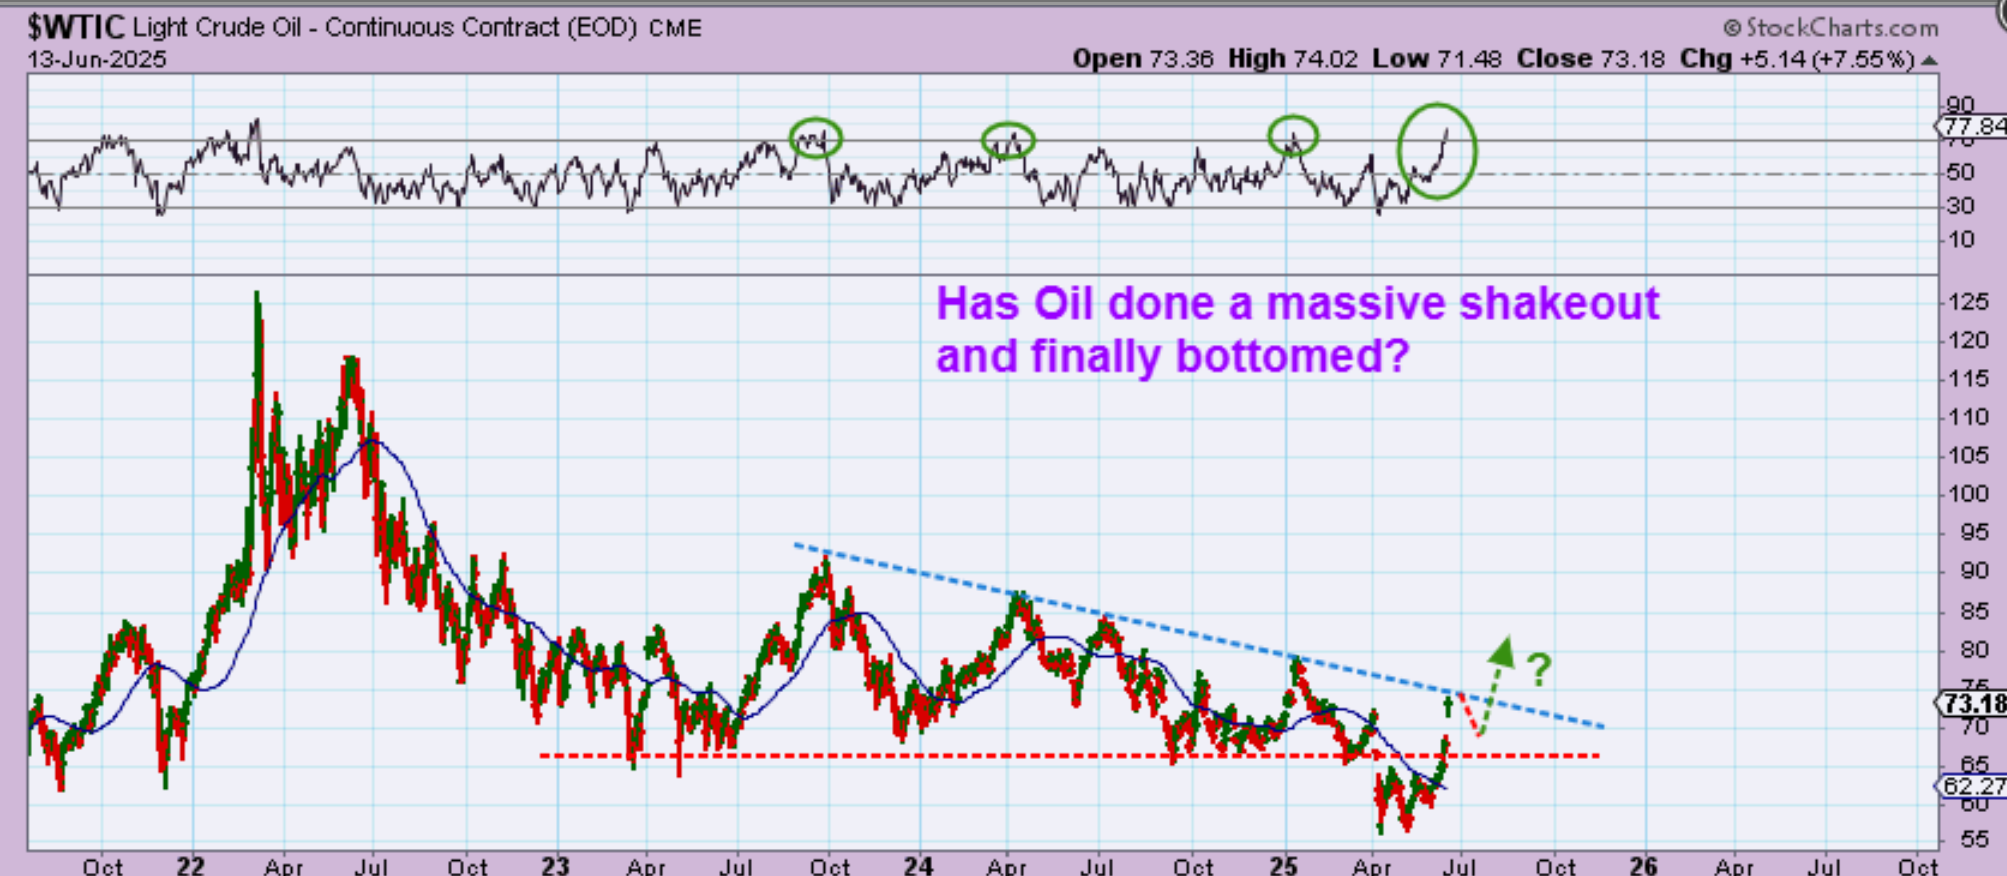
WTIC – When Israel bombed Iran, Oil actually popped to $78 overnight! That is a huge 20% pop, but it settled down and traded up 7.55% on Friday. That obviously easily broke the 200sma and Oil is only on day 10! Let’s zoom in…
.
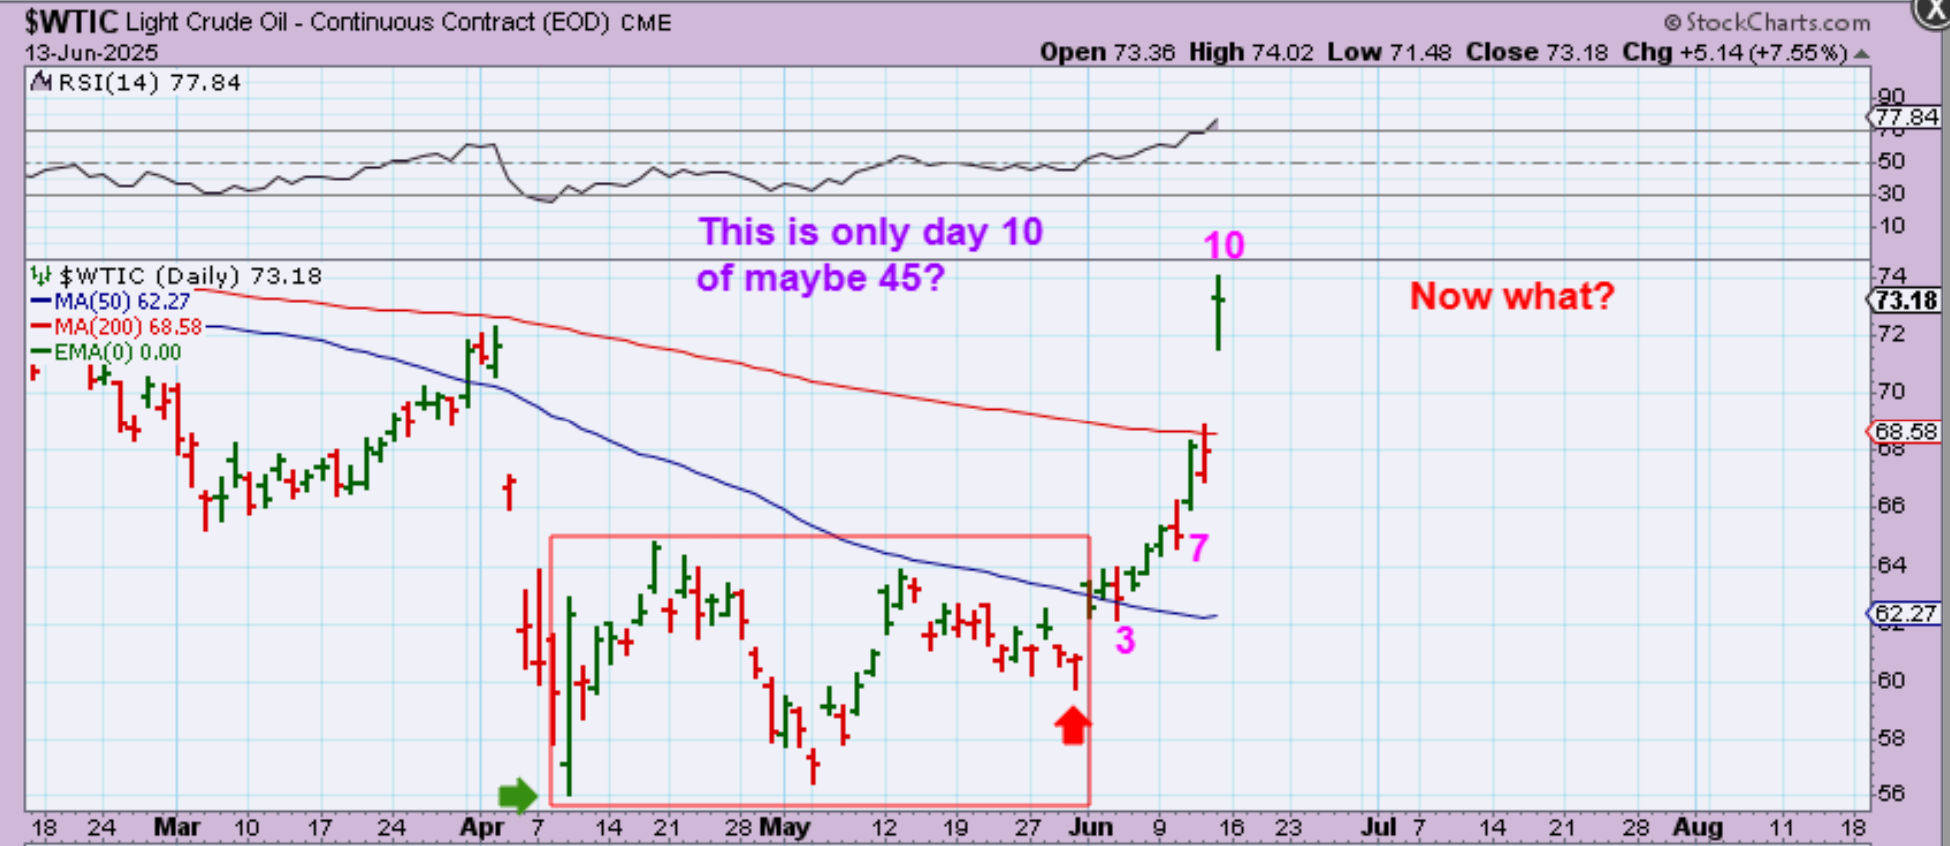
WTIC – So this is only day 10 of maybe 45+? Now what? It screams back up to $100, like the days of old? I doubt it. I think that…
.
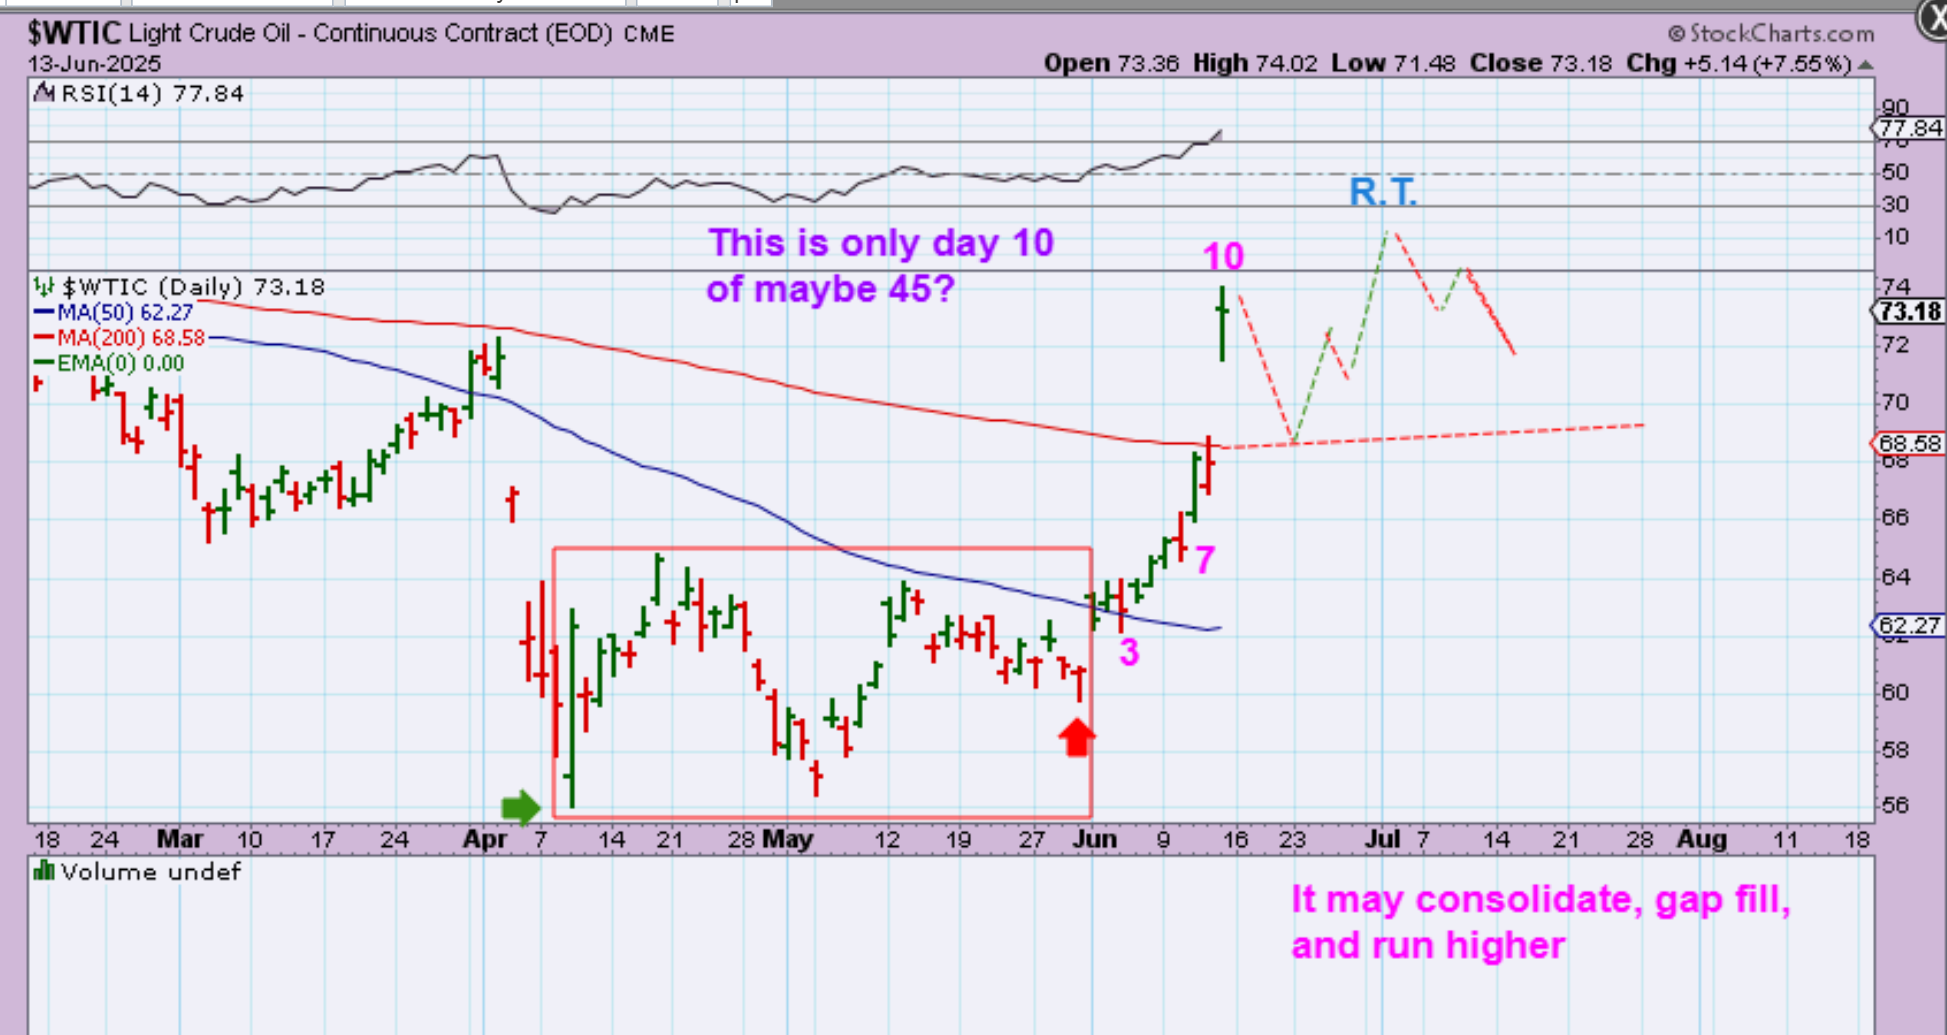
WTIC – I think that we could see Oil start to pull back toward the 200sma as a back-test and then rise back up to then give us a R.T. daily cycle. We could get a dip into the dcl around day 45ish with somewhat of a large triangle or flag consolidation. IF Oil starts to pull back now…
.
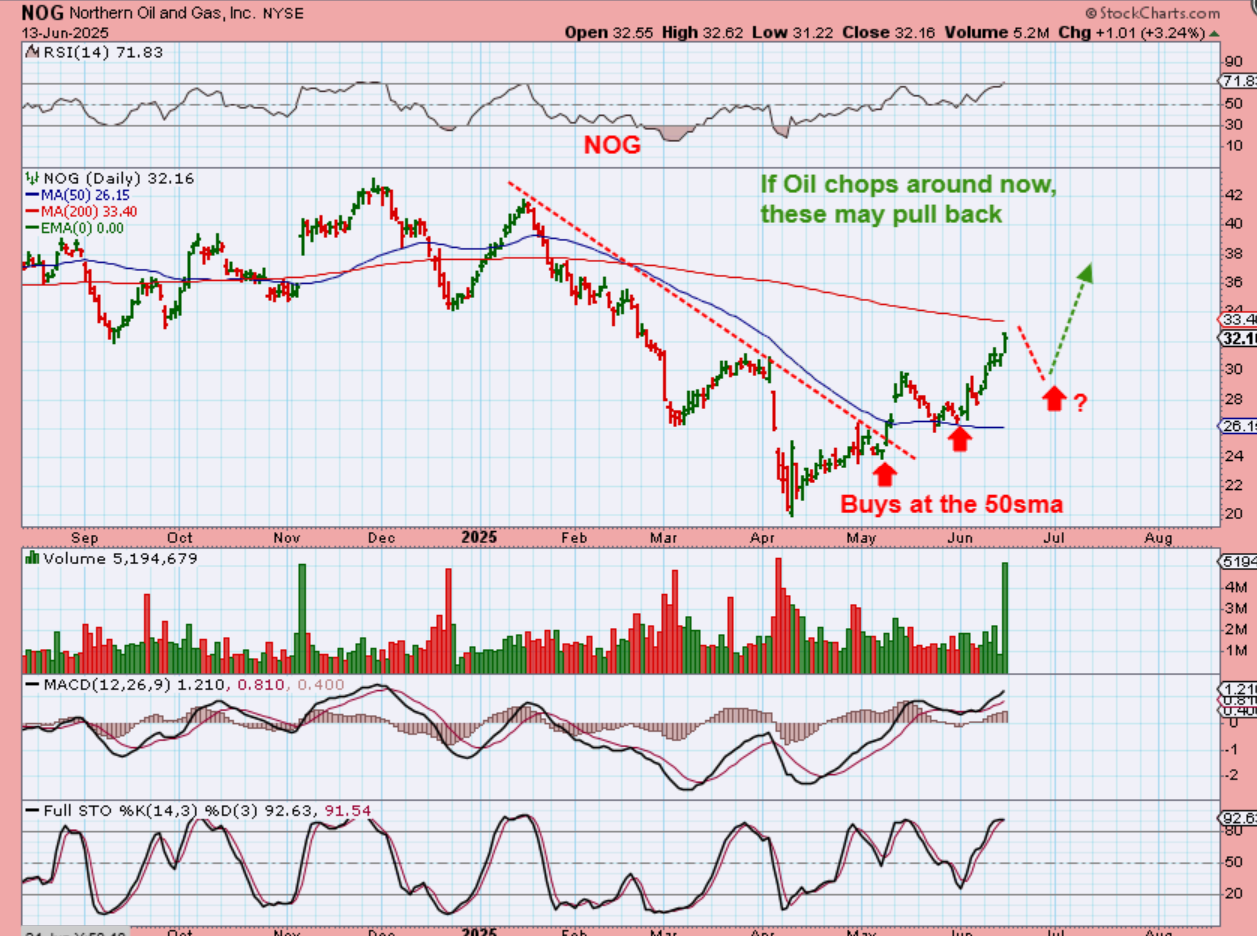
NOG, VET, APA, and a few other Oil stocks are still under their 200sma, so if Oil starts to pull back here, these could pull back as another buy opportunity. I did not take the ‘Oil Stock buys’ when I pointed them out a week or 2 ago, but I may want to buy them if we get this dip after Oils big 2nd daily cycle move.
.
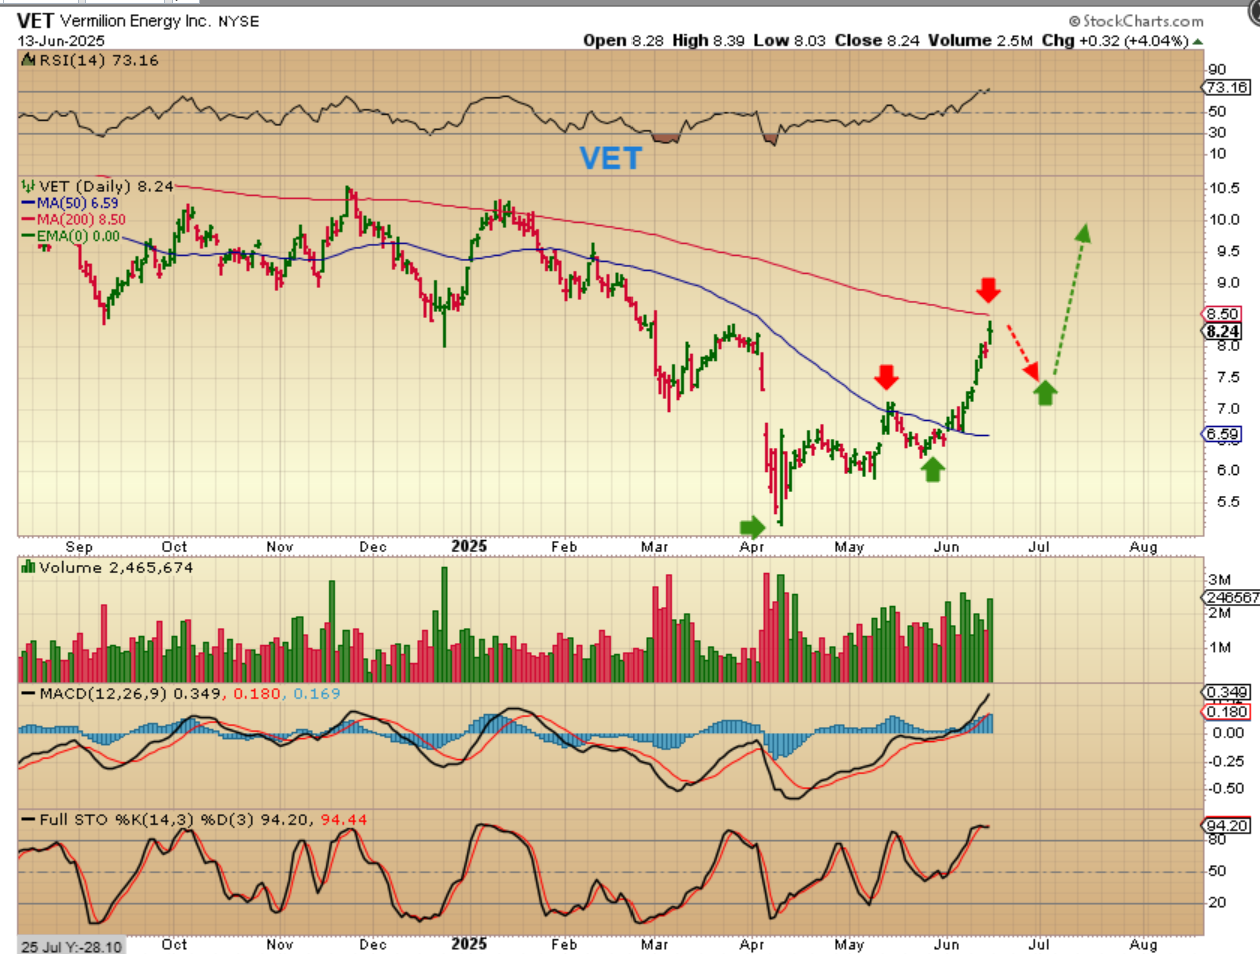
VET ran straight up to the 200sma too. Again,
1. If we break out higher and back-test the 200sma, or
2. If this pulls back now, then that could be a ‘buy the dip’ opportunity.
.
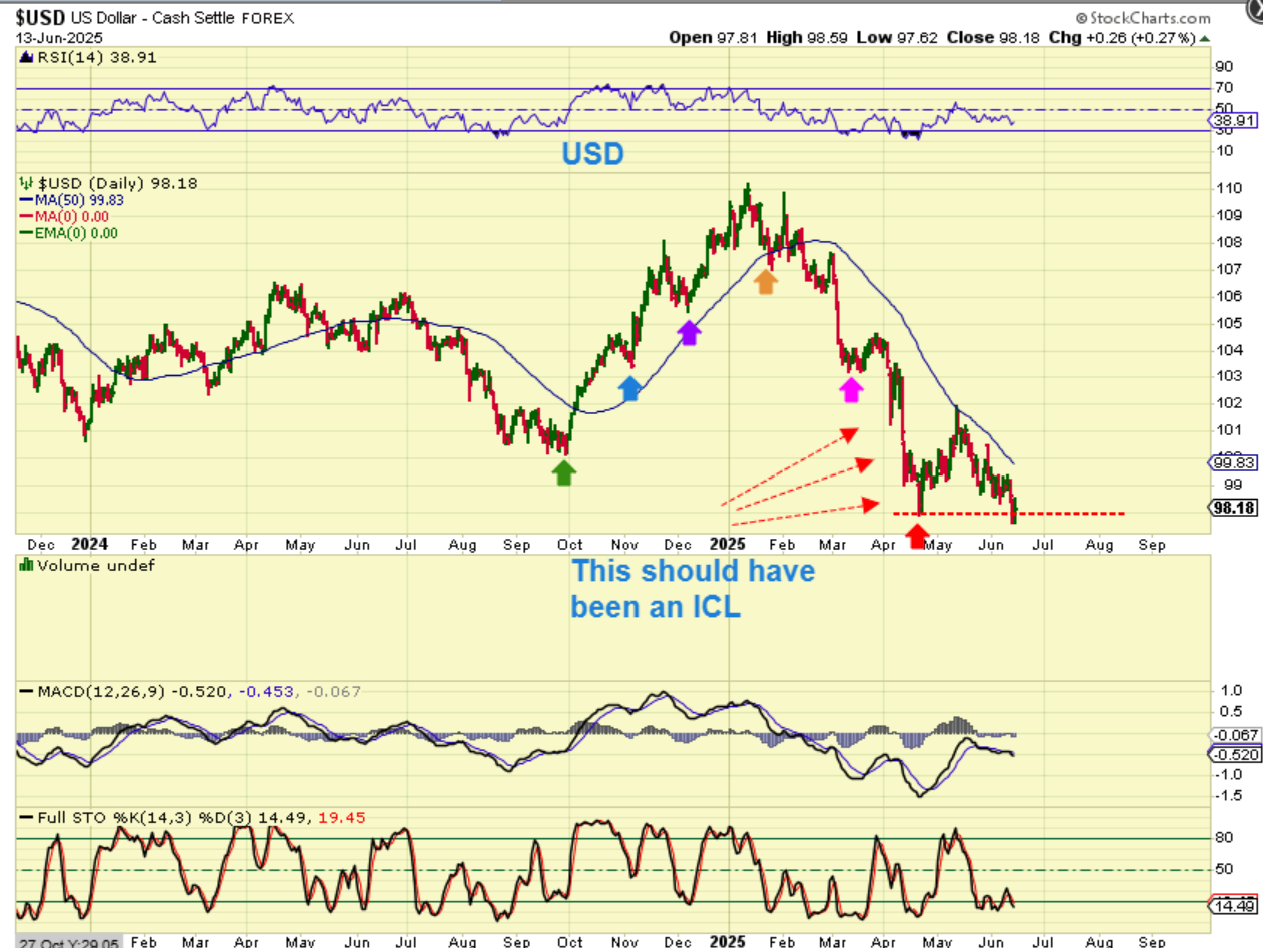
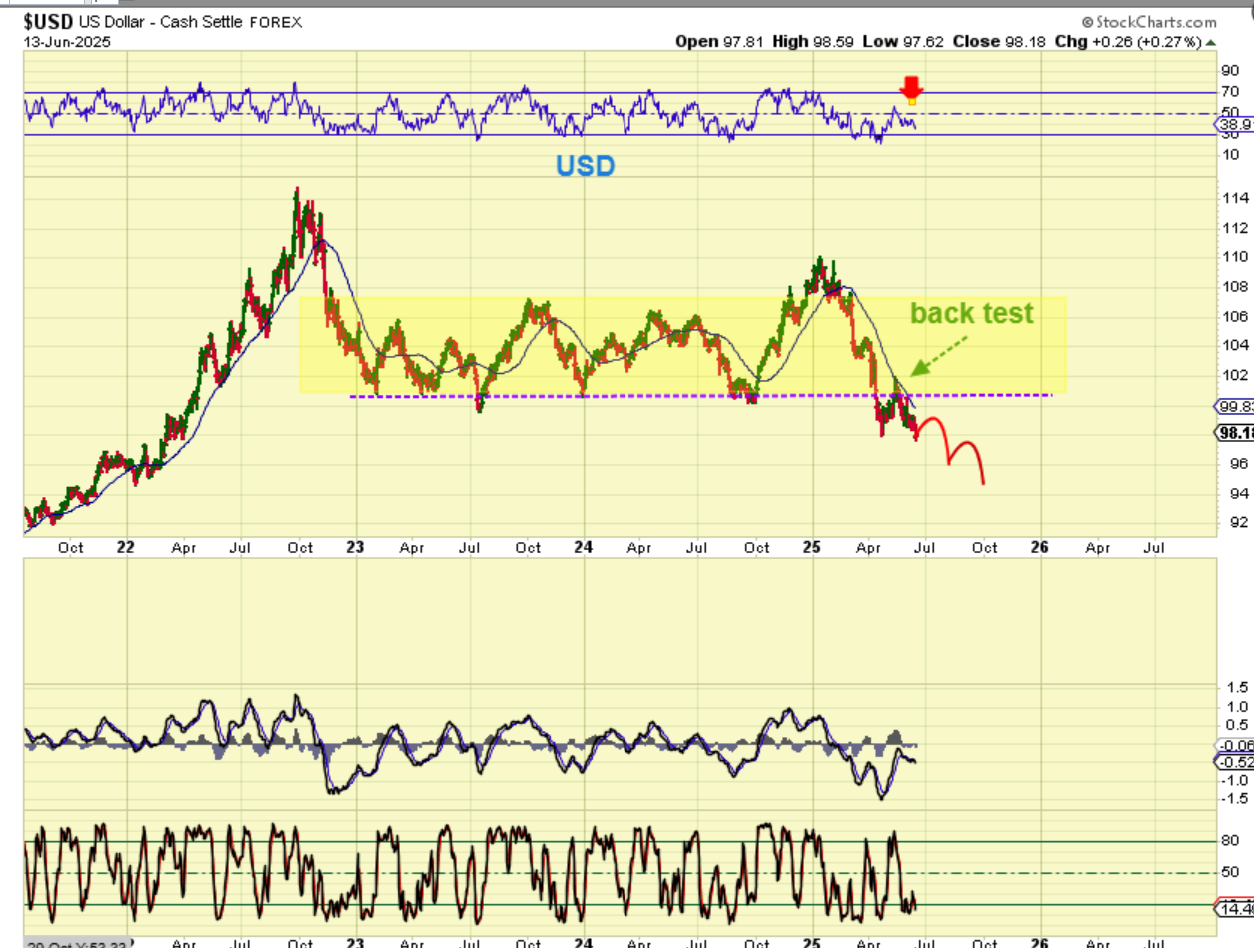
The USD did what it should not have been able to do. It seemed to have an ICL and then after a few weeks of rising up, it crashed below that ICL with the Israel / Iran situation. Look how sharply that USD drop into an ICL became from March to April was. The selling dried up and the MACD rose sharply in May. Let’s zoom in…
.
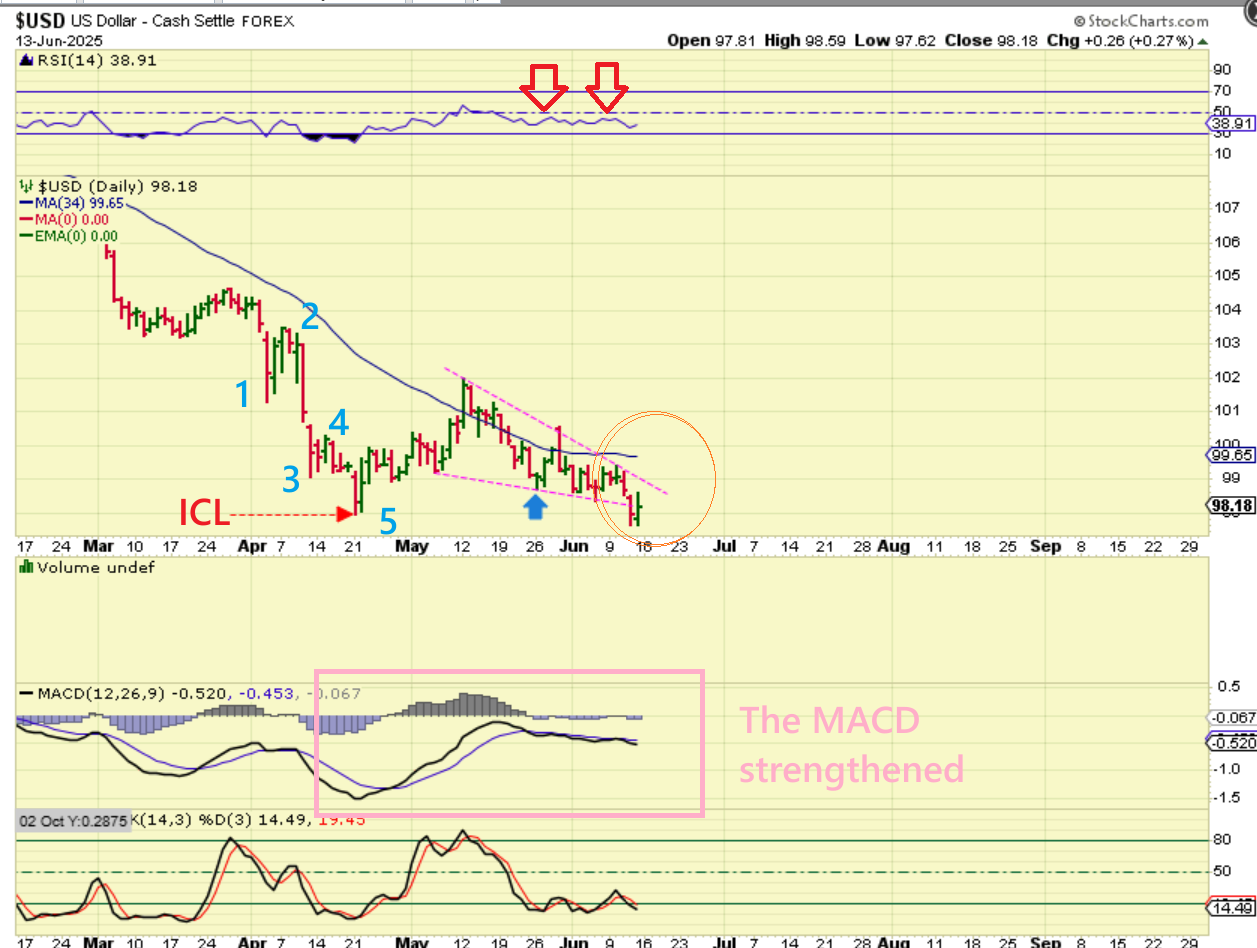
THE USD rallied out of what should have been a 5-wave ICL crash and formed a bullish wedge.
1. It is possible that the bull wedge simply formed too close to the bottom when ‘an outside event’ dropped it sharply into a false break down.
2. Notice that it then recovered on Friday to resume its current set up.
3. That would be a 1 day shakeout, so if I see the USD rise above the Majenta downtrend and the 34 sma, it still should be viewed as an ICL in April and a longer-term low is in place. If it continues lower?…
.
If it continues lower?… Then the USD may have some serious problems by failing on the second daily cycle after that May ICL. This does make sense, because GOLD & SILVER look ready to continue higher.
.
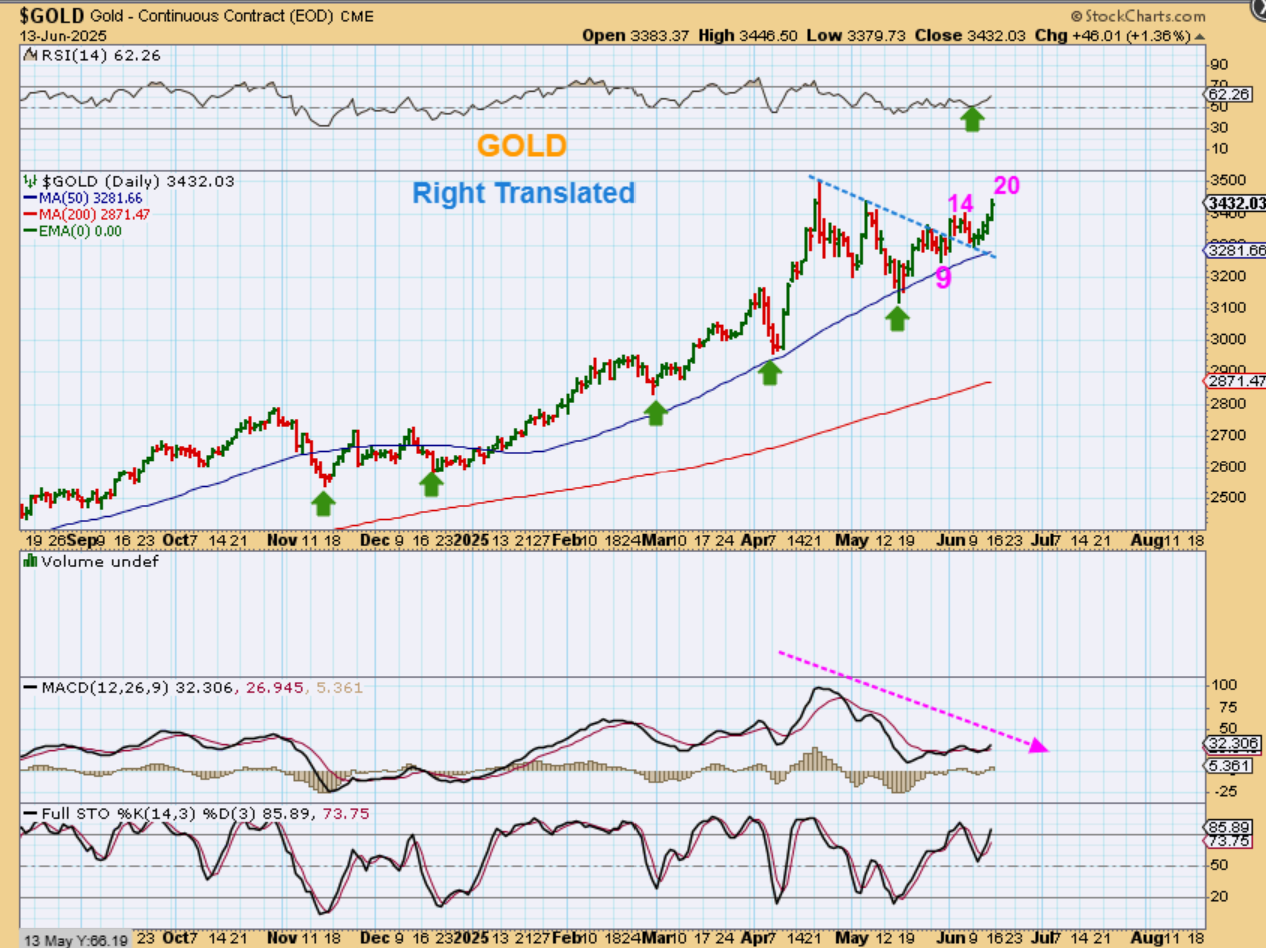
GOLD has also put in an ICL in May and on day 20 it has peaked. This is a bullish breakout of ANOTHER Triangle and fits the idea that the USD broke down.
.
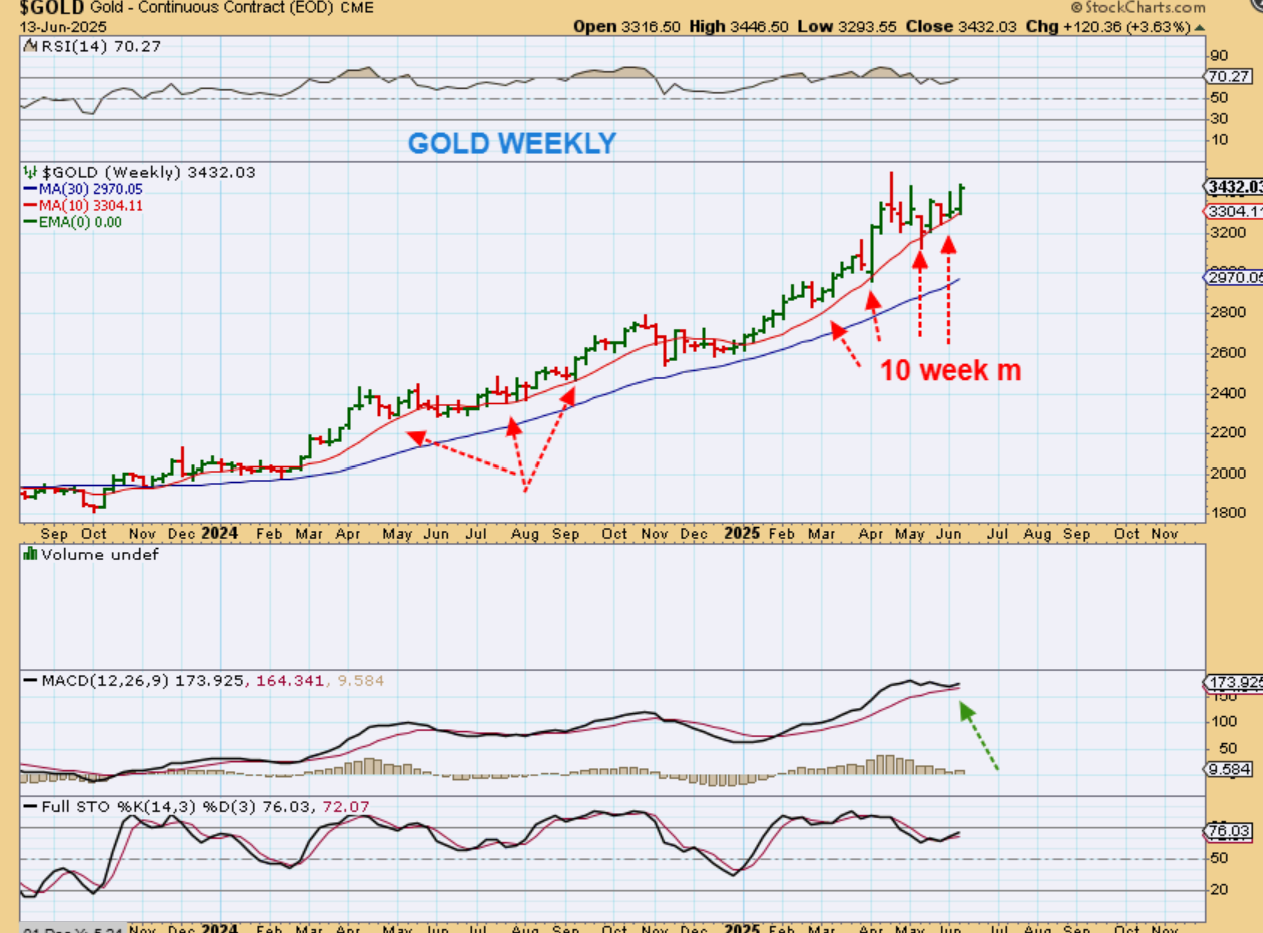
THE GOLD WEEKLY price action has bullishly climbed up and along the 10 week ma, and that is what a proper bull market does. They follow the 10 week ma and the 30 week ma. THIS makes me wonder if we just saw the USD fail on the 2nd daily cycle and it is about to sell off further while Gold and Silver continue to move higher.
.
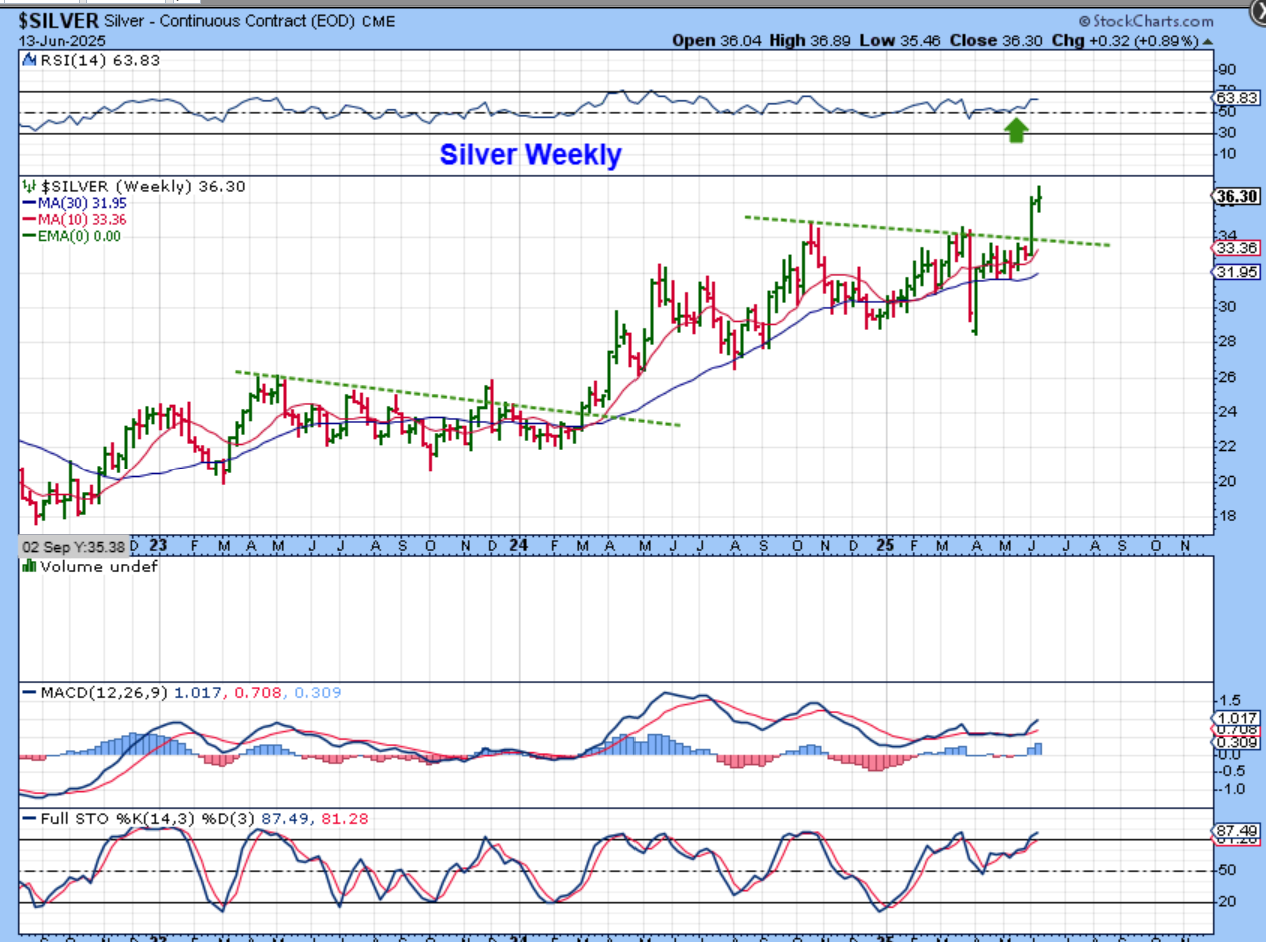
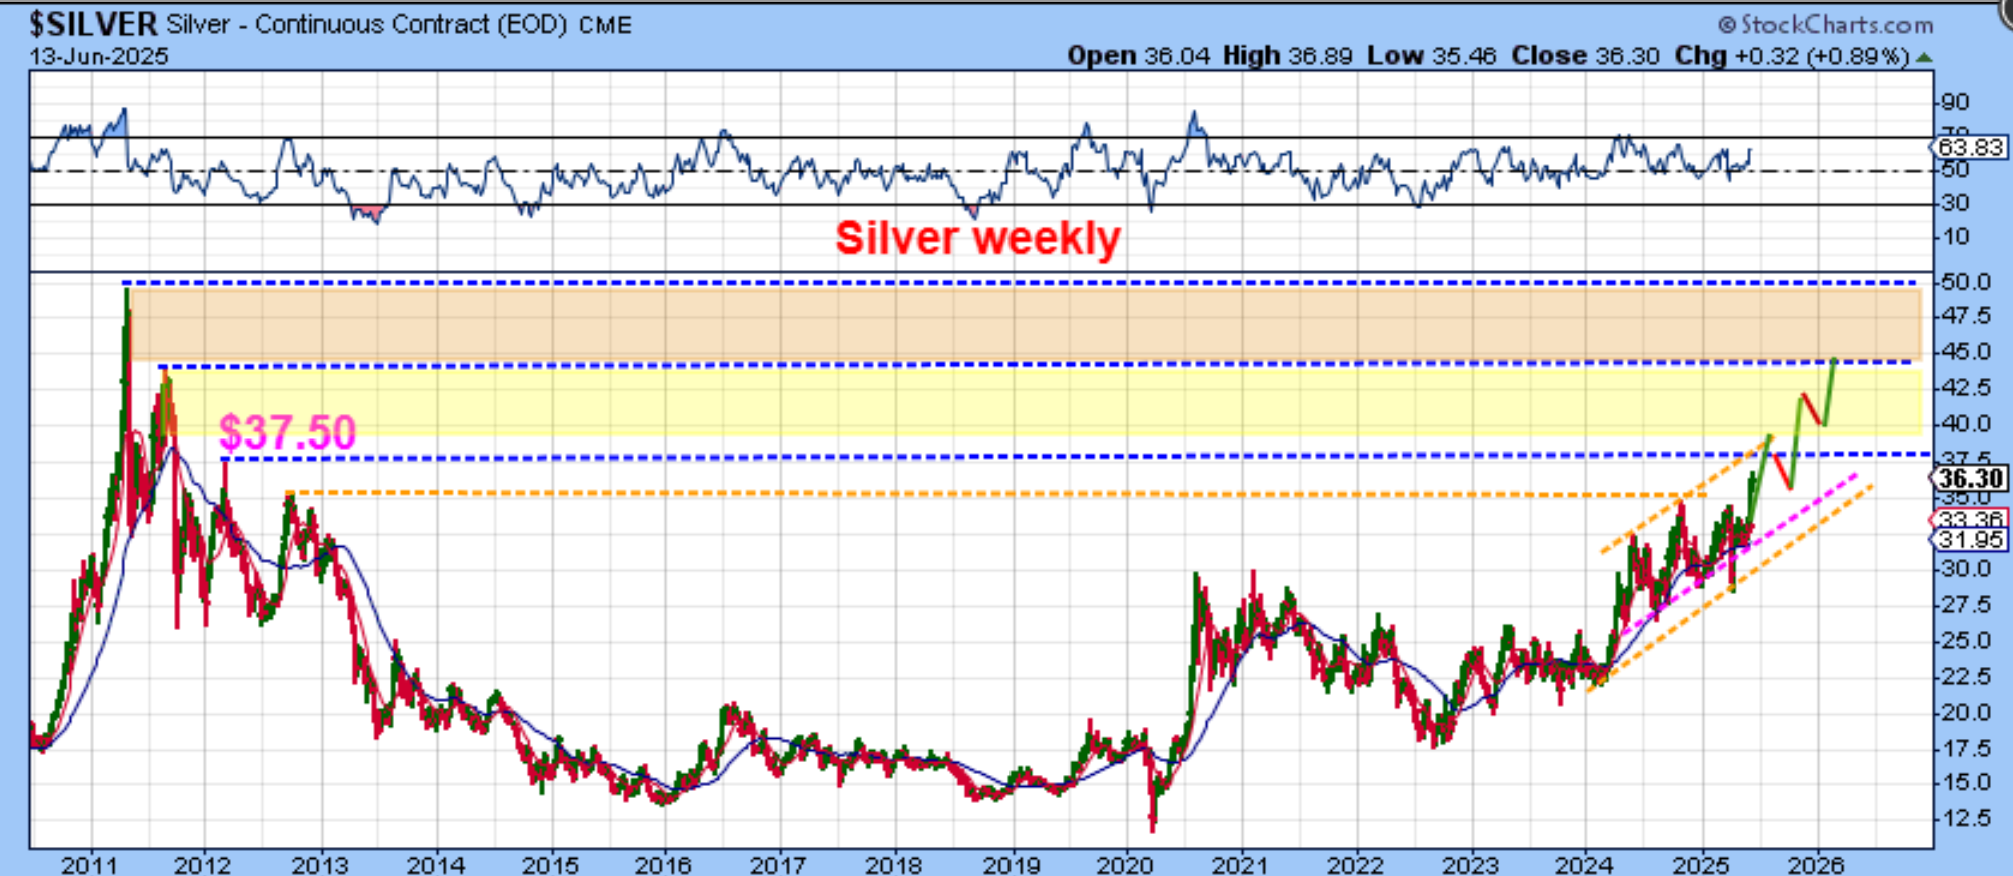
SILVER broke sharply higher a week ago and paused this week at the highs. This can continue higher, but it also, as a first daily cycle, will become due for a dcl soon.
.
In the bigger picture for SILVER we see price broke the prior peak (orange line) and is close to the lowest blue line peak at $37.50. Silver could easily tag $37.50 next week and then dip into a dcl. Silver hit $36.89 last week.
.
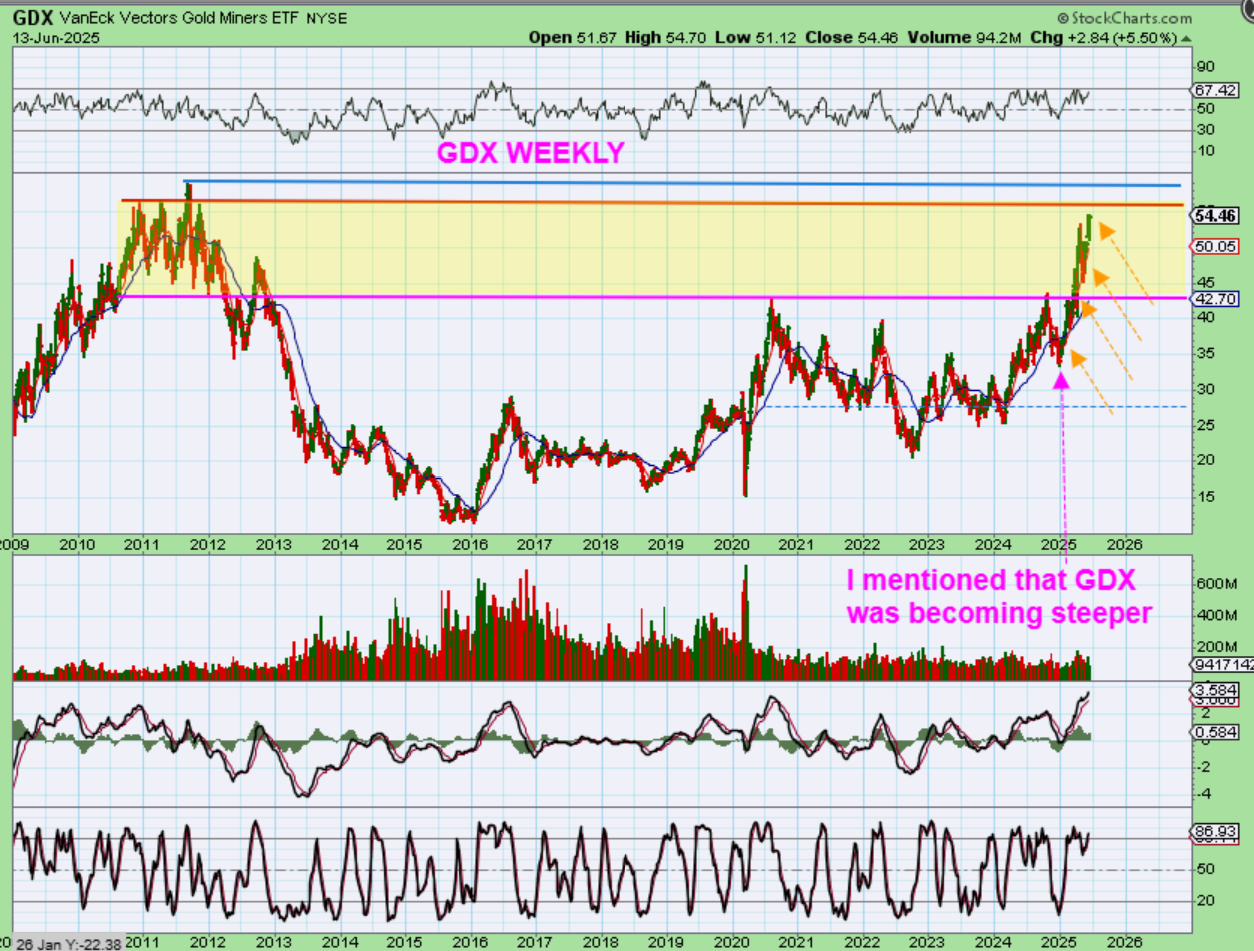
Recently I pointed out that The GDX price move seemed to be becoming steeper, and now it really shows up on the big picture chart. GDX broke out and rallied from that $42-$43 area and ran to almost $55. That is $33.42 to $54.70 in 2025, so far. This yellow area was pointed out as a resistance area, but it has not really acted like one with Gold running to new all-time highs in 2025.
.
The market review shows us
1. A bullish General Market that dipped on Friday with the Israel strike on Iran. Time will tell if it is just a half cycle dip or something more concerning with the unrest in the Middle East.
2. We saw oil start to shape up as bullish a couple of weeks ago, but I didn’t personally take the trade because it has been choppy & weak for 2 years or more. Suddenly, Oil jumped 10-20% with the Israel attack and now Iran has retaliated with a counterstrike. Oil no longer looks like it wants to fall into the $40 area, it has become quite bullish and Oil stocks are also rising. I see immediate resistance possible so I called for a possible pullback. Possibly a buy opportunity unless all of this just drops lower AGAIN, and this 10 day peak would be L.T., believe it or not. I will obviously monitor it as it progresses.
3. The USD broke down and is trying to recover, but it may have ‘peaked’ in that 2nd daily cycle and then will continue to break down. This could send Gold and Silver higher.
4. The Precious Metals continue to be quite bullish, as seen in this report.
5. Bitcoins set up is also still bullish, it is covered below.
.
Enjoy your Weekend and thank for being here at Chartfreak!
.
~ALEX
.
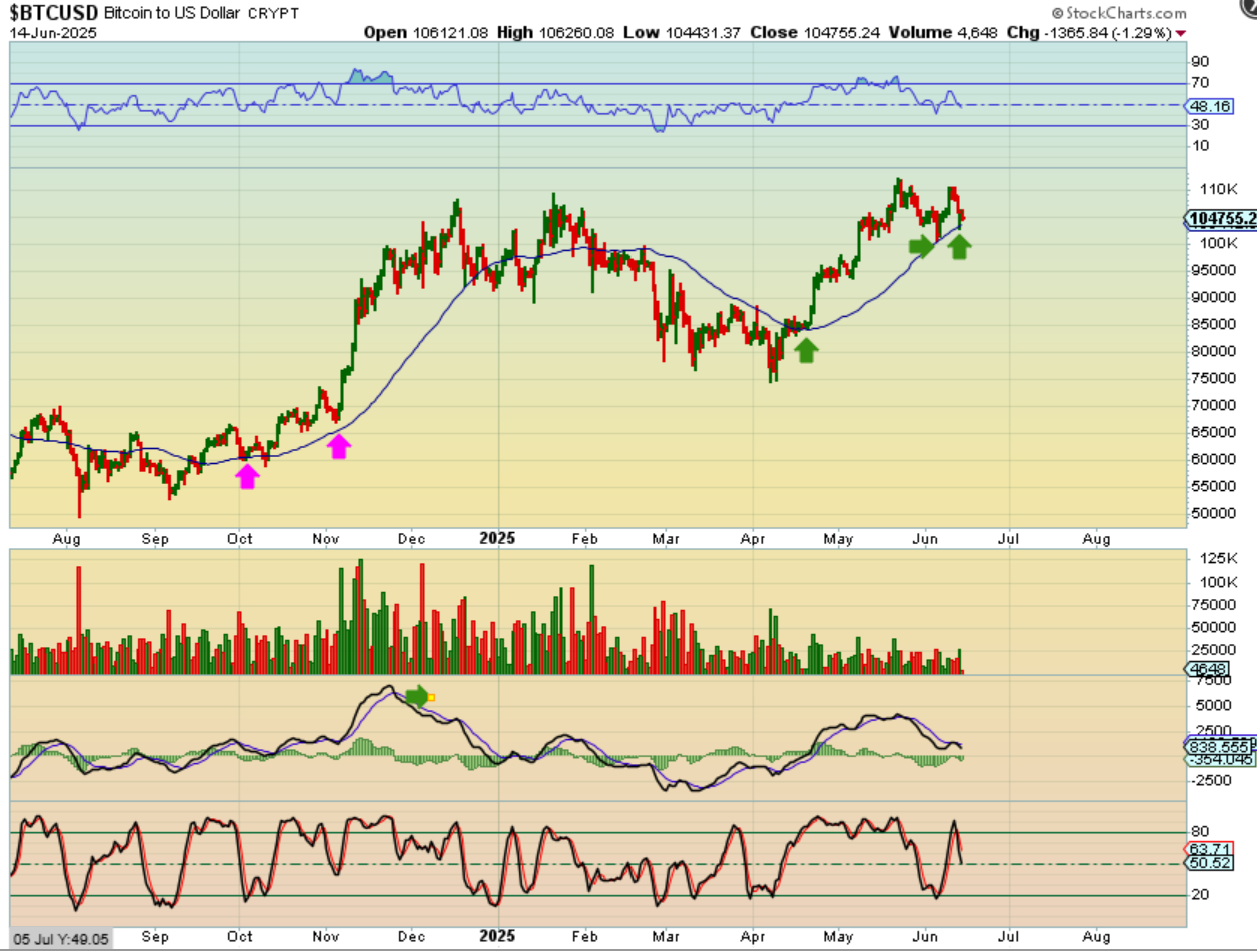
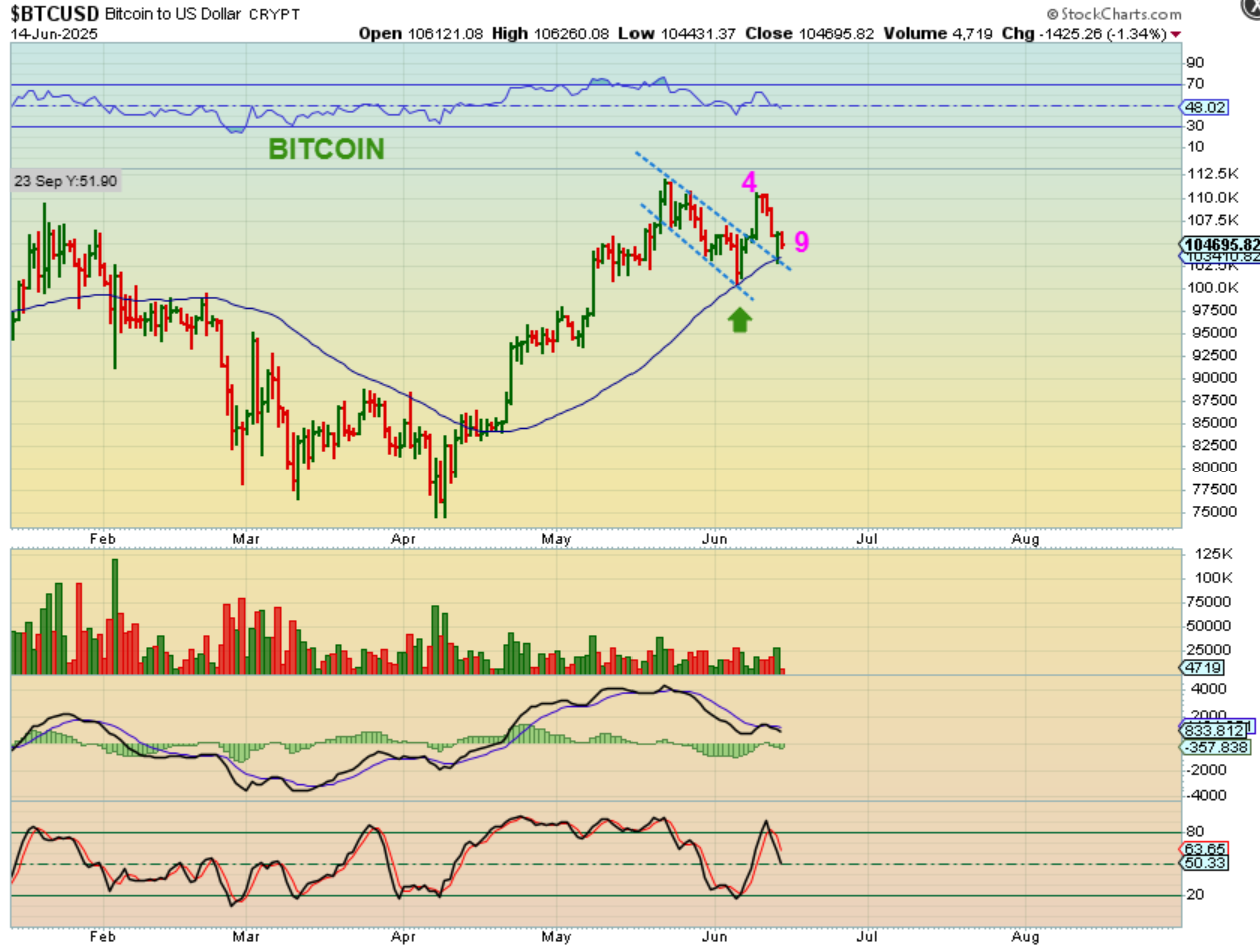
BITCOIN has bounced off of the 50sma twice, with an ICL at the first low. The MACD divergence concerned me before this last dip, and I mentioned that this could now become choppy as a result.
.
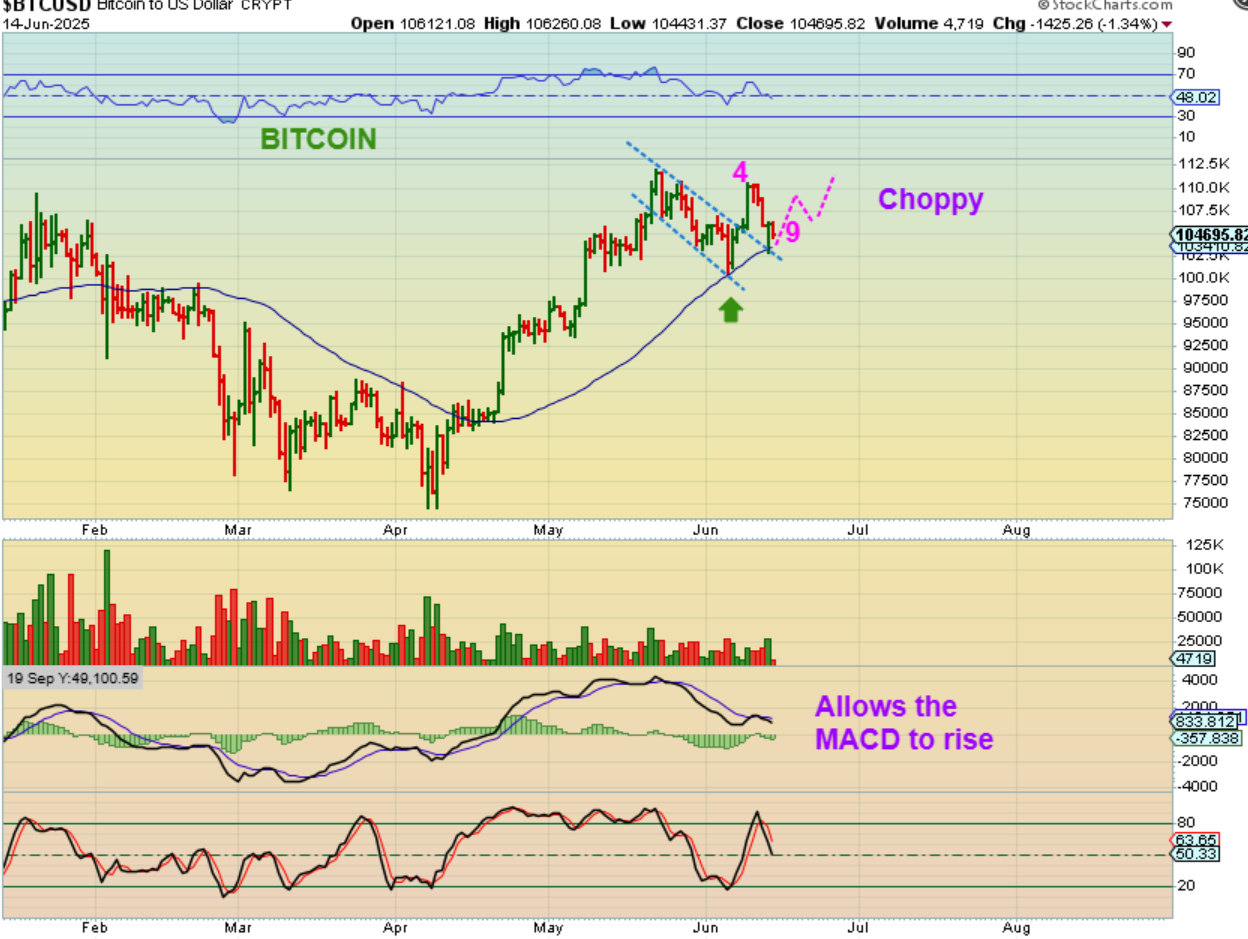
BITCOIN – It now looks like a breakout from that channel and a back test so far. We are ONLY on day 9.
.
BITCOIN – More chop can allow the MACD to rise up and straighten out the divergence, so I am hoping to see that if or when Bitcoin starts to move higher again.
.
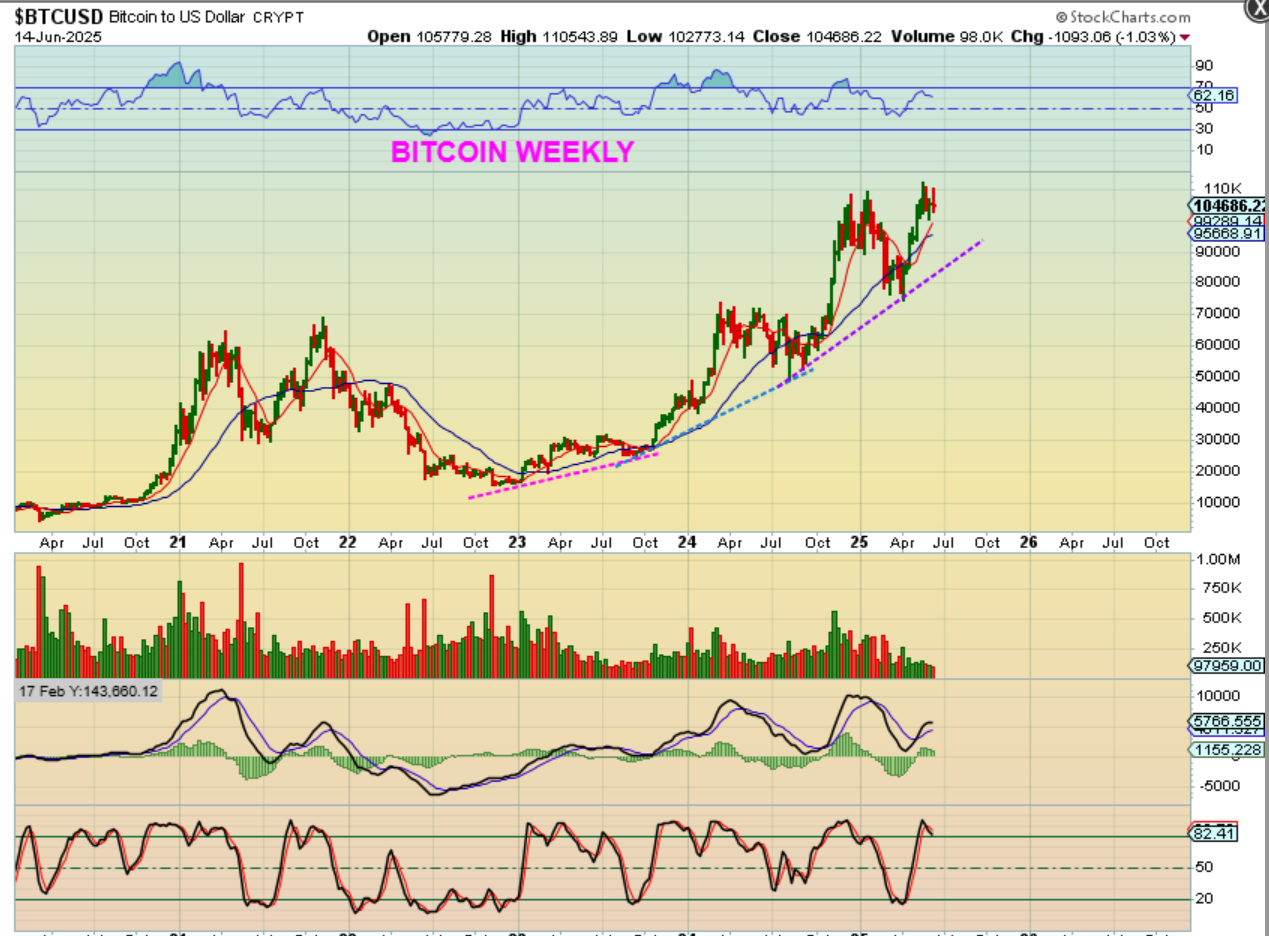
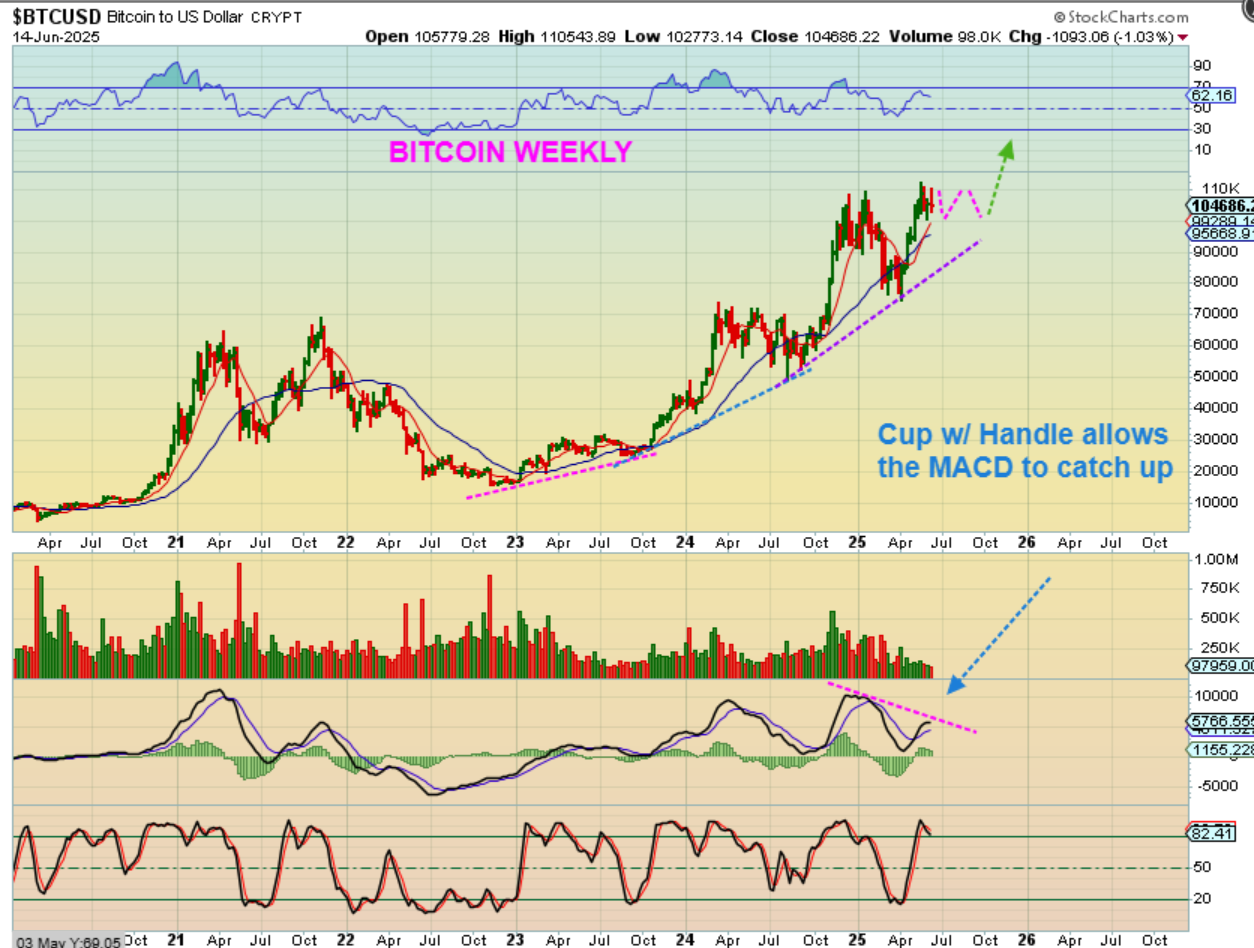
BITCOIN WEEKLY – I want to be honest: I’m hoping for a run to $120,000 plus, but I am not loving this volume lately. The 2024 rally had good volume, but this one was lacking, so I keep that in the back of my mind. We could put in a choppy double top and I hate to say that, because the crypto stocks just started to follow Bitcoin more closely.
.
BITCOIN -I will say that more lighter volume chop sideways at the highs followed by a sudden burst of volume is often see around a breakout, so that is a possibility. Using a 4 year cycle though, we really want to see this rally in the 3rd year (now).
.
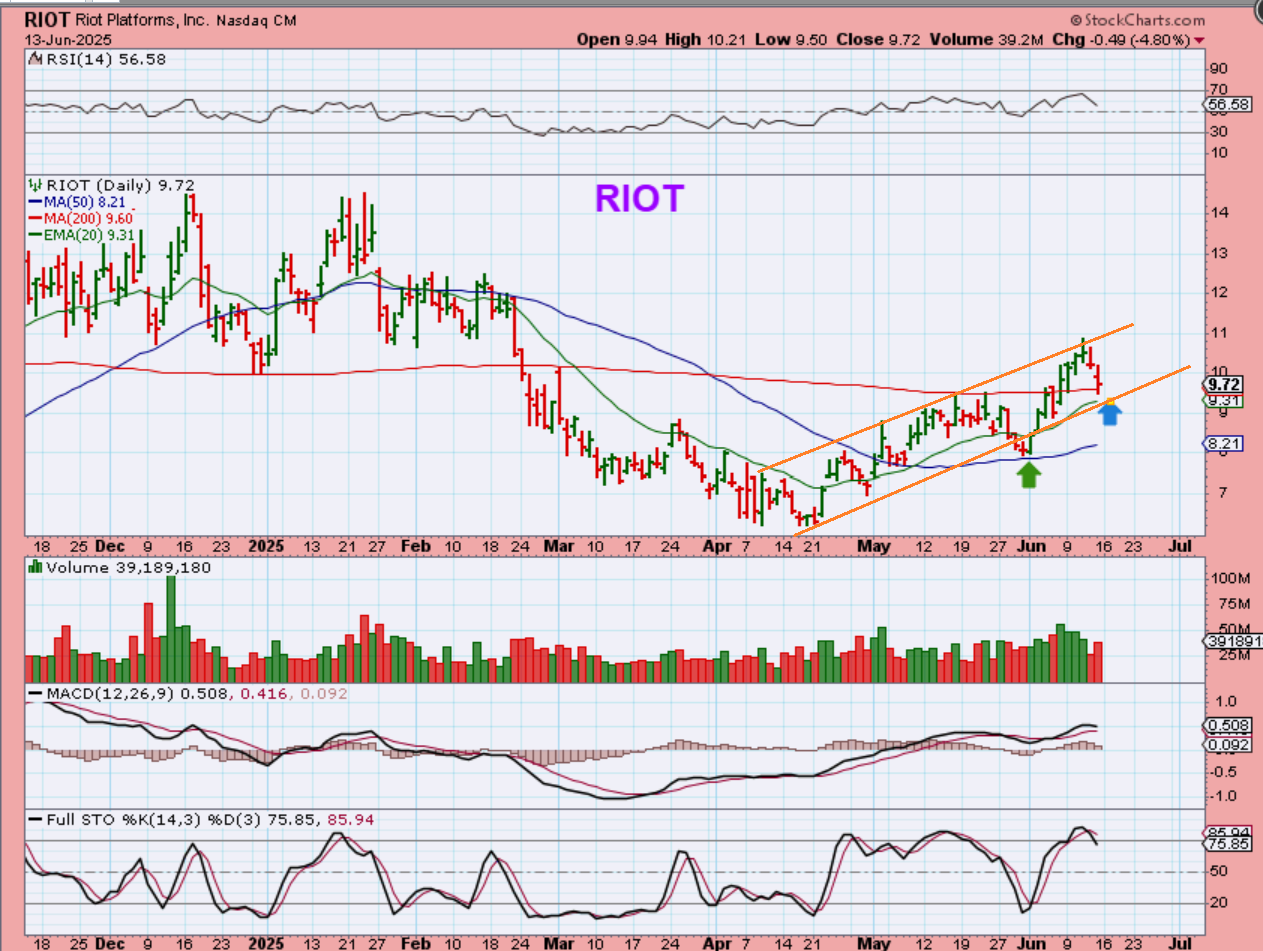
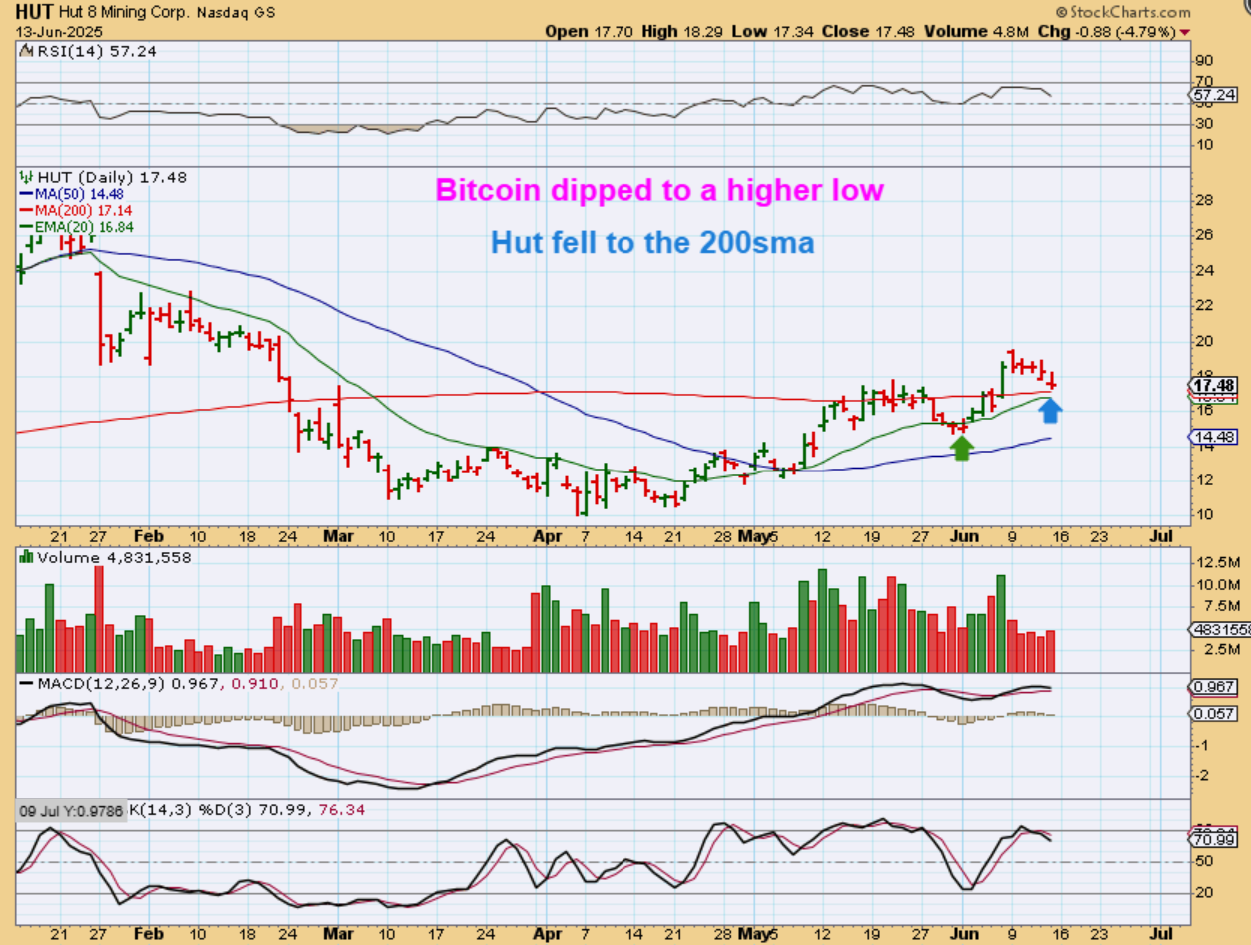
HUT rallied and dipped with Bitcoin so far, and it has landed near support so far. Now we have a higher low like Bitcoin. That means so far, things look fine.
.
RIOT also bounced off of the 50sma when Bitcoin bottomed at day 59. RIOT rallied with Bitcoin and then dipped to the 200sma as Bitcoin dipped last week, so again… So far, so good. All eyes on Bitcoin now.