Thursday May 29th – Still Riding The Bulls
‘
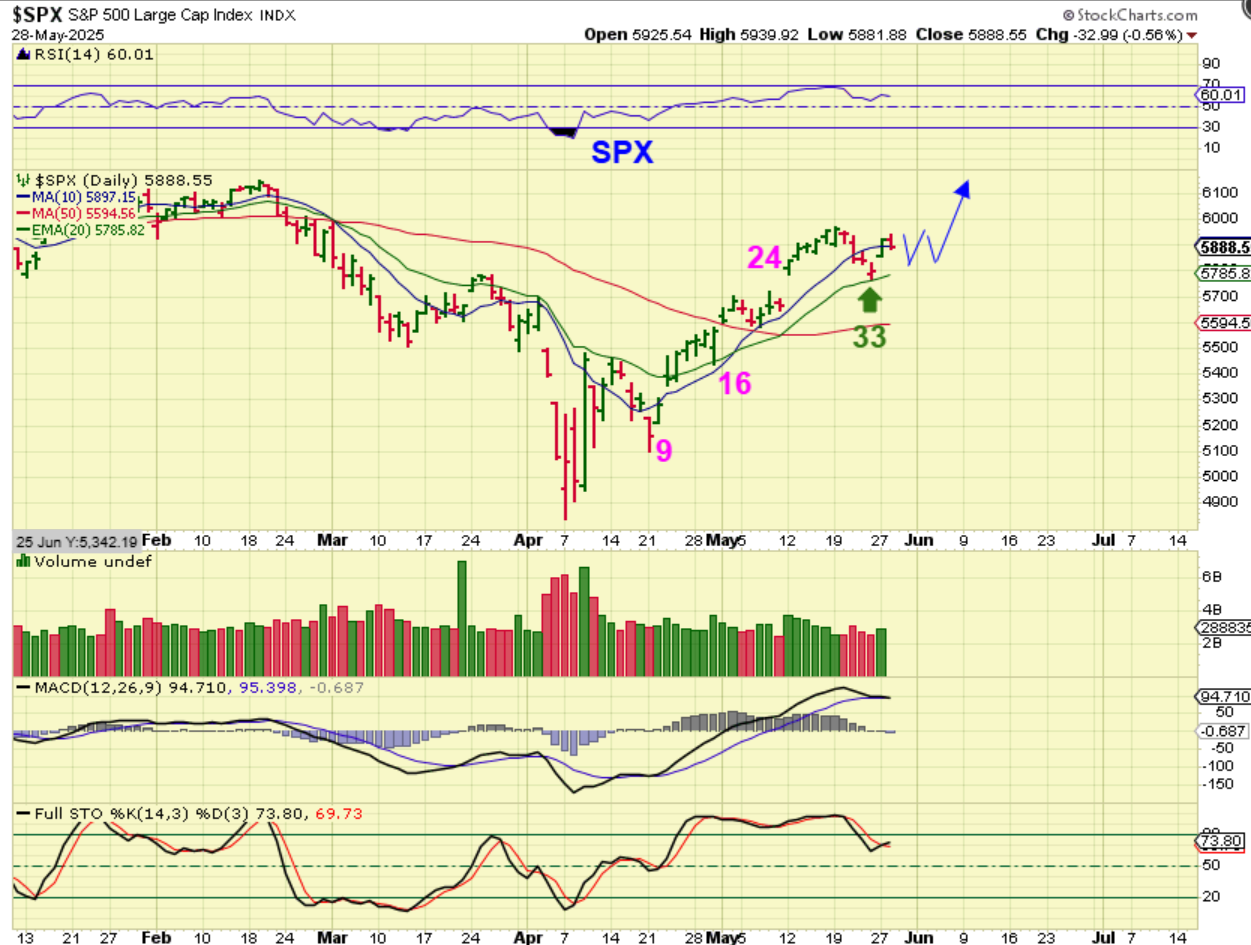
SPX #1 – At this point I feel that we have a dcl in place at day 33 and some selling or choppiness won’t change that unless those lows are taken out. This is my ‘most likely scenario’, because as mentioned in yesterdays report, I do see a lot of bullish set ups in the general markets. I will simply draw some choppiness as another possibility too.
‘
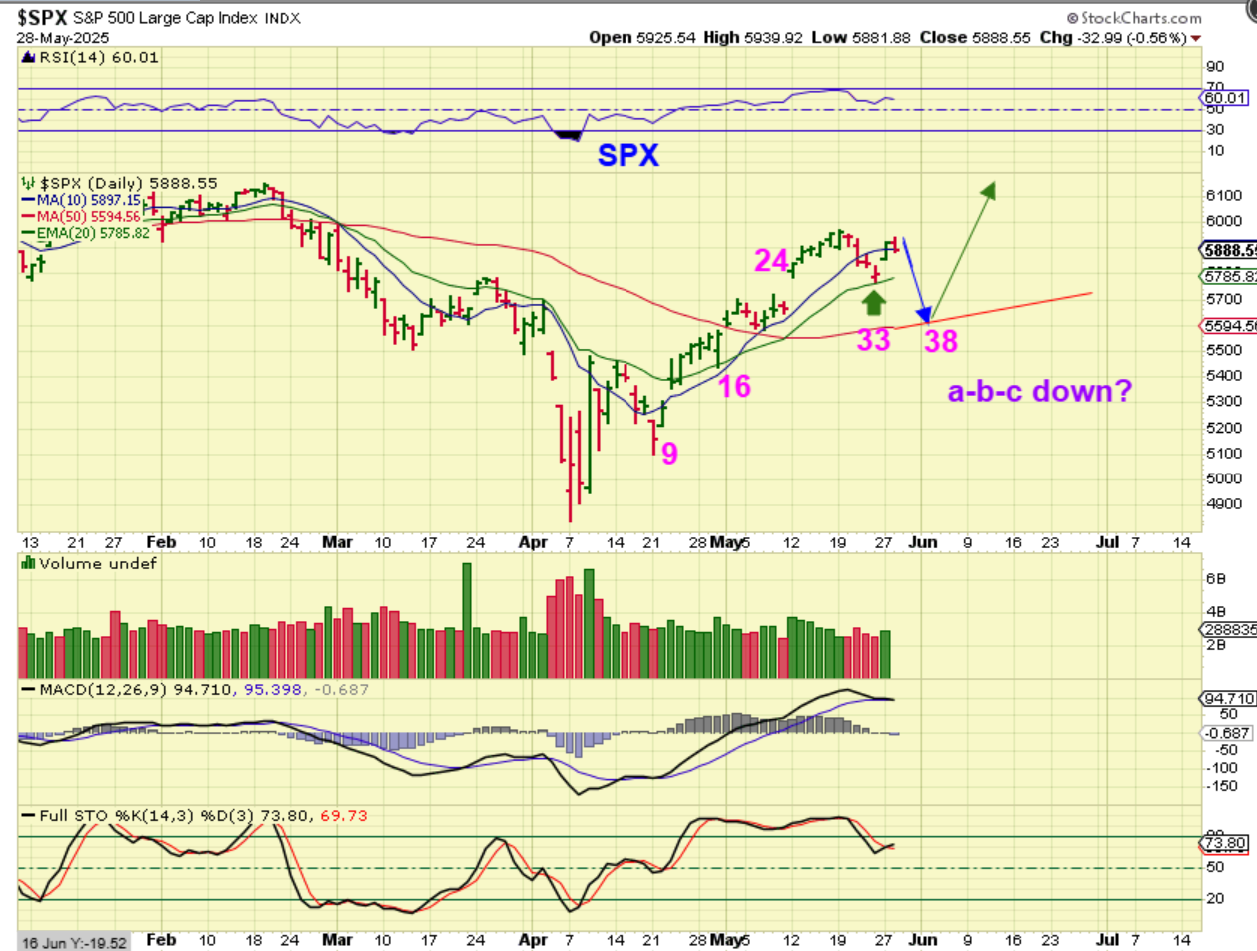
SPX #2 – I did mention this 2nd scenario in past reports, but I view it as less likely due to the many bullish stock set ups in the general markets. So far, NVDA posted earnings and the stock was up 5 % after hrs. I view this deep of a dip as less likely..
‘
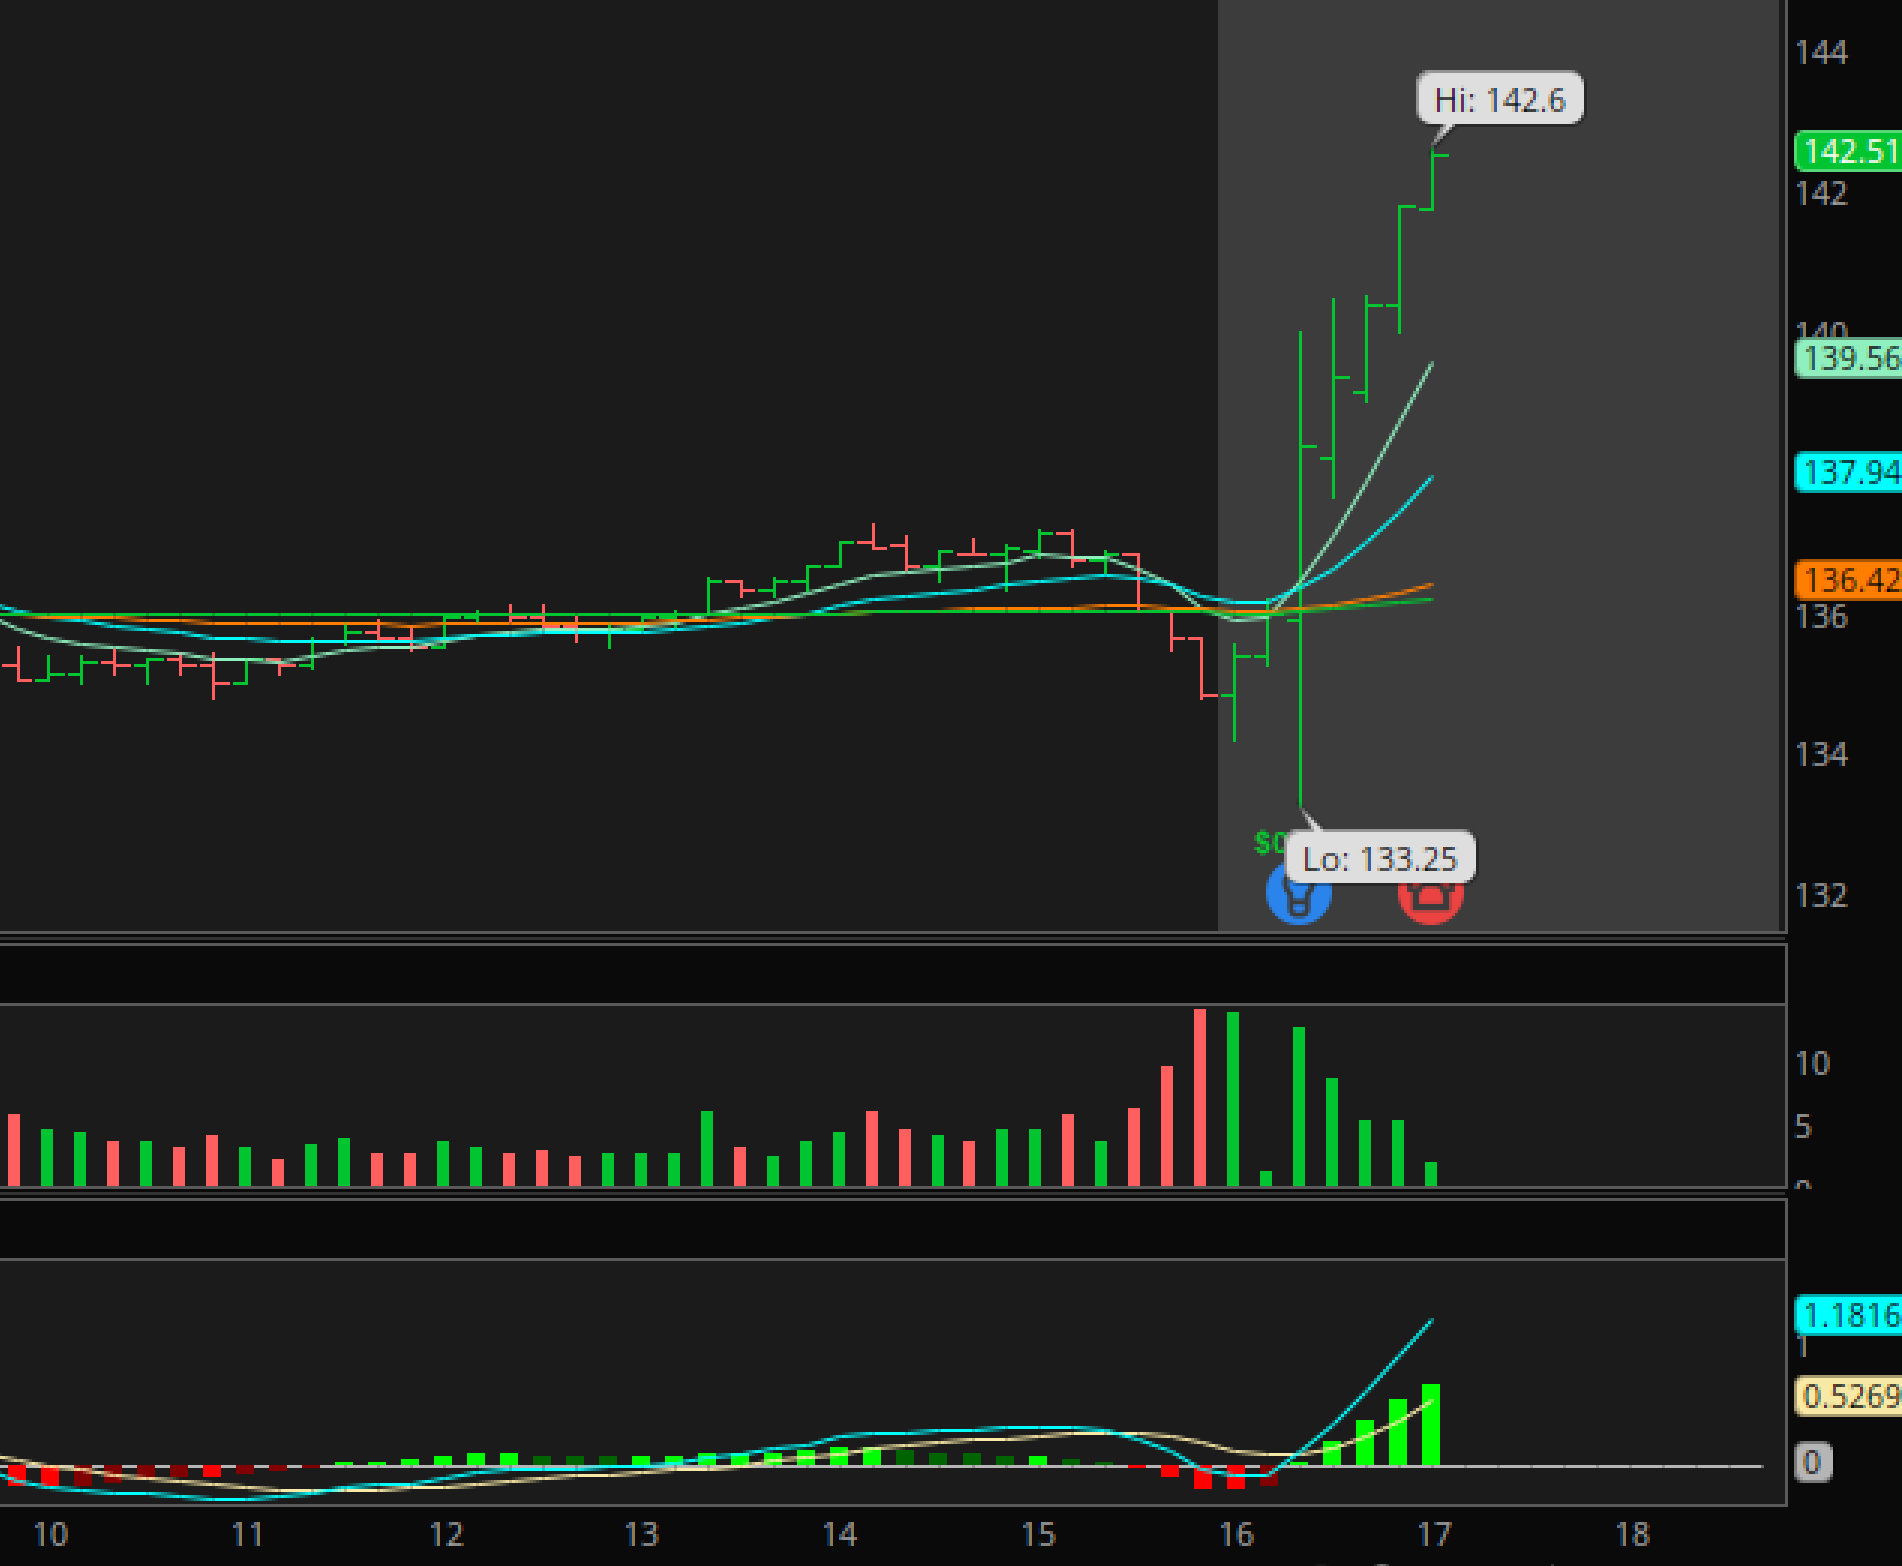
NVDA – Closed up 5% in after hrs/ post earnings. This is an intraday chart of the price action right after the earnings release came out. The shaded area is ‘after hours’.
‘
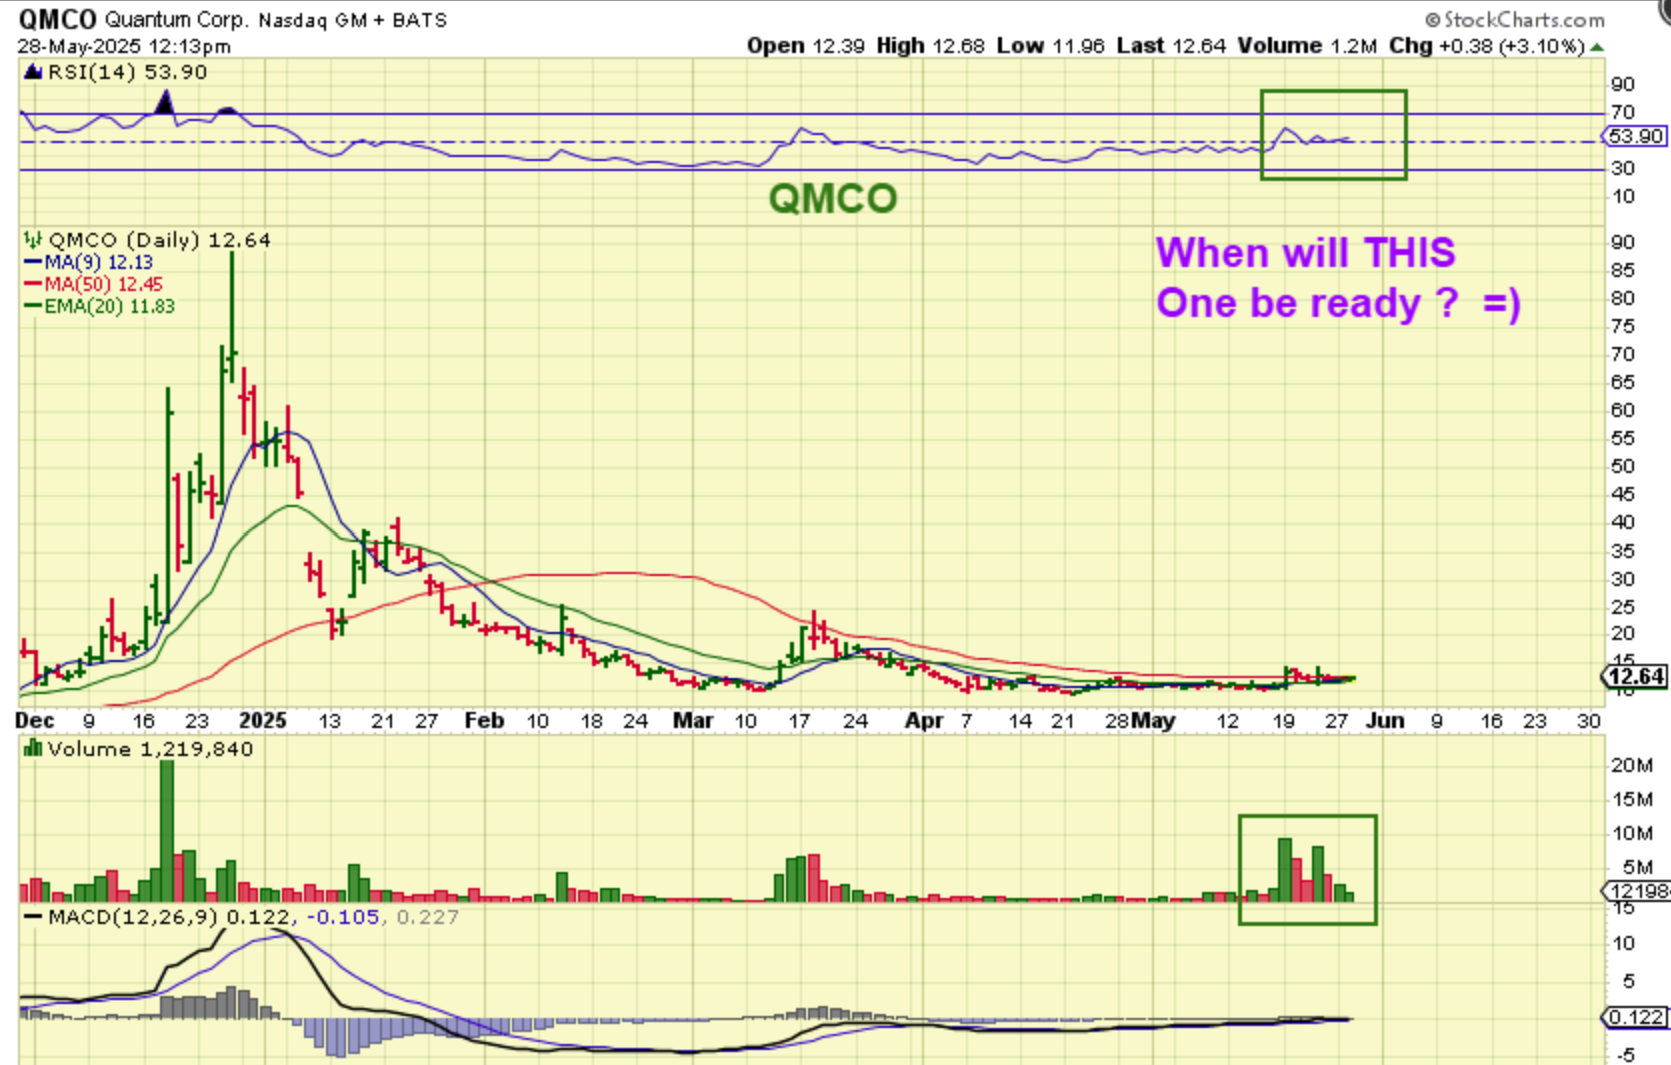
Quant stocks (QBTS, QUBT, IOQN, etc) have had incredible upside, so I posted this chart at 12:13 p.m. ET to ask the question, “When will QMCO Run?” It was at $12.64. This is a bullish base, just like the rest of them had, so this would be a low risk entry…
‘
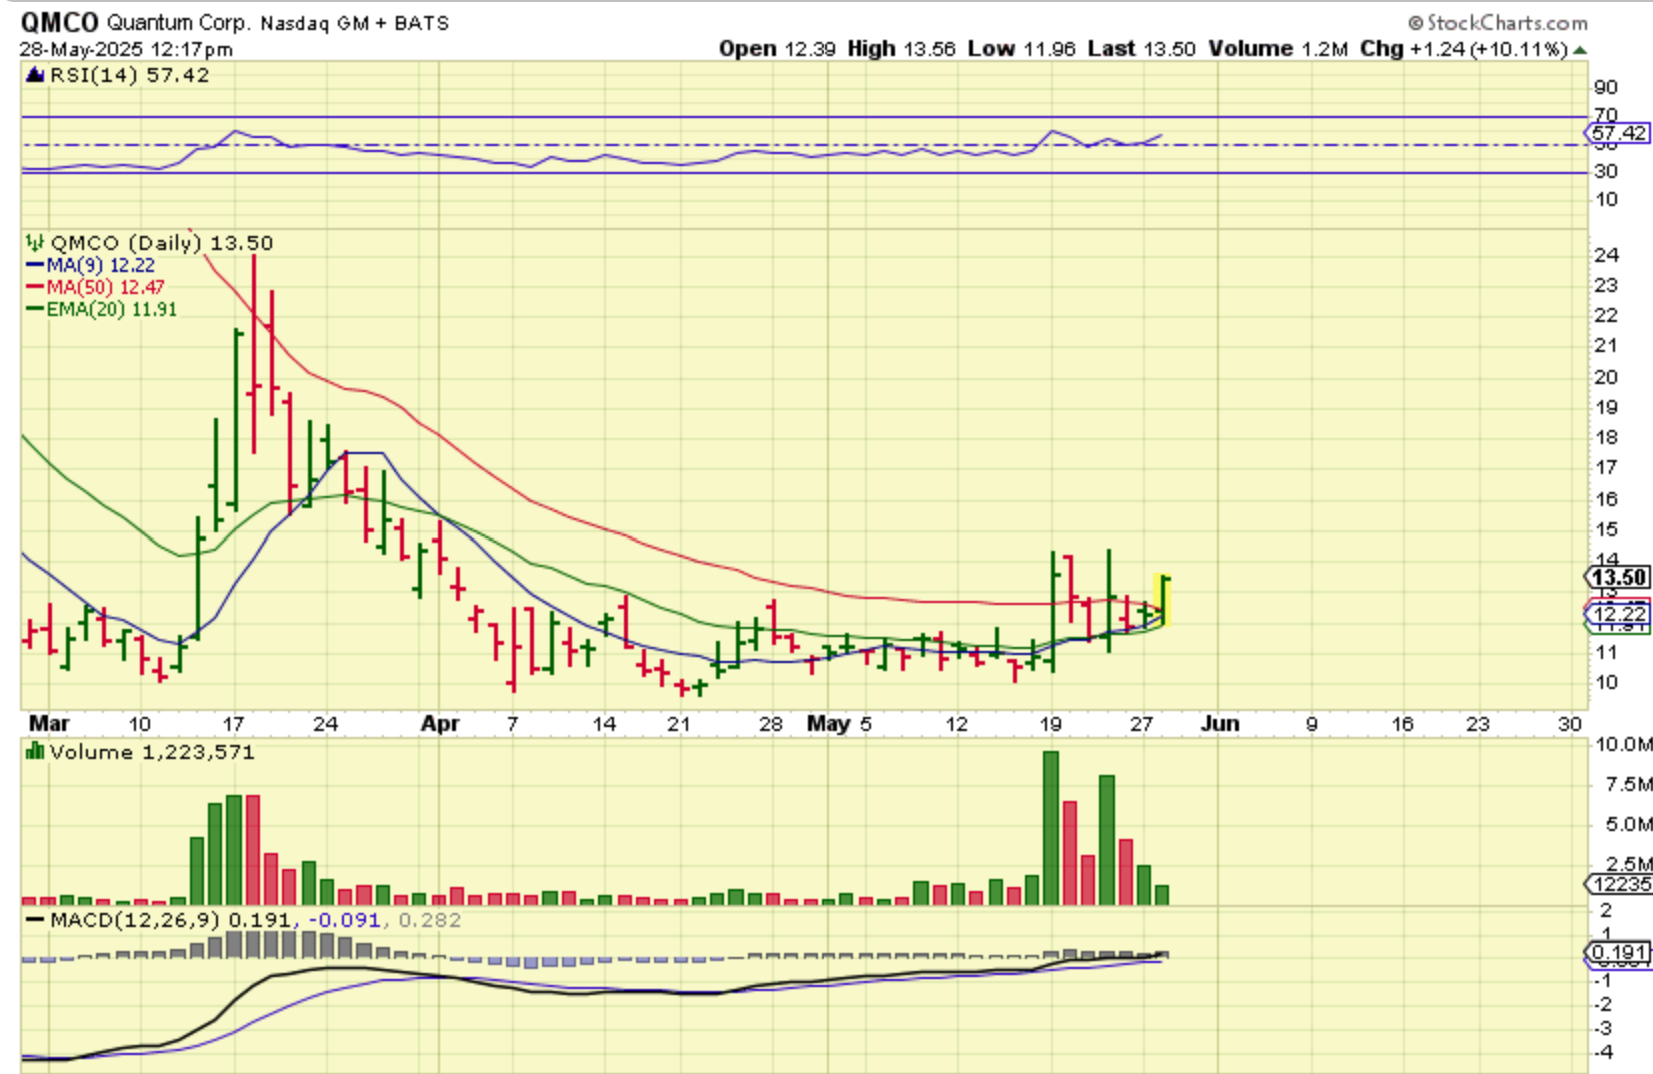
QMCO – Just 4 Minutes after I posted that, it Popped up to ‘Up 10%’.
‘
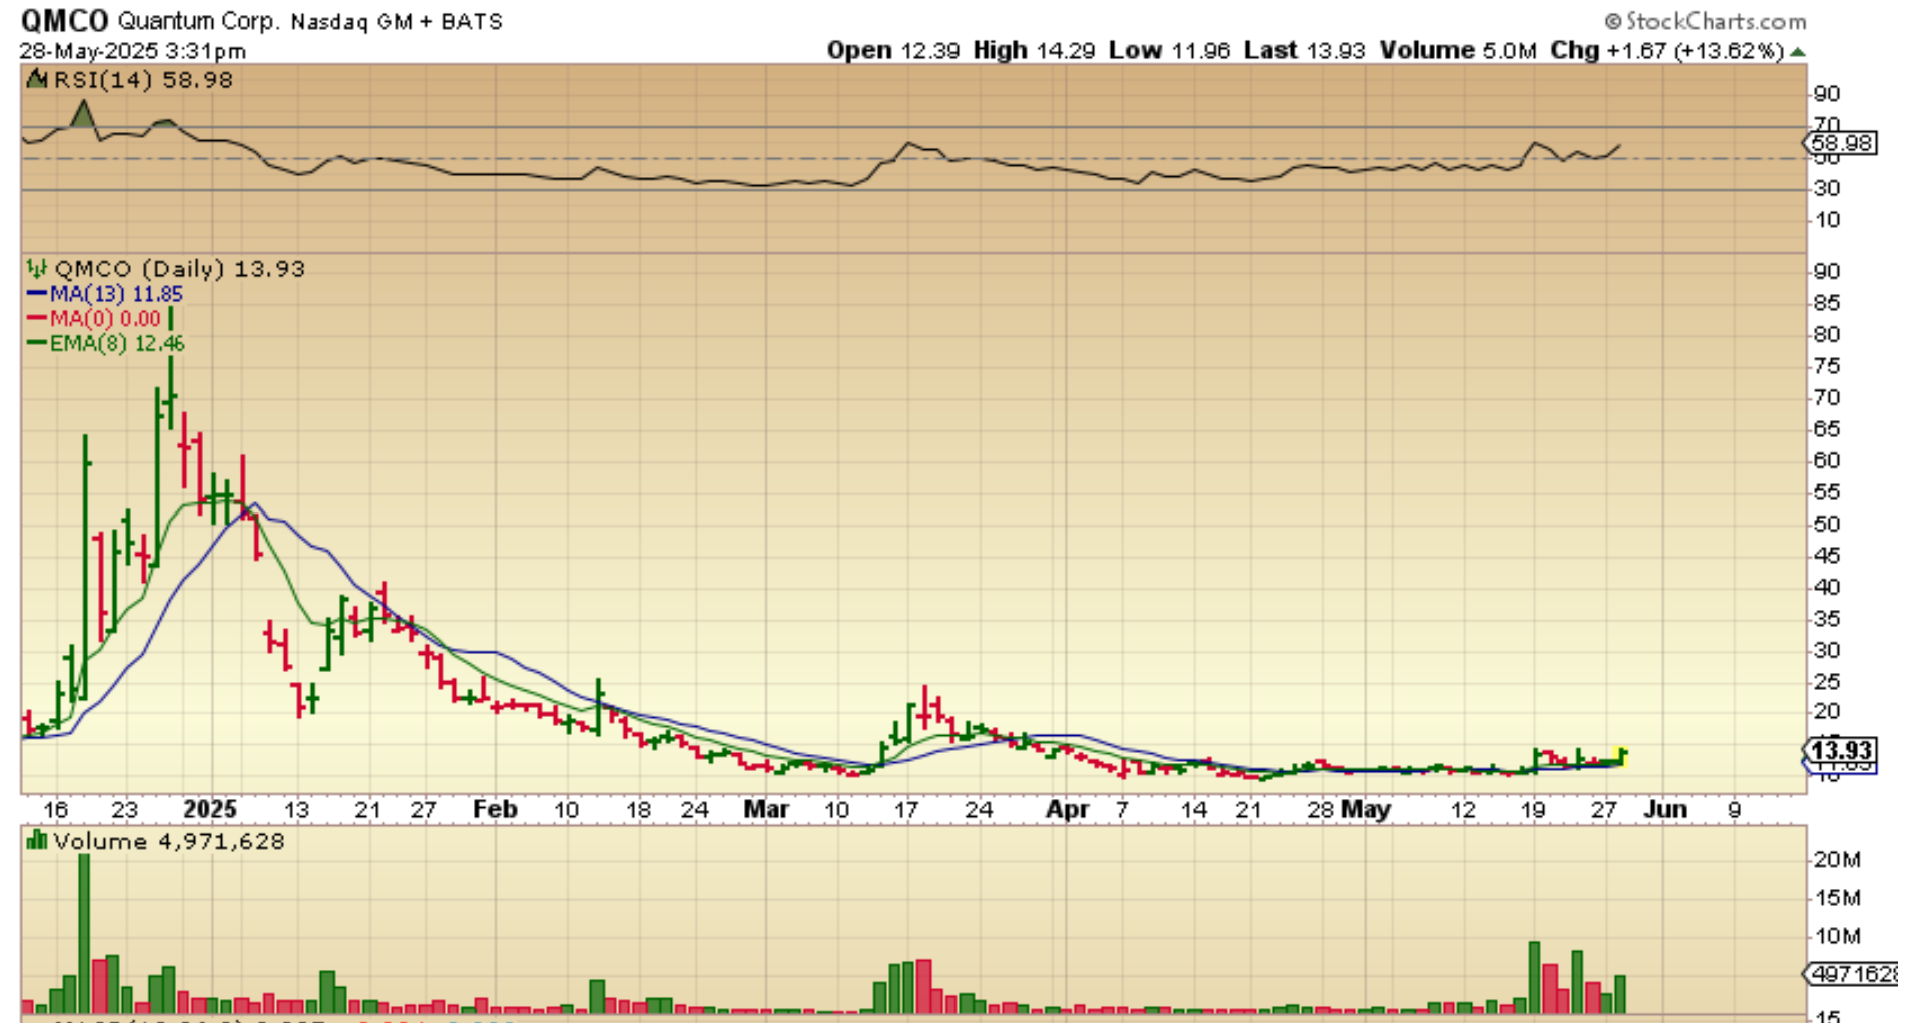
QMCO – Toward the end of the day QMCO was up around 14% and I grabbed this chart to show incredible potential IF it was to run back to former highs. Some ‘pop & Drops’ eventually do Pop & Run, so we’ll see what happens over time.
‘
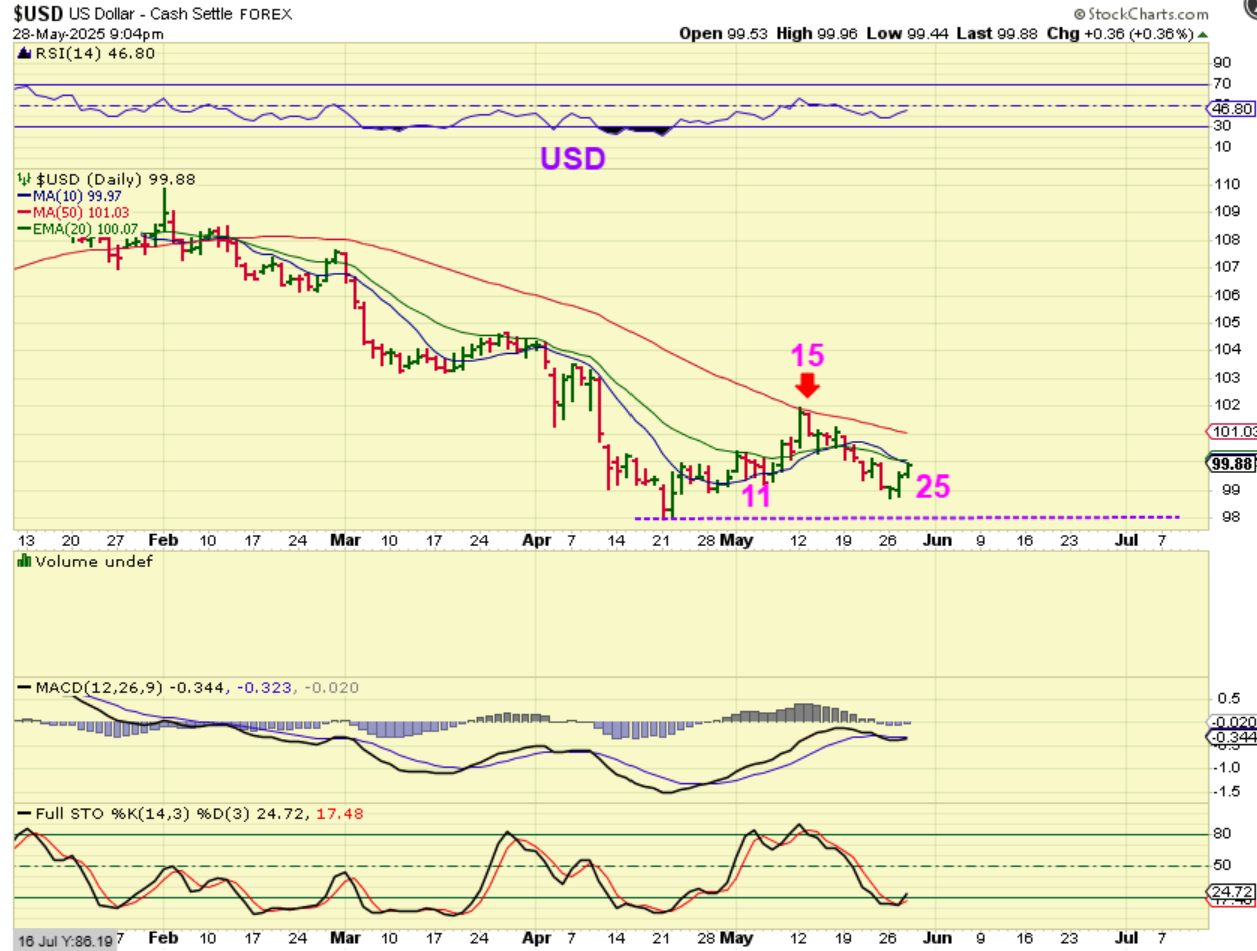
THE USD appears to have put in a dcl. This would finish a first daily cycle if it can push higher. It is Right Translated, it is oversold, and the MACD divergence is very strong. If this runs, we need to watch Gold and see if that inverse relationship returns.
‘
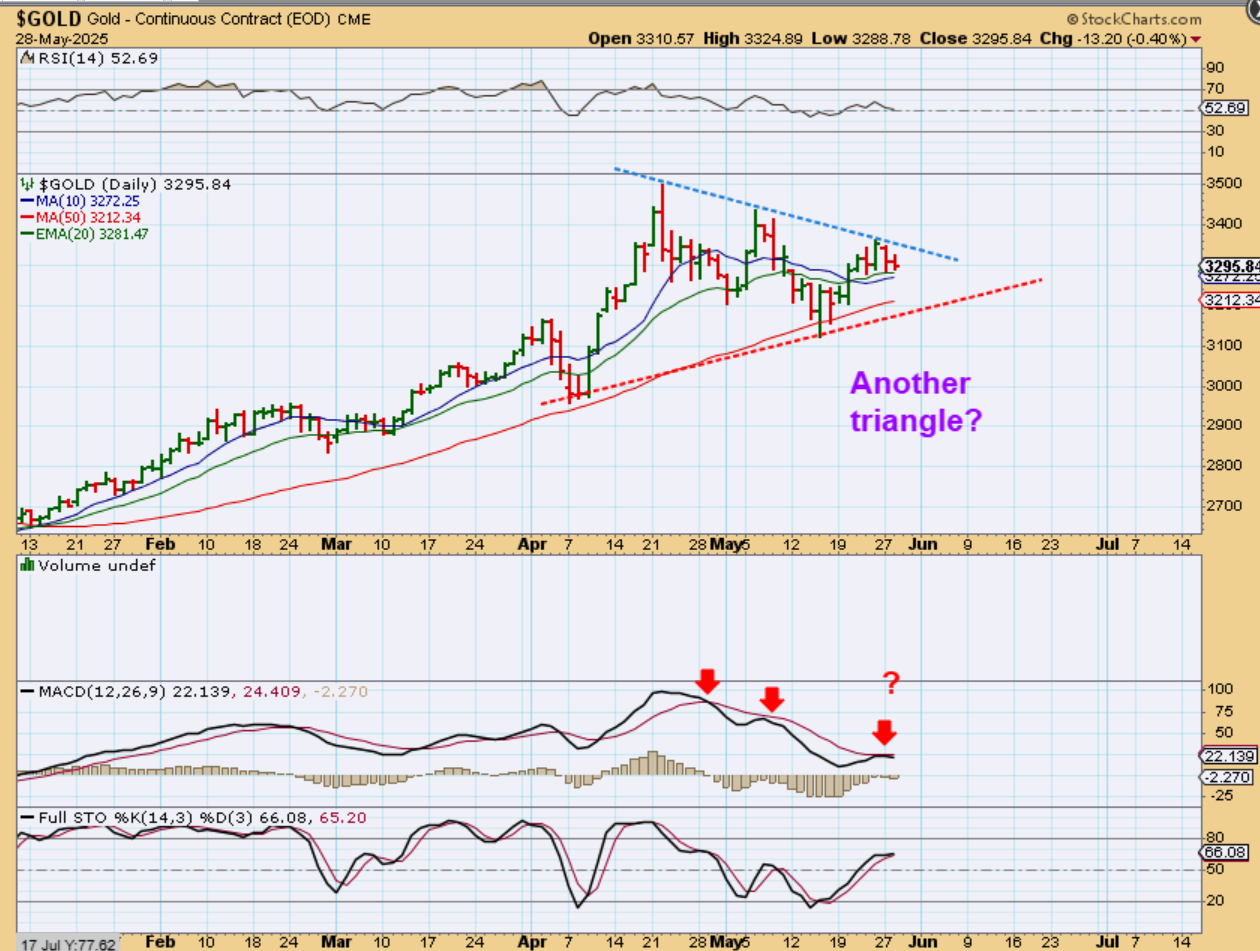
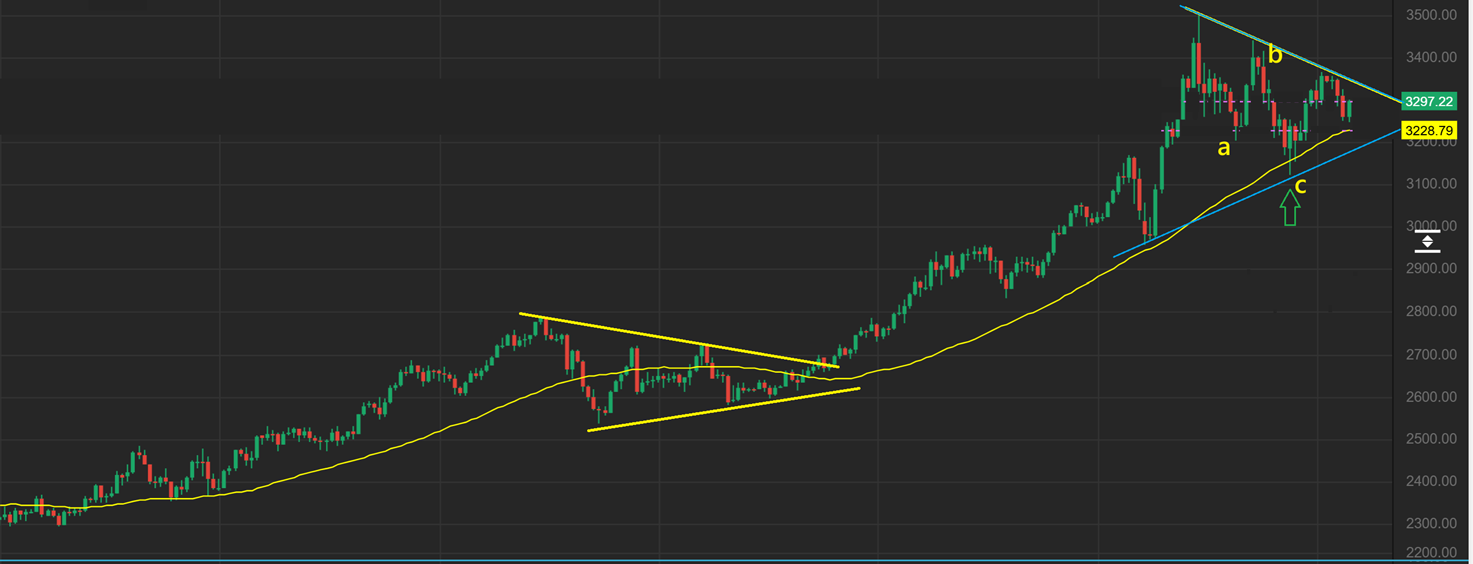
GOLD – I want to mention that we may have an ICL in May (Since it looks like Silver had an ICL on the April 7th slam down). I mentioned the bullishness of Gold & Silver stocks in yesterdays report, so I will continue that today.
If the USD takes off higher, Gold does have room to drop, but we might have an a-b-c drop forming a triangle low (ICL). I say this also because some Miners are strengthening, not weakening. That said, so far the set up remains bullish, and I do feel that it might even be forming another triangle low and that low would be the one already in place. It’ll take time to see how this plays out, but it is helpful to identify the bullishness in SIlver and Miners too.
‘
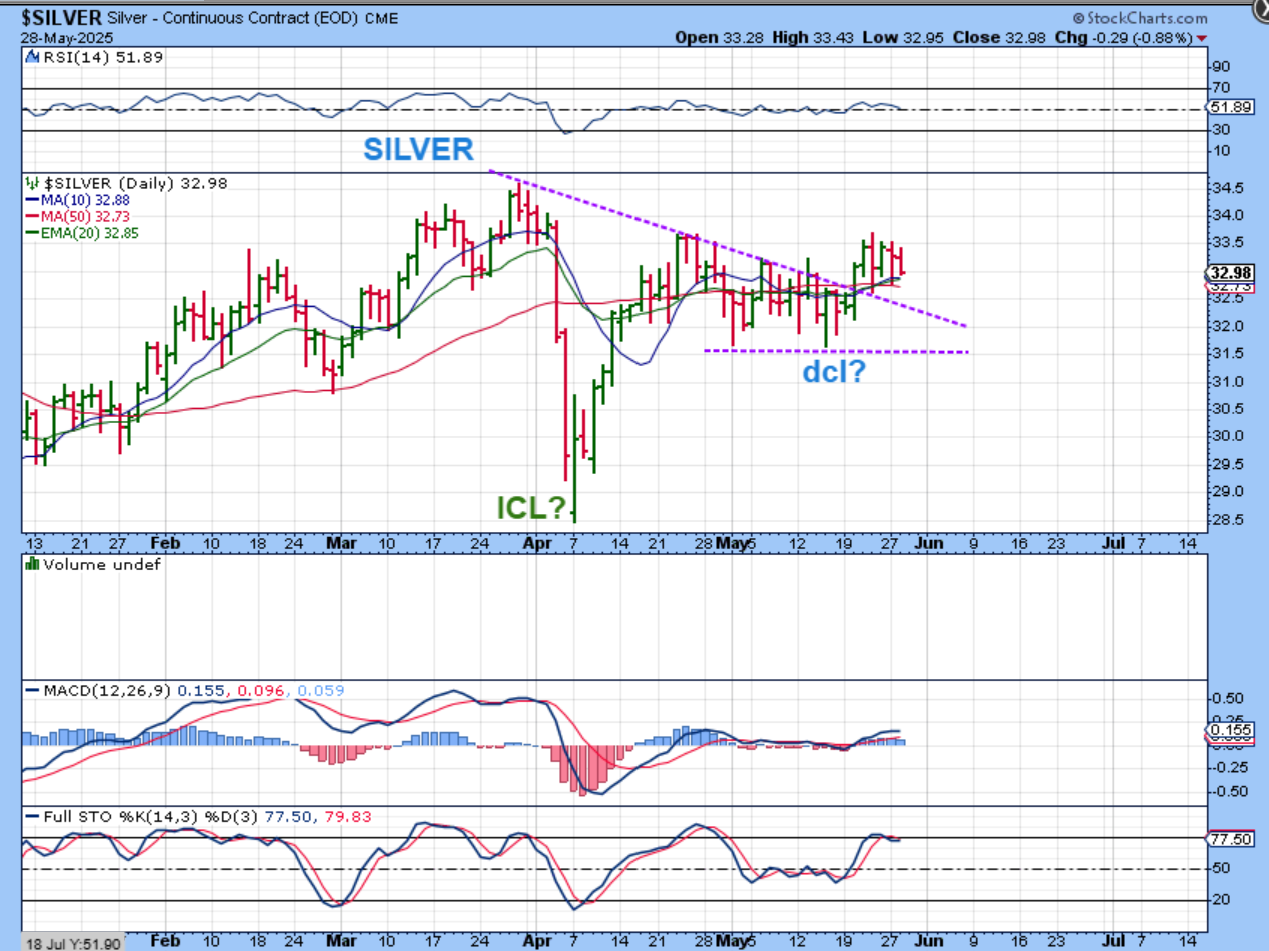
SILVER – I have discussed Silver as a possible ICL April 7th, and also as a similar set up to Platinum’s before it exploded higher. Silver stocks are still holding up well too, as reported in past reports also. It feels like Silver stocks may be under accumulation when the selling is reversed by the buying. I’ll point out a couple of examples after GDX…
‘
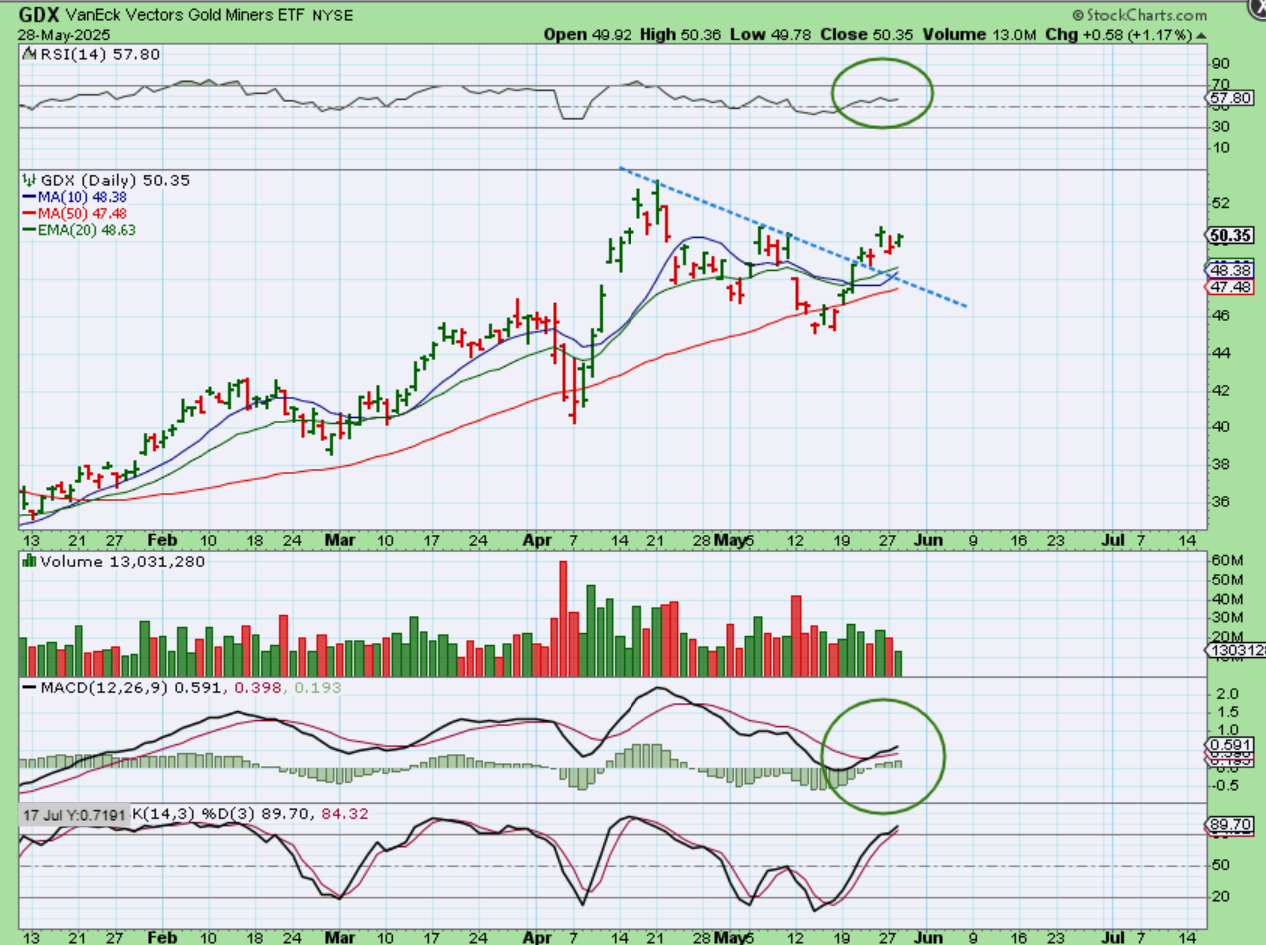
GDX – Miners are on day 9 with a day 7 peak, but this set up looks like a bullish set up and with Silver possibly having an ICL on April 7, it makes me wonder if Gold and the Miners just did an a-b-c down into a high ICL in May. That was a L.T. Daily cycle and now the downtrend was broken and this looks like it wants to move higher. The RSI is above 50% almost at 60%. I mentioned the strength of Miners yesterday…
‘
As mentioned yesterday, I want to take a look at Silver stocks again.
.
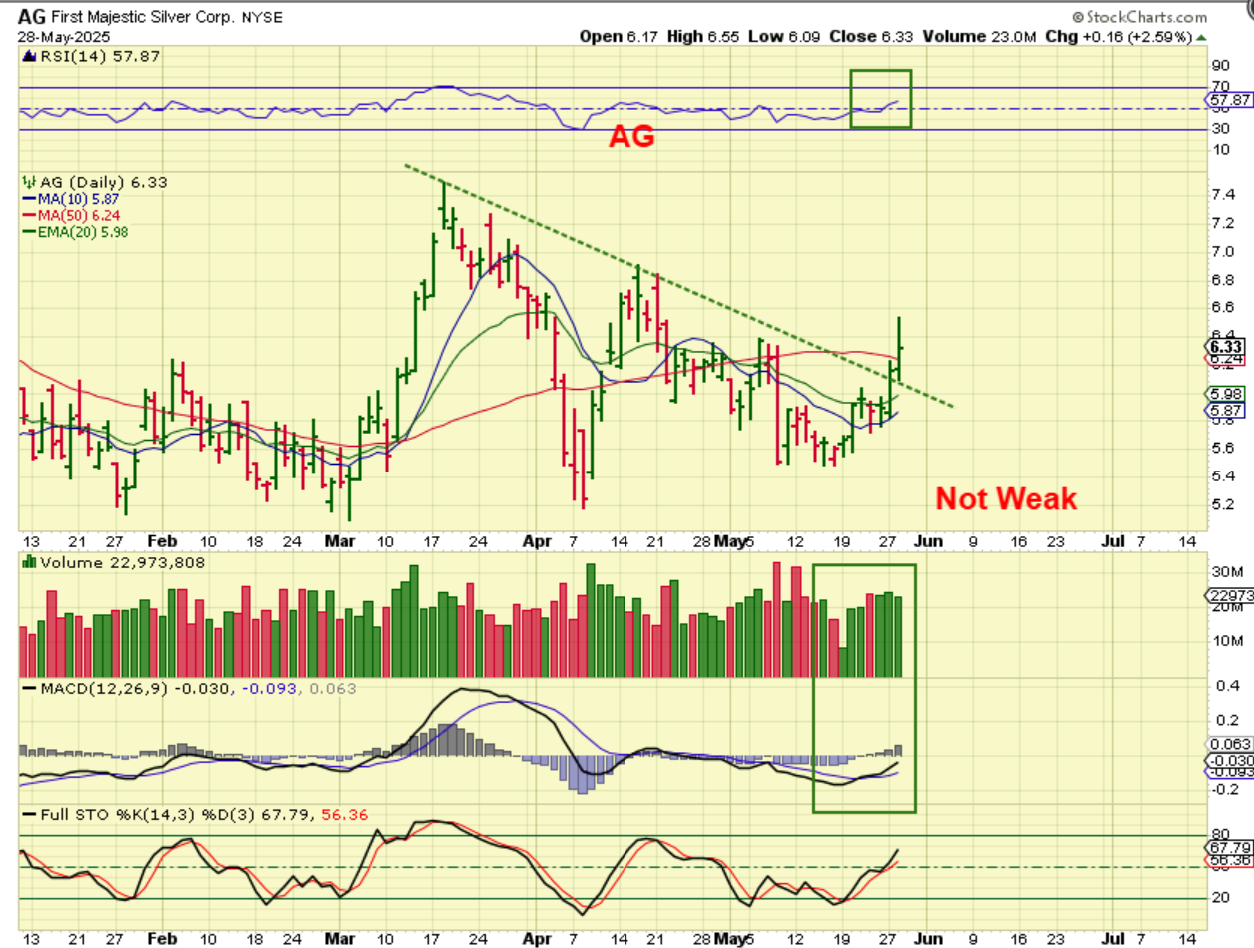
AG – Silver was down again, but the Silver stocks dipped and recovered rather well. AG was up 4.7% Tuesday and 2.59% Wednesday. Silver has been down and Silver stocks are moving higher. An ICL could very well be in place for Silver.
‘
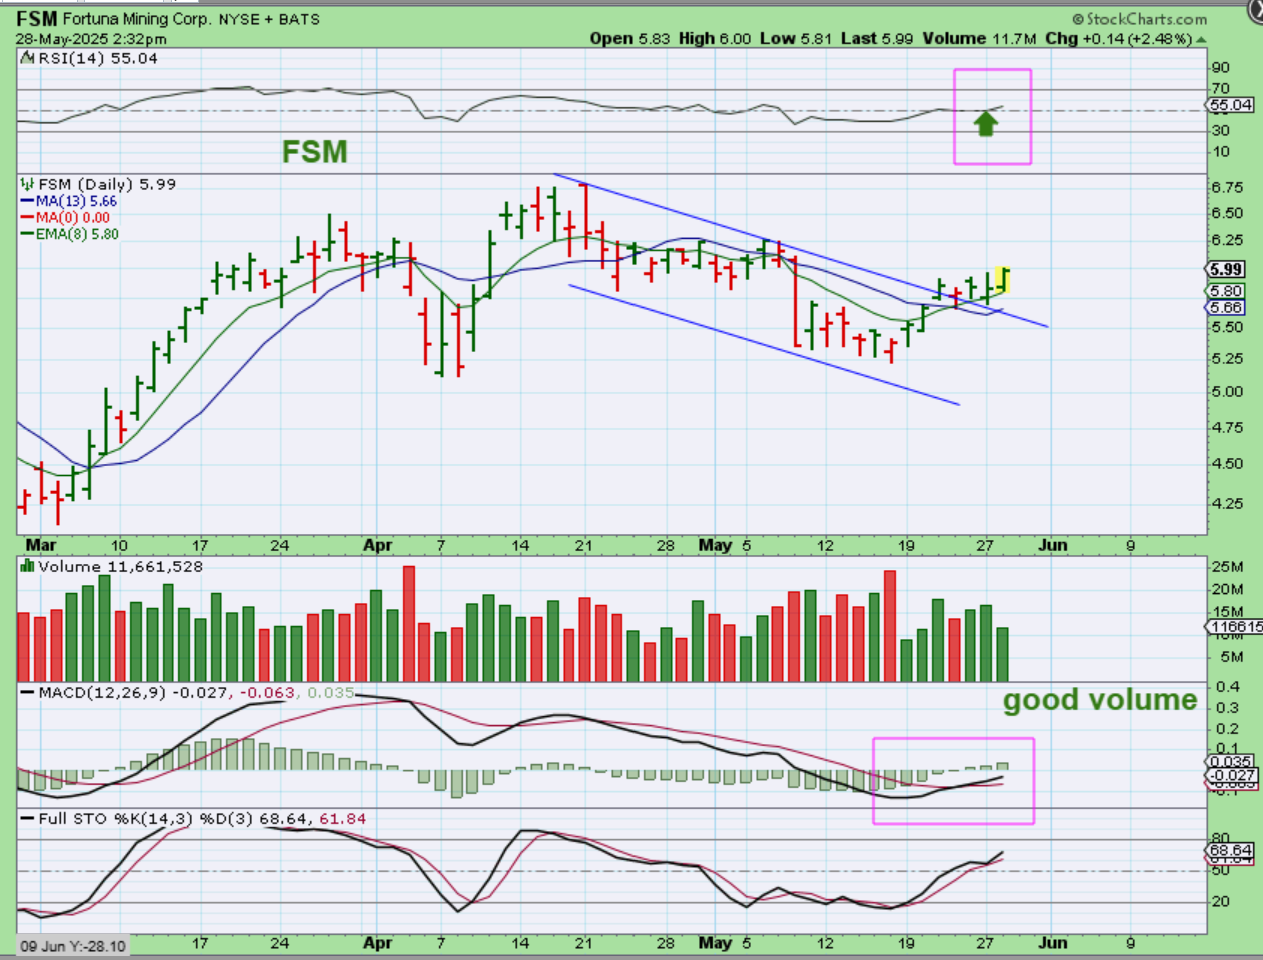
FSM has been green for 6 out of 7 days, right? It broke a downtrend too. As far as I’m concerned, these are bullish set ups and can be bought. The RSI is climbing higher, the MACD is bullish, and volume is steady. Silver stocks are a buy.
.
Please read the chart: I discussed this in yesterdays report and now I’m still seeing more strength in Miners.
.
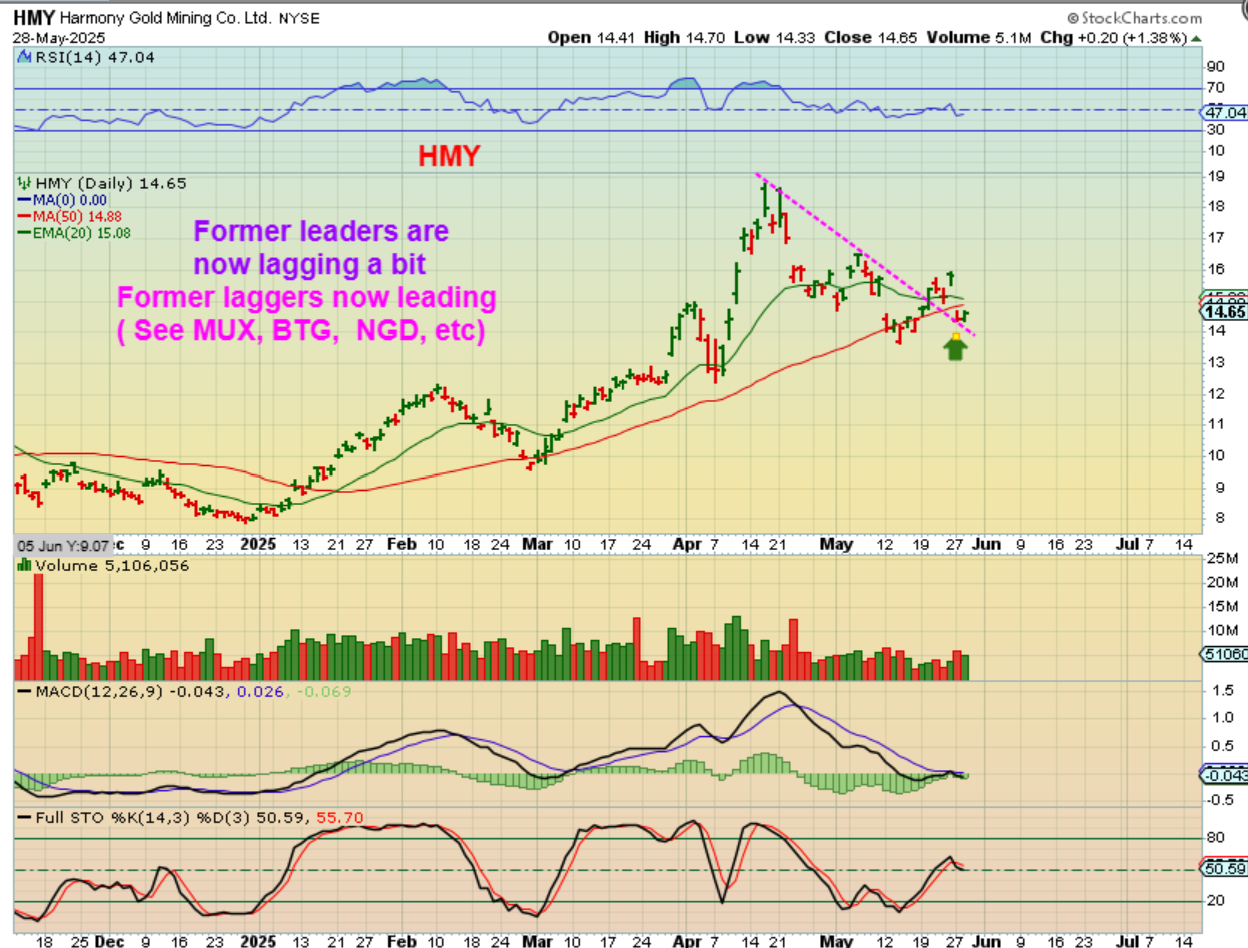
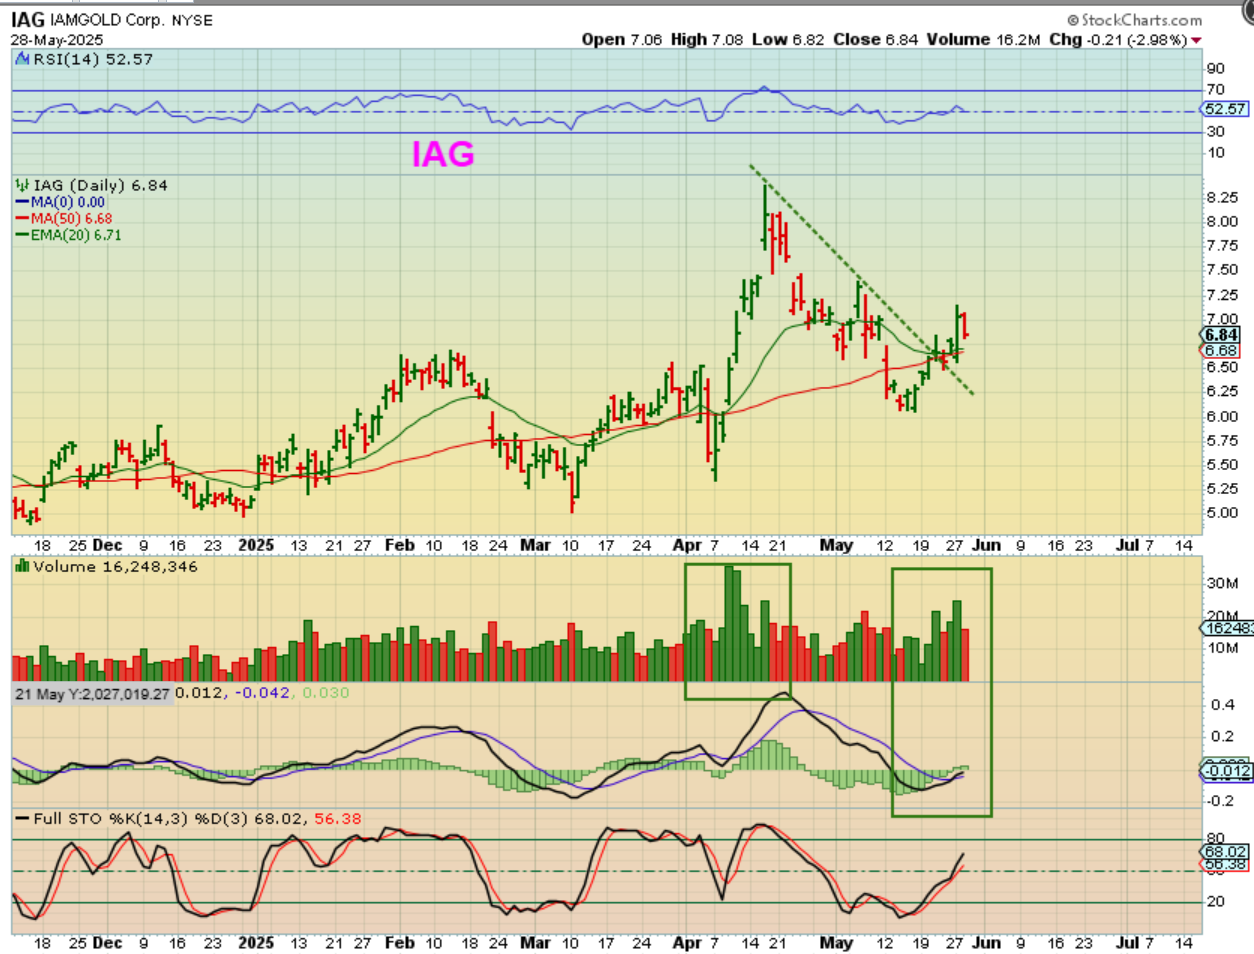
You will recall that former leaders were HMY, IAG, KGC, AU, AEM, etc. I want to show you that they are still easy to buy, because they are lagging this move by Gold a little bit. Take a look at HMY & IAG below as they now are off to a bit of a slower start, and then we’ll look at former laggers —now taking the lead or showing strength.
IAG is still easy to buy in this area
.
And now look at the former laggers. I HAD THESE IN MY REPORT YESTERDAY. I SAID…
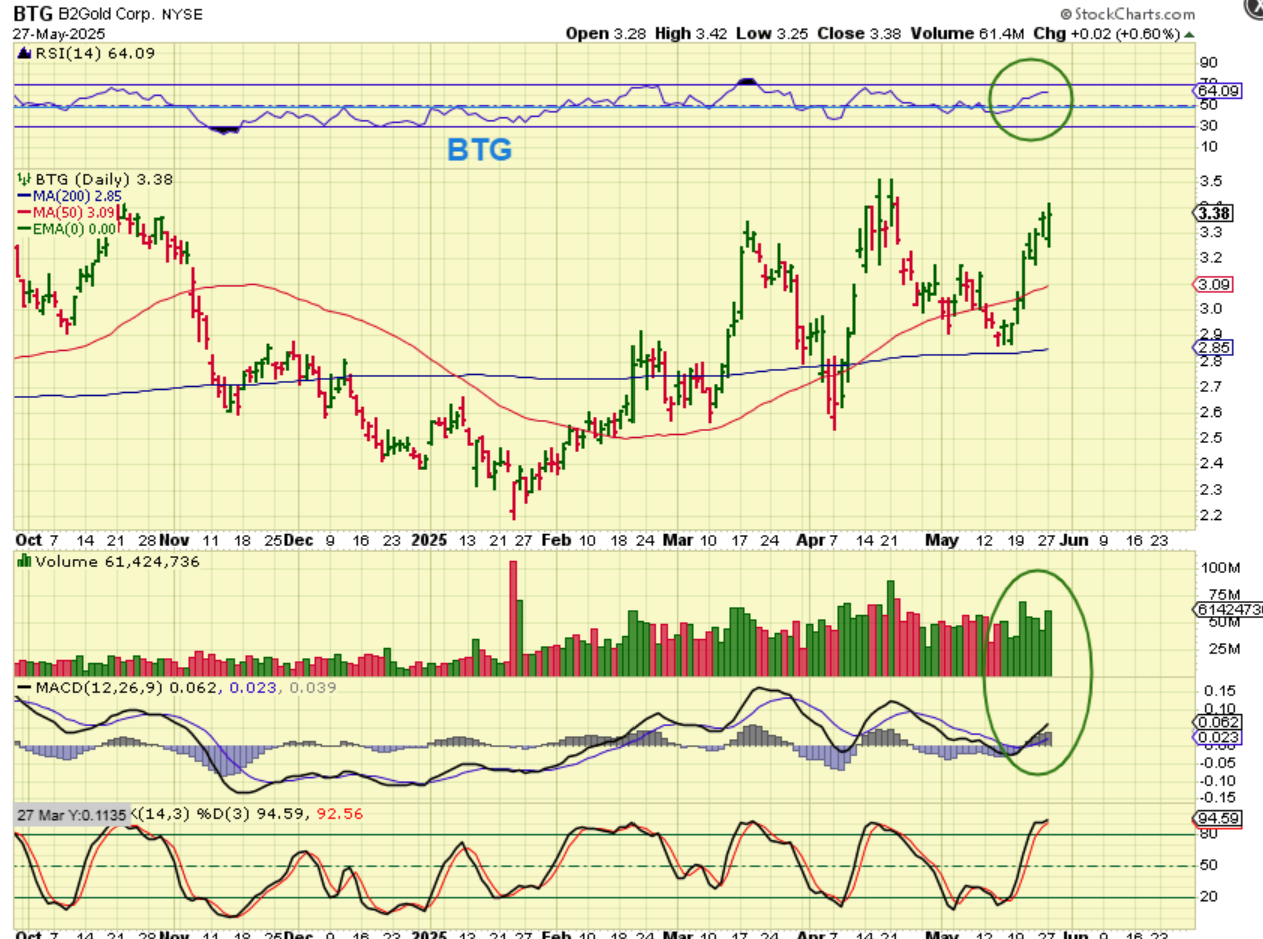
I also think that you should take a look at what was once ‘laggers’ in Gold. While the leaders HMY, KGC, AEM, etc sold off, laggers like NGD, MUX, BTG, VGZ, NG, etc are actually finding buyers.
.
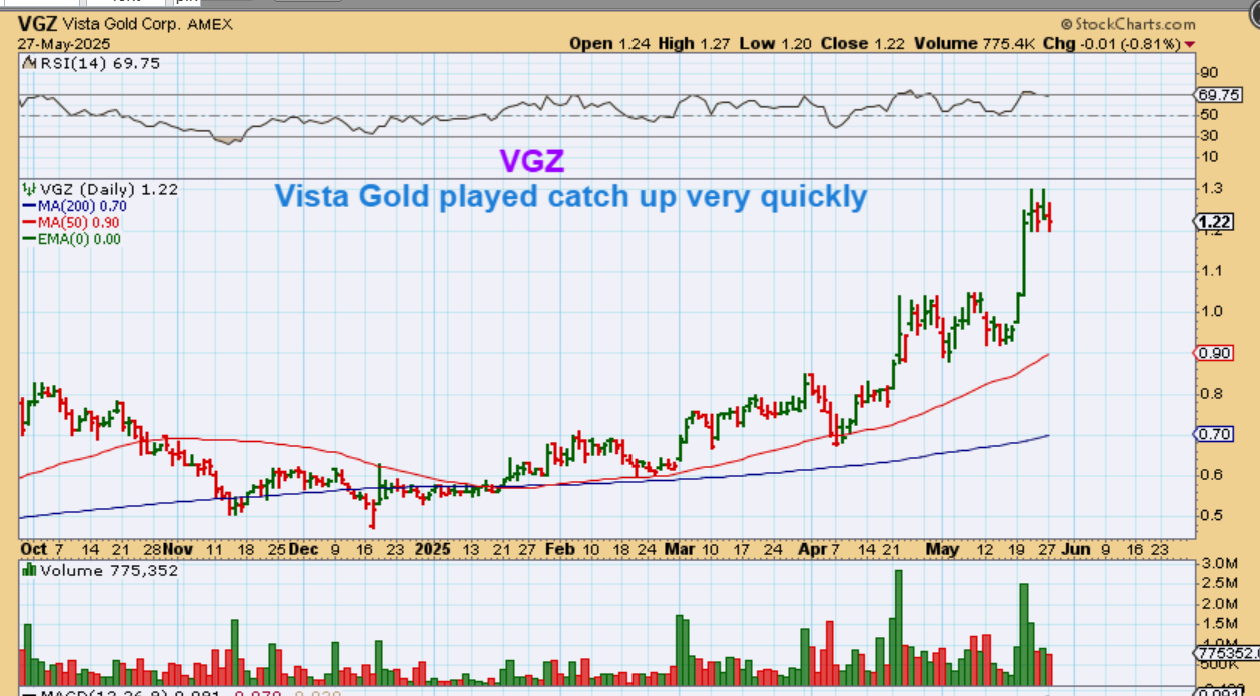
Did you know that VGZ dropped 10% after releasing earnings on May 1, and then took off higher 2 weeks later? It popped up 16% last week and has now doubled since February and played catch up while Gold sold off.
.
These are now showing strength, and that doesn’t seem to match a final daily cycle. It seems to match a move out of an ICL, similar to the Silver stocks. So here in addition to VGZ and BTG above, we will also take a look at NG, NGD, MUX.
.
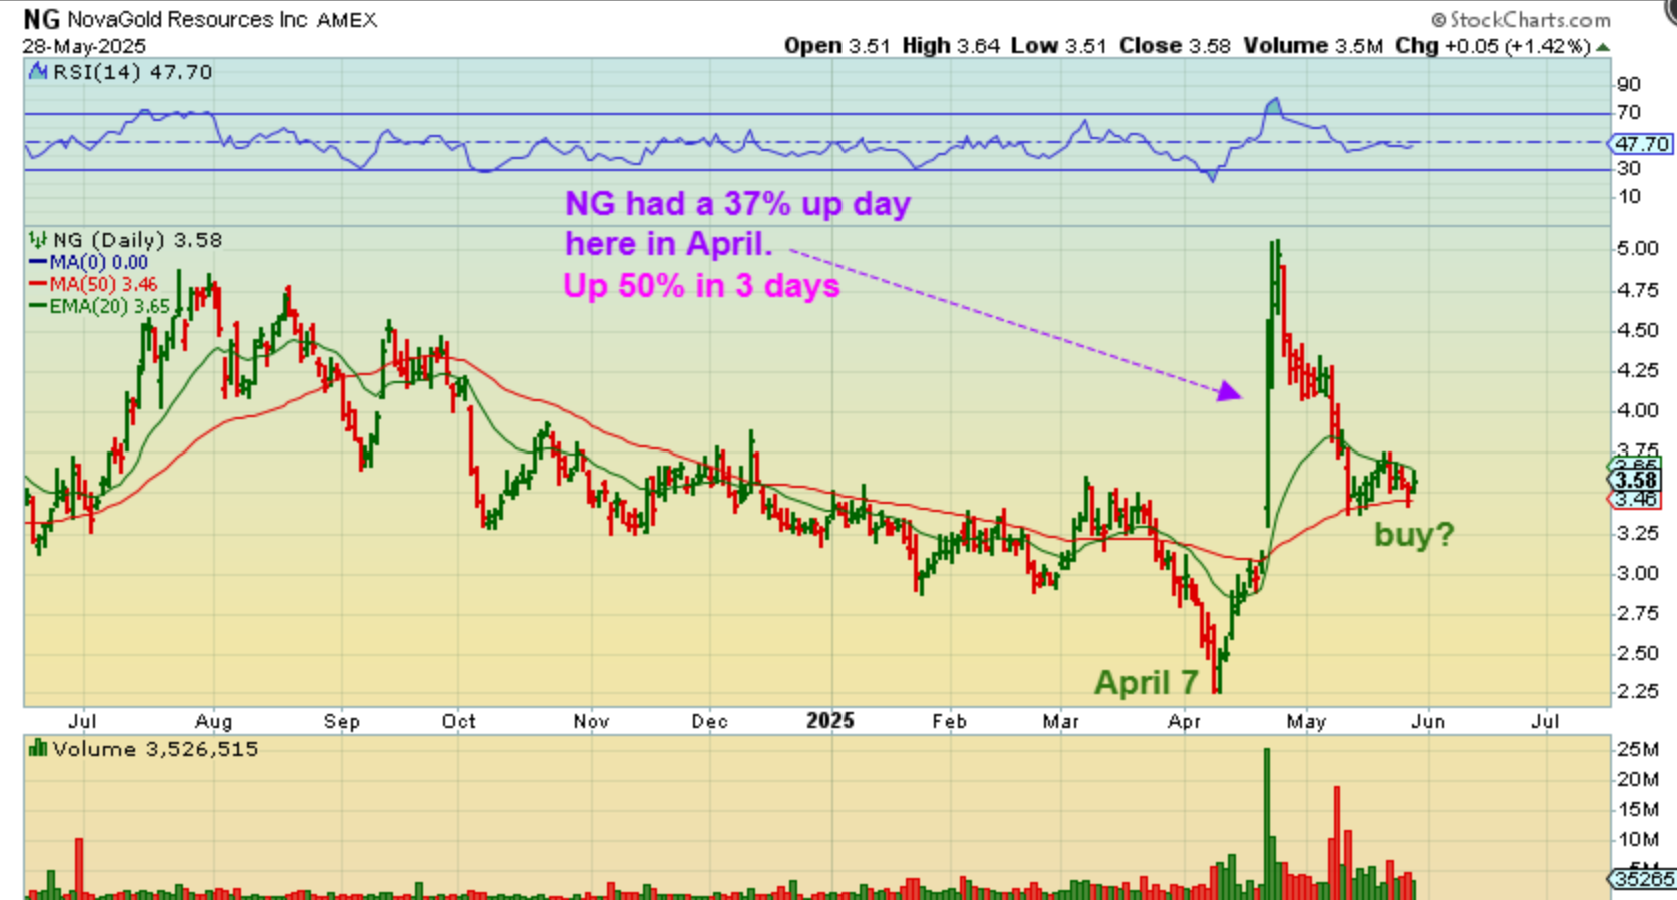
Bullish news can certainly have a bullish affect, and after a POP that is over 50% in 3 days, NG has now settled back down. I don’t Buy extended rallies, but at this point, it has pulled back to support and offers an entry to those that like the news and set up.

.
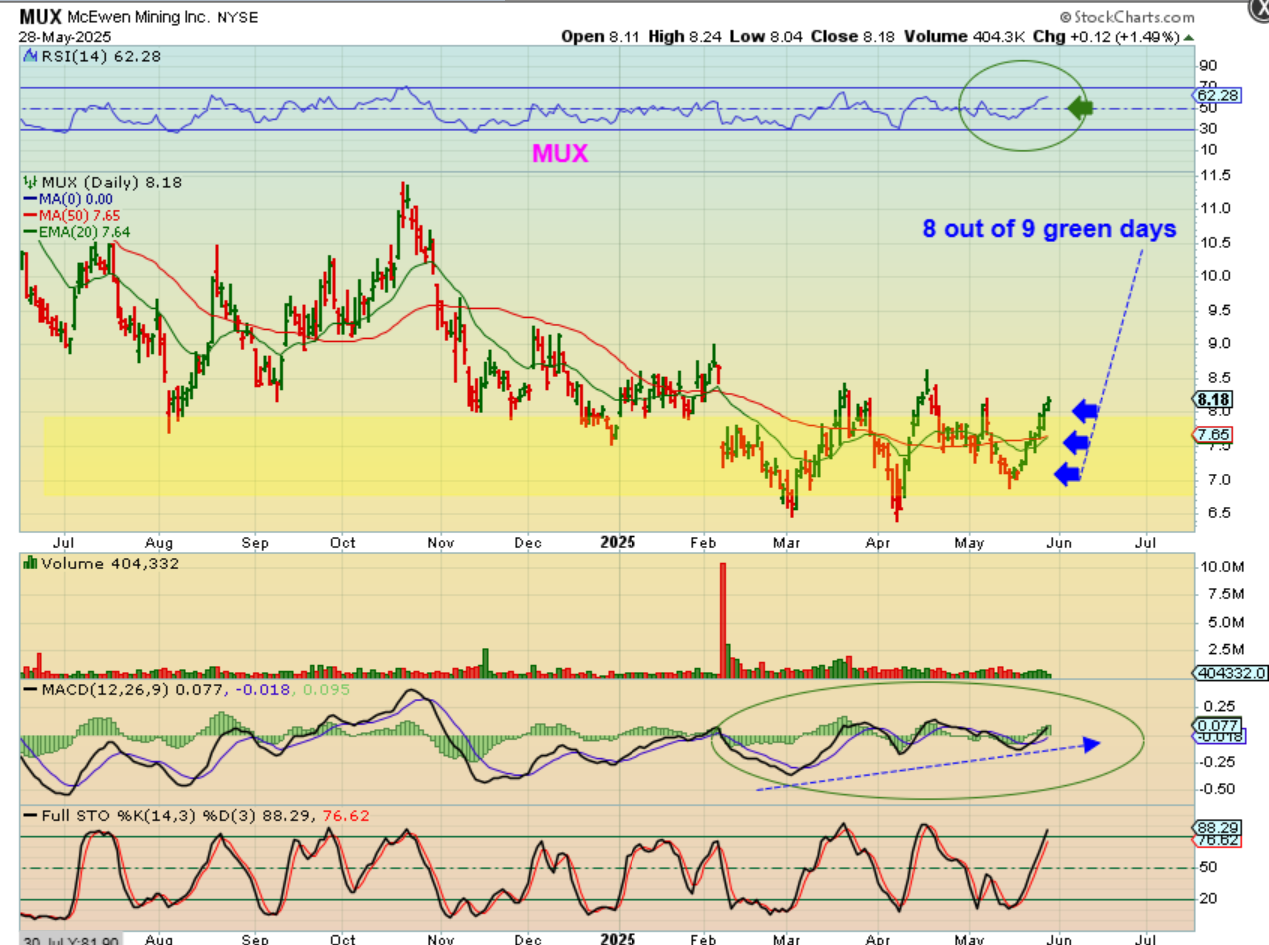
MUX formed a base, but my point here is that it just moved up 8 out of 9 days in a row. Not BIG up days, but steady buying, so I ask myself, “Do we normally see steady buying for 8 days out of a final dcl? Is the RSI usually rising over 50% in a final daily cycle? No. This chart is more bullish than bearish and it may be ready to continue to run higher. $7 to $11 is a nice run.
.
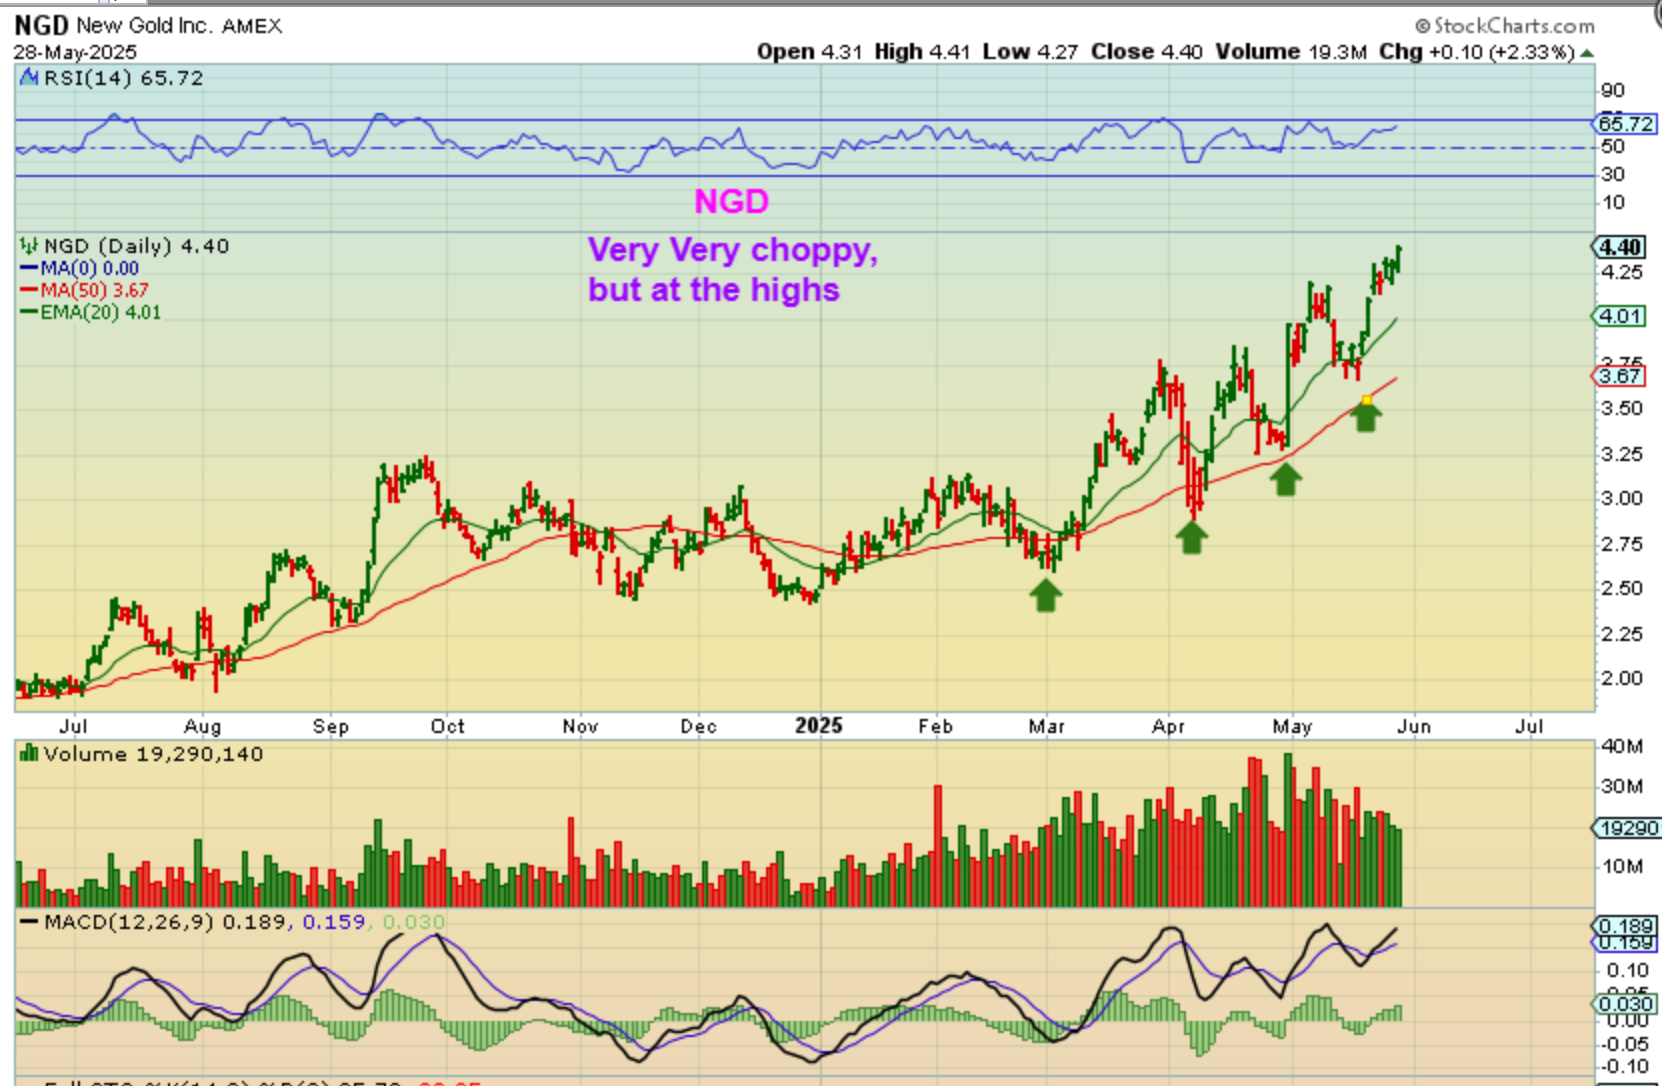
NGD – This would have actually been a very difficulty ‘buy & hold’ due to the wild swings, but again my point is, “Do we normally see Miners run to new highs in a final daily cycle?” No, but here we see that each sell off then gave a bullish surprise to the upside.
.
So the General Markets seem to have put in a mild day 33 dcl, and the stocks are bullish again. I am seeing signs of bullishness in the Precious Metals sector too. Platinum exploded higher turning PLG and SBSW quite bullish. Silver looks just like platinum did following that April 7th slam down and now the Silver stocks are climbing as Silver goes red. A review of many Miners (both Gold and Silver) continues to show improvement and increasing bullishness. When we hit the lows, I said that you can buy that low with a stop and see how it unfolds, since Silver did resemble an ICL and GDX could be considered a L.T. / a-b-c down. Now we can see that Gold may have an A-B-C dip into a triangle ICL.
I was expecting another rally and then a drop with Gold, but with the continuing analysis, the sector is now looking more like a buy for the reasons mentioned in yesterday and todays report. Many miners are still not that far off of the recent lows (especially some Silver stocks like EXK, HL, FSM, etc), and even HMY, KGC, IAG, etc are slowly coming up off of their lows and are still near the 50sma, so they can be bought with a reasonable stop.
.
The Bulls are running again! Enjoy your Thursday trading.
‘
~ALEX
‘
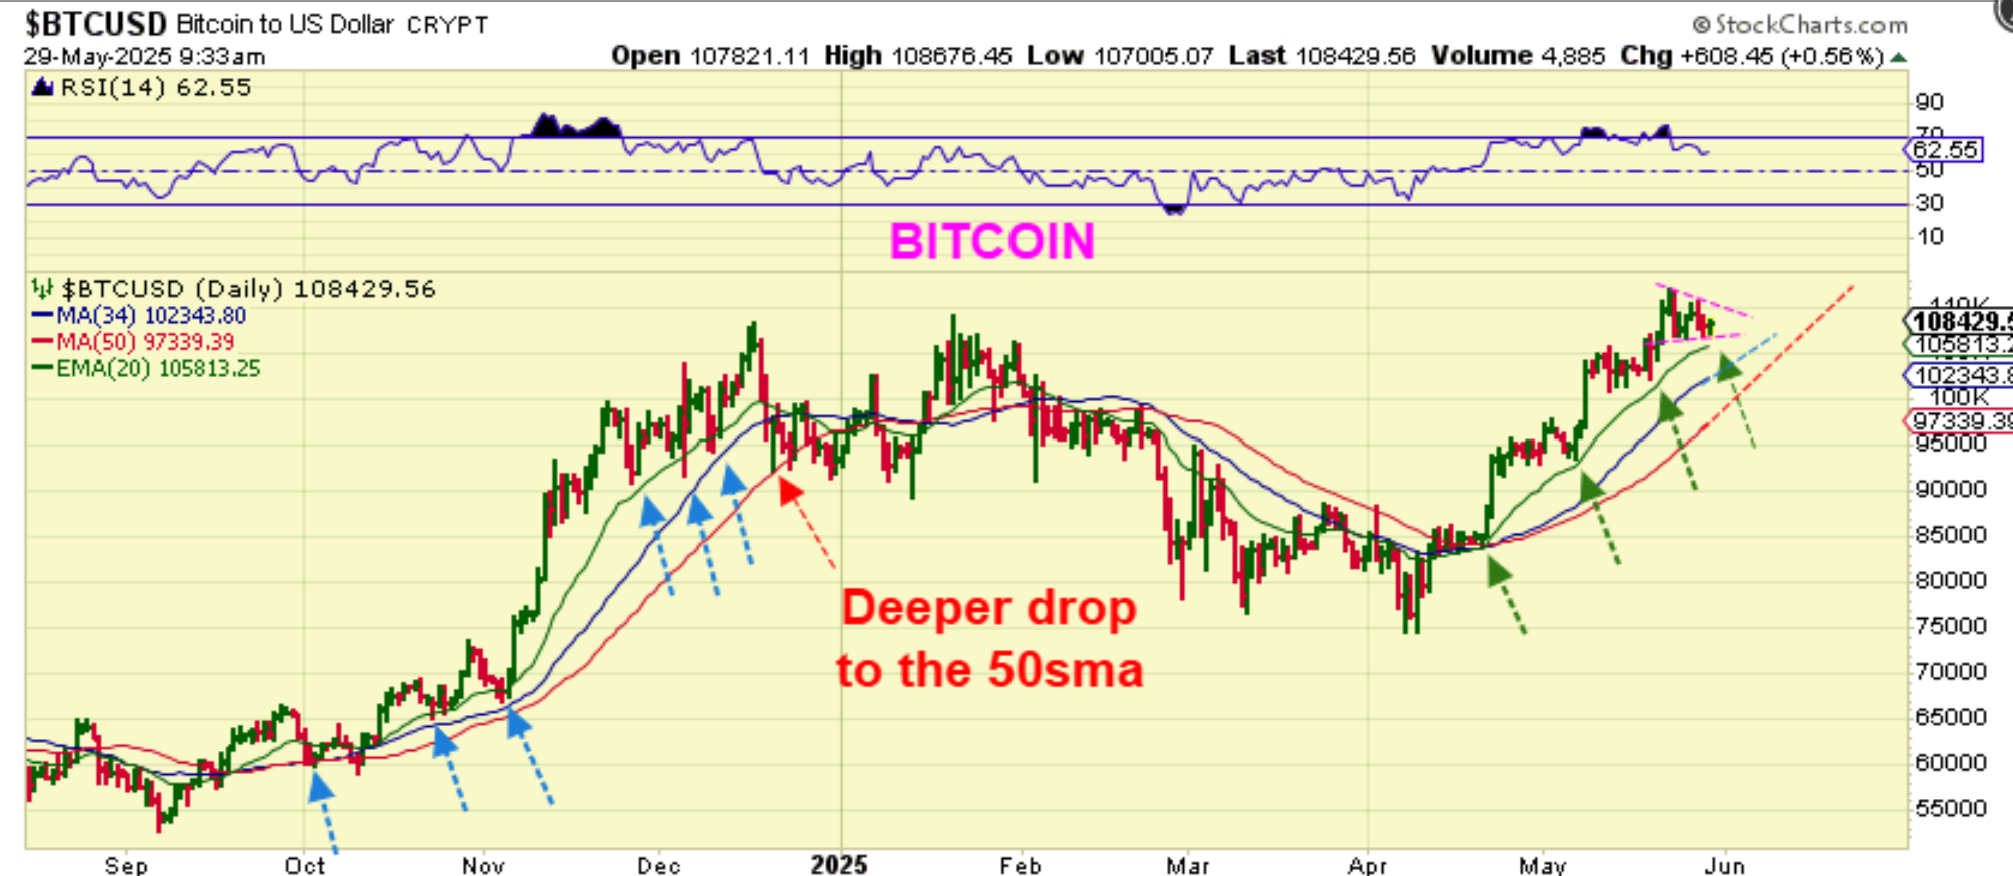
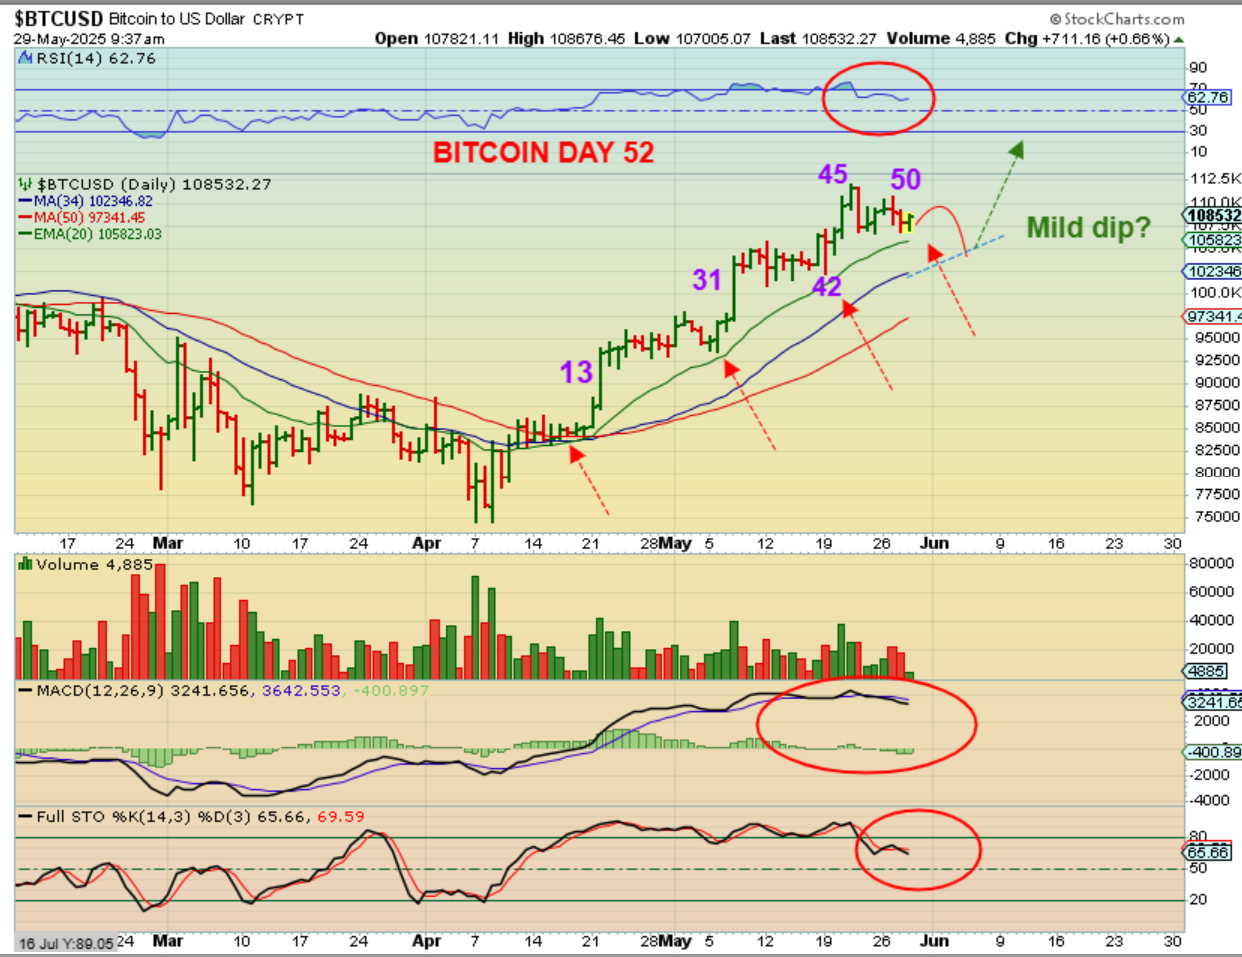
Bitcoin is on day 52 of a possible 60 days , when it usually dips lower. That dip can be mild and come around day 55 or so, or it can come as drawn here around day 60 or 62, etc. Its very reliable, but not an exact number, so basically we’re saying that Bitcoin can dip at any time. Also, is that a triangle forming? It does look like a wedge and if so, the dip can be milder than shown here. I was just using the 34 sma and I’ll show you why…
‘
Bitcoin in past rallies ran up the green 20 ema, just like it did on this run. On a deeper dip, it dropped to the 34 sma or 50 sma, and that is why I drew it as I did. I do see a wedge, so we may or may not drop that far.