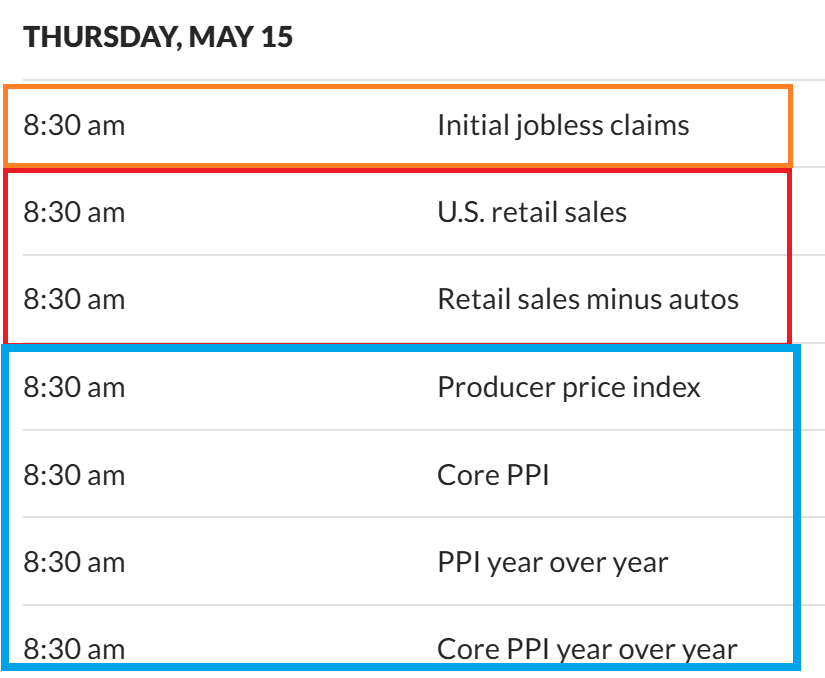
Thursday May 15th
This is some Hot data, but remember:
It isn’t always what we think of the data, it’s how the market perceives it. We could see bad news, and the ‘markets’ my still rise thinking that it means a Fed Rate Cut in June. We’ll just have to see how today plays out, but we are in a bullish market right now.
.
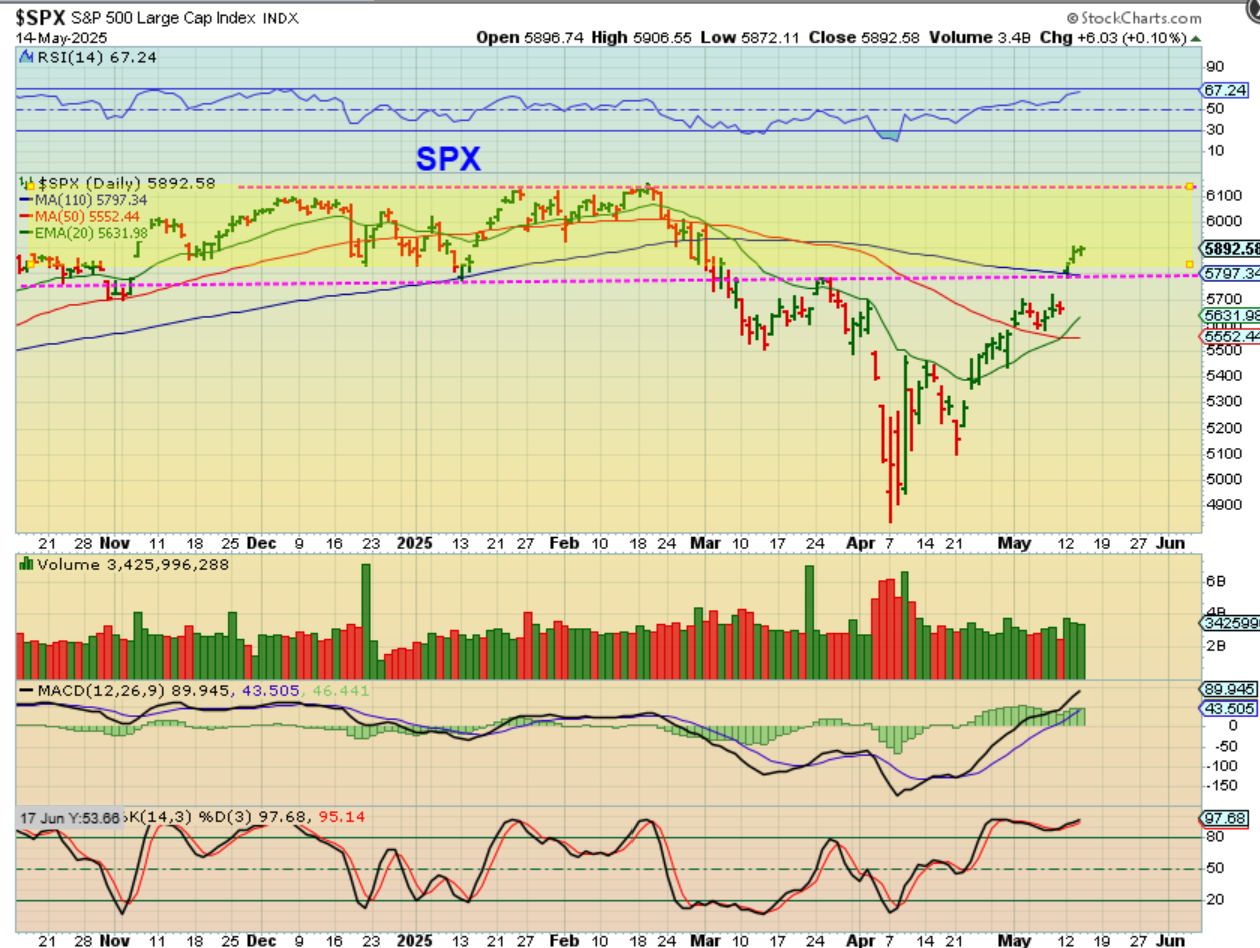
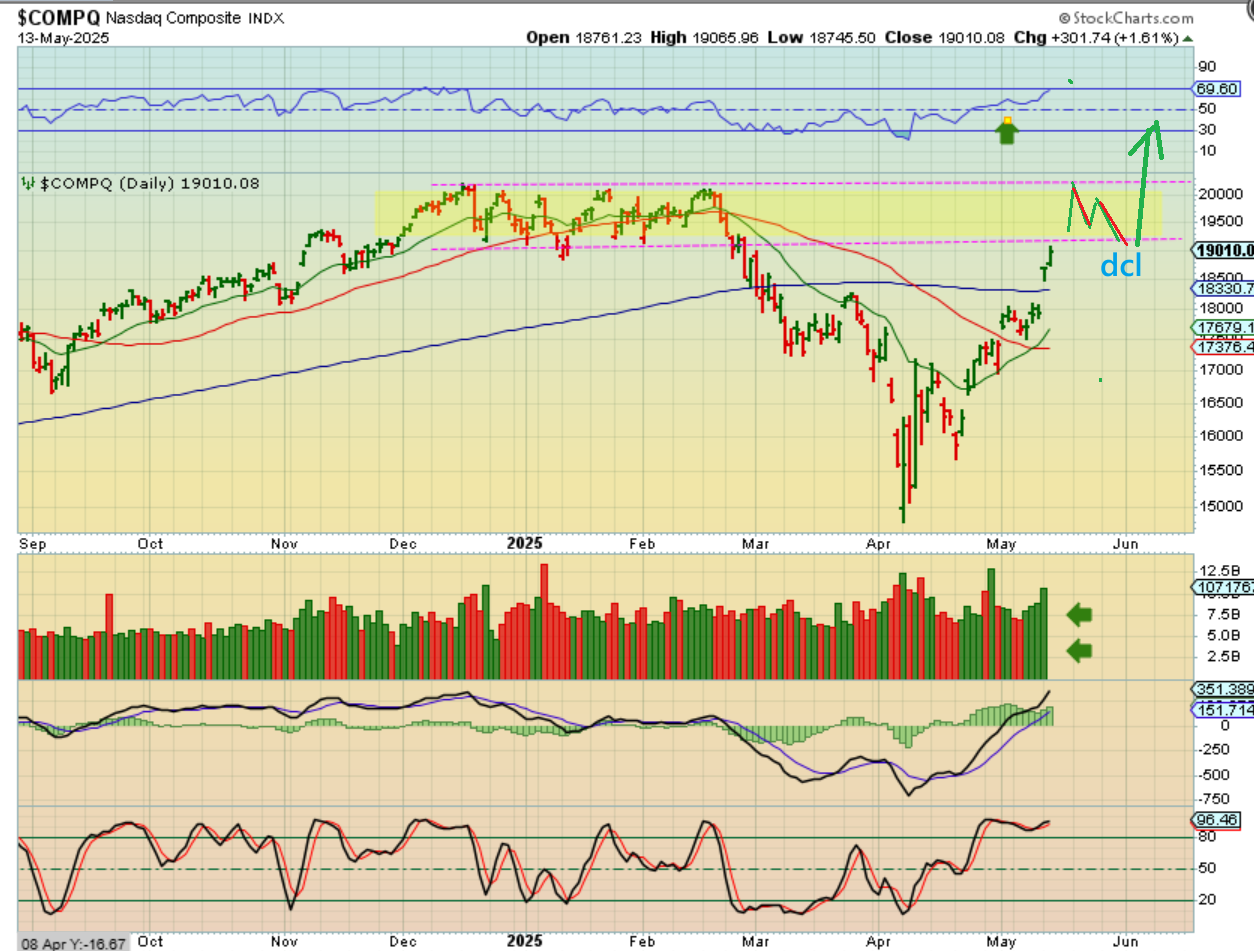
SPX #1- THIS HAS BEEN A SOLID RUN OUT OF THE LOWS. We are above the resistance of the 50 & 200sma, but we are also pushing through the resistance of a consolidation zone (yellow).
.
SPX #2– The markets are on day 27 today, so they CAN continue to run higher and then dip into a dcl around day 35ish.
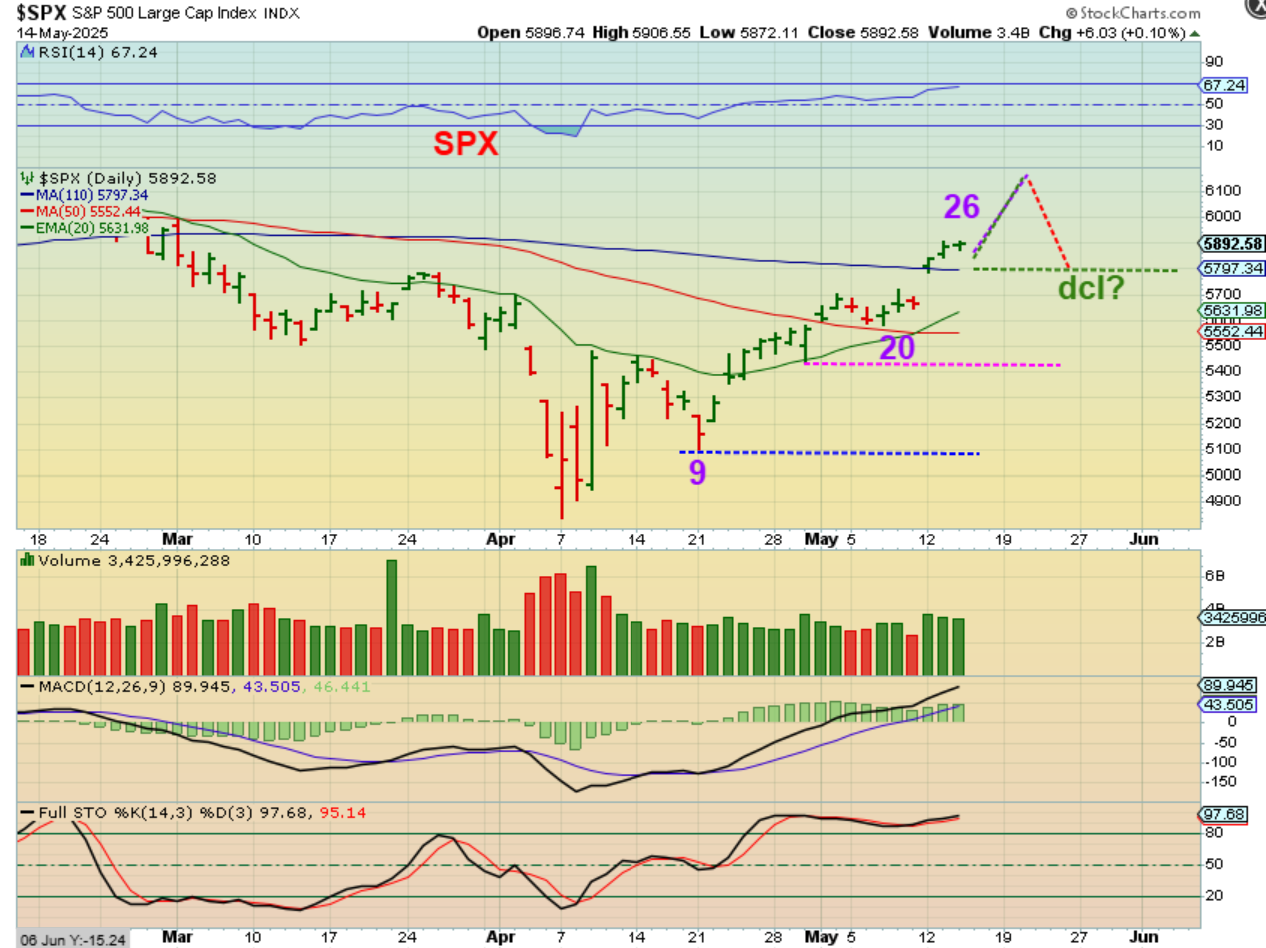
Yesterday I said:
For now it could be anything like this…
1. A run to former highs, ‘peak’ there, and dip into a dcl? OR
2. Pause at resistance right here at the yellow consolidation and churn into a dcl at the blue 50sma? We just need more time and clues to be able to ‘buy that dip’ when it comes.
.
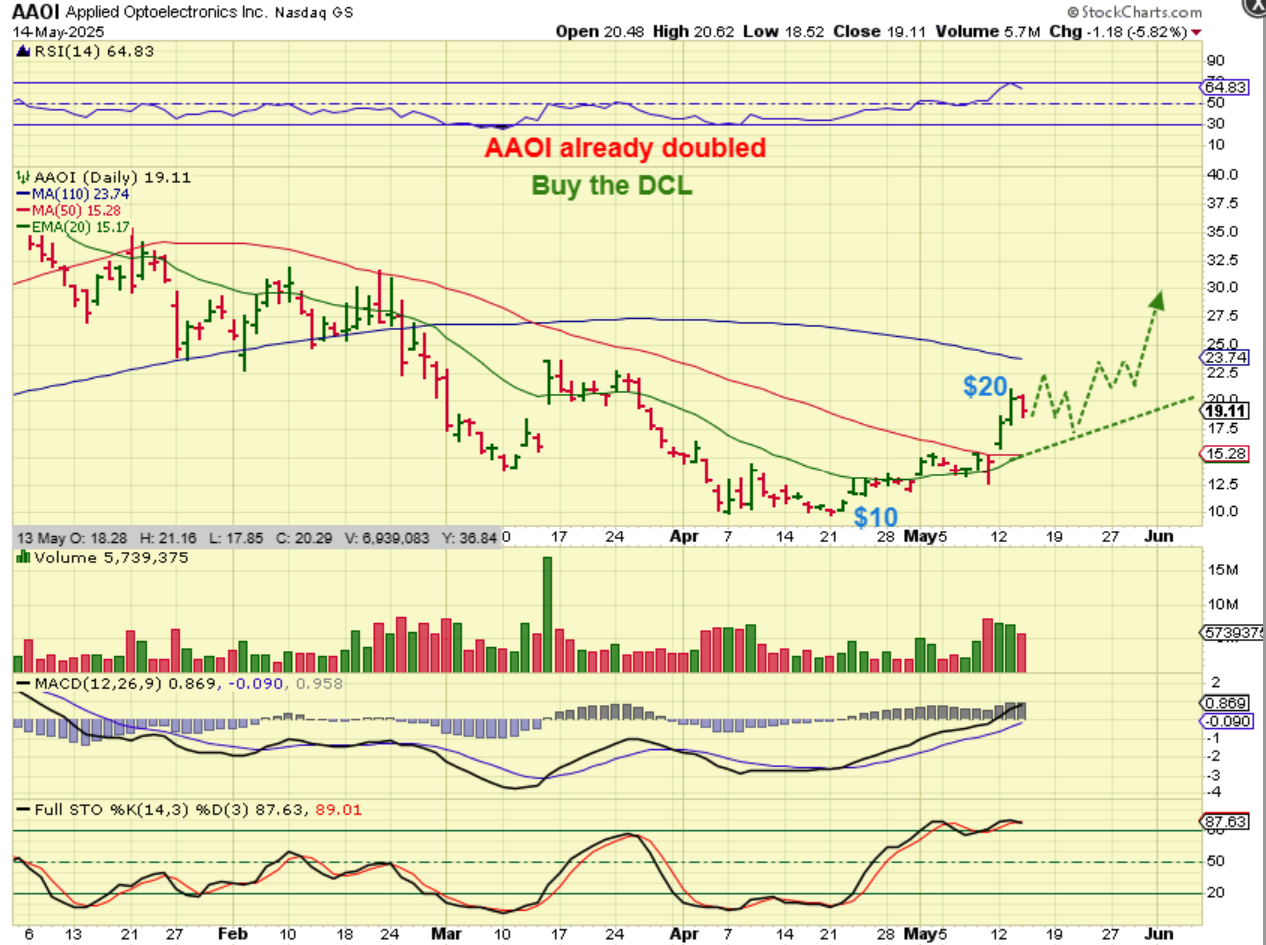
AAOI was one of my favorites and yesterday pointed out that it has already doubled out of the low from $10 to $20 (& yet still has plenty of upside over time). Well, it dipped on Wednesday and if this drops to the 50sma now or later, that would make a good entry for another strong run.
.
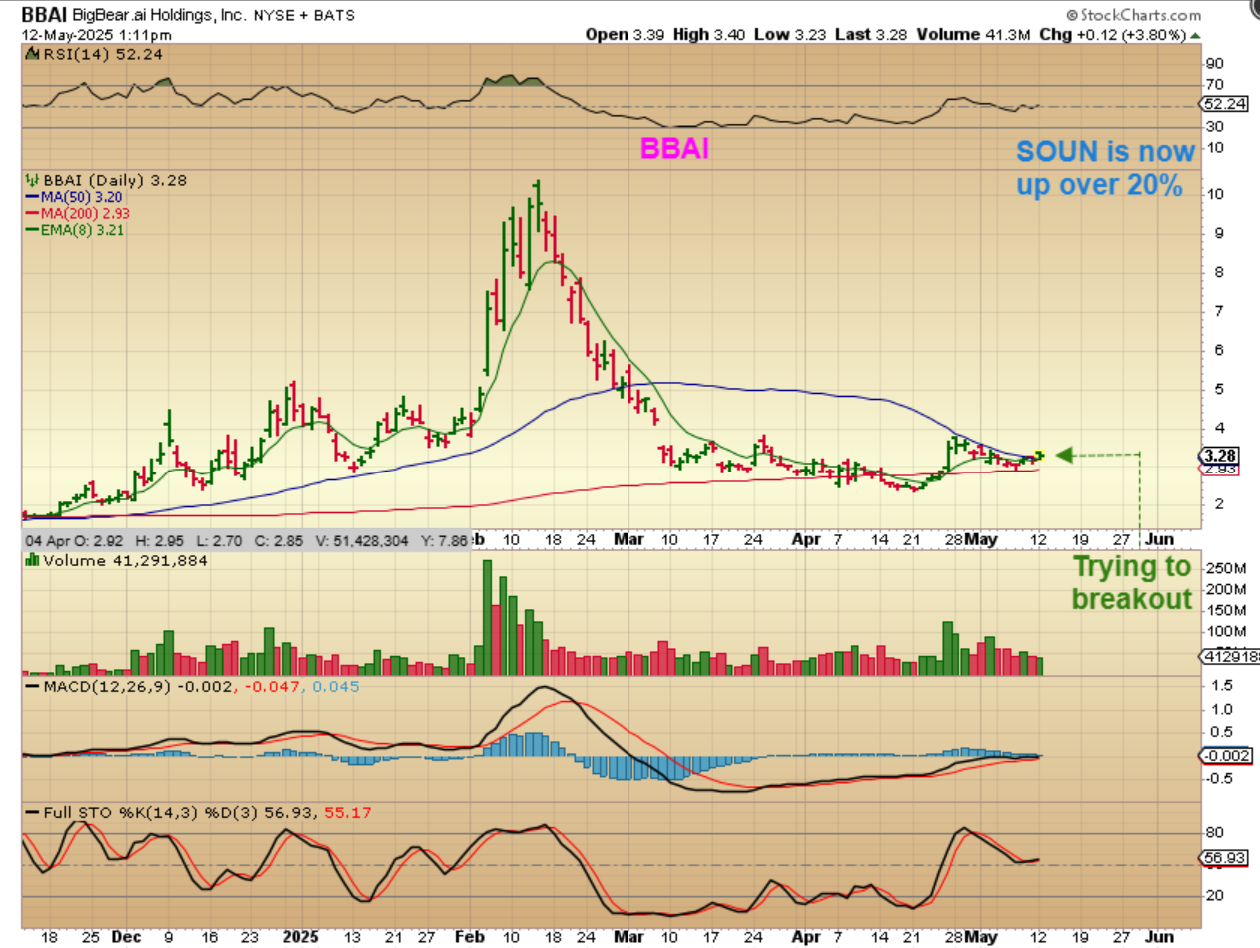
You will recall that I pointed out the set up for BBAI recently and mentioned that it looked ready to breakout. BBAI has a base and was trying to escape above that 50sma. It looks like a good set up…
.
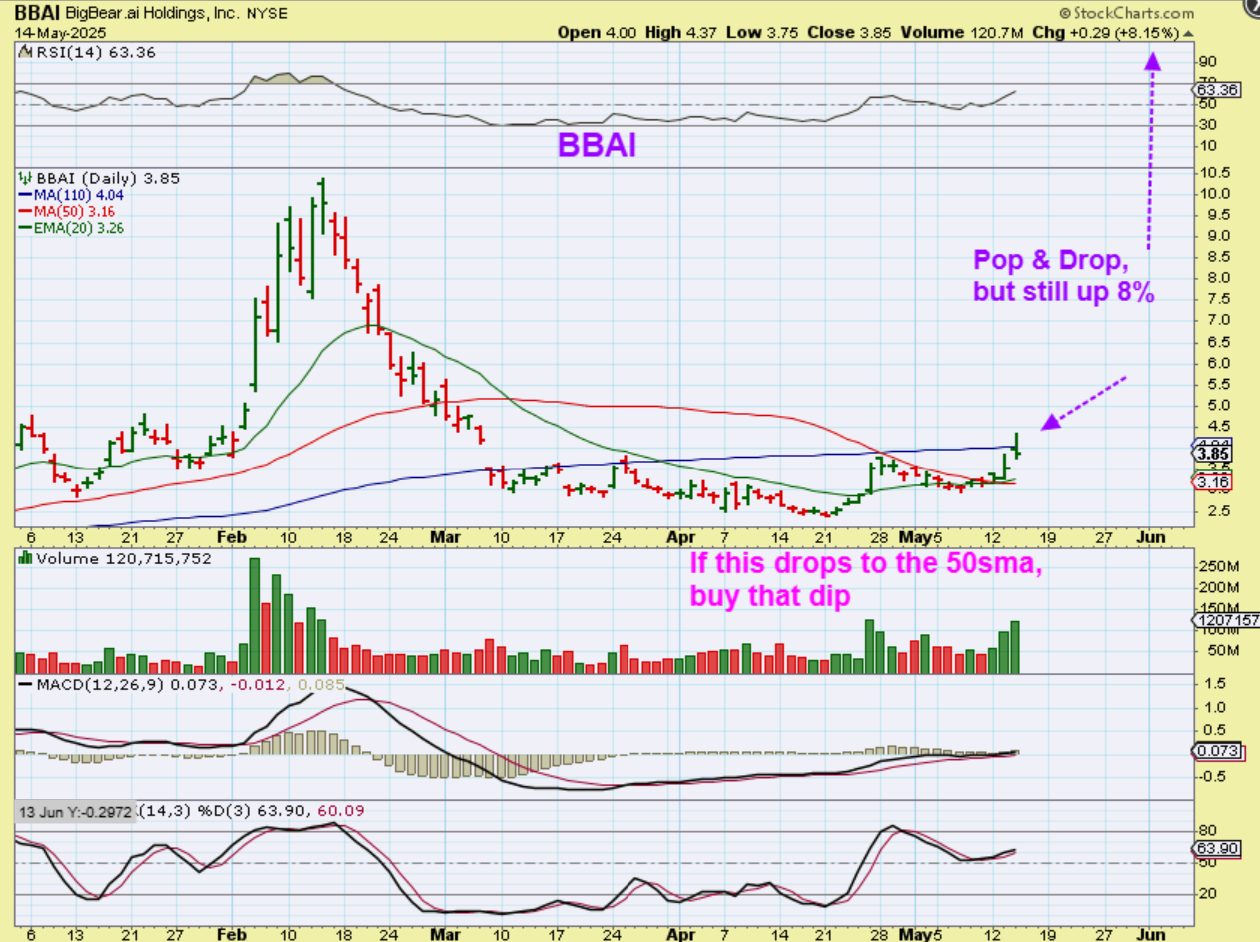
2 days later and BBAI is trying to break higher, but we did get a pop and drop.
So BBAI was up 17% or so Wednesday, but even with that drop it closed up 8%. THIS POP & DROP is not a bad thing in the long run, since most bull runs have occasional dips and we can add on a dip. If this drops to the 50sma it could become a strong buy agin. I like the volume on the Green up days.
.
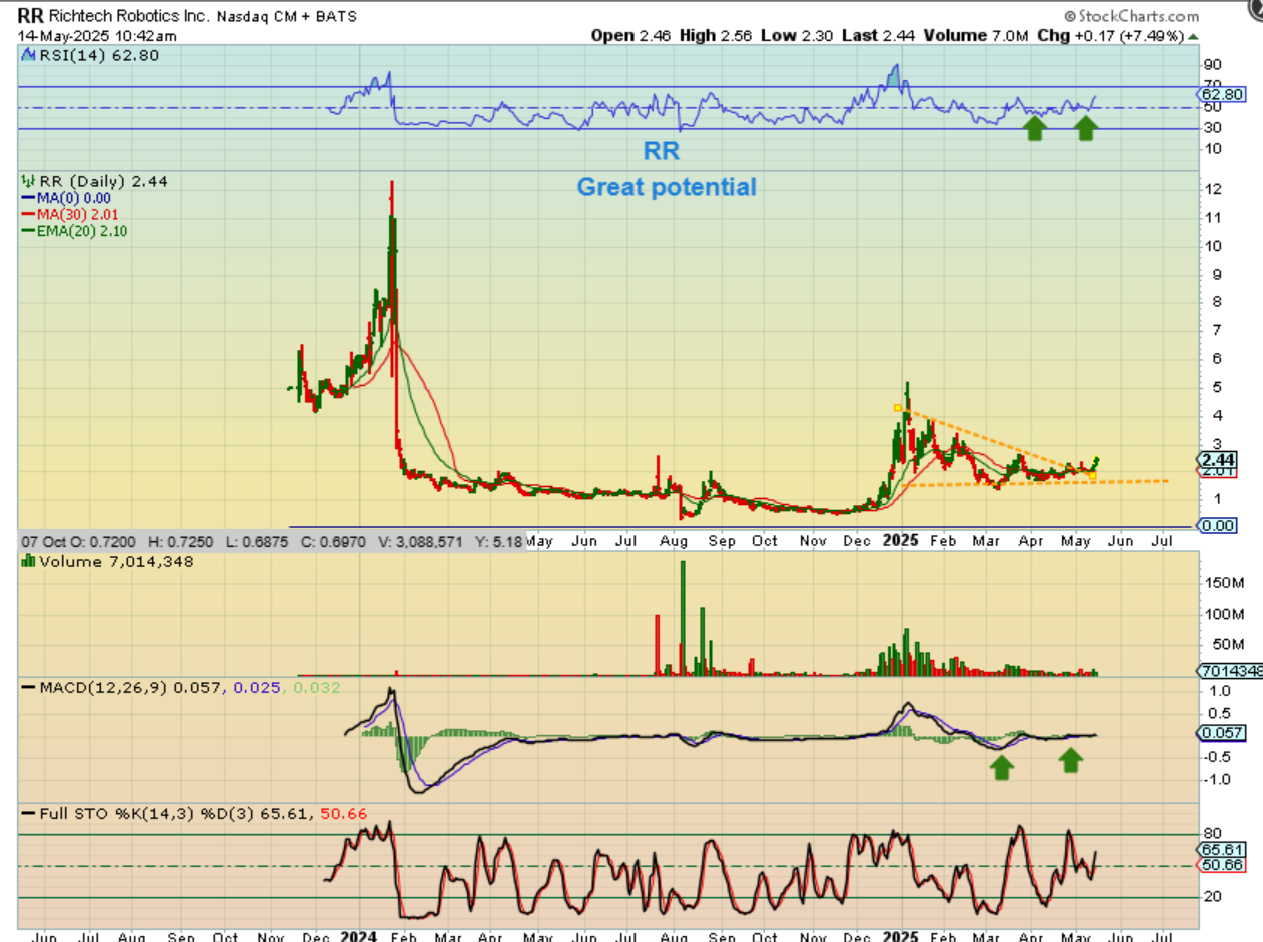
RR – I’ve been pointing to this Robotics stock as a nice set up too. It was up 8% on Tuesday and here up 8% Wednesday. RR still has good potential in the long run, as seen on this chart.
.
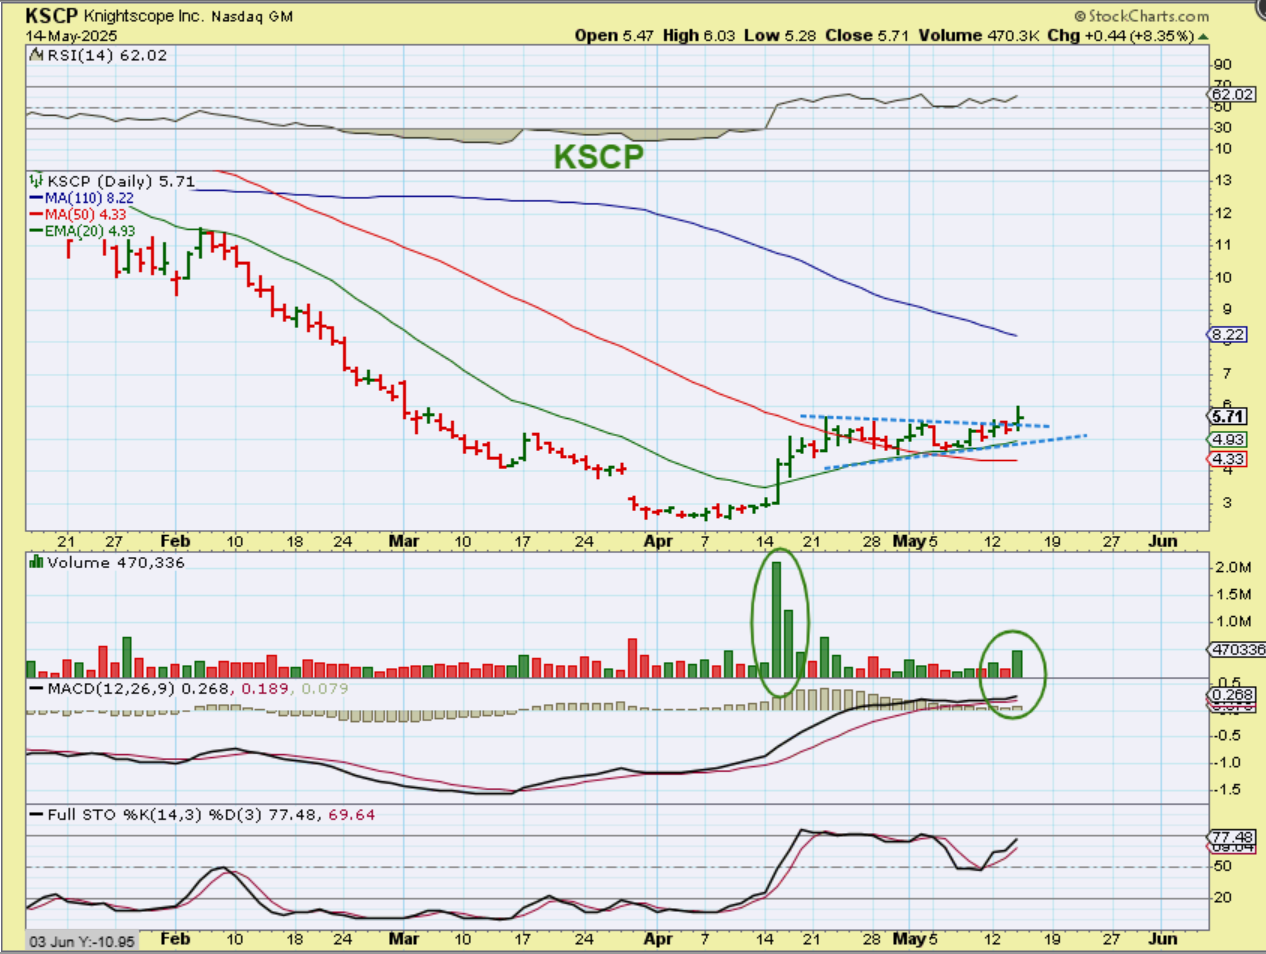
KSCP is also a nice set up. That ‘small bump’ up off of the lows from April to May was actually over 100% too ($2.45 to $6.00). Volume is increasing and it looks like it wants to break out.
.
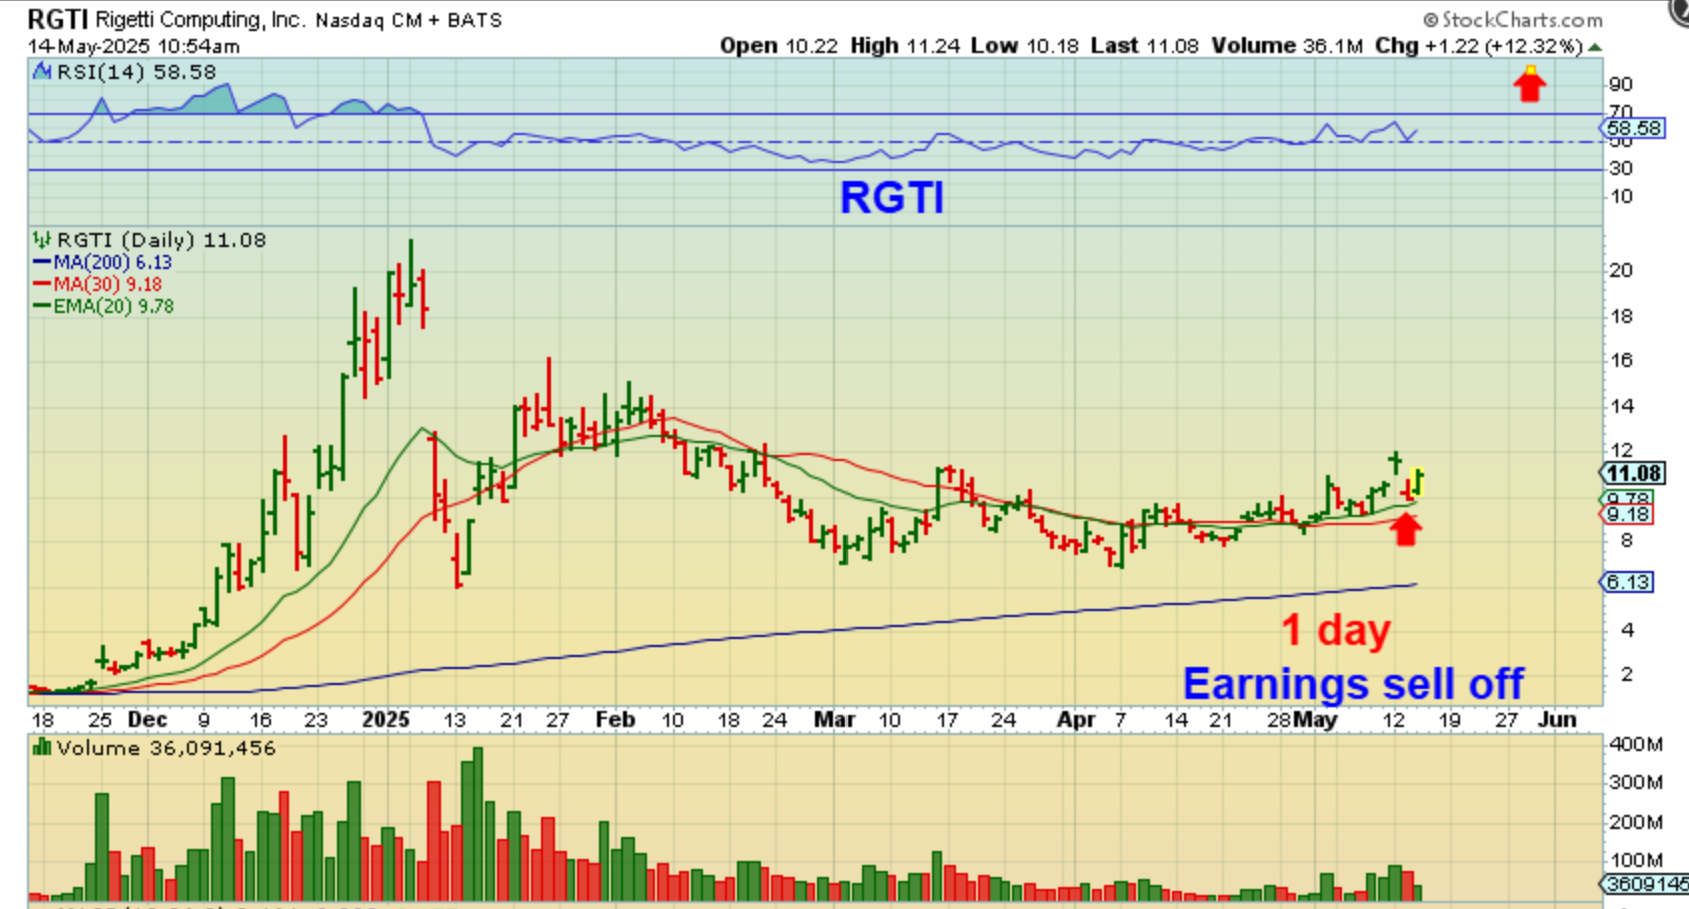
RGTI dropped sharply with earnings on Tuesday, but landed at the 20ema and then started to run higher on Wednesday, so I grabbed this chart and posted it in the morning. It ran up over 20% Wednesday and closed up 18%. This Quant sector moves FAST, and this is still a bullish base.
.
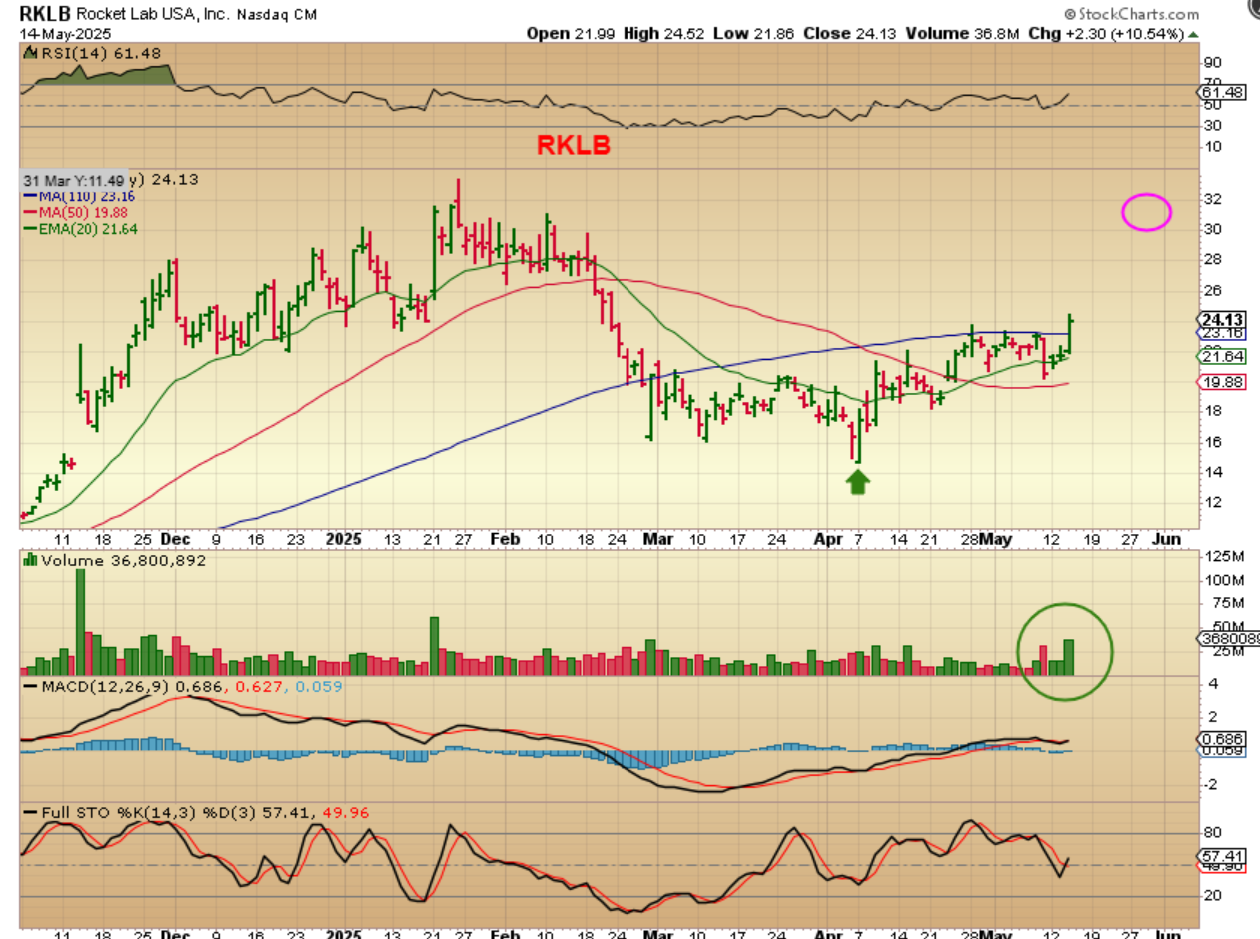
Another old favorite of mine was RKLB , which reversed strongly at the ICL and then based out for a bit. I pointed the stocks reversal out with this April chart…
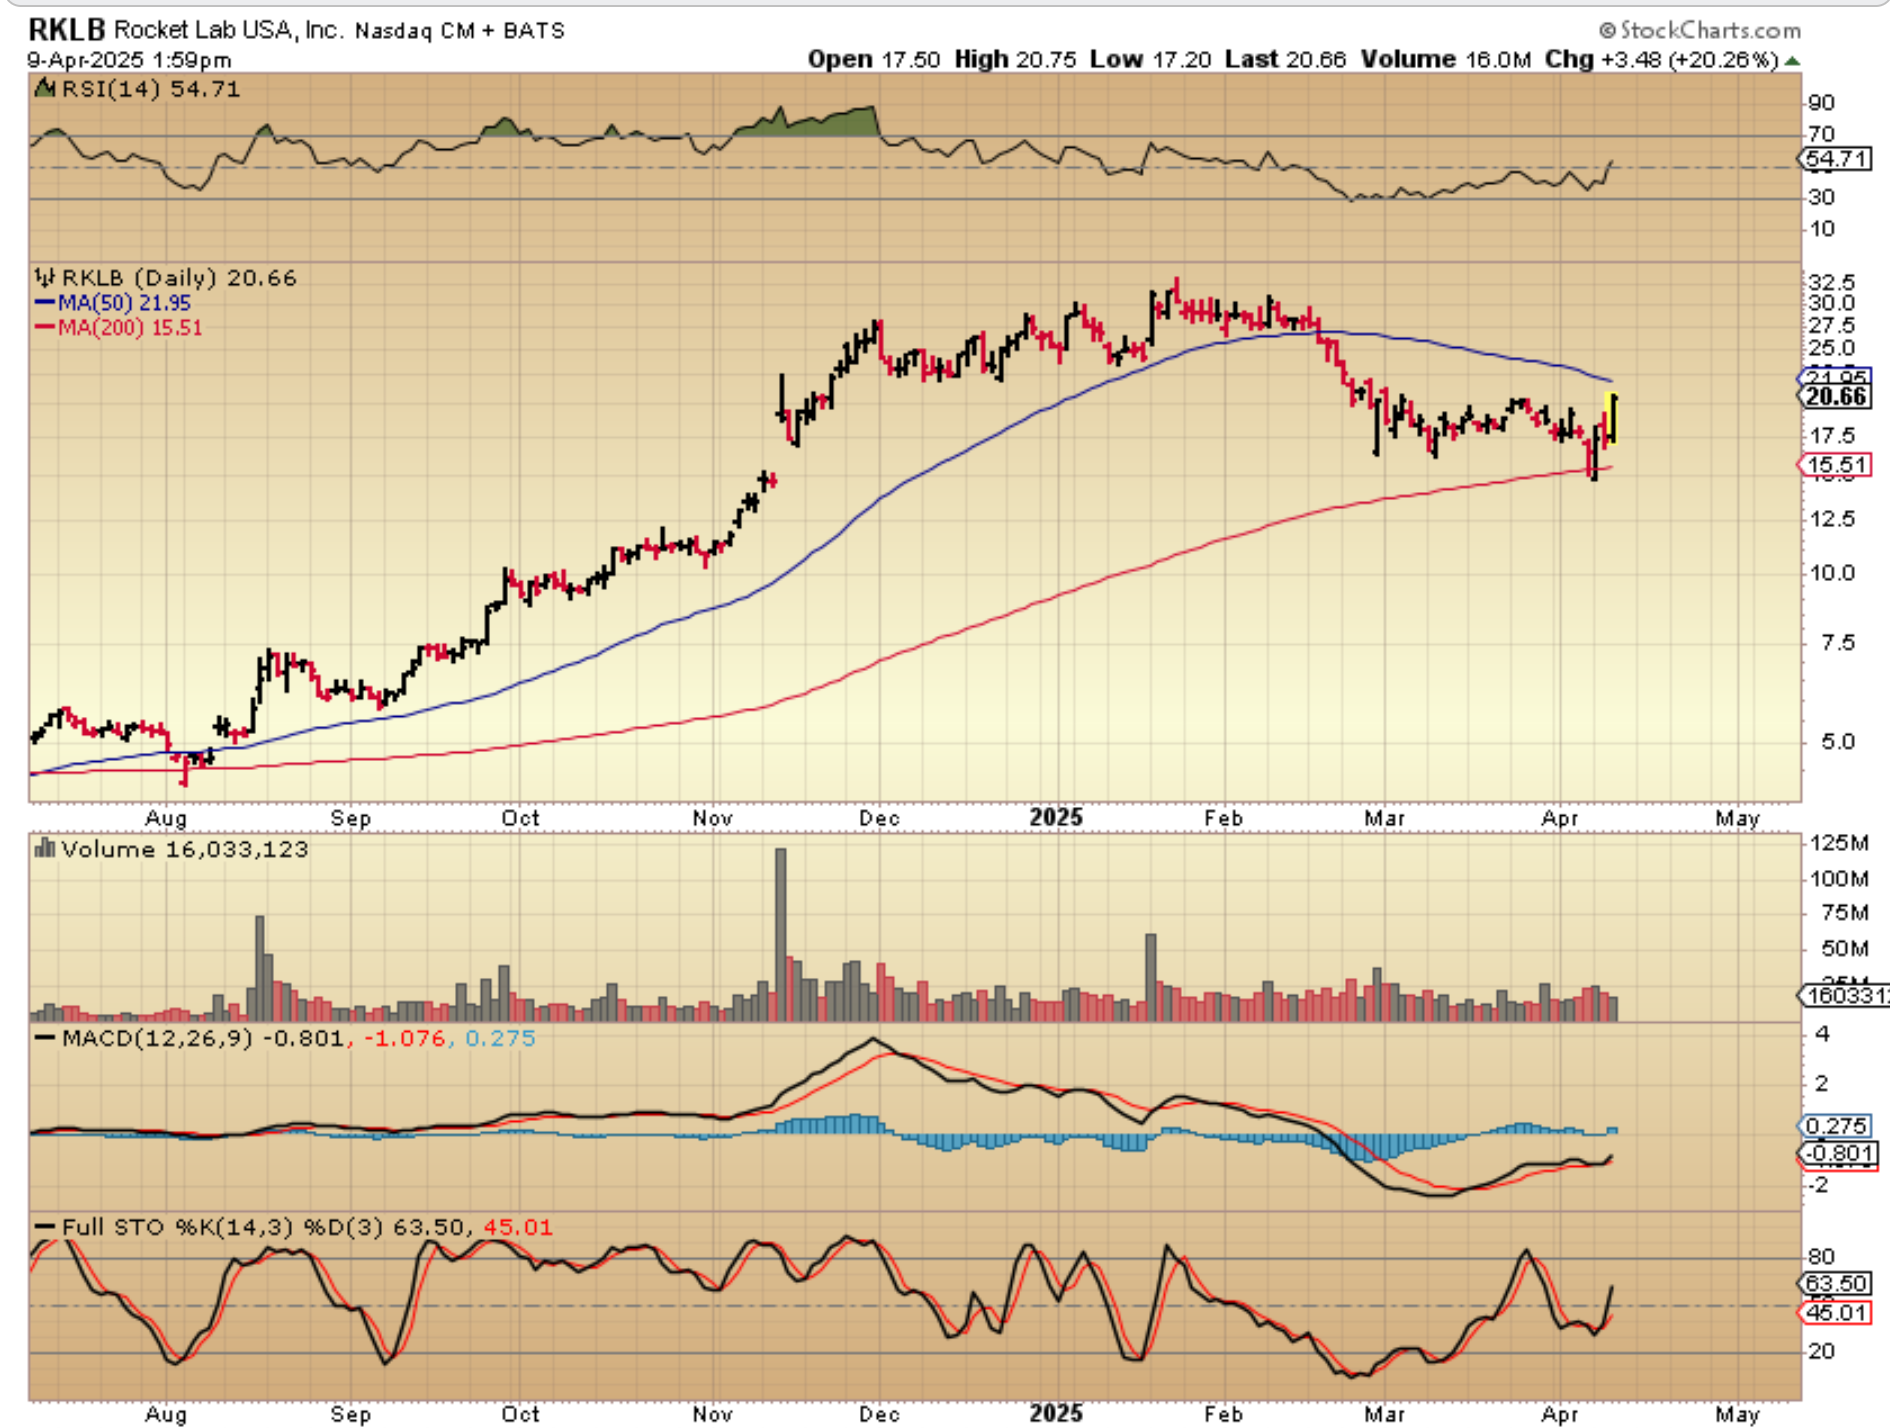
RKLB then popped & dropped and churned sideways, crawling along under the blue 50sma. On Wednesday it Popped through that resistance and volume is increasing, RKLB looks good.
.
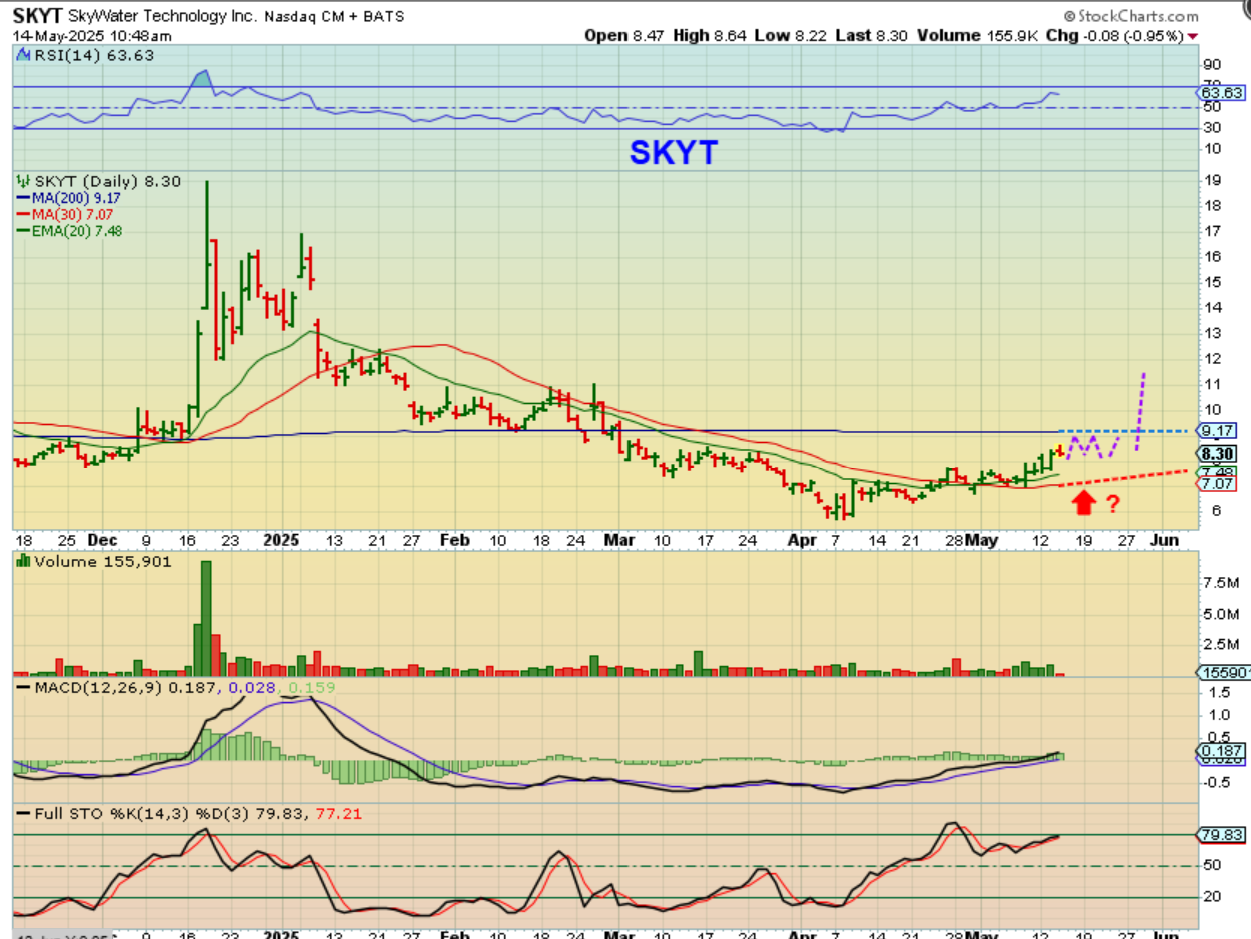
SKYT also has a long base and was mentioned by Siva in our commenting area. I like the prior bursts in 2024 and the current base (it has moved from $6-$8). It is climbing toward the 200sma, and
1.It can be bought here,
2. Bought with a drop to the 20 ema, or
3. If you watch it and it ‘crawls’ along that 200sma, buy it then or on a breakout (like RKLB just did in the chart above).
.
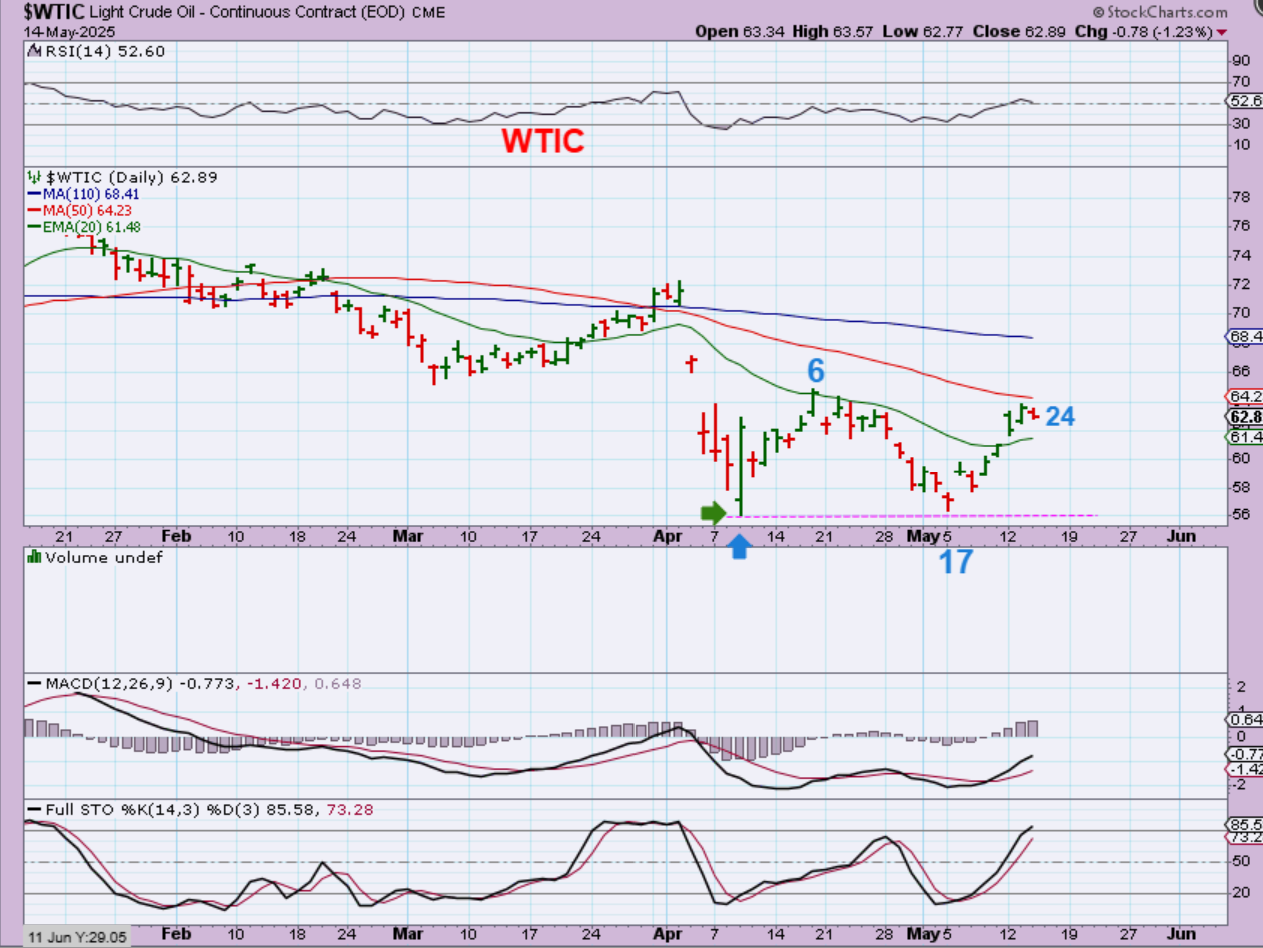
WTIC – Oil put in a double bottom low and is on day 25 today. Oils daily cycles often run 40-50plus days, so this chop or movement can continue a few more weeks. I apologize, I had the 100sma (110 sma @ $68.41) on the chart for another stock, but the 200sma for Oil is at $69.83, so price could get up there near $70 in this daily cycle.
.
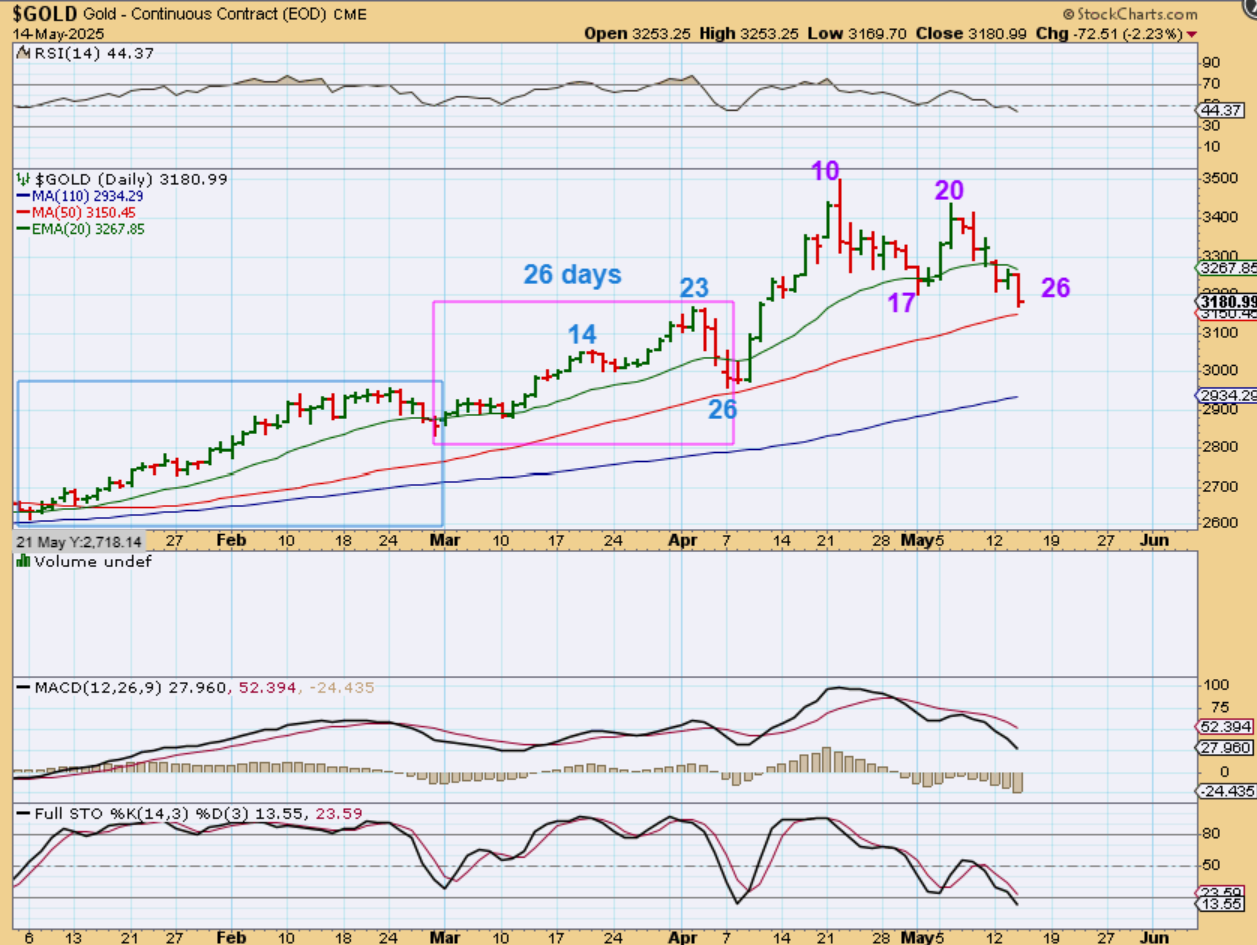
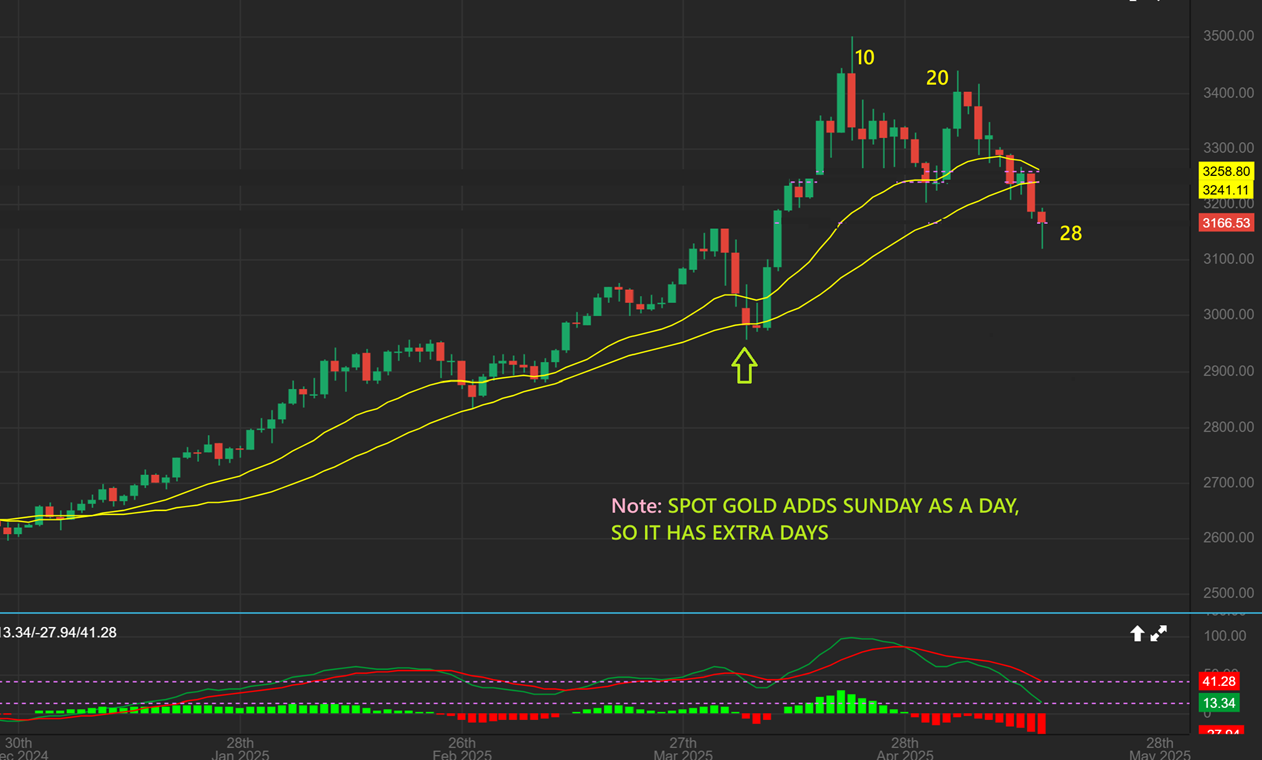
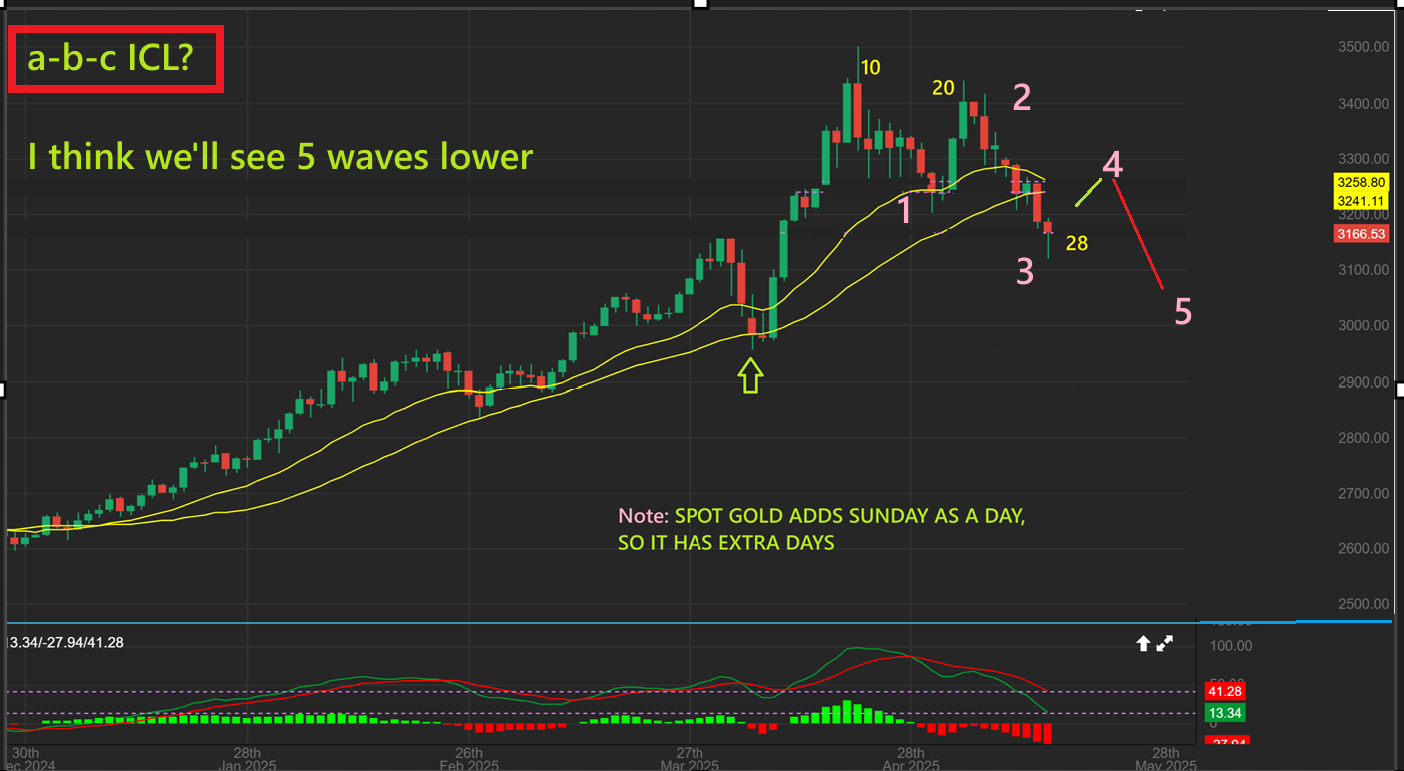
GOLD dropped to the 50sma and added another day to the current daily cycle. I am pointing out that the first daily cycle was very long, and may include 2 daily cycles when it formed that triangle (not shown). The next one was shorter at day 26. We are now at day 26, so a dcl can come into place anywhere around here. LET’s GO LIVE..
.
LET’s GO LIVE at 6.a.m.: I just want to remind you that recently ‘Spot Gold’ started to add Sundays trading from 6 p.m. to midnight as a completely separate day, so this chart has 2 more days on it than ‘stockcharts’. That said, this morning we have a reversal candle forming on day 28, so a dcl can come in at any time.
.
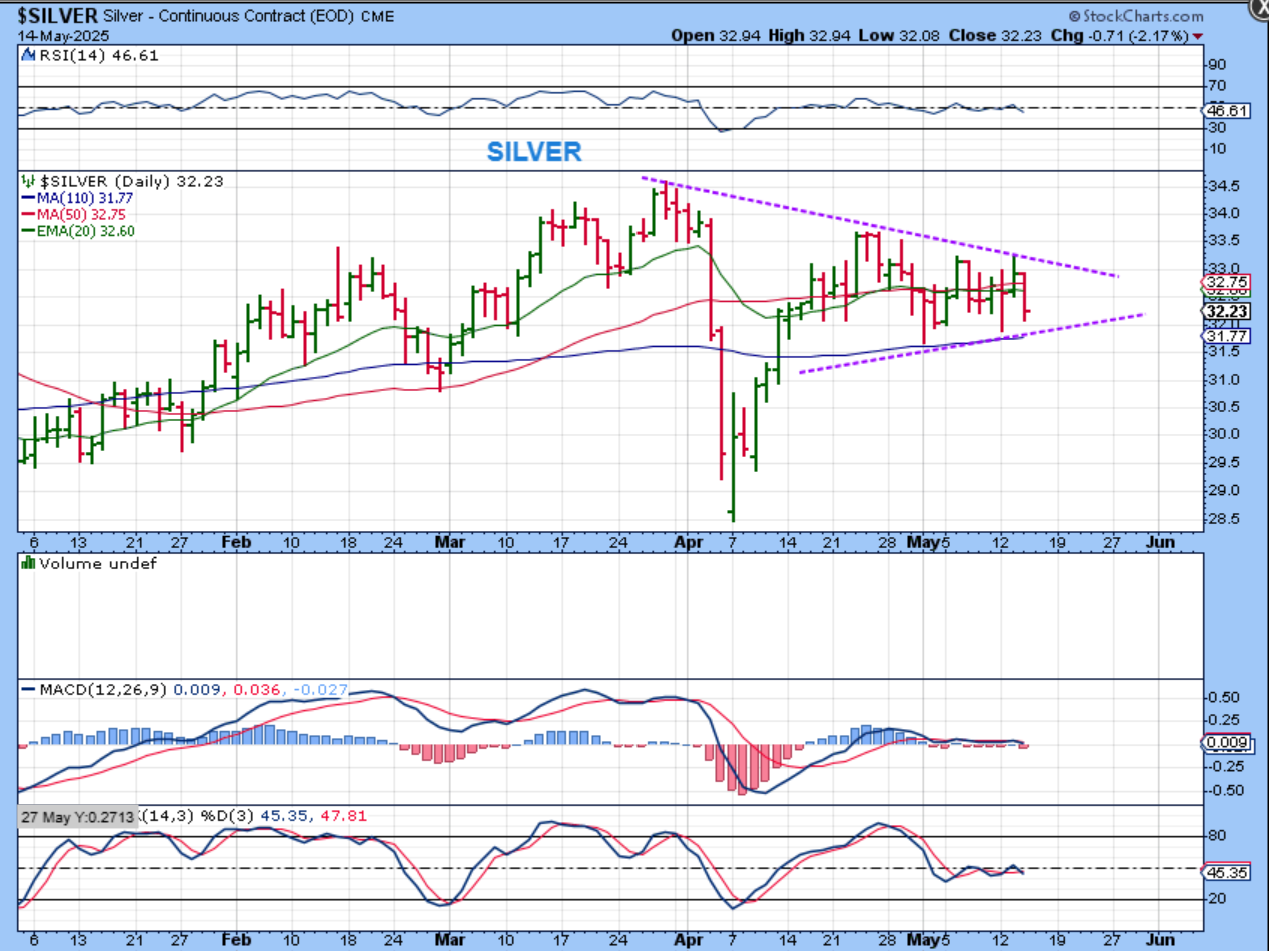
SILVER dropped too, but it remains above the possible triangle formation. Triangles CAN break out in either direction.
.
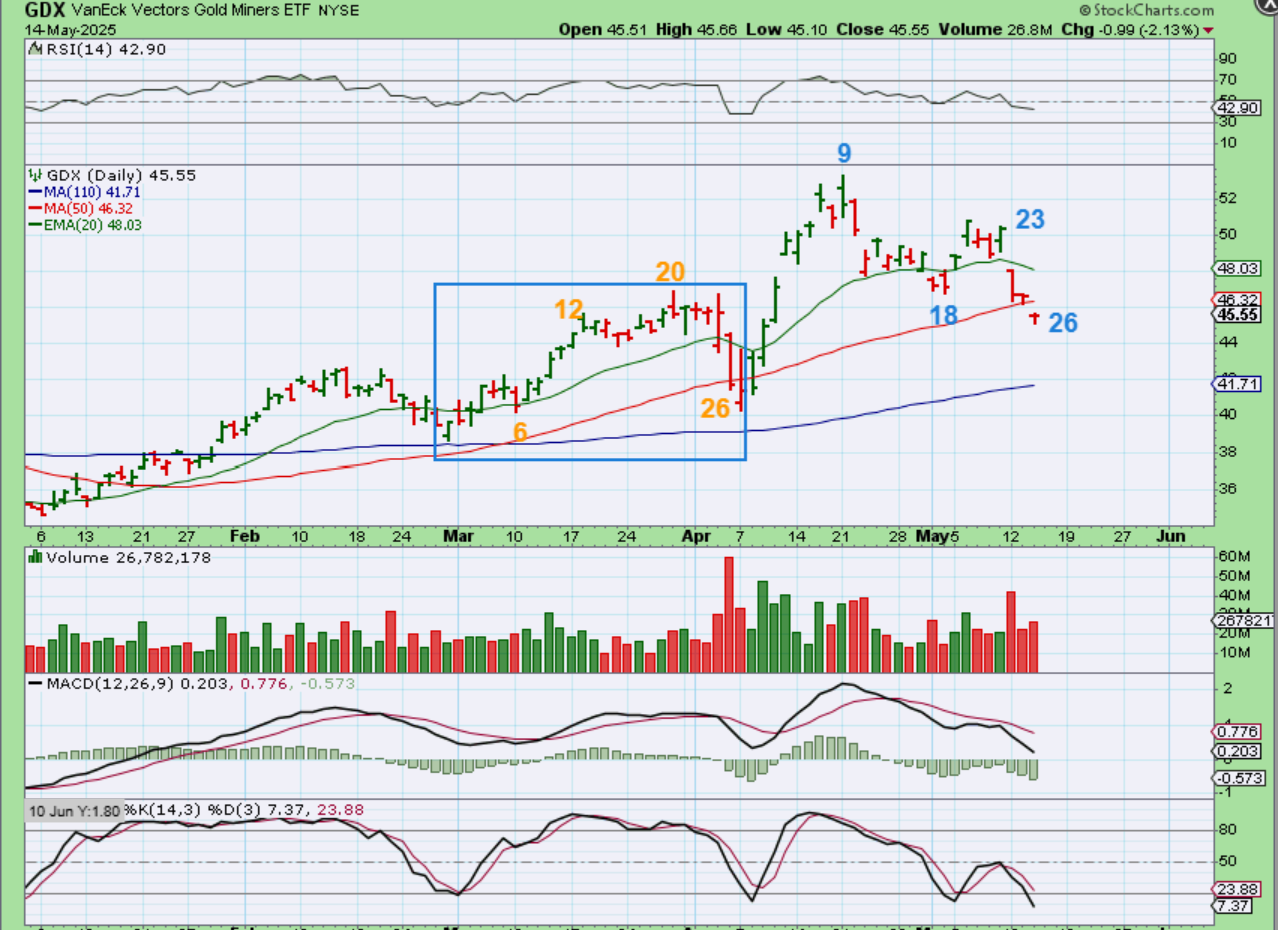
GDX also had a 26 day daily cycle in March as it lost the 50sma, and it now has 26 days here as it lost the 50sma. We could bounce from here.
.
So we do have some heavy data this morning and we have been in a solid bullish run higher with the General markets, so I would say that things could go either way today. We could see a normal pullback in this yellow consolidation zone, or we could push even higher on day 27.
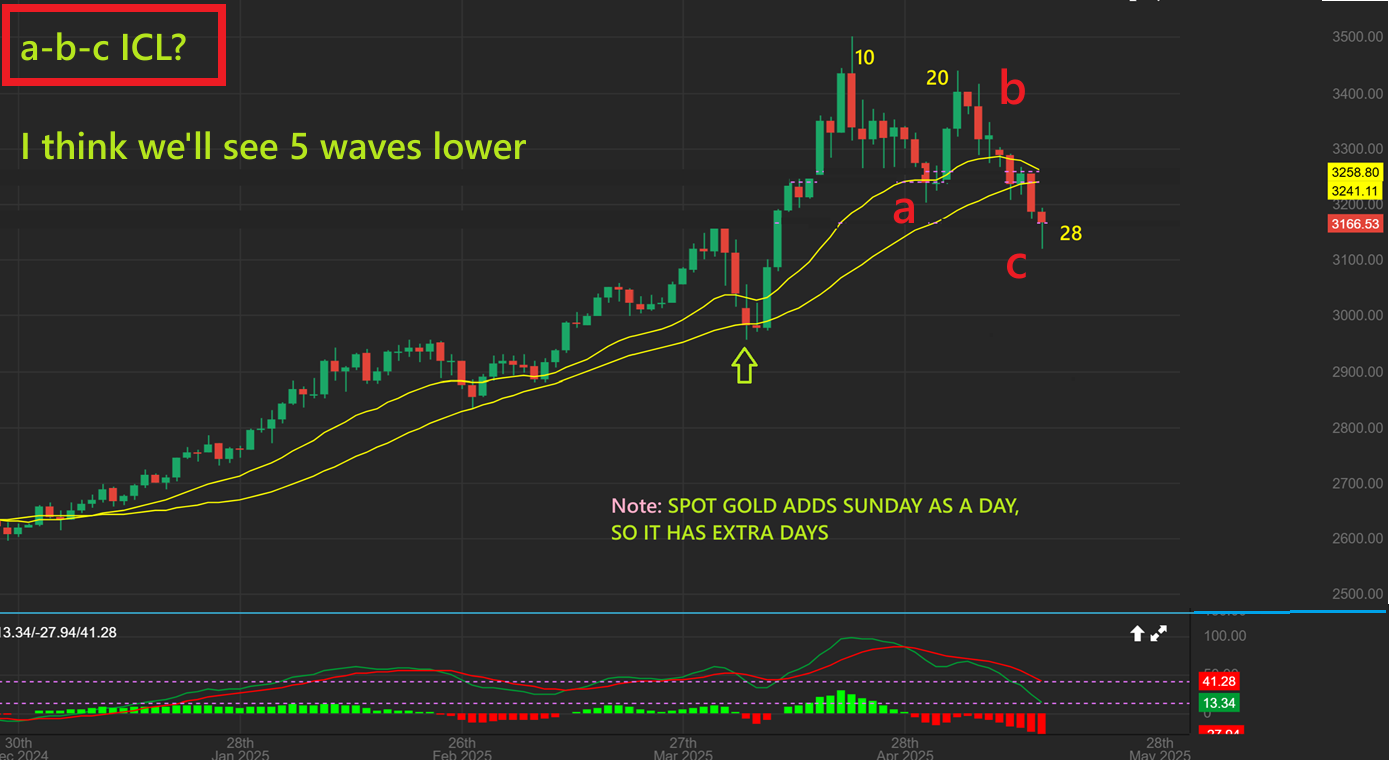
Gold and the Miners are in the timing for a dcl and a reversal formed overnight, so we can bounce here. I have already been asked if this is an ICL. Originally I was saying ICL in May, but that last daily cycle was strong out of the dcl, and usually a final daily cycle displays more weakness, so I am going to say that we have 1 more daily cycle that bounces L.T. and rolls over. IF YOU FEEL that we might see an a-b-c ICL here, you can always by the reversal and raise stops, since we wouldn’t know until the downtrend is broken. That said…
.
I still have to think that to change sentiment a bit more and give us a real ICL, this will peak and roll over as L.T., and that could possibly be as soon as late next week. That would give us 5 waves down, as seen here.
.
Sidenote: I do have some follow up appointments this morning and next week, so I will be leaving at 9 a.m. and will not be back to the trading screens and comments until after lunchtime today. Enjoy your Thursday trading!
.
~ALEX
.
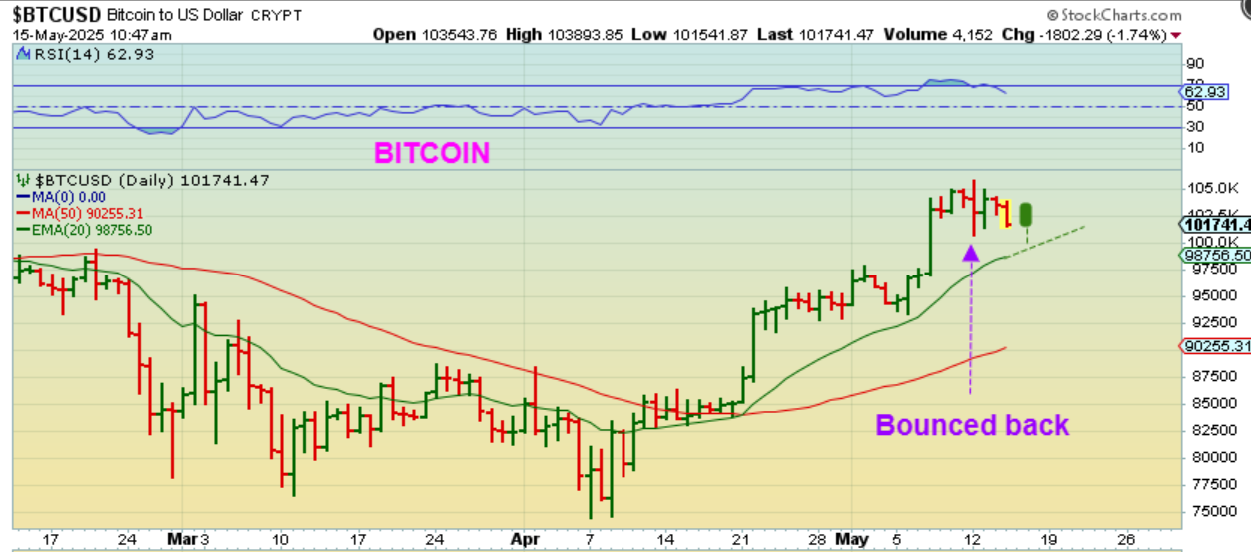
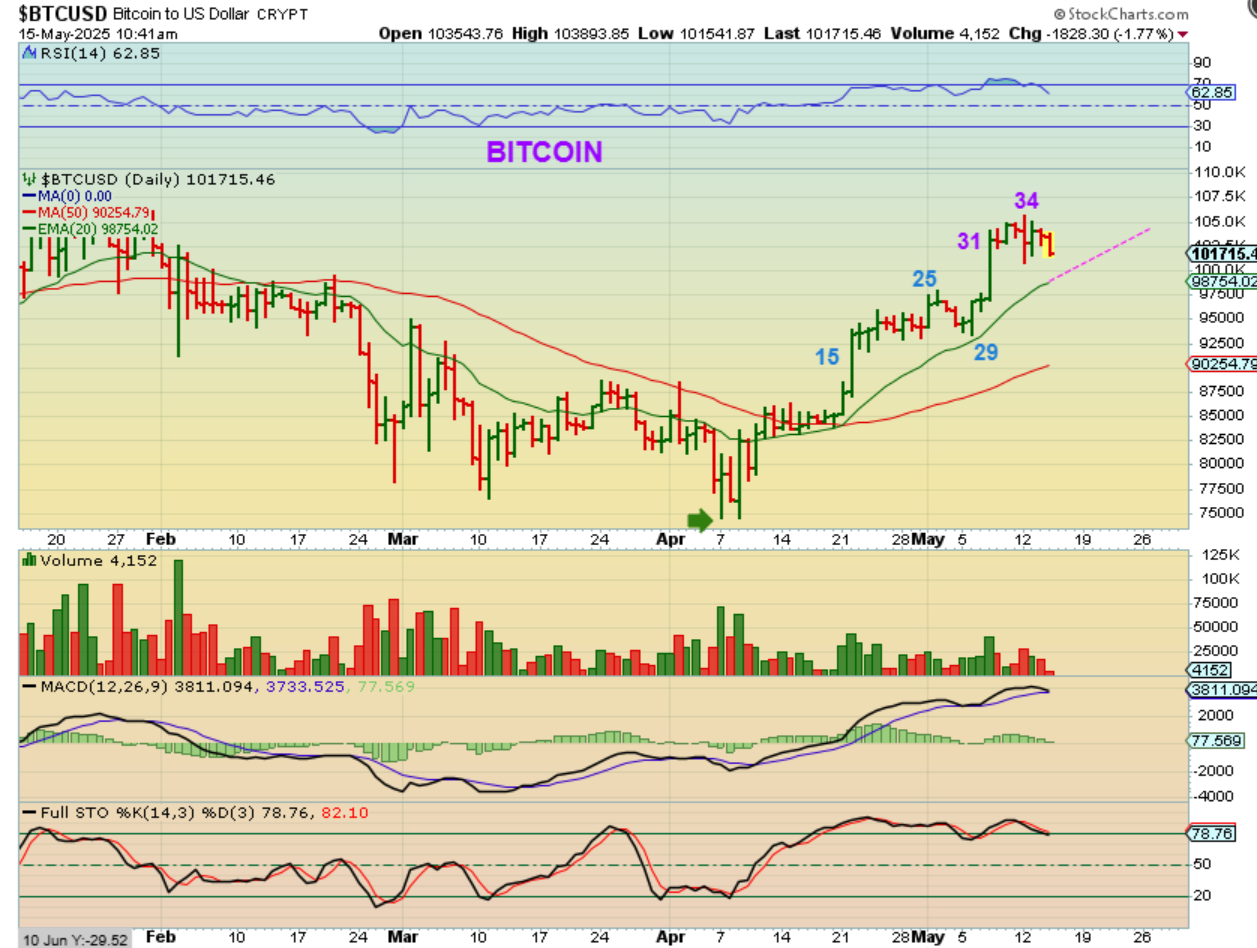
BITCOIN is doing as expected. I mentioned that it could churn sideways and eventually dip to reach the 20ema. Now lets hope that it stops there and reverses higher so we can look for a reversal in that area to buy.
.
Note: Bitcoin dropped 3 days ago and bounced back, so we may even see that later today or tomorrow, which gives us that sideways chop. The unfortunate thing about this set up is that it may start to really bounce higher over the weekend, and it is hard to trust Crypto stocks going into the weekend. That would mean that for some, they could gap up open on Monday and we may have chosen to be positioned lightly. 🙁