Post Fed Action
It was a Fed Wednesday and we ALWAYS get a very choppy period around 2p.m. to 4 p.m., so I mentioned that yesterday, and hopefully we get the true follow through direction today. We HAVE seen times when the morning direction doesn’t always follow through and match the afternoon, but again, this is all chop. We should take a look at the daily charts for the final ‘looks bullish’ or ‘looks bearish’ view.
.
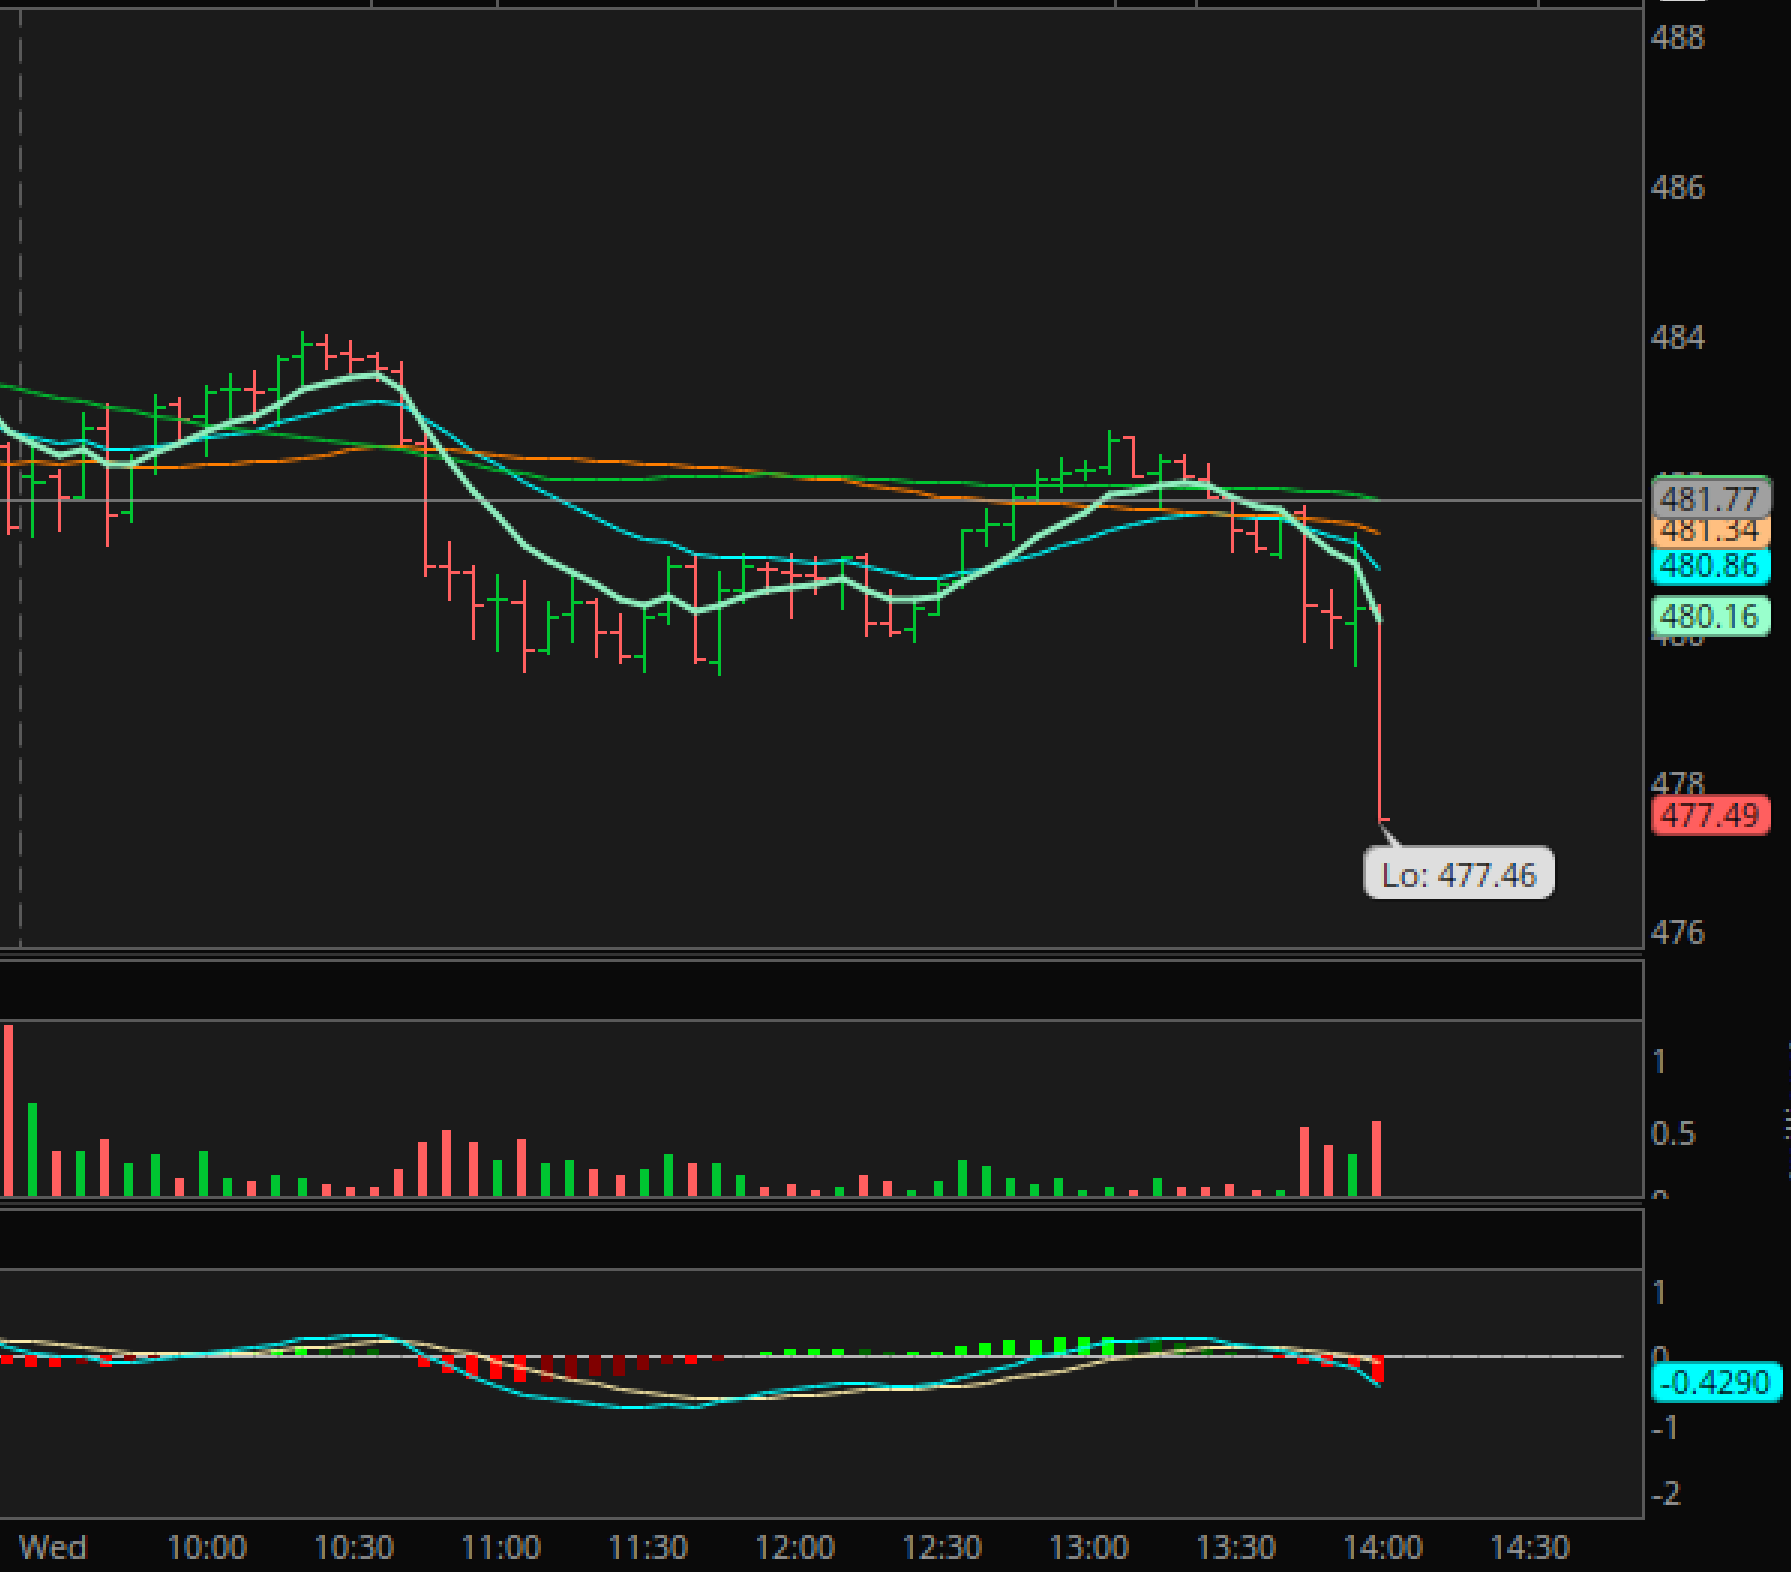
QQQ – The Fed decision of ‘no rate cut’ came out at 2p.m. and that was actually expected, but of course the markets decided to crash. I captured this for those that work all day to be able to see what things look like around a Fed Decision. WHAT HAPPENED NEXT?
.
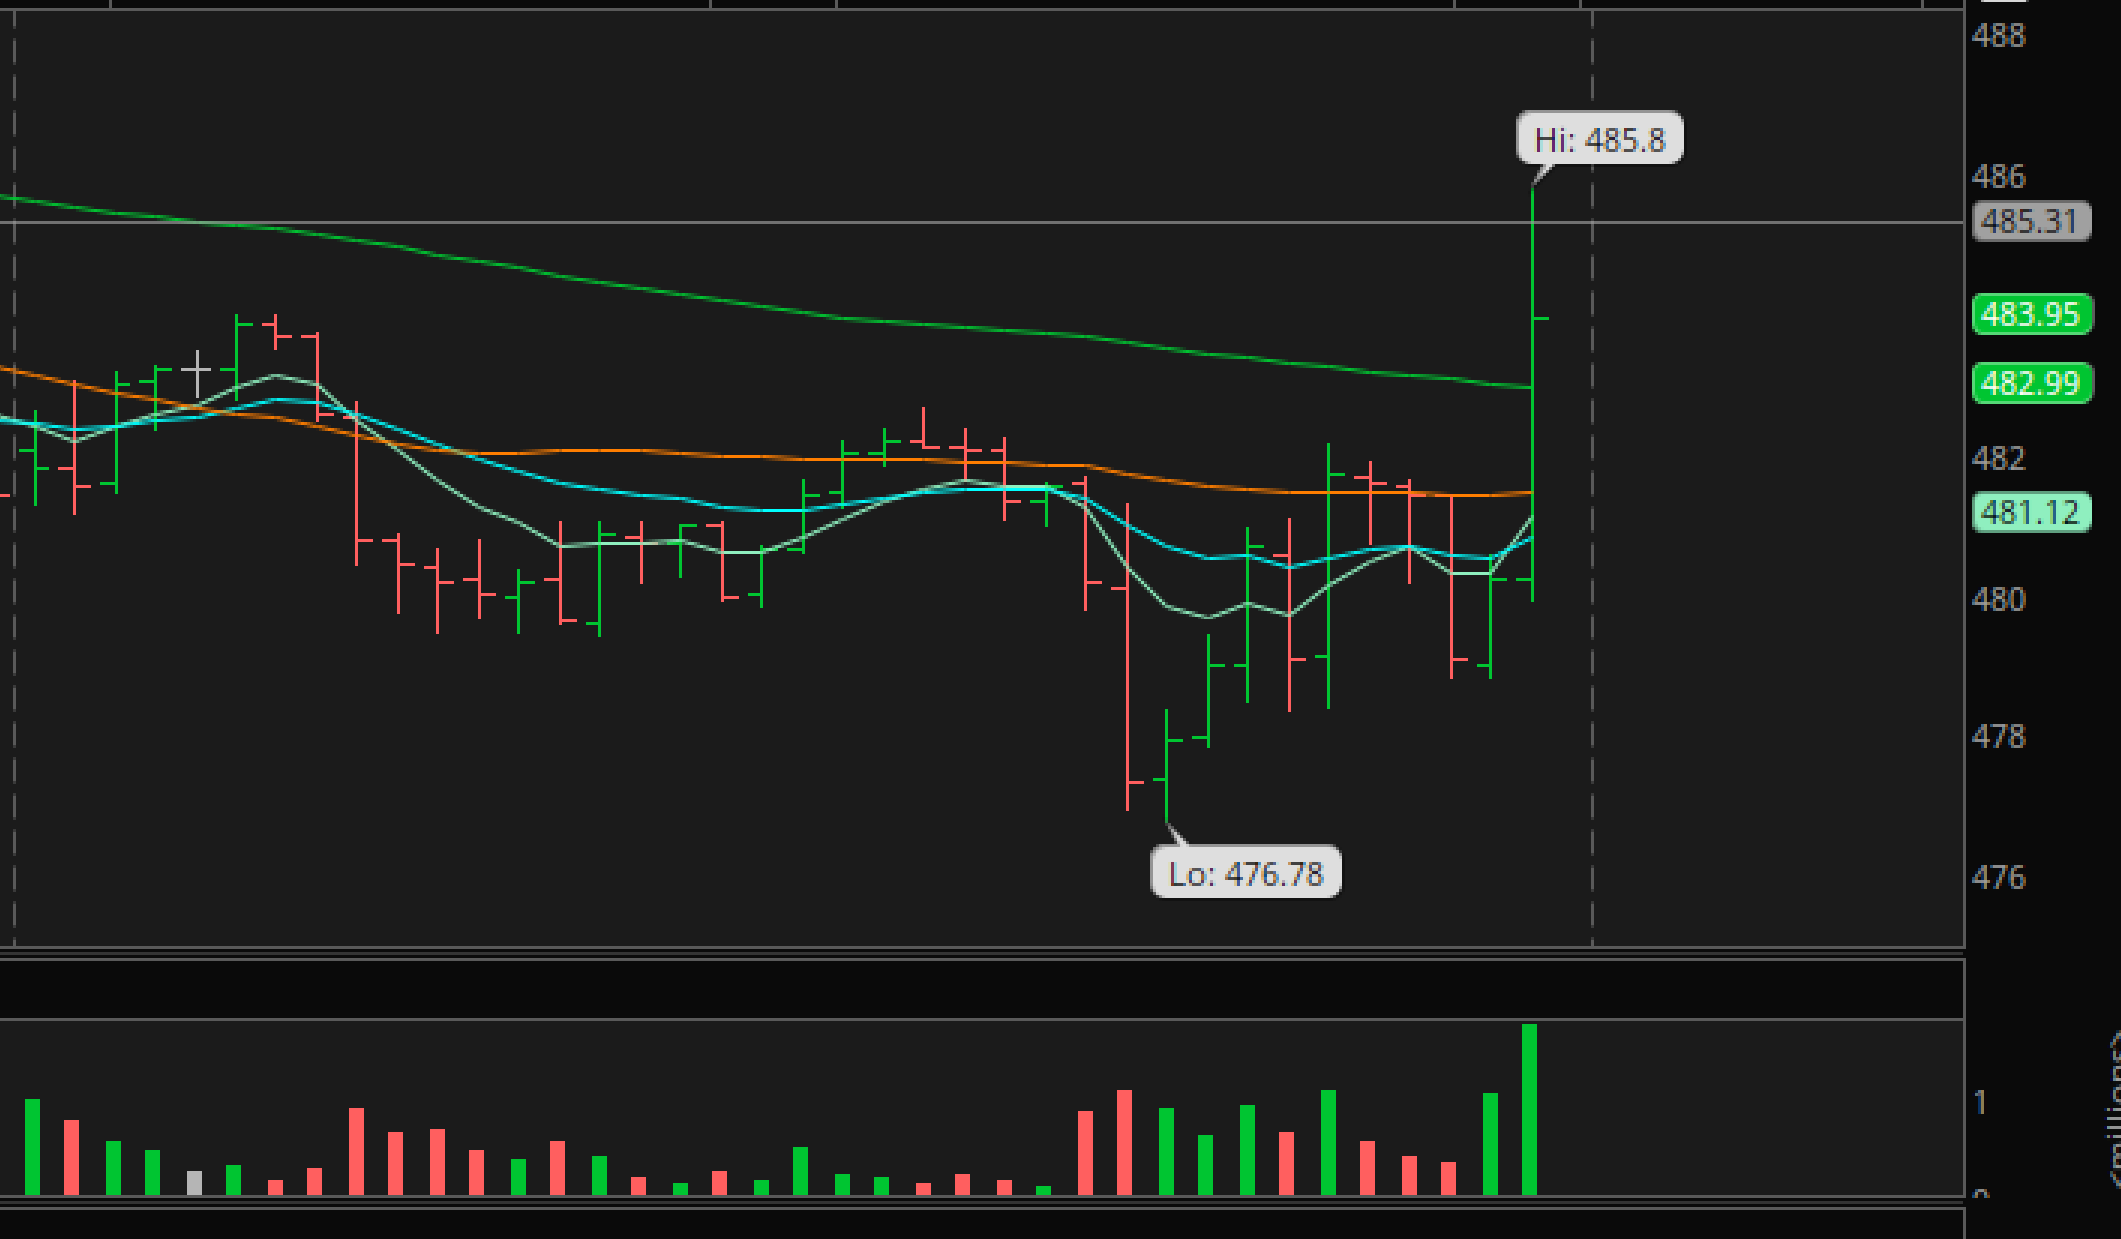
QQQ – Next the markets climbed back up, chopped, dropped, popped, and then surged higher. You can see that IF YOU SHORTED THAT FIRST DROP, you’d get hurt. I try to show my readers that the initial reaction can be ‘knee jerk’ false moves for that very reason. QQQ closed at $483 (right here).
.
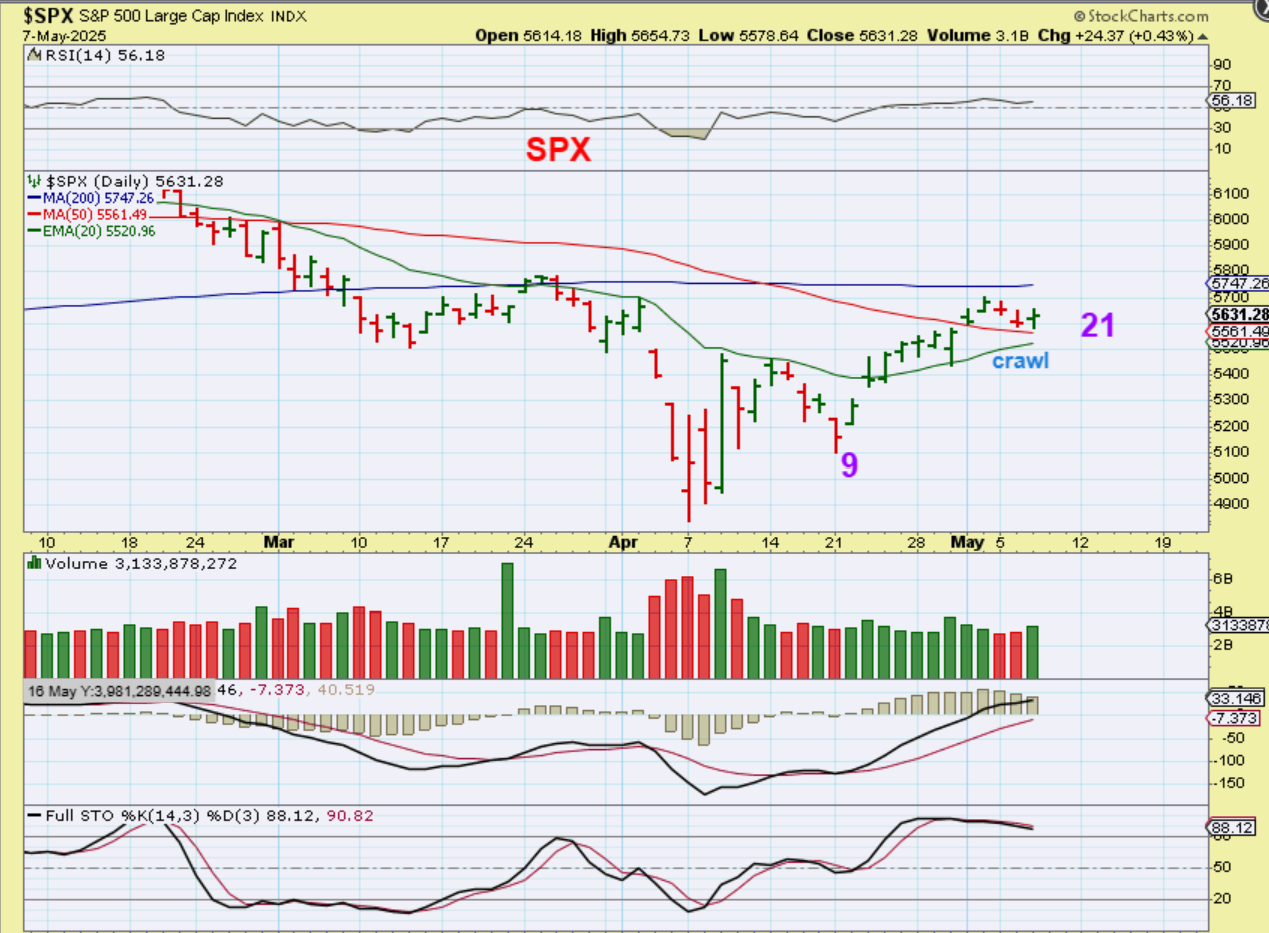
SPX – The SPX did that same drop and surge, but on a daily chart you just don’t see it. Instead, just as expected, we have ‘ crawled’ along the 50sma (or under the 200sma) and it looks like totally normal price action for day 21. We have a day 18 ‘peak’, so a push above that makes this lean toward a R.T. daily out of an ICL, which I have been calling this anyway. BUY & HOLD Stops have not been hit and can be raised to $5520.
.
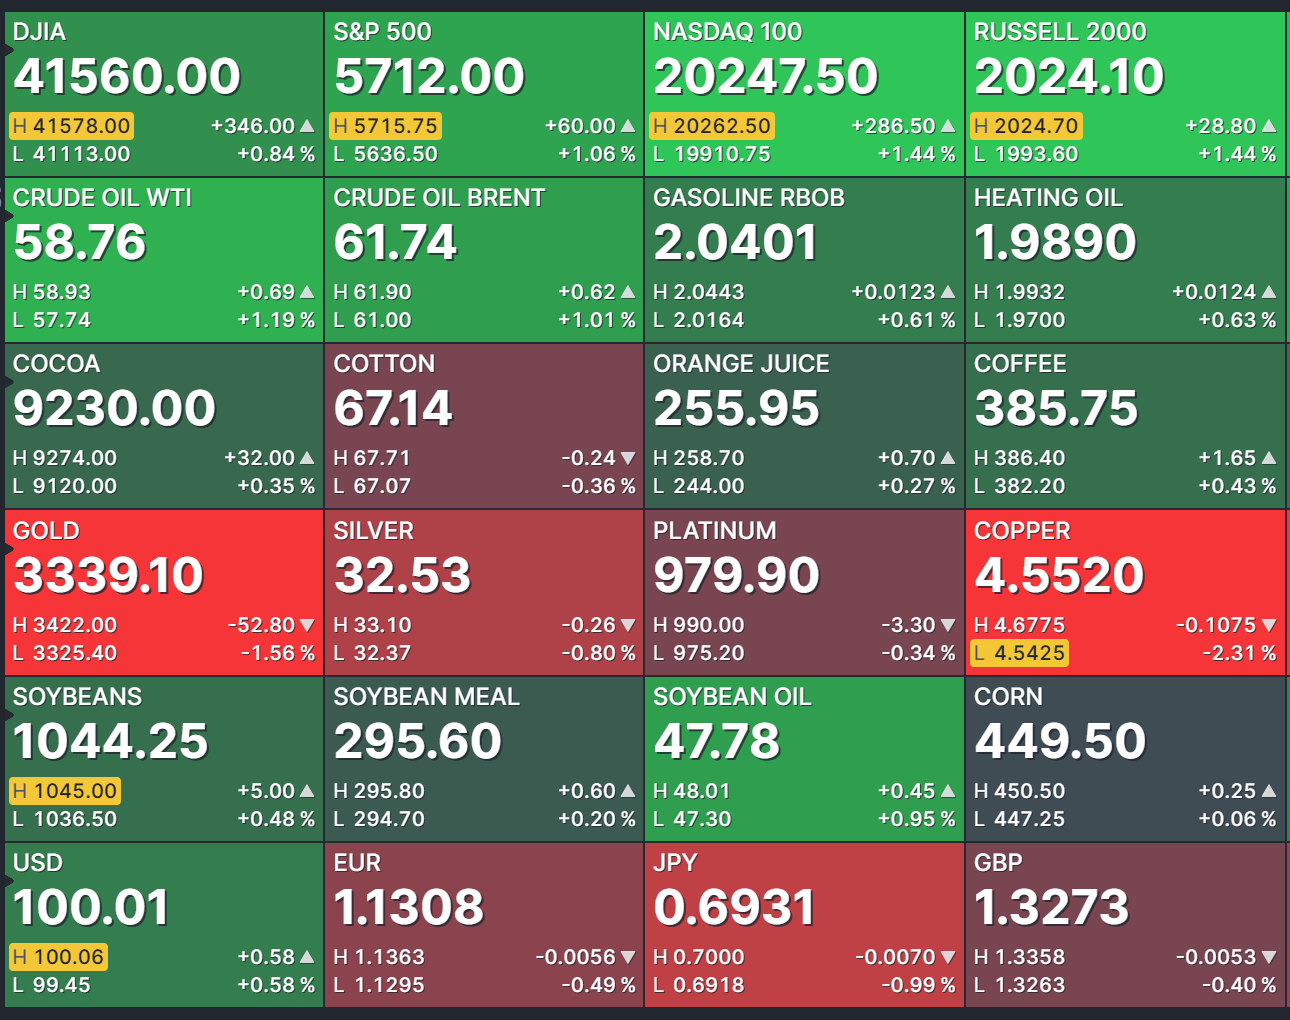
FUTURES MAP – This morning the futures are up. CAN THAT CHANGE? Of course, but for now it looks like the Fed chatter was acceptable. TODAY IS JOBLESS CLAIMS AND A PRODUCTIVITY REPORT.
.
TODAY IS JOBLESS CLAIMS AND A PRODUCTIVITY REPORT. My take on that is that if it looks like the economy is weakening, ‘they’ will view it bullishly as a rate cut is coming. If the economy is strong, it will look bullish as though tariffs aren’t hurting it yet. In other words, ‘Climb that wall of worry’.
.
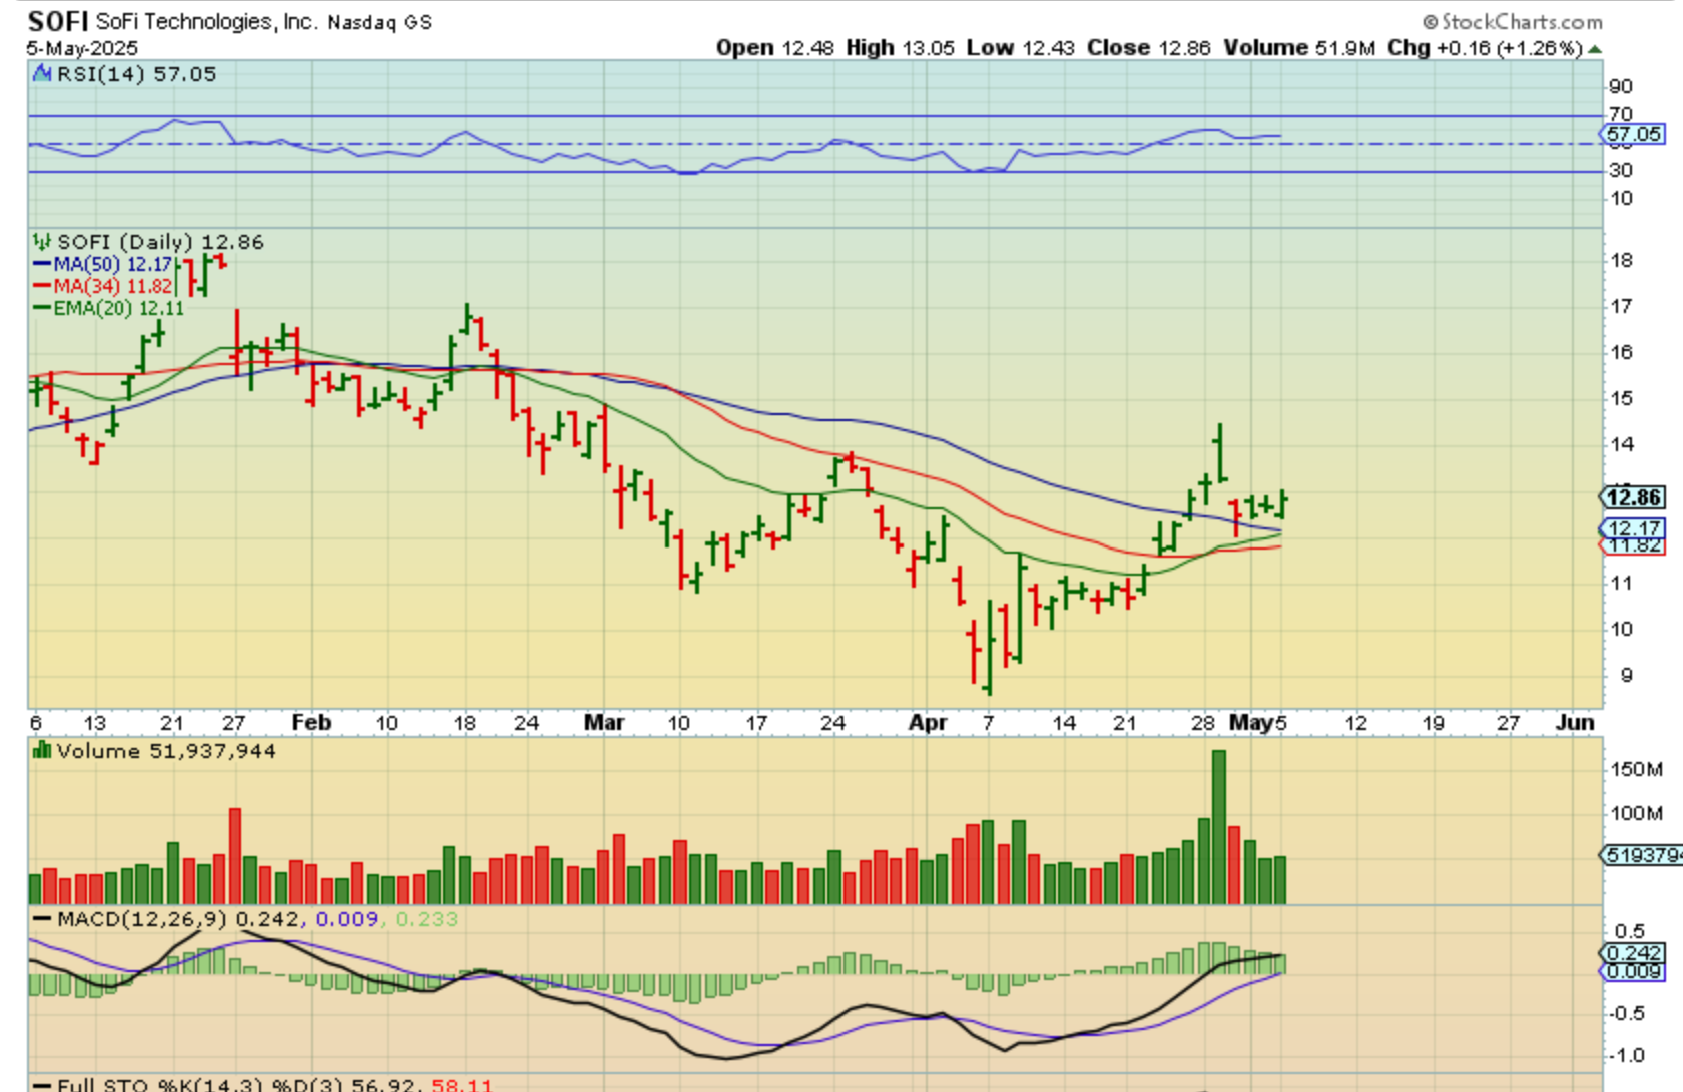
I had mentioned LMND and XMTR as bullish companies that I like form past runs and current set ups. I also mentioned SOUN & BBAI yesterday. I was asked for 2 more, so I would mention SOFI and POET, the charts are almost identical, so I’ll show you SOFI.
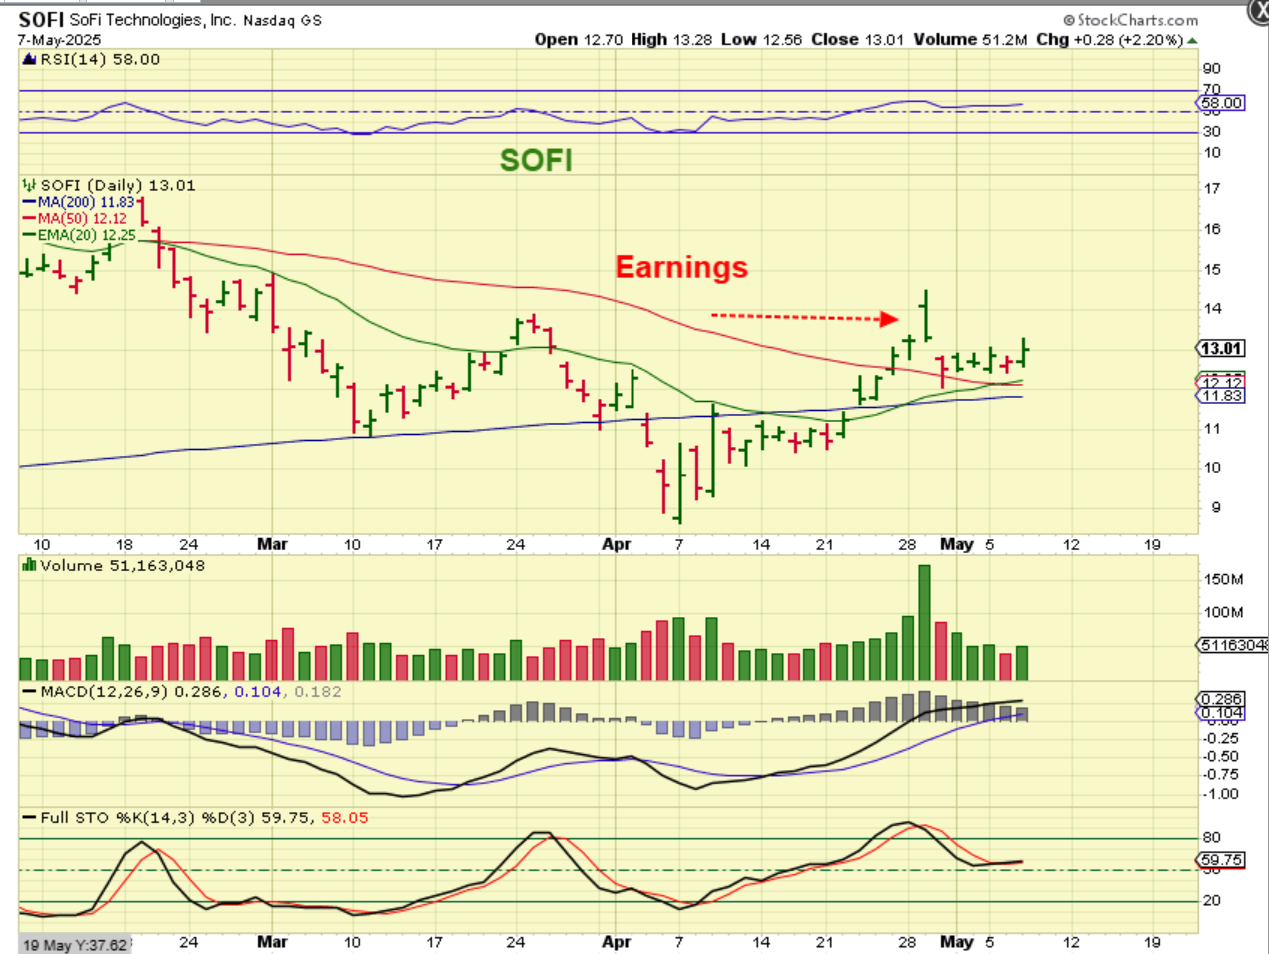
SOFI was actually mentioned 2 days ago here, and then 2nd chart is after the Fed. It is bullishly crawling along the moving averages. SOFI ran from $6 to $18.50 last summer into fall.
.
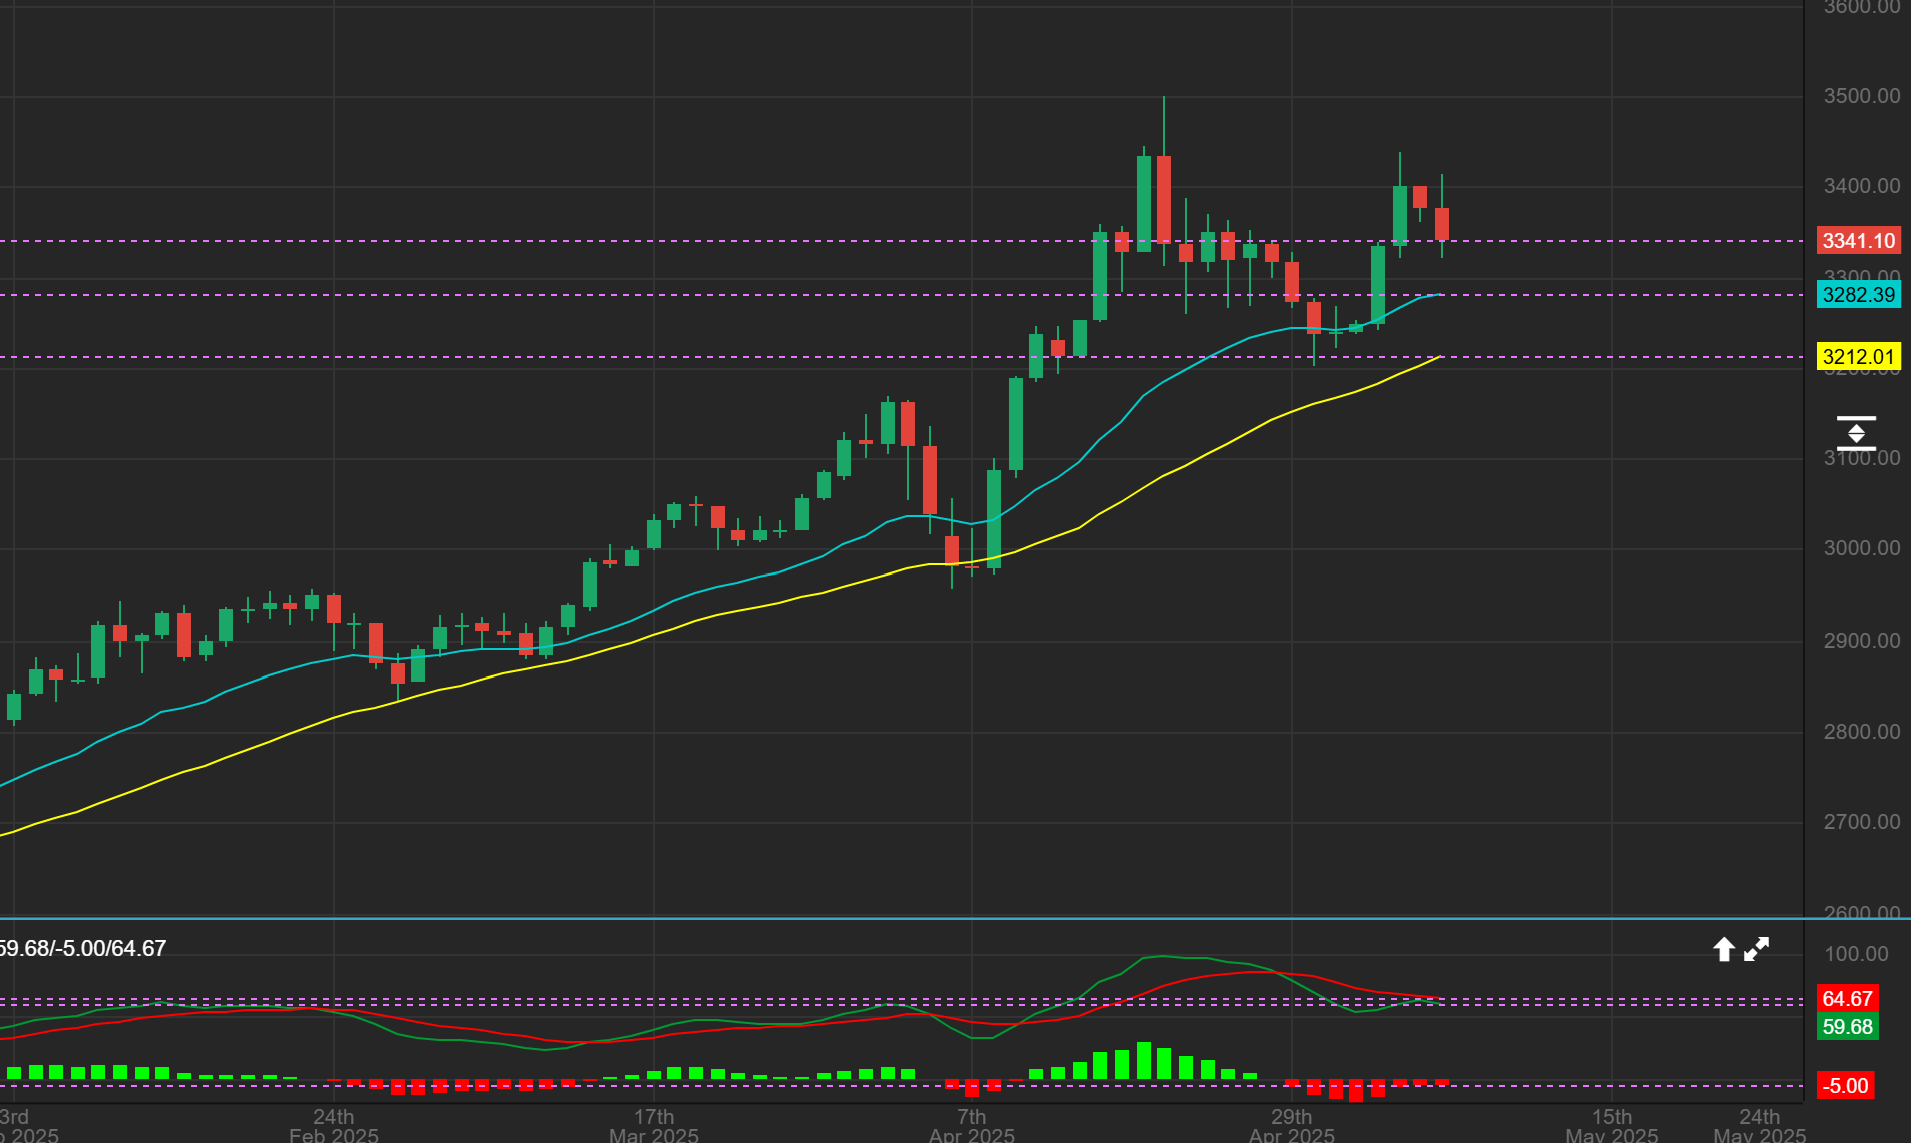
GOLD is dropping this morning, this is a 6 a.m. chart.
1. So far we have a day 9 peak (it shows 10 because it added a Sunday).
2. If Gold continues to drop, it will remain L.T. and
3. We will have 2 of those weekly reversal charts by Fridays close. (I usually remove those purples by covering them with black lines. I hate a cluttered chart, sorry) 🙂 So Gold can drop or chop further, but it has been strong.
.
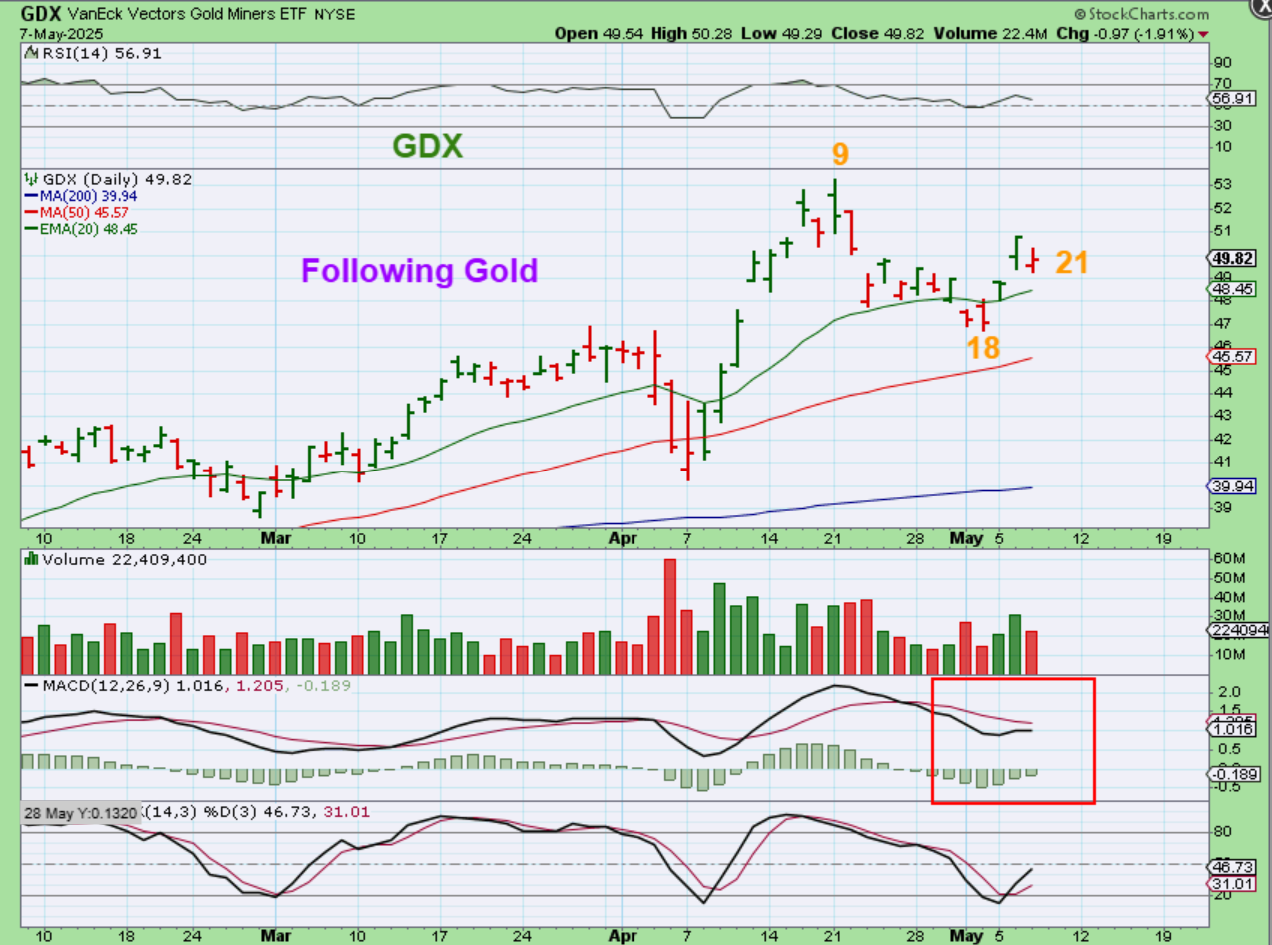
GDX seems to be following Gold more these days. This would be L.T. at this point.
.
Note: CDE, PAAS, and BTG survived earnings yesterday. CDE & PAAS actually Popped higher. It’s really good to see some earnings releases with positive reaction for a change!
.
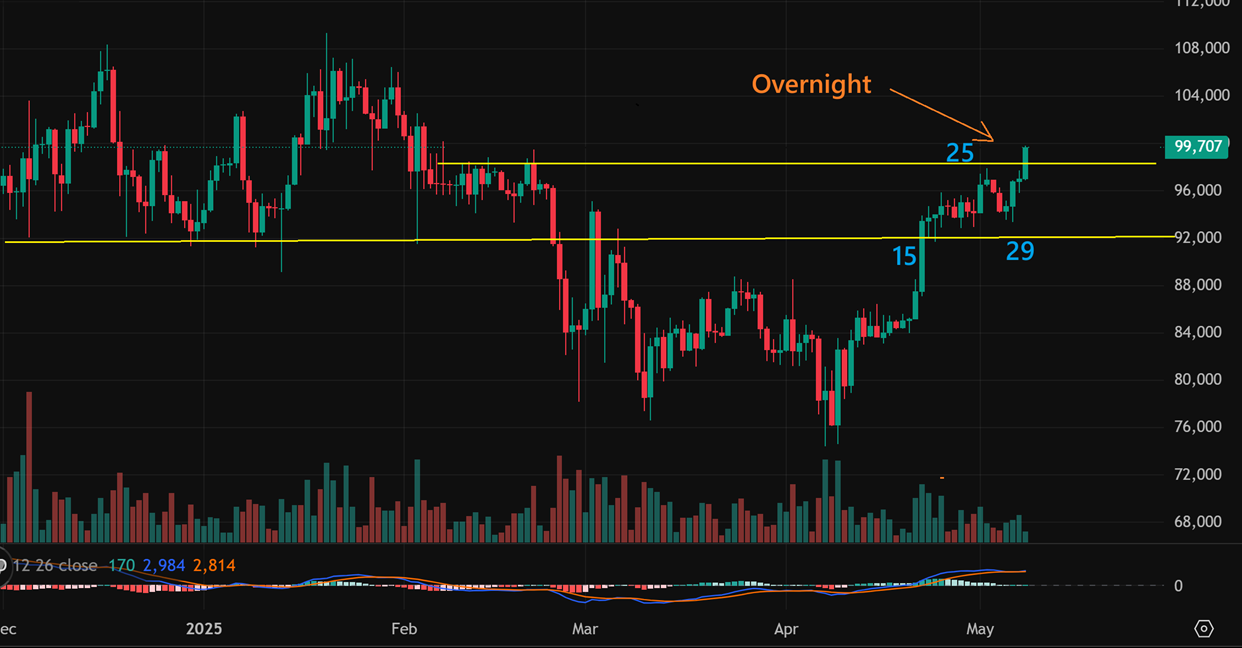
It seems that things are pretty straight forward with the markets and Fed decision (possible cut in June, depending on the data). We’ll see if Thursday can settle down, pick a direction, and follow through. That direction SHOULD BE HIGHER for the General Markets & Bitcoin, which actually ‘Popped’ overnight (see below).
Enjoy your Thursday trading.
.
~ALEX
.
YESTERDAY I WROTE:
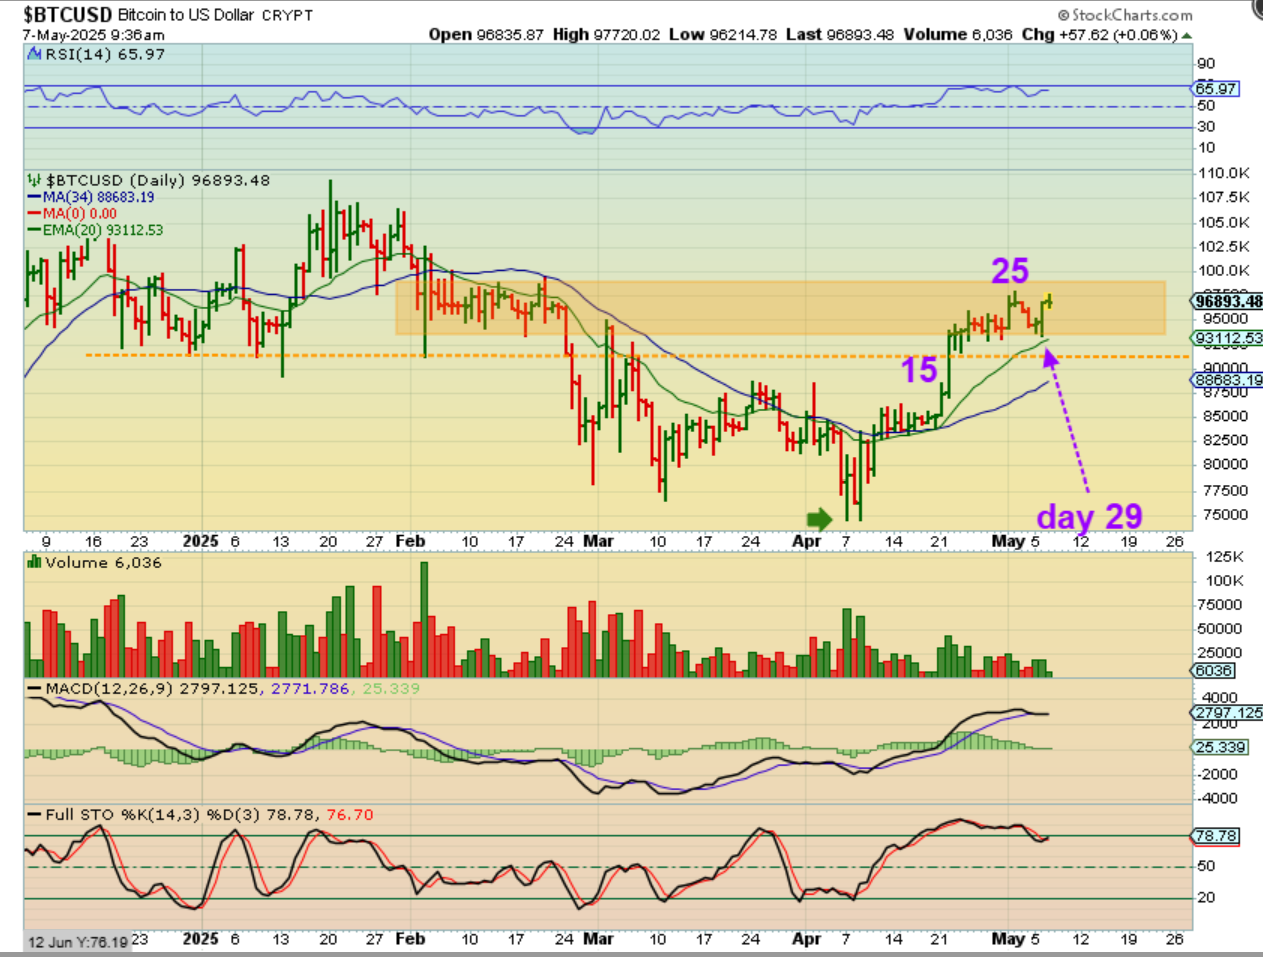
Also perking up nicely is BITCOIN:
We had a peak on day 25 (R.T.) and I looked for a dip around day 30. We saw a new low at day 29 yesterday and it immediately flipped higher. That may be the day 30ish low or pause. Crypto miners are starting to benefit.
.
Overnight Bitcoin ripped higher. We had our day 29 dip and now this CAN move another 30 days higher. It may be choppy or it may accelerate, but the chart is a beauty.
.
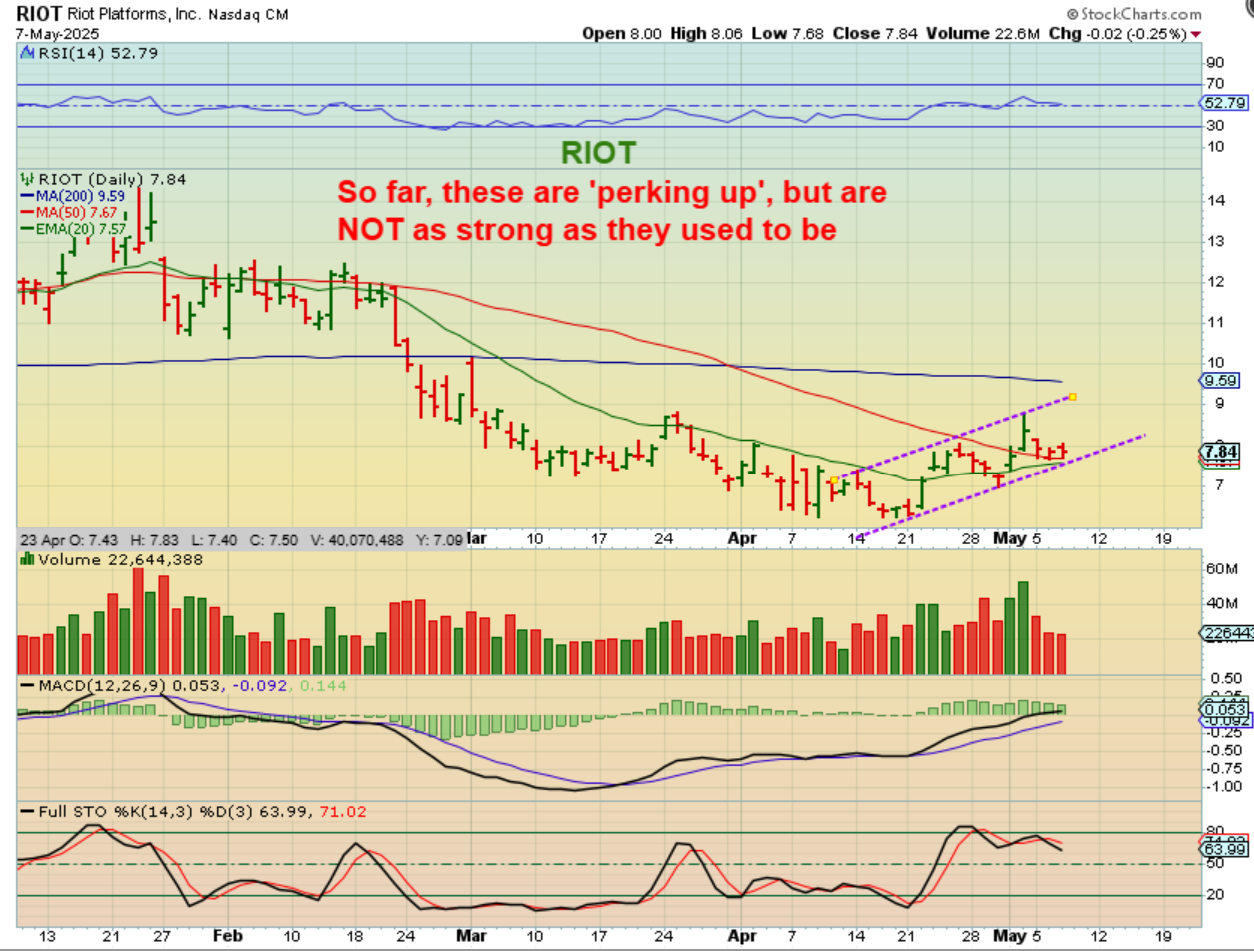
Many of the Miners are looking ‘o.k.’, but they aren’t ripping higher like they used to . We’ll see if todays breakout in Bitcoin gives these a push. HUT RELEASED EARNINGS…