May 25 Weekend Review – Rest Up!
I think that trading / investing has been great as we moved out of the ICL in the General Markets, and The Precious Metals & Crypto rallied to new all-time highs. We will see pauses and times of rest along the way, and we have that in certain areas now, but rallies should unfold again. So with that in mind, REST UP and enjoy your weekend (long weekend in the U.S.) because I think that we are going to see some great trading ahead in 2025 too. Let’s get to the charts! 🙂
.
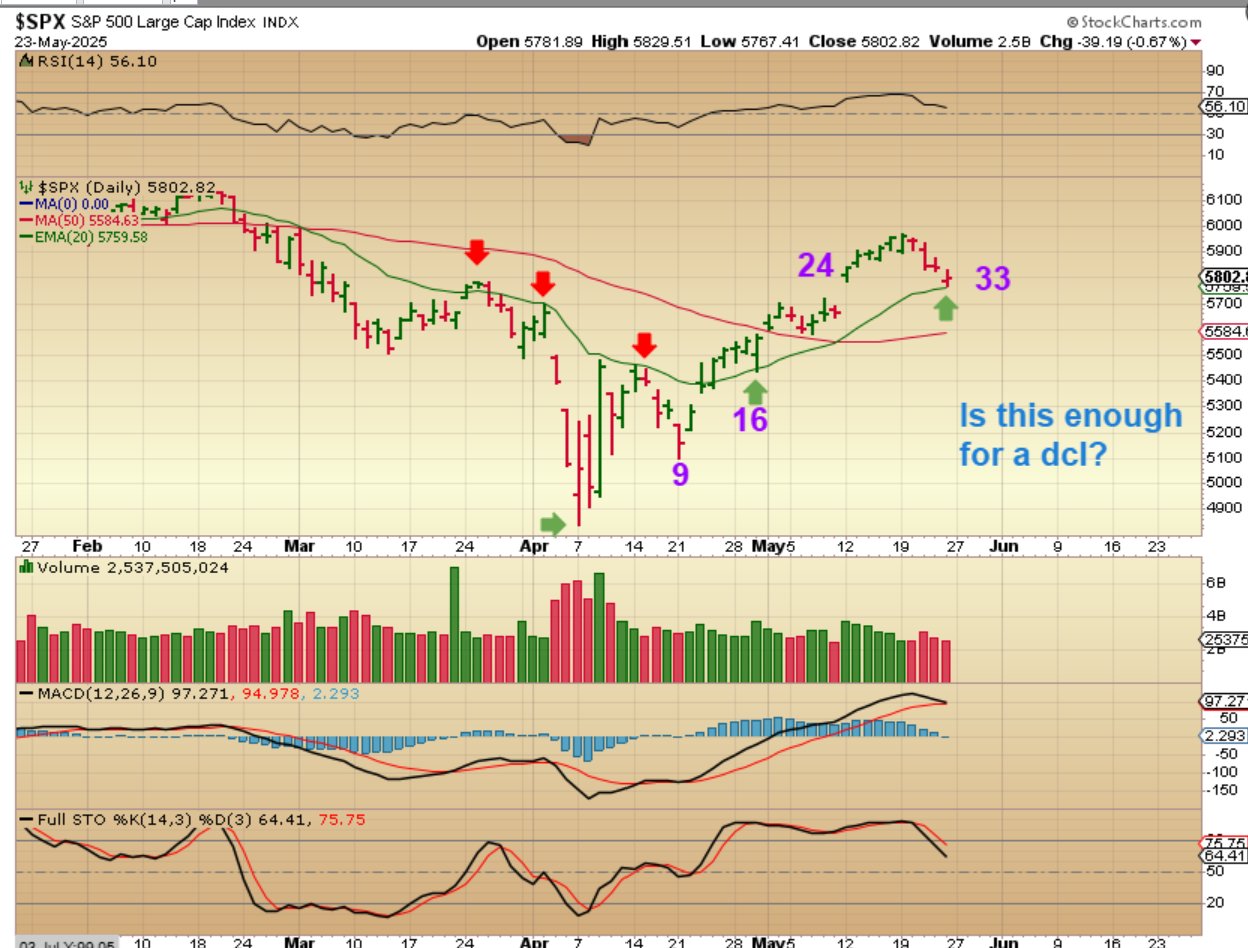
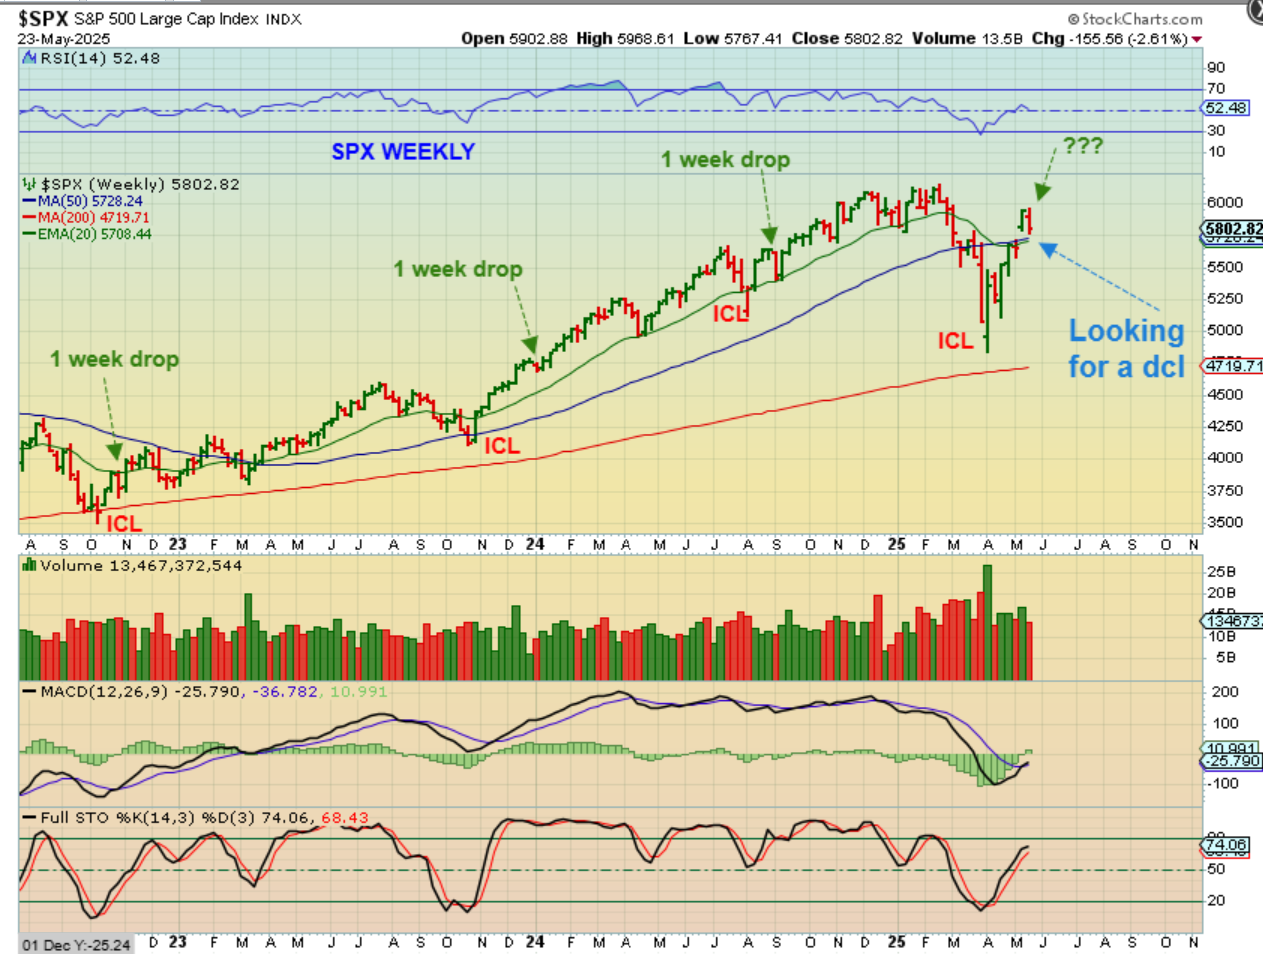
SPX DCL? – We are within the timing for a dcl, and right now we have a mild 4 day dip lower to the 20 ema. That 20 ema was resistance in March, so it may act as support now, but we won’t know for sure if the dcl forms here until we get a good bounce. I will point out something that seems important to me though…
.
Some of the stocks that I follow are hardly affected by this dip.
.
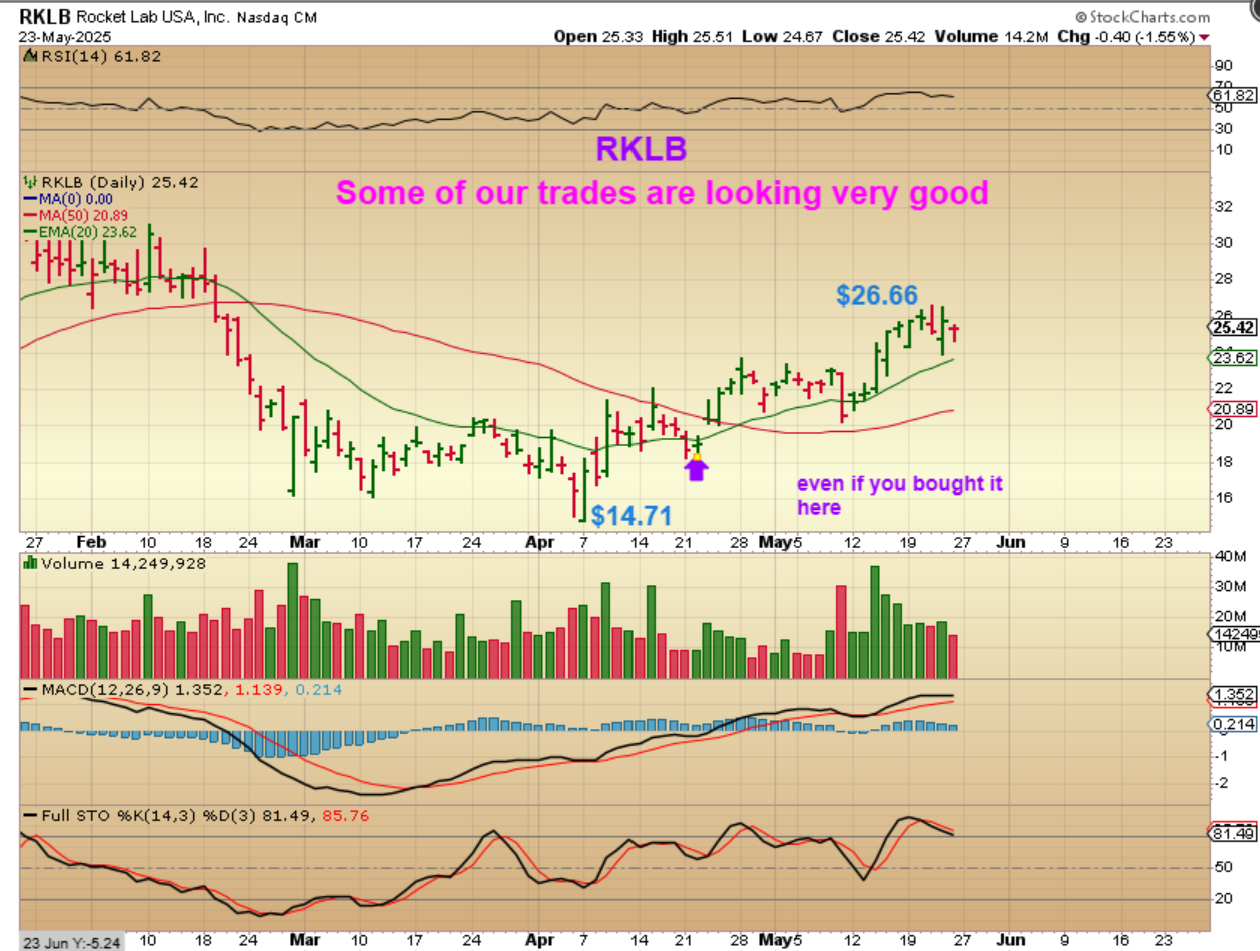
Example: You can see that RKLB is still actually climbing, not dipping lower. 2 days ago RKLB dropped and reversed, so the dip is hardly showing up in some bullish stocks and we may just see a mild dip when all is said and done.
.
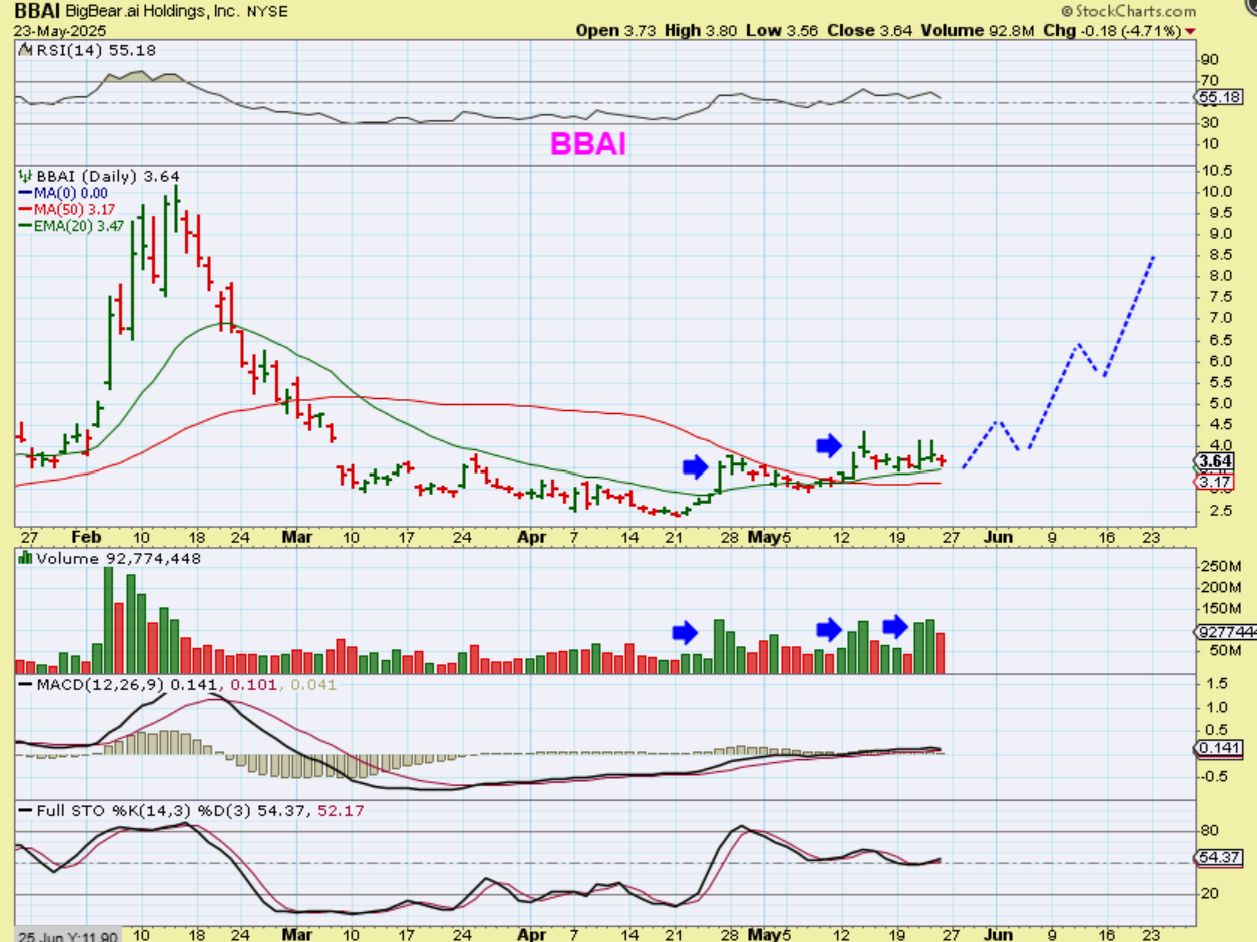
Another example is BBAI – This stock is not really ‘dropping lower’ like the SPX & NASDAQ. It is at support and has some nice volume pops with it.
.
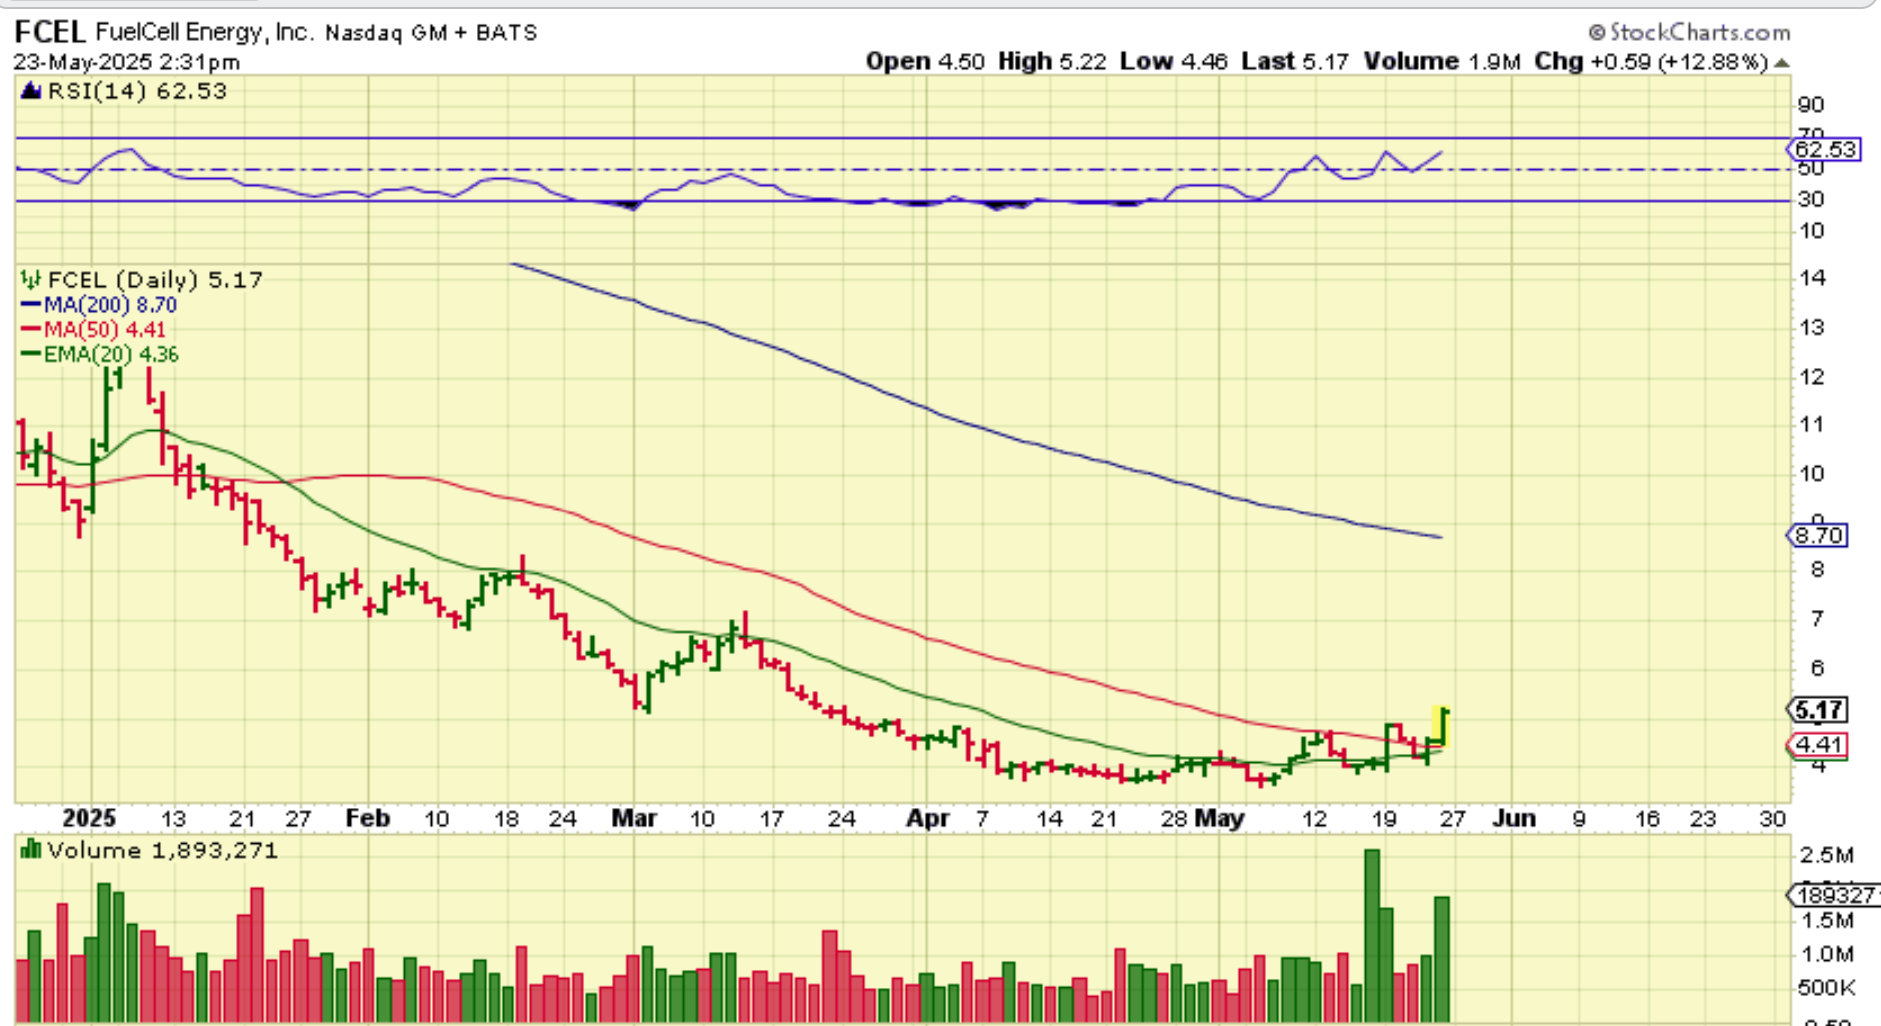
FCEL is even better, since it is popping higher above the 50sma with volume, ignoring any selling in the general markets.
.
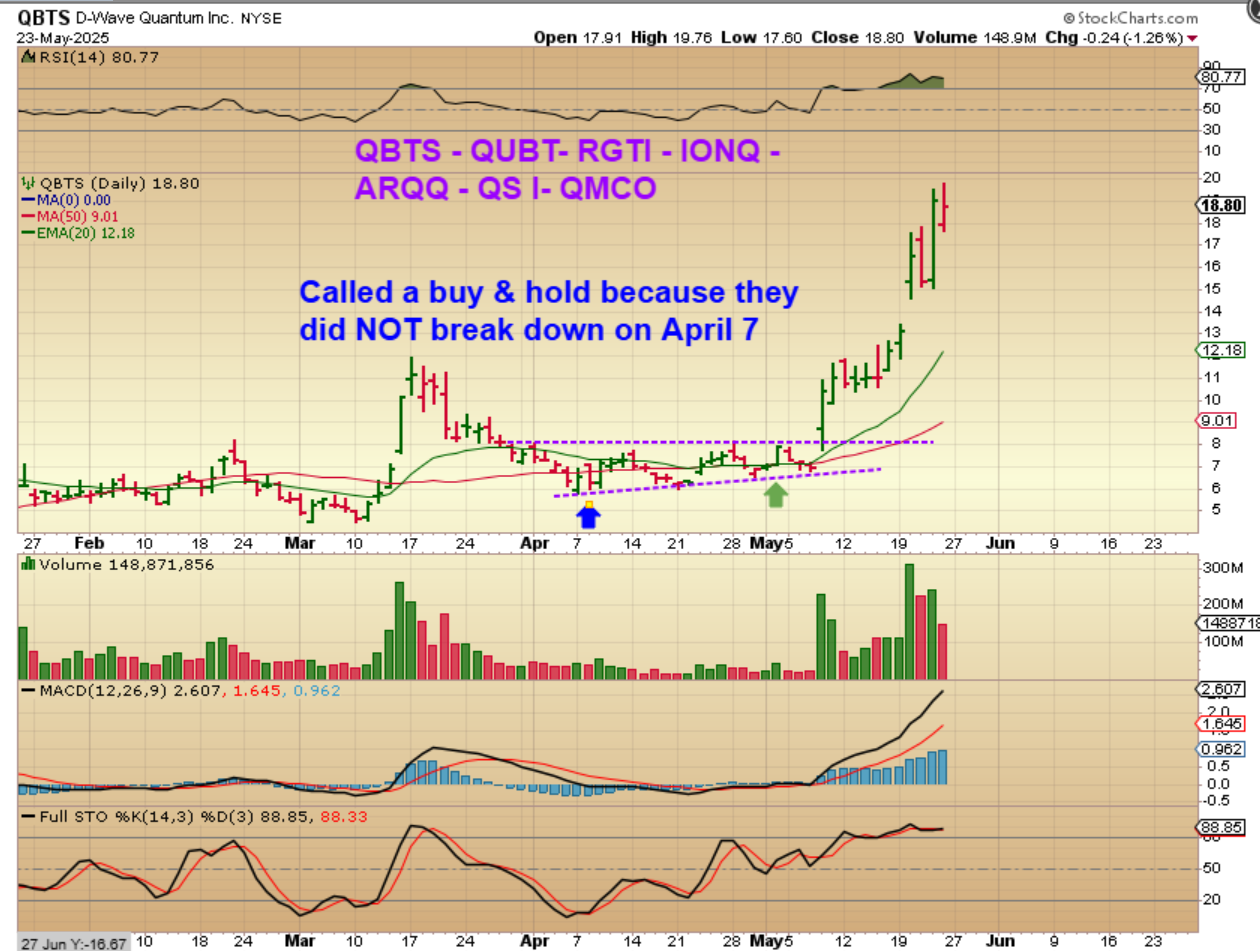
And of course we have the QUANTUM STOCKS: They are flying in the face of the sell off. These were pointed out as ‘Buy & Hold’ in a base, because they actually stopped selling off when the markets crashed deeply into an April low. These made higher lows and formed bases.
QBTS has tripled for example, and the others are running too (QMCO is a bit of a lagger so far).
.
SPX WEEKLY – So again, we might be at a dcl, the weekly is also just about tagging support but selling has been rather mild. You can wait for the dcl to form with a swing low, but I pointed out the stocks above to show that adding anywhere around here may work for some stocks that are setup bullishly. BBAI, RR, RKLB, SOFI, PLTR, NVDA, NFLX & TSLA are all worth taking a look at.
.
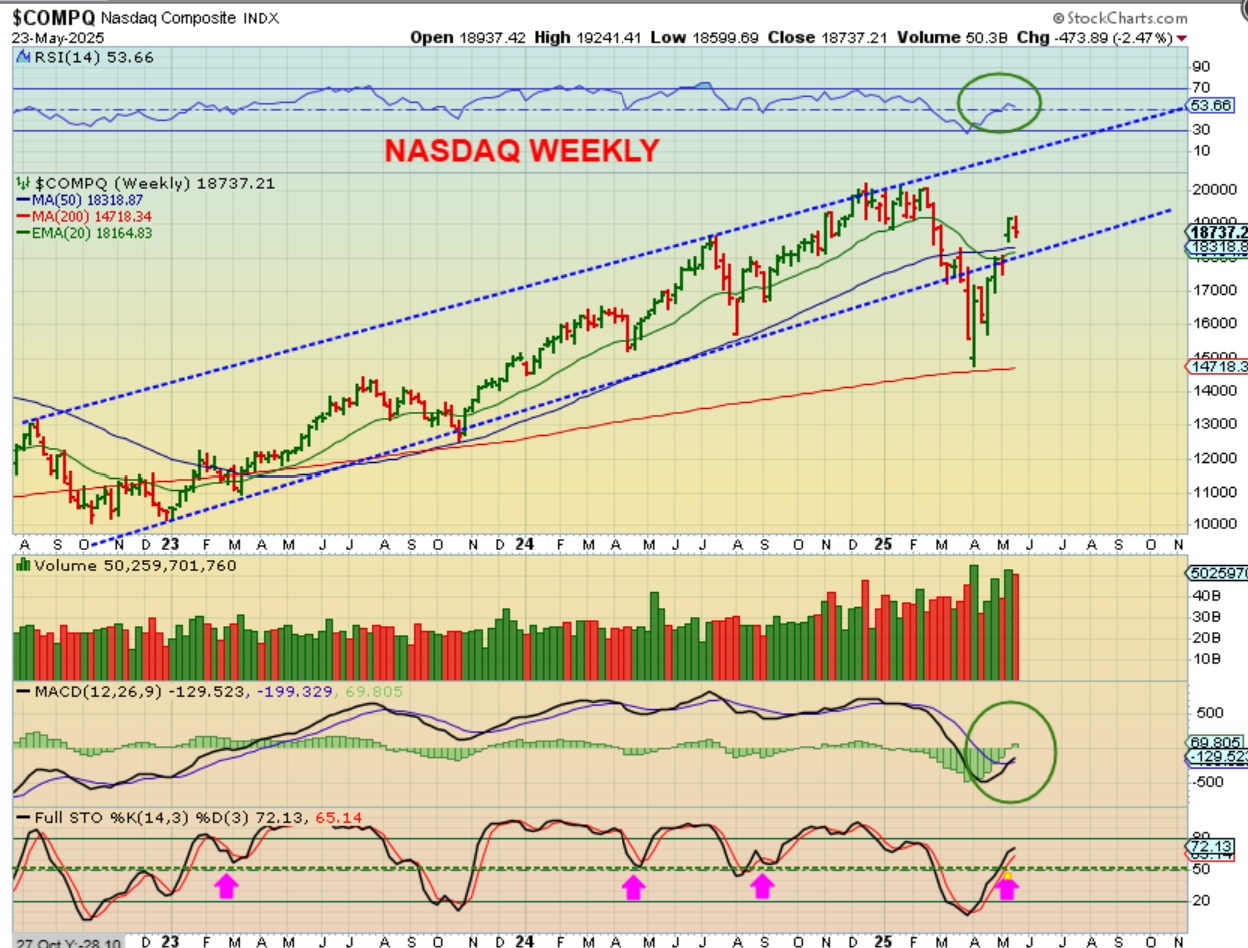
THE NASDAQ WEEKLY dropped last week and is also above support. A drop lower to support is not a deep drop at this point and we seem to have recovered this upward sloping channel. If you take a look at NFLX and TSLA – they are hardly dropping at all. They have moved sideways.
.
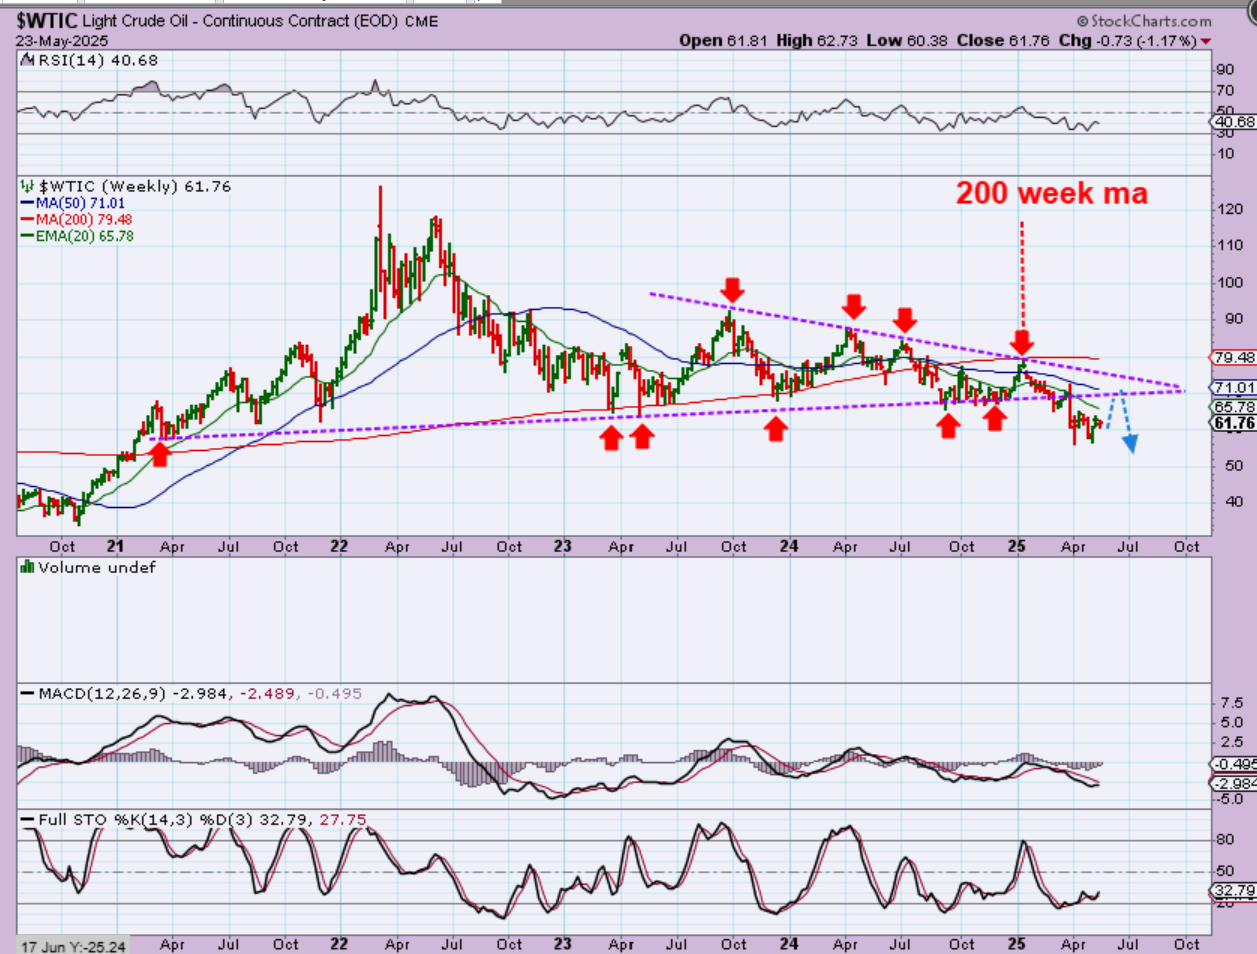
WTIC – Oil broke down, formed a dcl that is also most likely an ICL with a a-b-c down. The push higher has been weak as it continues to just chop sideways. I have been saying that I think Oil will remain week, possibly doing a back test later (2nd daily cycle?) and then resuming the move lower as drawn below.
.
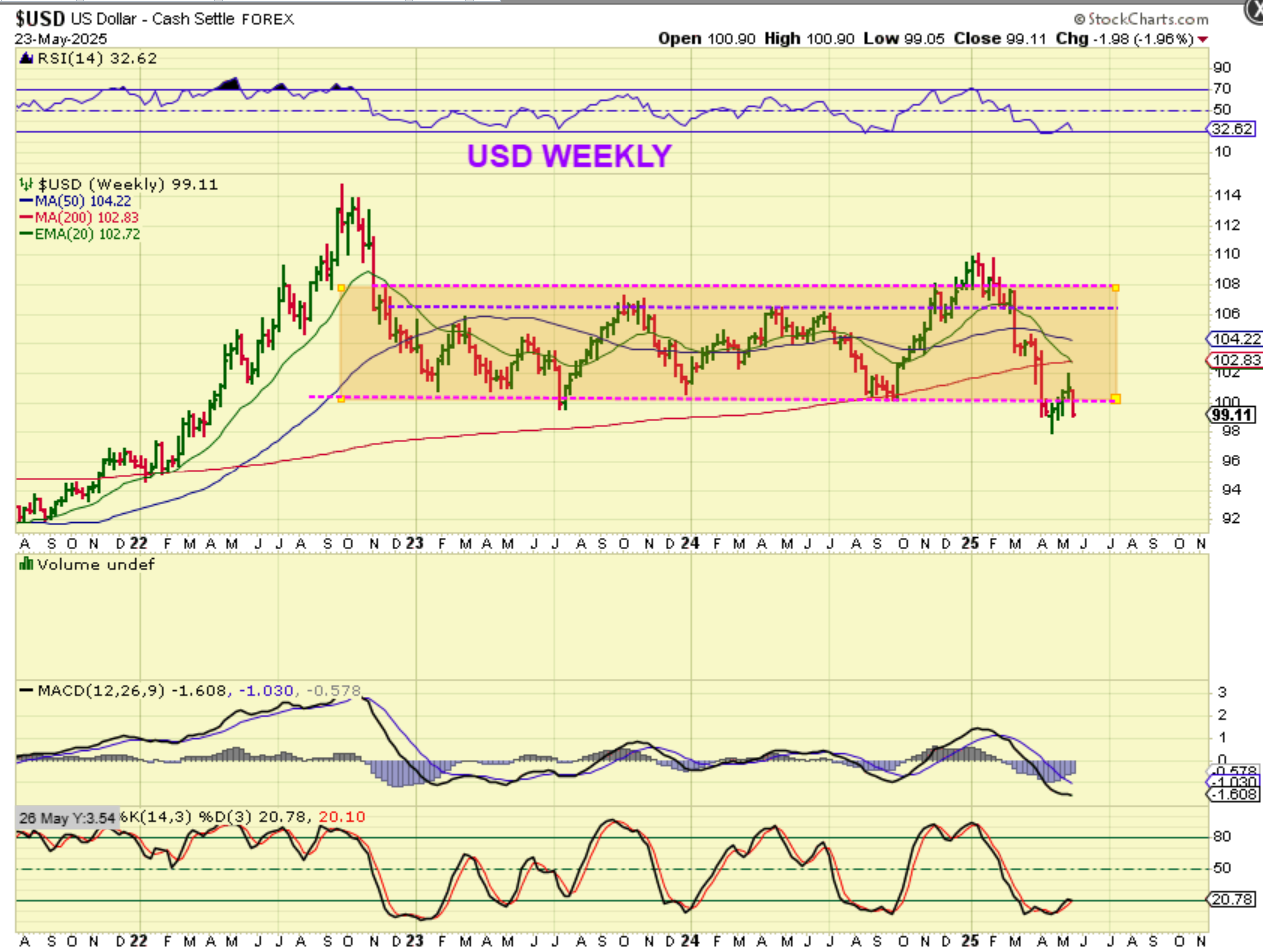
THE USD is due for a dcl and it dropped quite a bit (2%) last week. As it dropped, we saw Gold Pop. I am expecting the USD to turn and move higher again, and that would send Gold down into an ICL. That is what I expect, but the setup for Gold is a tough one to read in such a bullish environment, to be honest.
.
The setup for Gold is a tough one to read in such a bullish environment
.
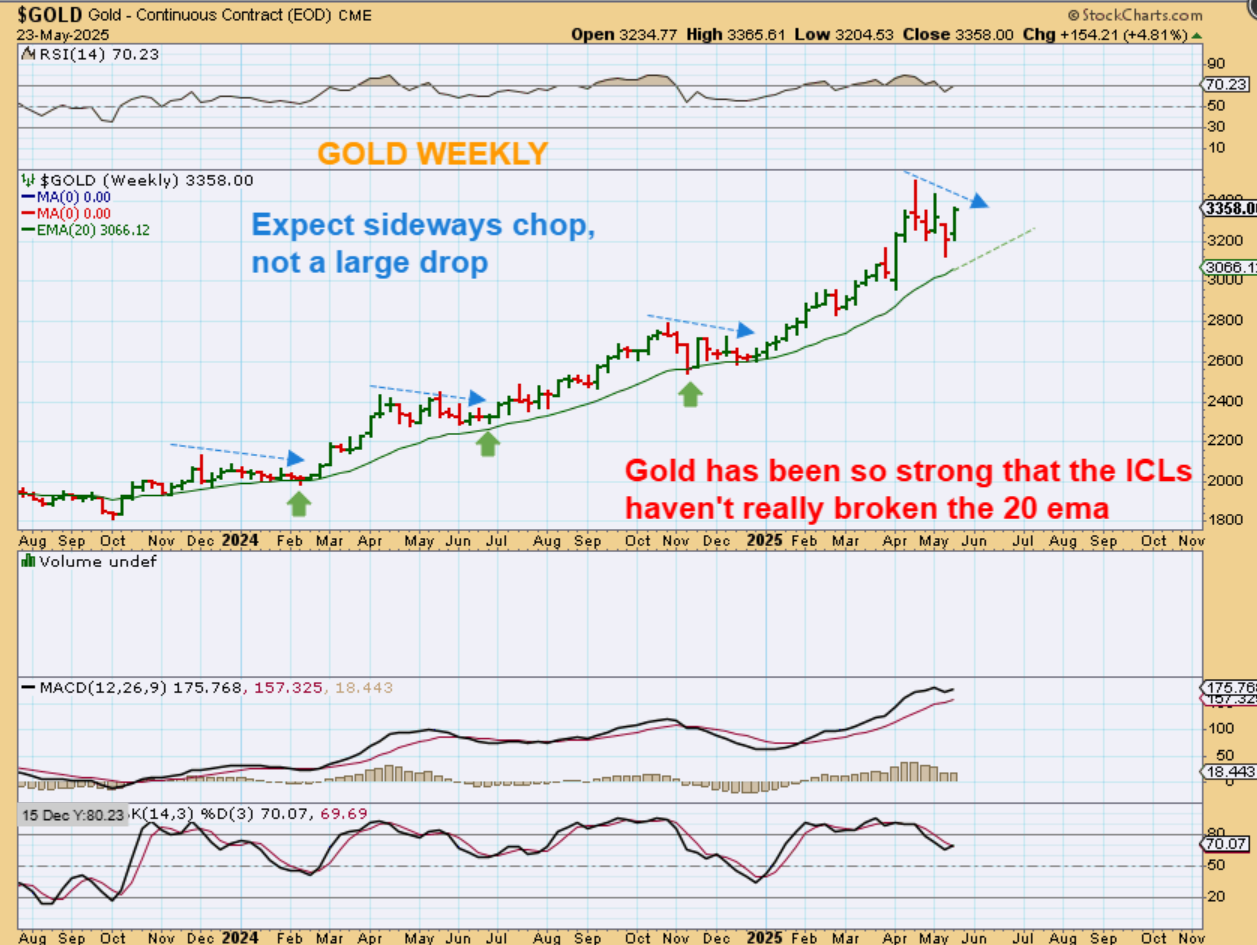
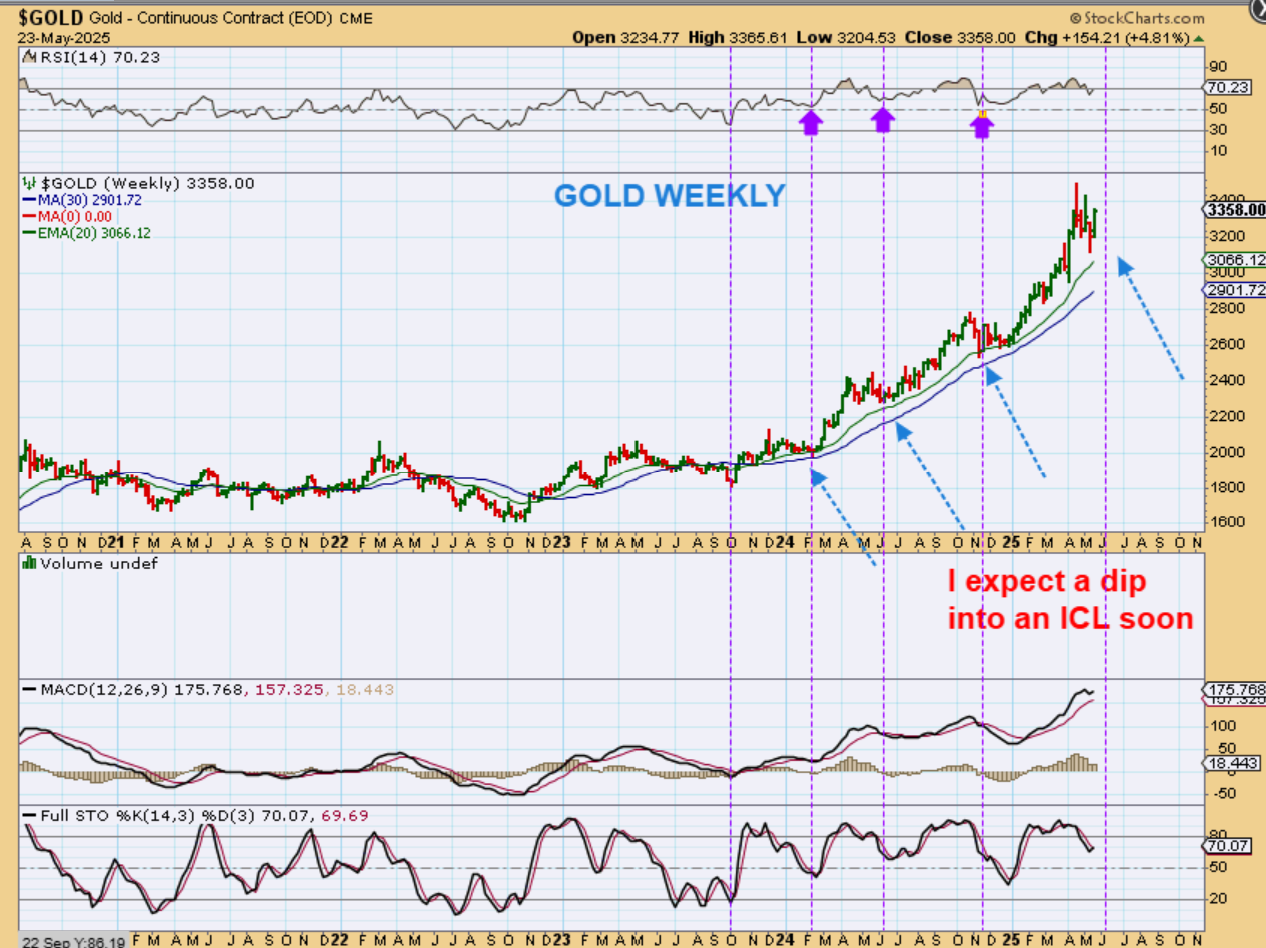
GOLD put in a reversal candle 2 weeks ago and had solid follow through last week. This has the appearance that it wants to just run higher again, but the cycles do not show a normal ICL, so I look back at past ICLs. Those blue arrows show a choppy, somewhat mild dip into the past ICLs. Those ICLs came very close to or tagged the green weekly 20 ema. It is possible to mimic that now with another dip.
.
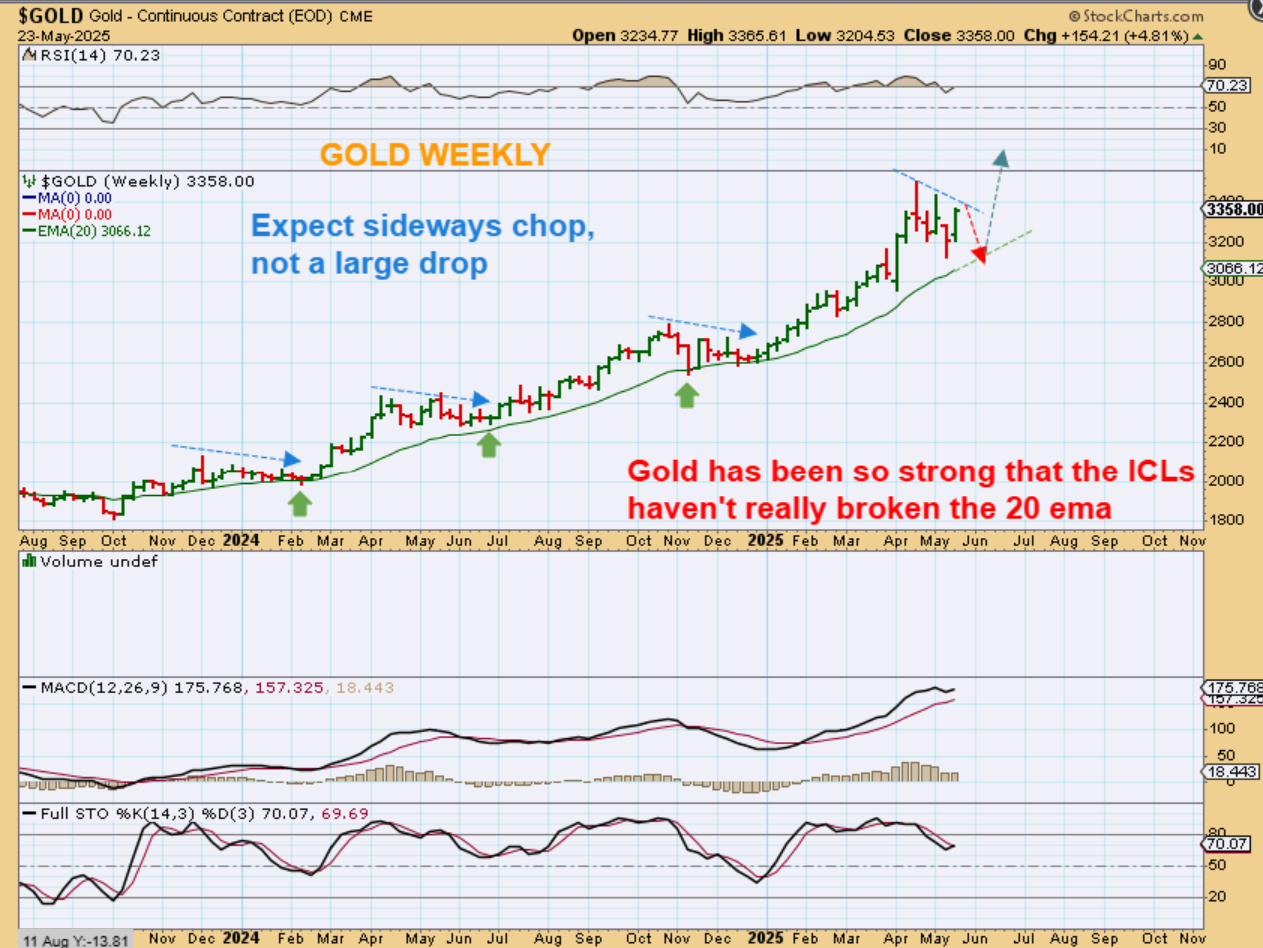
If my analysis is correct, then GOLD would likely do something like this. Gold CAN move higher next week, but it shouldn’t make new highs, it should dip lower like I’ve drawn here. If it does just take off higher, it would be due to the strength of this bull run and this ICL would be an anomaly.
.
With more of a big picture view, GOLD’s weekly chart shows that another dip is possible to get it closer to the green line. Again, if it just takes off higher from here, it would likely be involved in a blow off top type of a move with a short sharp drop over the last 4 weeks.
.
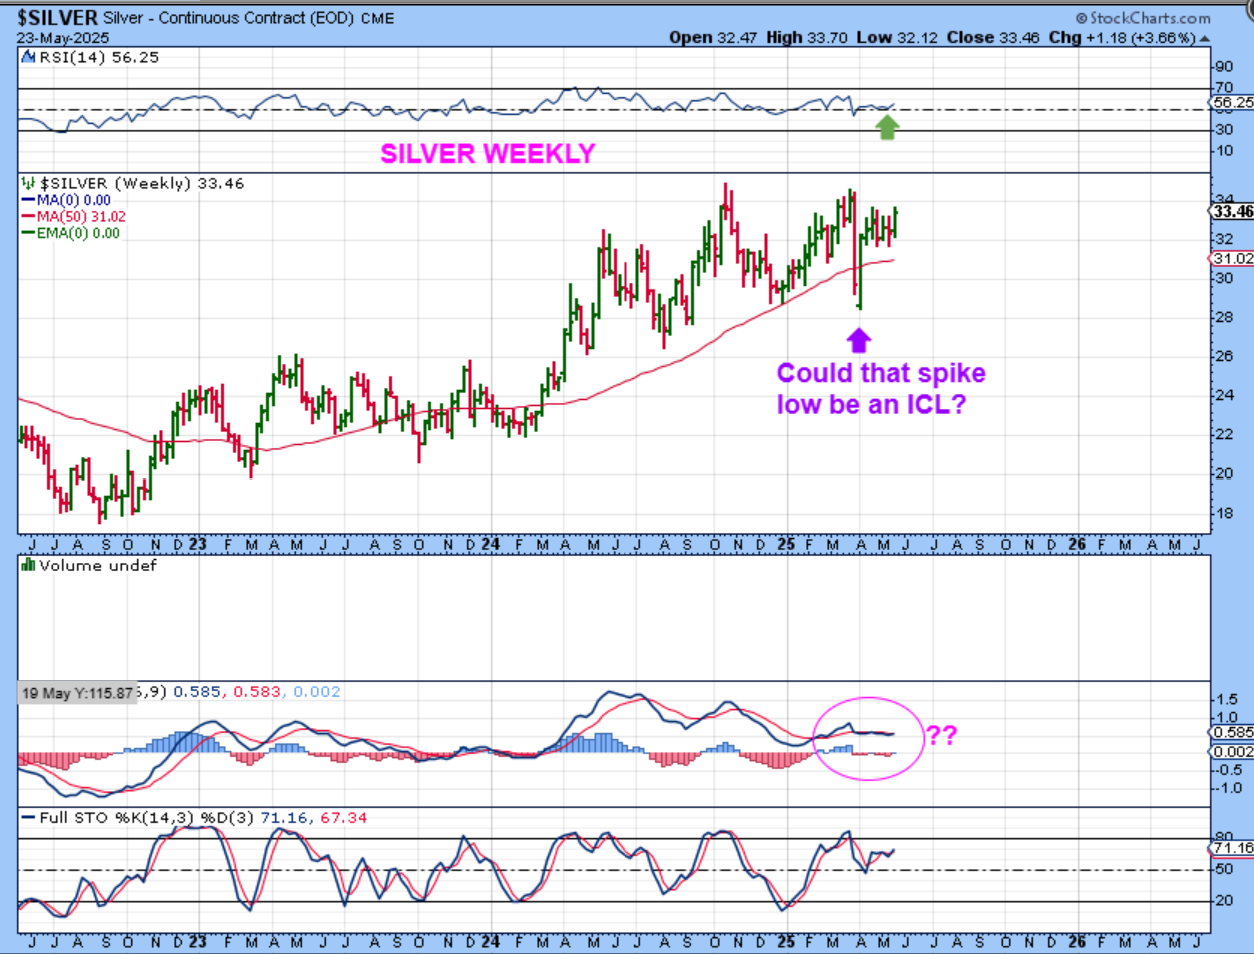
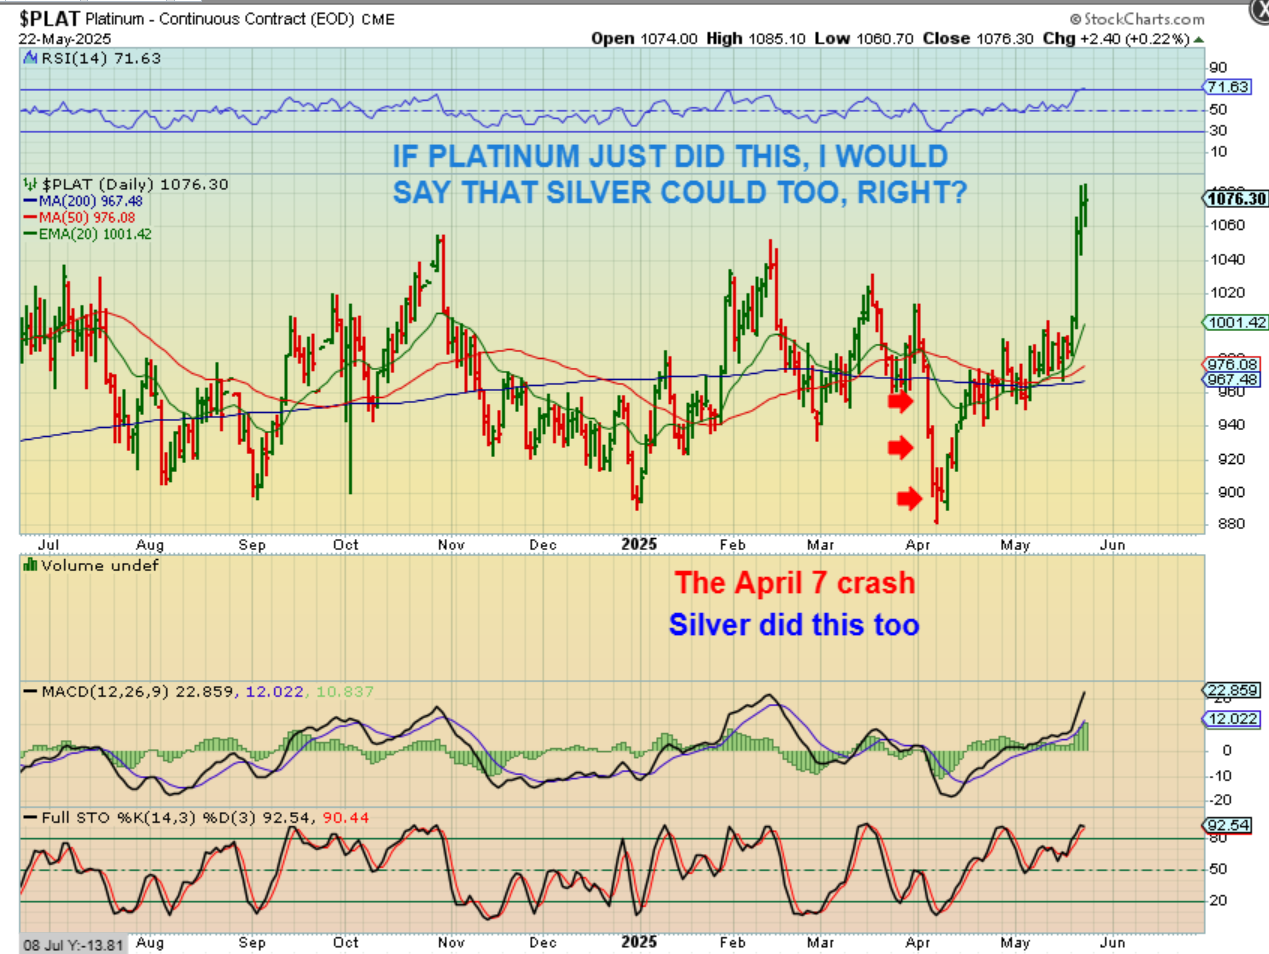
SILVER is just a mess on this weekly chart, really. I did point out the similarity between Silvers crash down on April 7 and Platinum’s crash down on April 7. Platinum bounced back like Silver, it chopped sideways like Silver here, but Platinum took off higher, so Silver COULD do that same thing. I’ll re-post those 2 charts again in this report next…
.
1. Platinum had that sharp crash into the April 7 low,
2. Bounced back like Silver in April,
3. Then it chopped sideways, also similar to Silver, but it then burst higher as seen here. Lets see the similarity in Silver. .
.
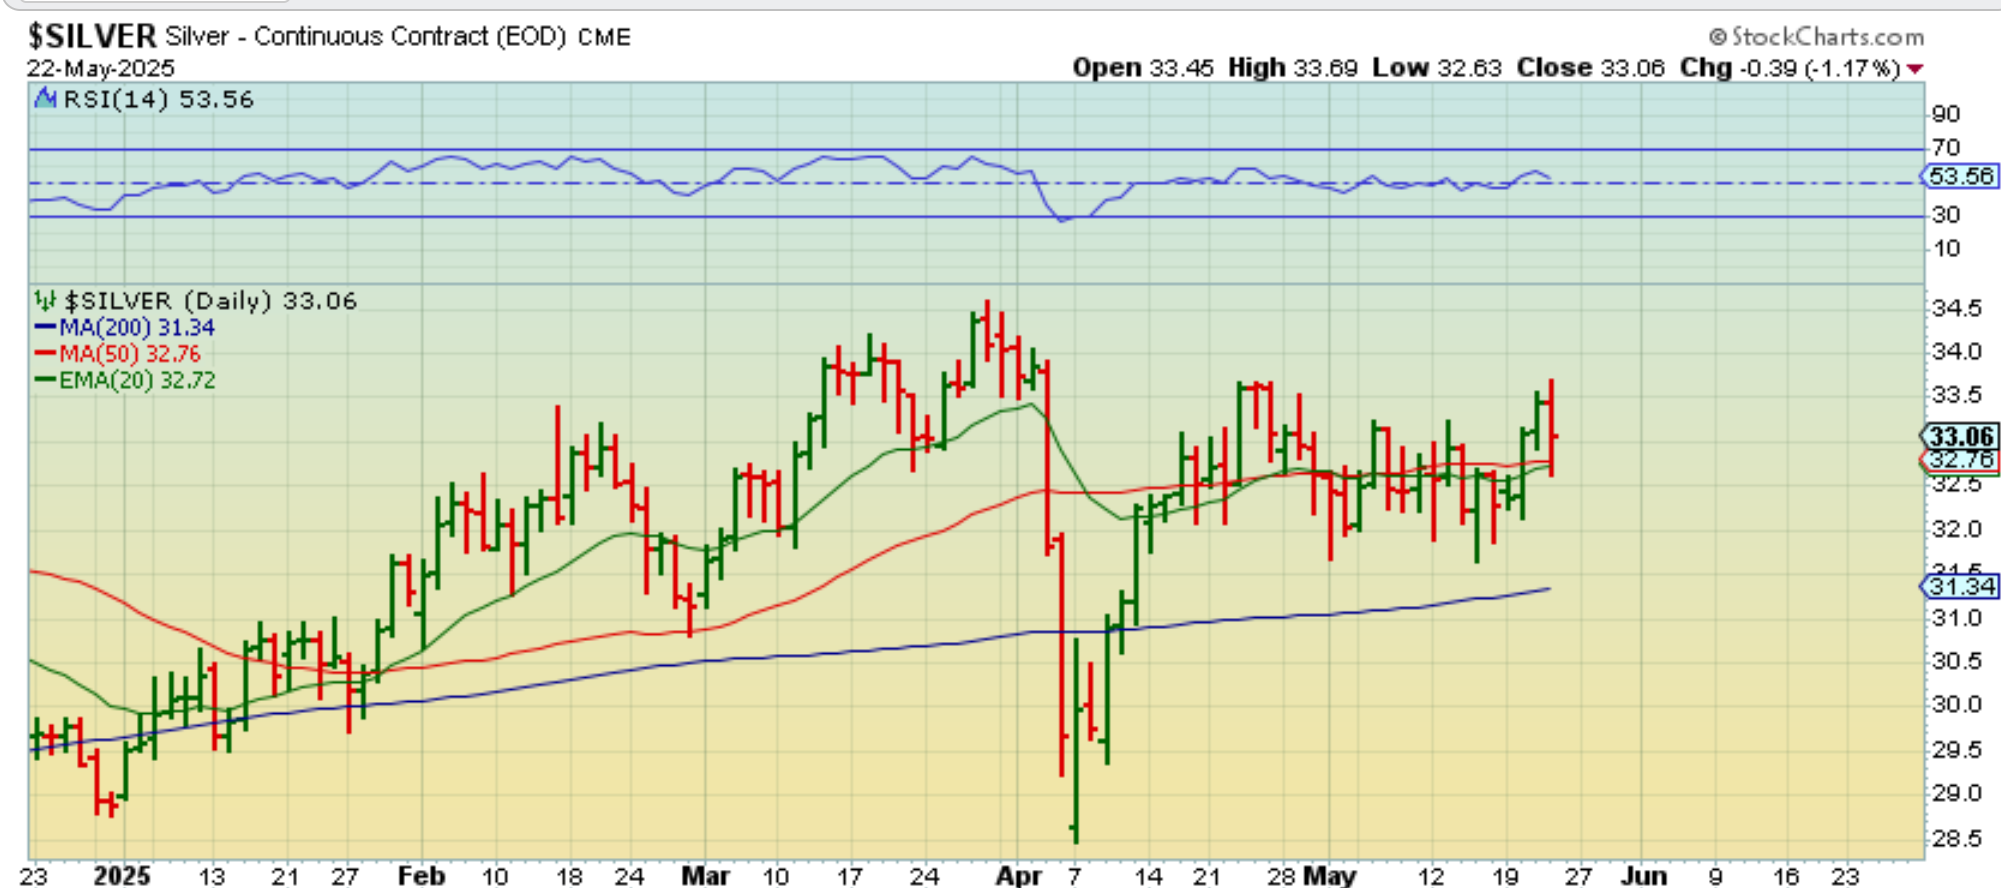
Scroll up to Platinum and then here to Silver. What do you see?
1. The chart of Silver during that April 7 crash down
2. The recovery in April like Platinum
3. The sideways chop that followed is quite similar to Platinum, right? So if you see Silver start to make a move, be ready to jump in (or own a little silver/ miners now).
.
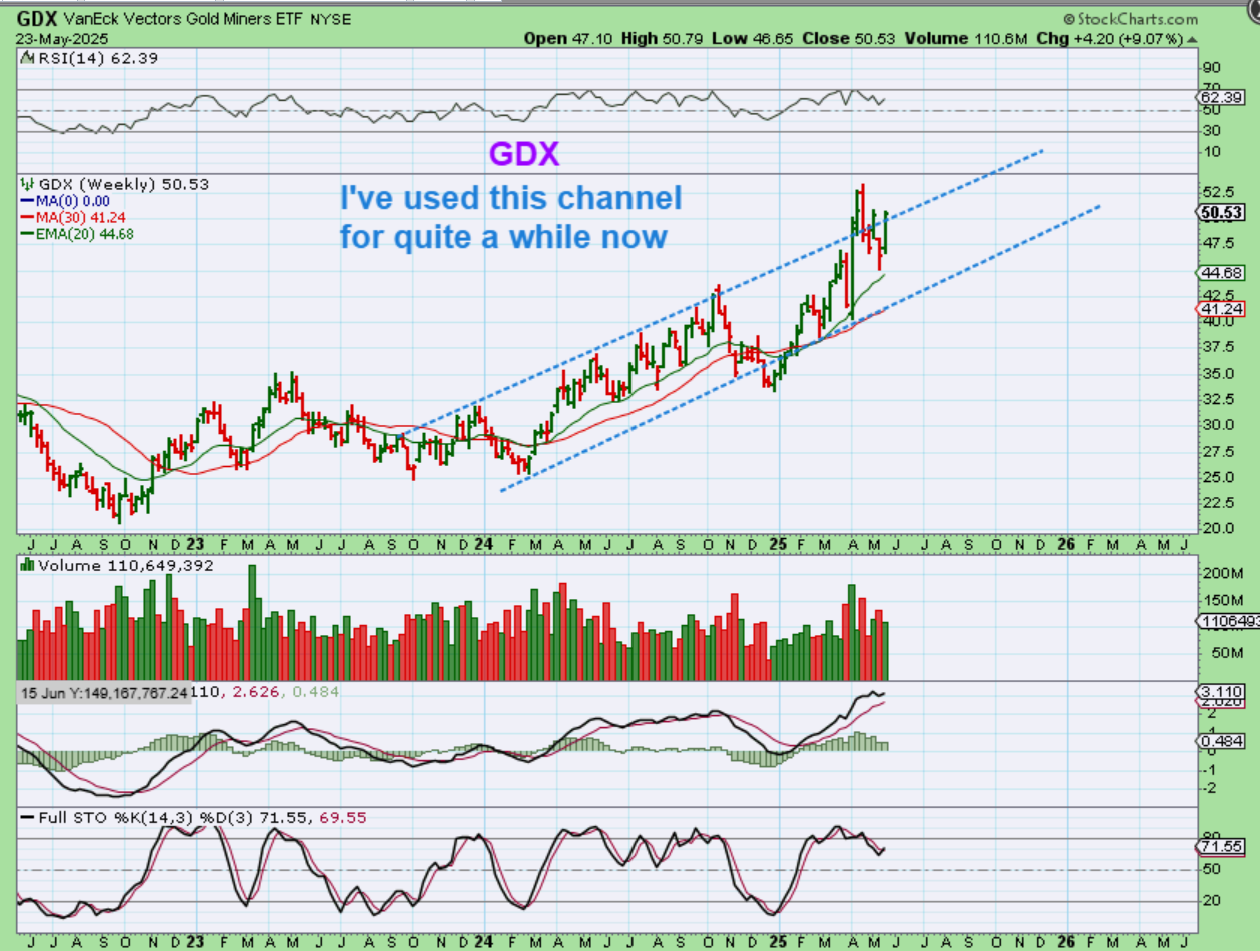
GDX – Similar to Gold, this should dip down at least one more time using cycle counts, but GDX technically also looks very bullish out of that last low. Dips throughout 2024 often reversed at the green 20 ema, and it reversed above that line 2 weeks ago. I mentioned that you can buy that low and raise stops as it moves higher, so now we’ll see if this pulls back or just runs higher from here. I do want to mention that…
.
I do want to mention that when price breaks from a channel and continues higher, it often becomes a steeper run higher. So whether that happens now or after another pull back, the Miners could start a steeper run above this channel. That steeper trajectory is already apparent in 2025, isn’t it.
.
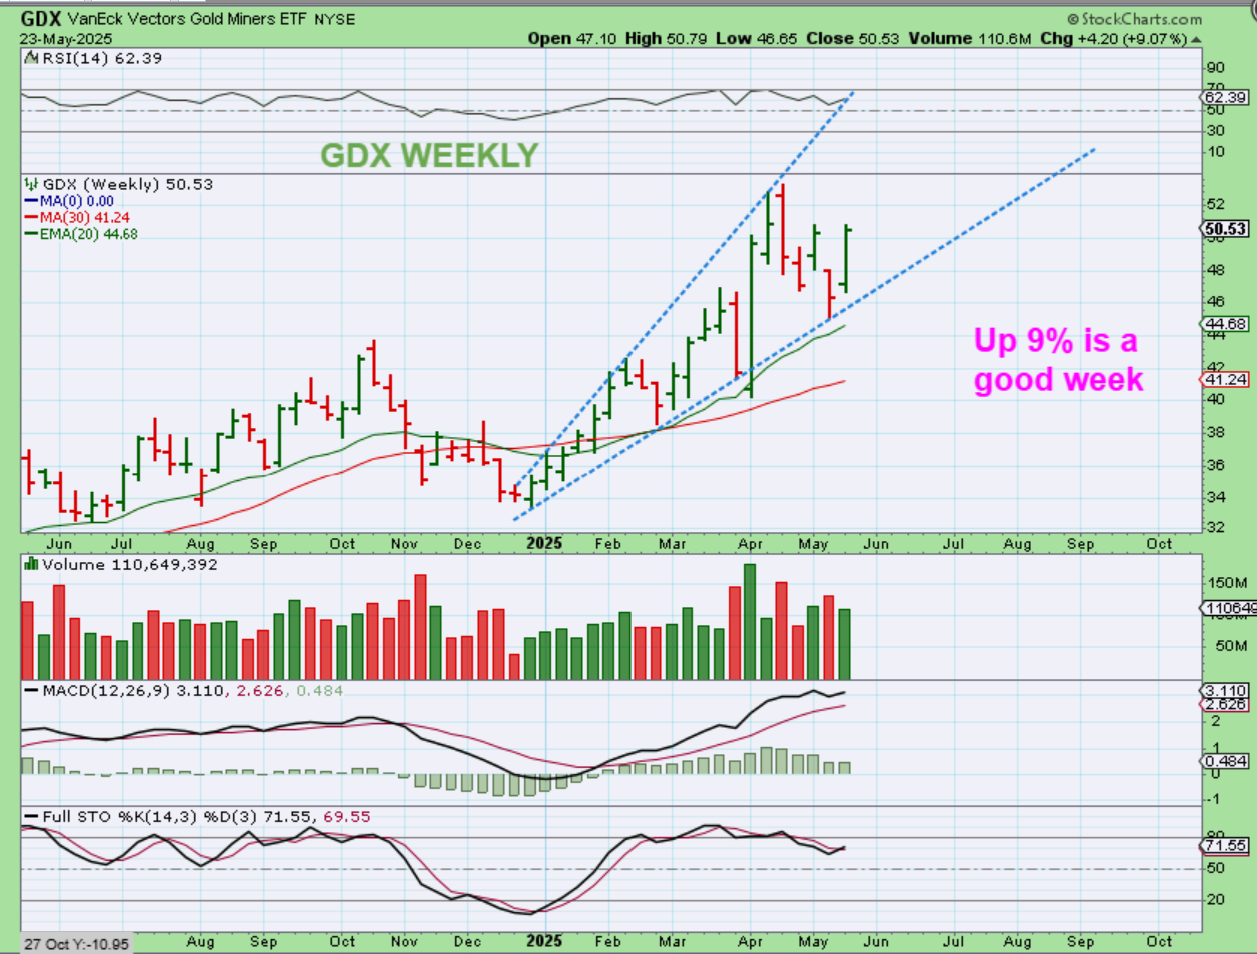
So we could draw up the weekly chart of GDX like this.
.
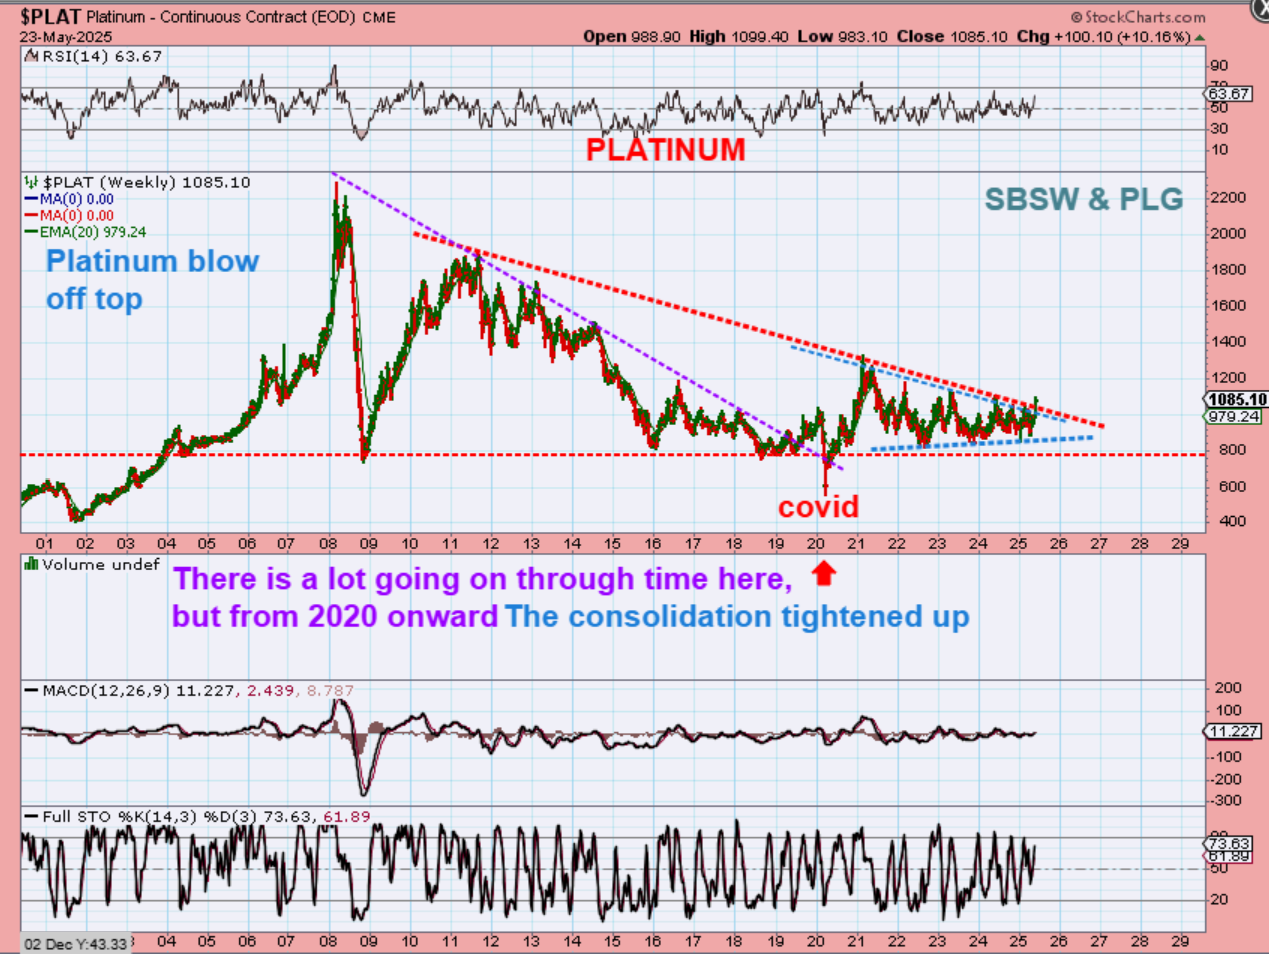
Now that PLATINUM surged higher, let’s take a look at the bigger picture.
We see that Platinum popped 10% and started to break out. I mentioned before that when I used to trade in 2000 to 2008, Platinum was ahead of Gold, it would lead Gold higher. Now gold is at all-time highs and Platinum just chopped around for years. Ever since the 2000 COVID CRASH, Platinum tightened up and formed a choppy wedge. It may be ready to breakout here and run. Let’s zoom in…
.
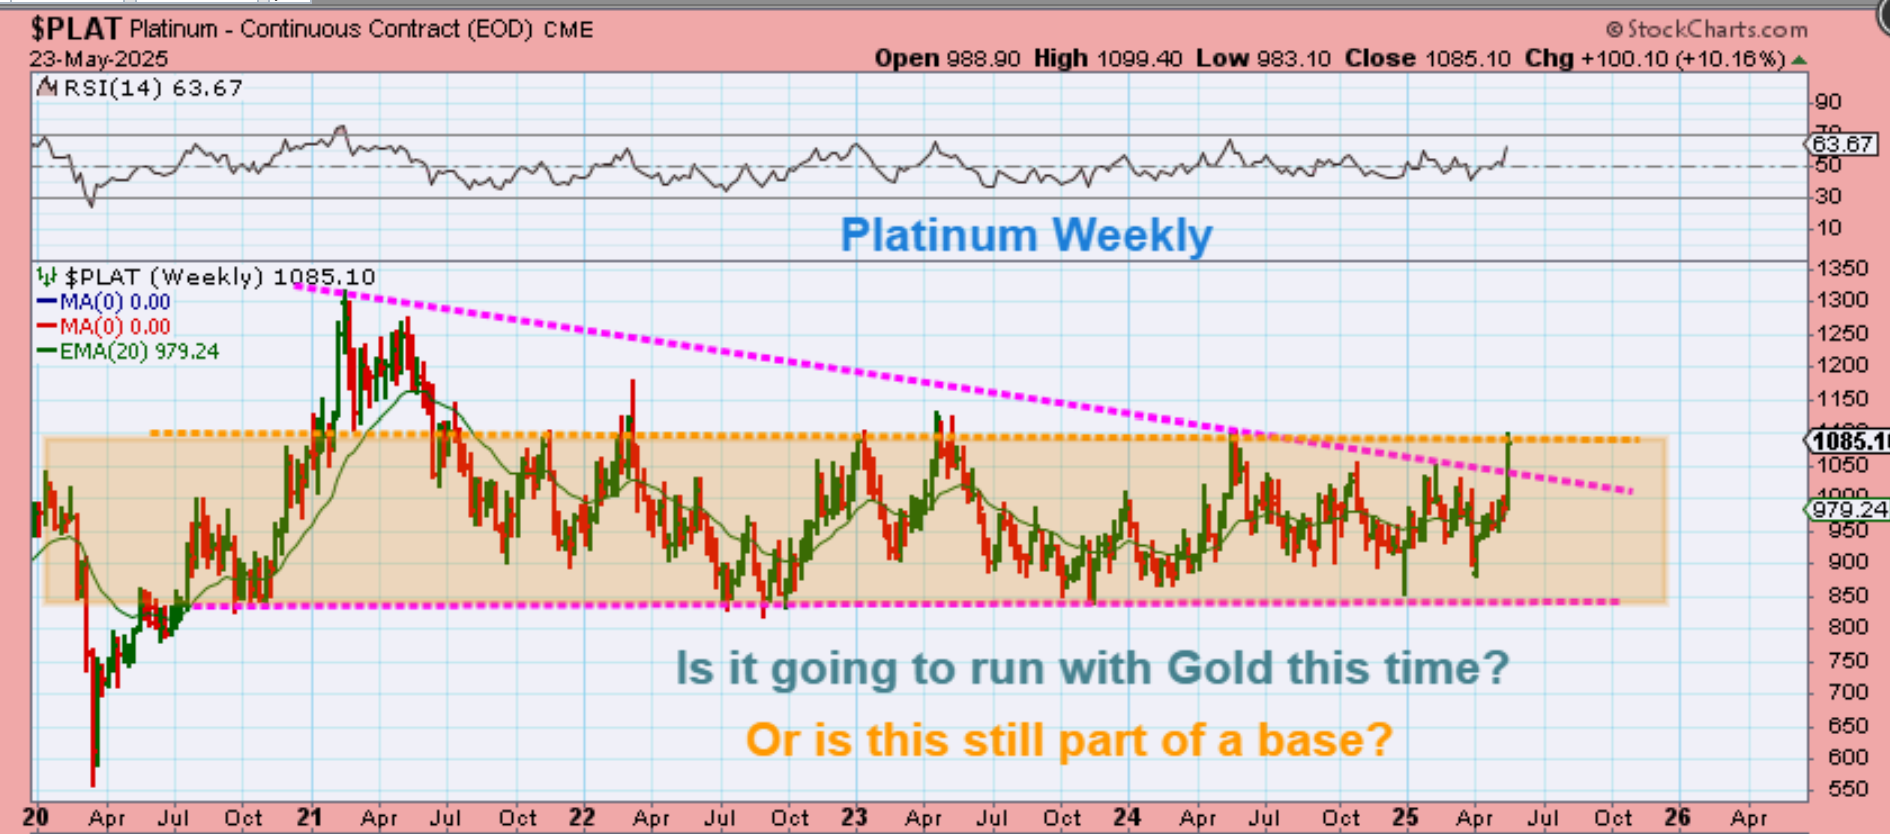
Here in the close up we see that PLATINUM choppy wedge that formed from the Covid 2000 crash & rally to now, That is a 5 year wedge and it does look to be breaking out now.
.
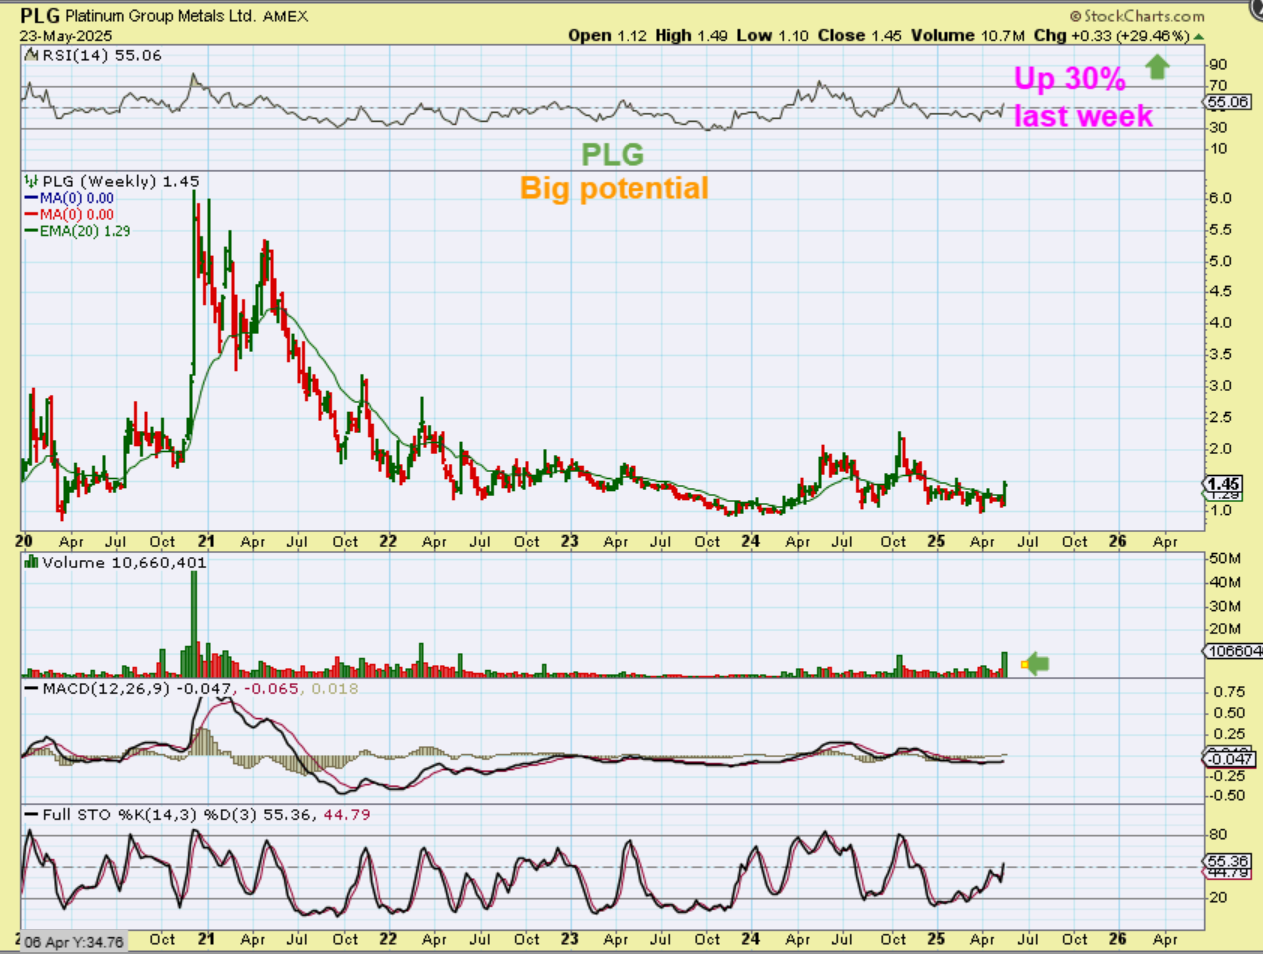
PLG was pointed out during the weekday reports and it ended up ‘up 30%’ for the week. The upside potential looks very good is Platinum runs. Also…
.
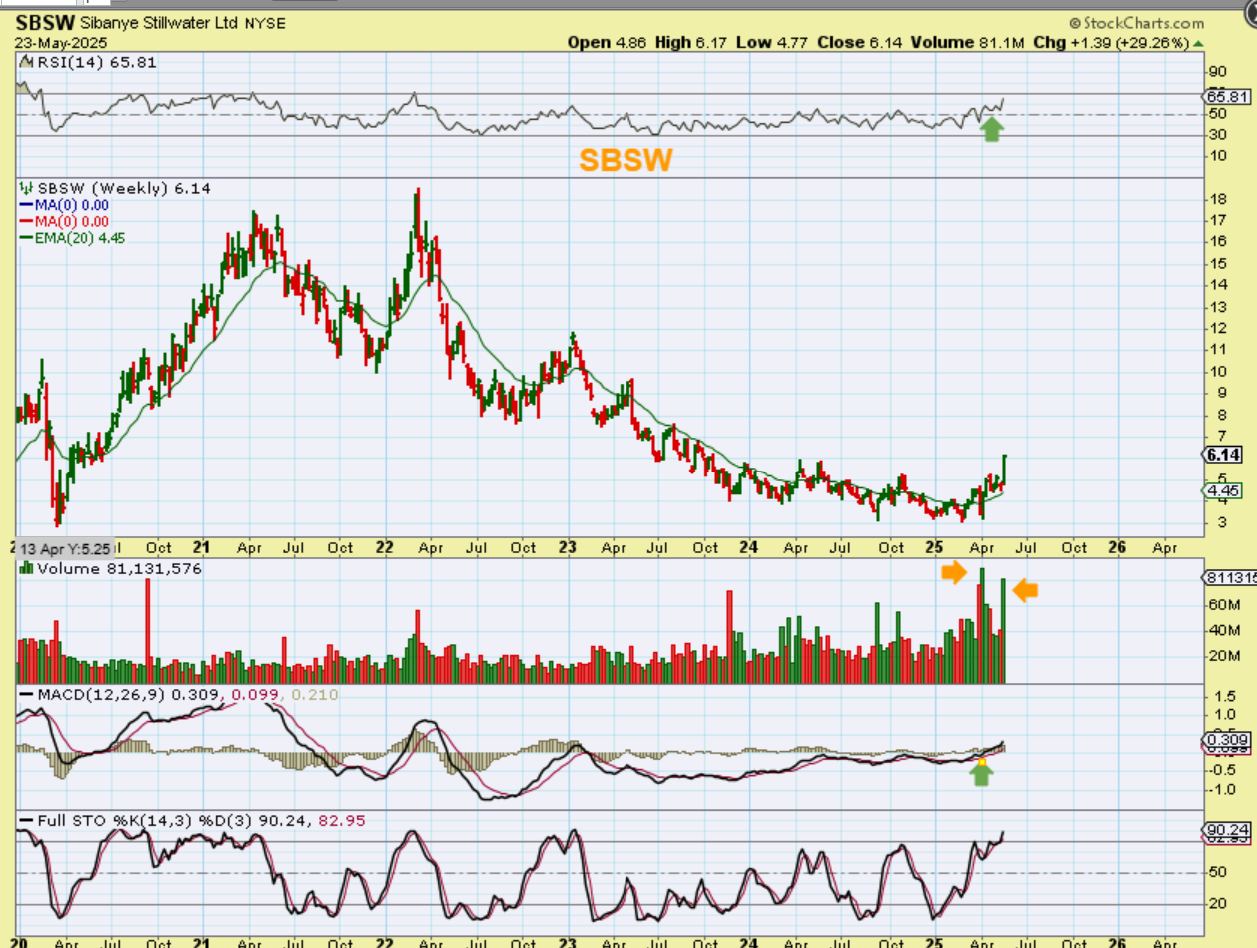
SBSW was also up 30% and this is obviously breaking away from a base. Volume is spiking and you know that I like to see that at the lows. From roughly $3 in April to possibly back to the highs over time, this would be a very profitable run too, if Platinum is on it’s way. There are not many Platinum stocks, so many buyers would likely be piling into PLG & SBSW.
.
Everything looks great, including the pull back with the General Markets. It looks fairly mild so far, and quite a few of the bullish stocks in my watchlists look to be resisting the dip to some degree. Platinum took off higher, bringing SBSW & PAL with it. The platinum set up looked very much like Silvers set up, so I wanted to point that out. Platinum obviously put in a spike down ICL on April 7th, so we’ll see if Silver follows the same path, and if it does, you’ll need to own some Silver miners for a potentially strong run higher. I’ve been discussing for months that Silver should, at some point, start to follow Golds run higher. I’ll discuss Bitcoin below, enjoy your long weekend!!
.
~ALEX
.
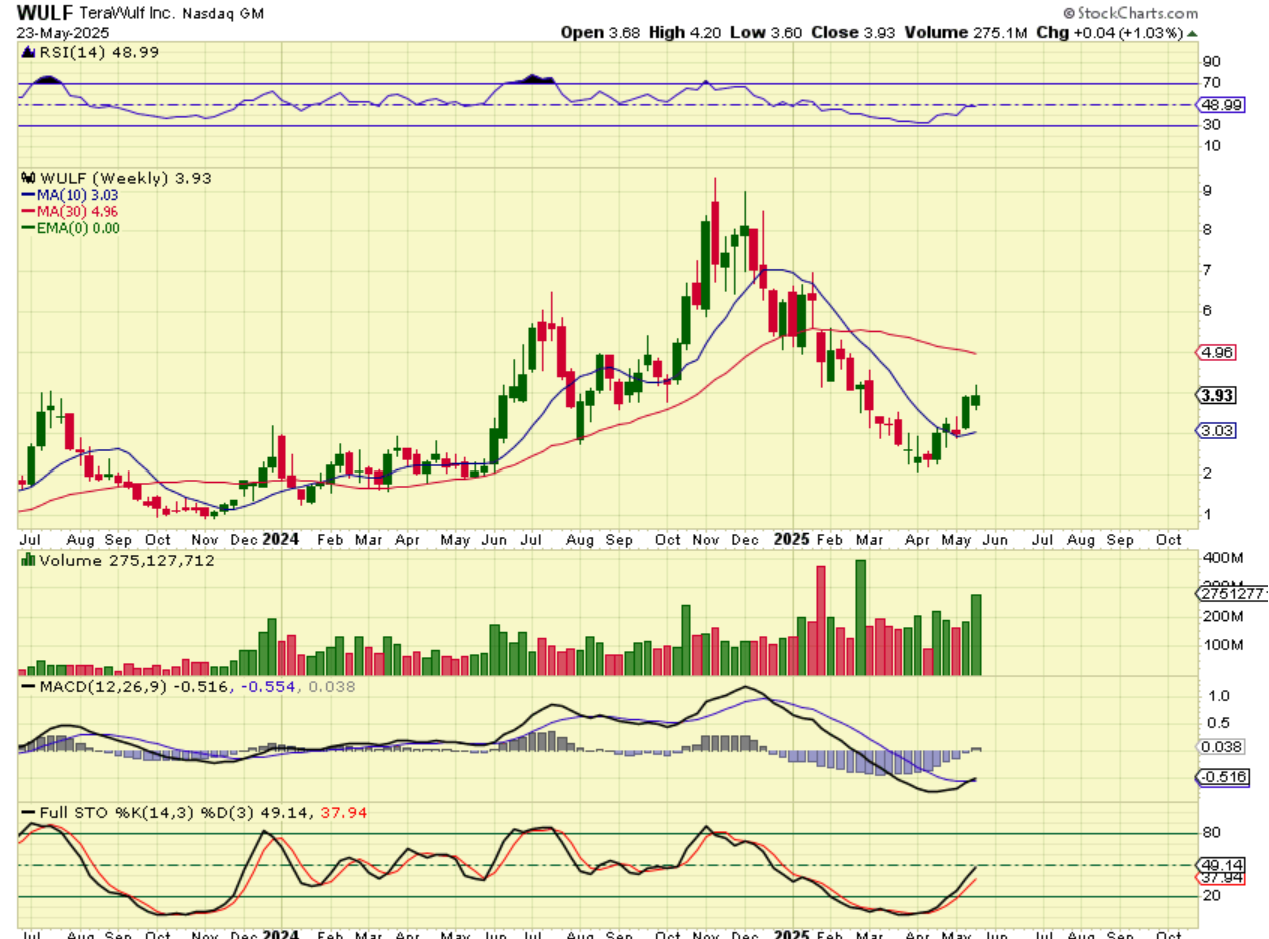
Bitcoin has been running basically as expected. I will say, however, that the Crytpo stocks have not done as well. I made good gains with WULF, IREN, BTDR and a little HUT, but Bitcoin is at THE ALL-TIME HIGHS, so I am disappointed that the miners are not closer to their highs. I’ll discuss my thoughts on that after discussing Bitcoin.
,
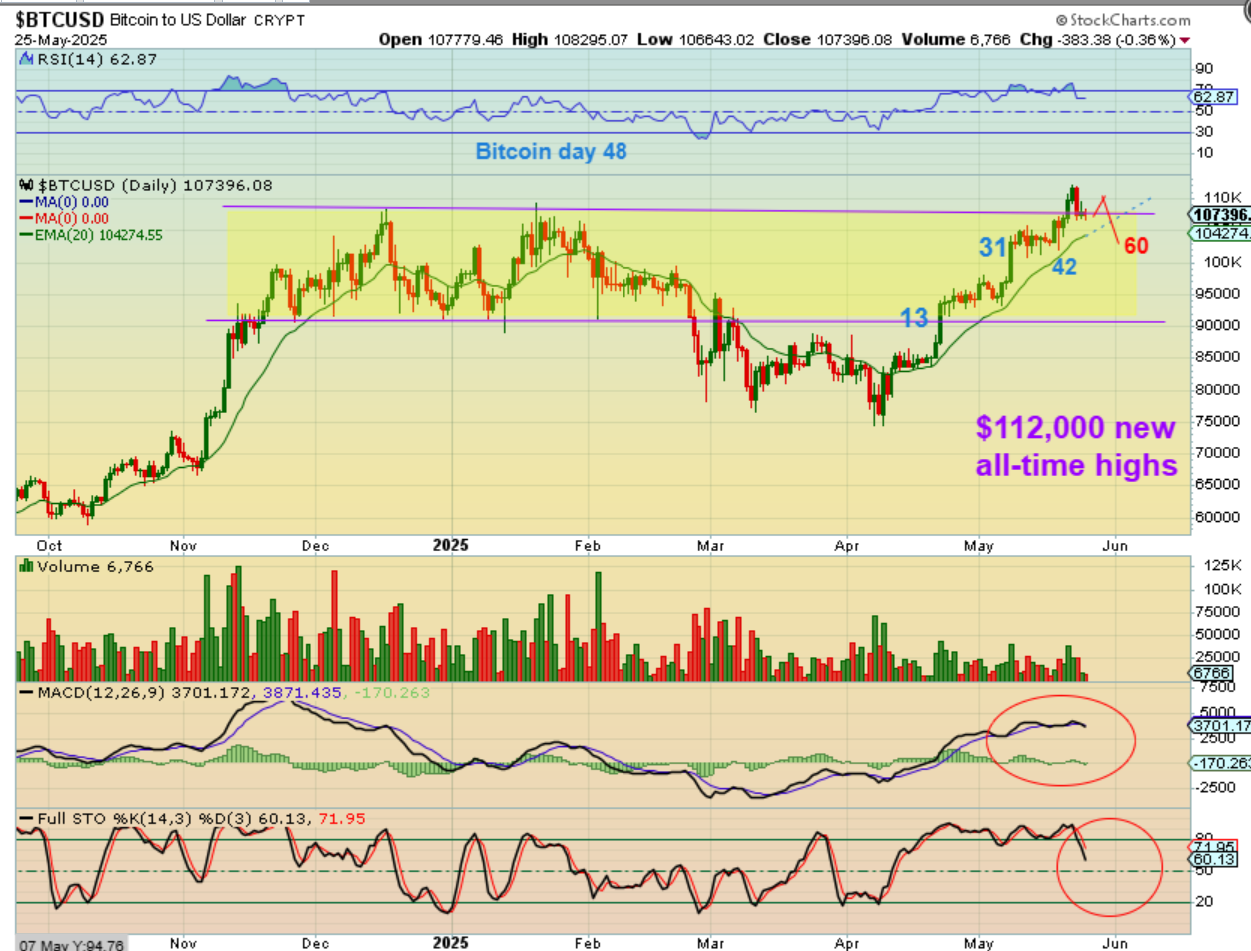
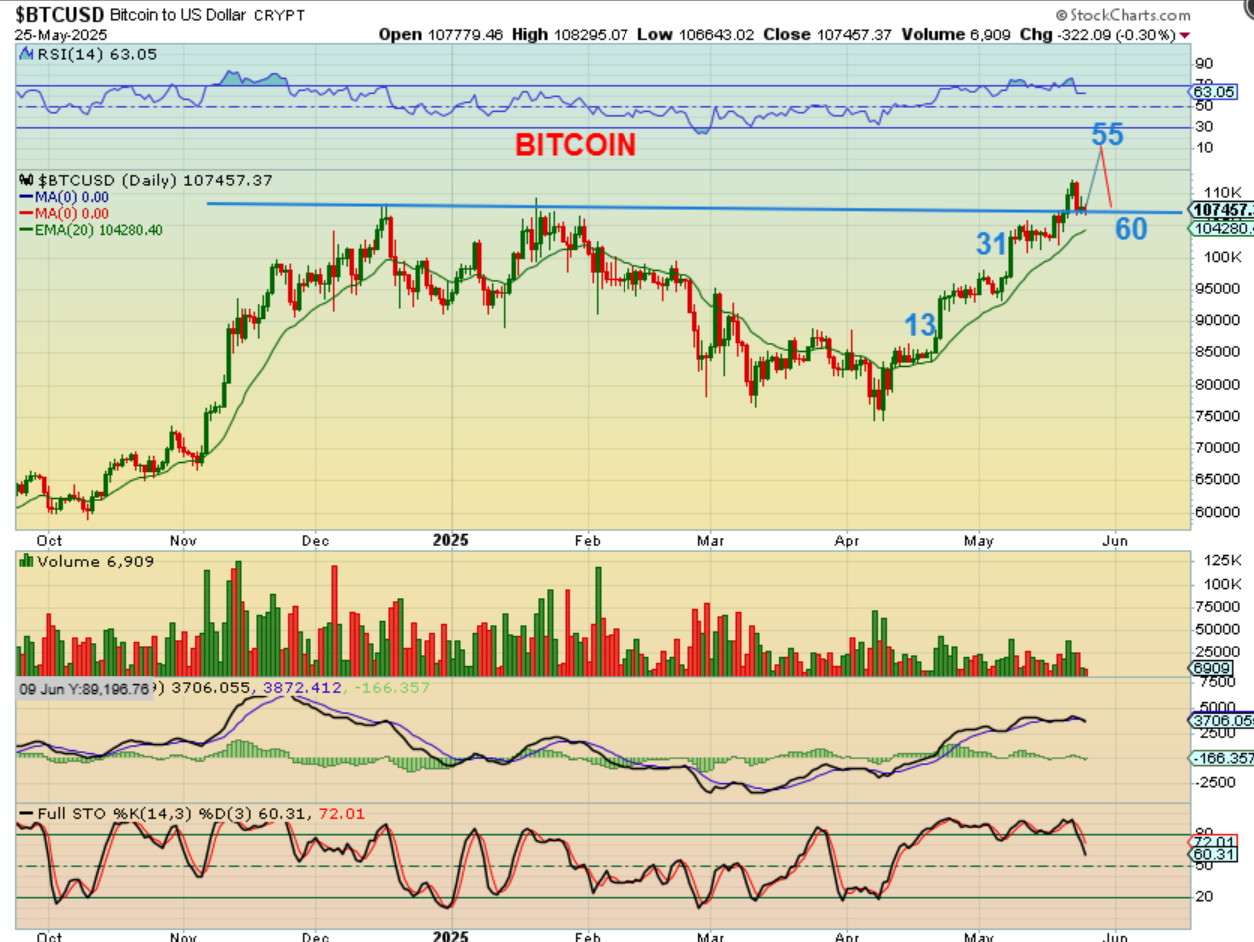
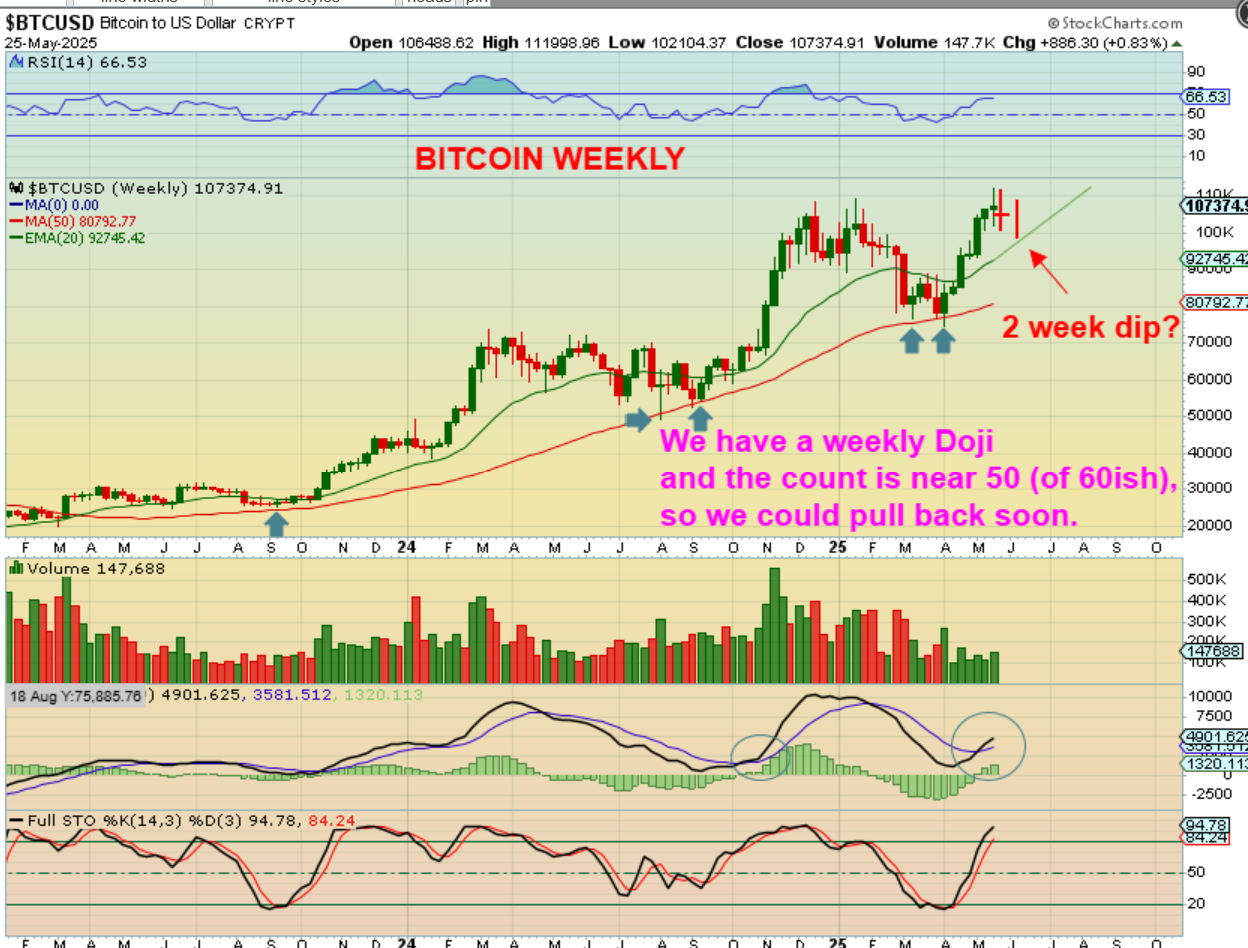
Bitcoin Daily – Saturday is day 48 out of that April low and we hit all-time highs this week. It then started to pull back and since it is up at all-time highs, it may break out, take a rest & get choppy (into day 60ish) and then rally onward and upward. It is also very possible that…
,
It is also very possible that Bitcoin could continue to rally next week maybe to day 55 and then just dip for a back-test of this break out the week after into day 60ish. I think that this is a valid or likely scenario too, because Bitcoin has been strong and following that 20 ema.
Bitcoins Weekly chart has a doji, a candle of indecision that can signal a top or bottom after a run too.
If Bitcoin does just chop and pull back over the next 2 weeks, then a tag of the Weekly 20 ema is possible, as seen here. So we’ll just have to see how Bitcoin plays out as it continues heading into the timing for a dcl.
.
Next let me just say 1 thing about what we see with Crypto stocks. I started to think about how Crypto Stocks are lagging and suddenly I remembered something…
.
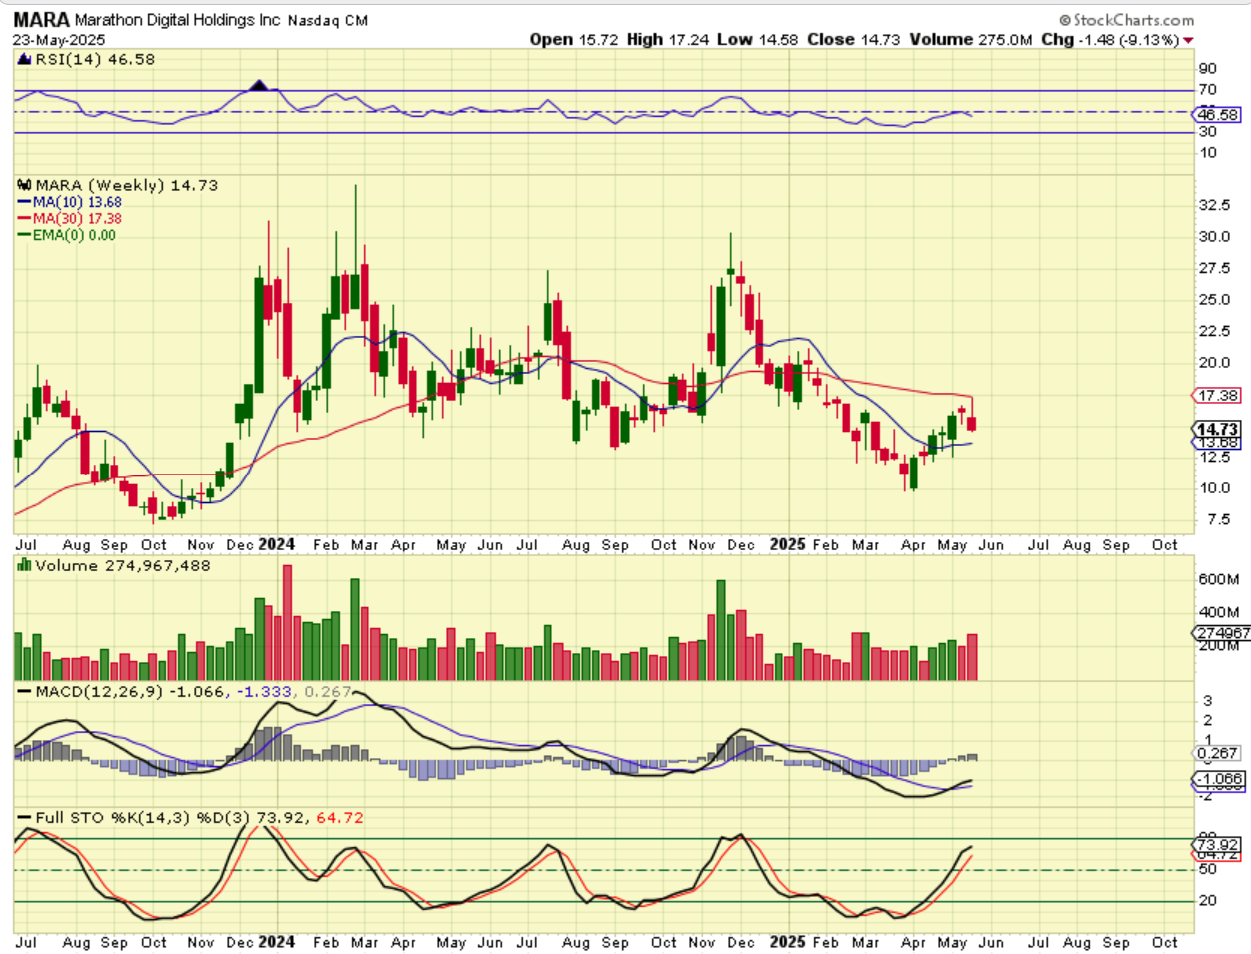
It is a bit disappointing to see that they are lagging, since Bitcoin is at the all-time highs. I hate to see MARA, RIOT, WULF, etc not even halfway up in a recovery, and MARA was rejected at the 30 week ma last week with Bitcoin breaking out. But then something came to my mind this weekend…
The charts are becoming more bullish over time…
1. Some like WULF, BTDR, IREN, etc are showing increasing volume,
2. There seems to be steady buying in the first 60 day cycle for Bitcoin, and then I also remembered this point…
.
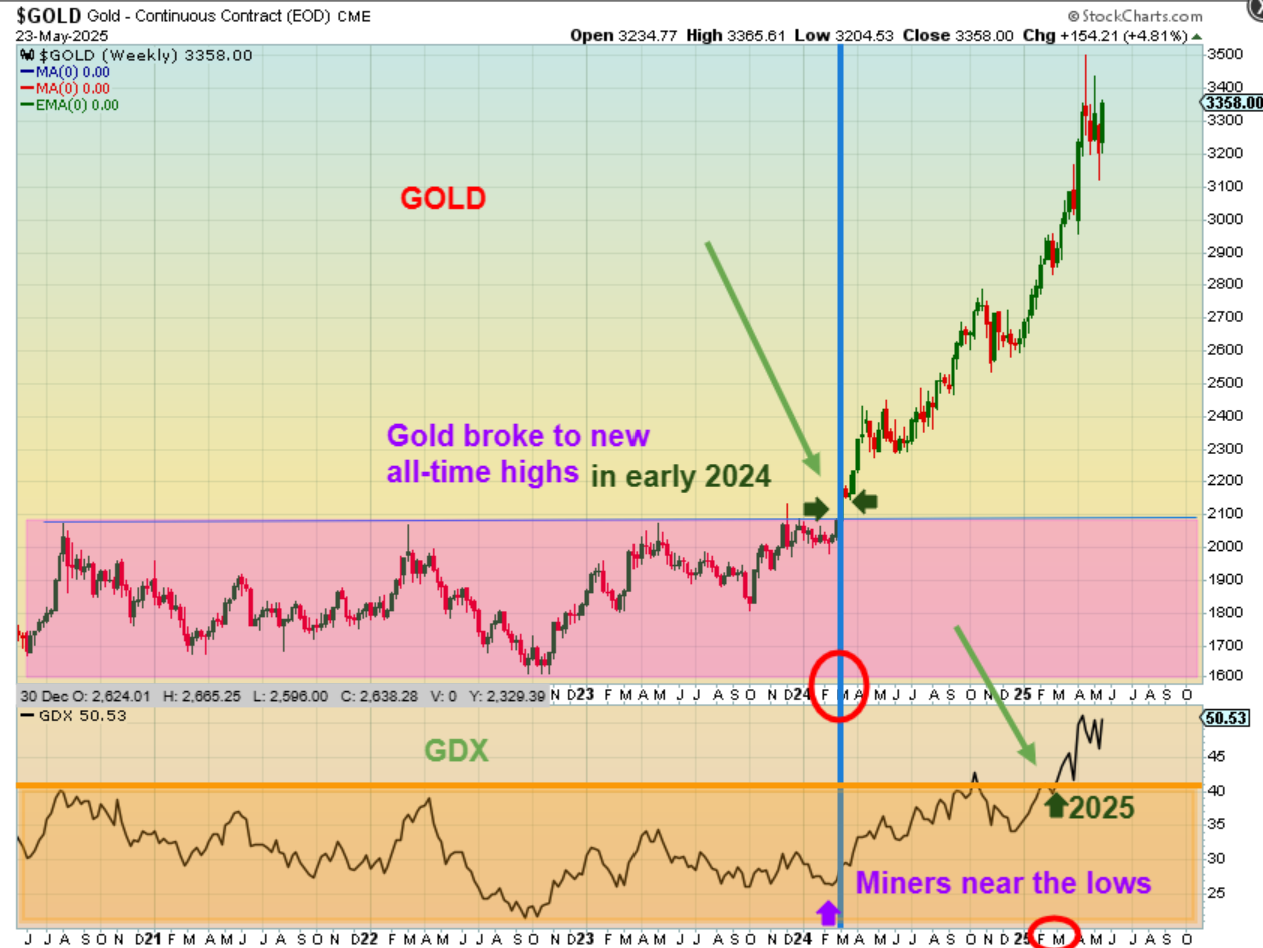
I also remembered this point. Do you remember that Gold broke out to new all-time highs in early 2024, yet the Miners were still near their lows? Doesn’t that sound familiar with Bitcoin and Crypto stocks. But then we made great gains when Miners started to play catch up, and that may be exactly what is happening with Crypto right now.
.
Take a look at this chart. When Gold hit all-time highs in early 2024, Miners were lagging. Now they are making 13 year highs and catching up to or running higher with Golds move. Crypto stocks may do this too over time.