Tuesday April 29th – Gradual Changes
.
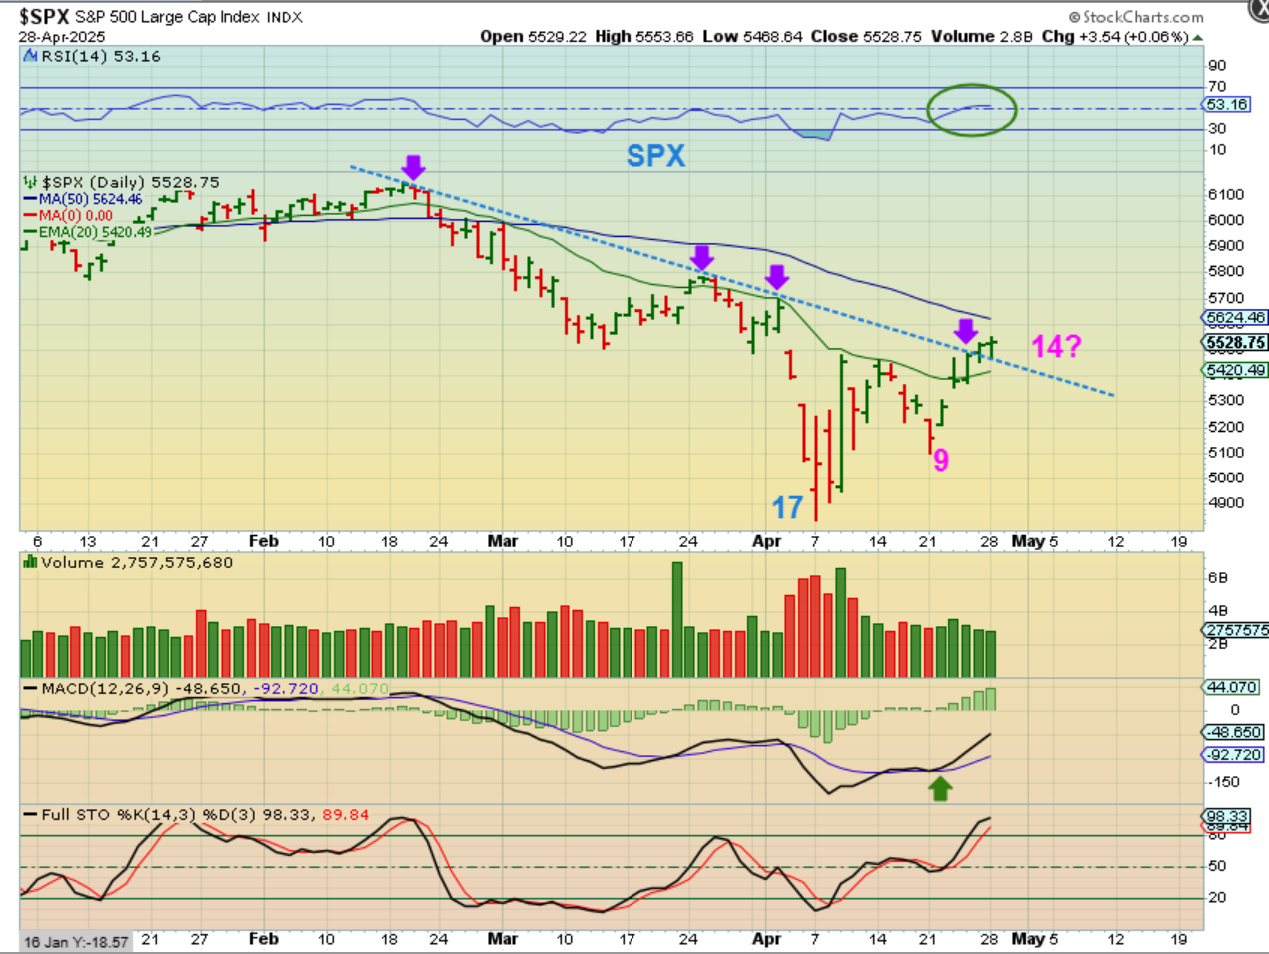
SPX – The set up for the General Markets continues to improve day by day. I have discussed the possibility that we had a slam down exhaustion sell off into an ICL, and that seems to be what we have here. Buying near the lows, ‘stops’ were eventually raised to day 9. Now I think that you could even raise them to the green 20 ema.
.
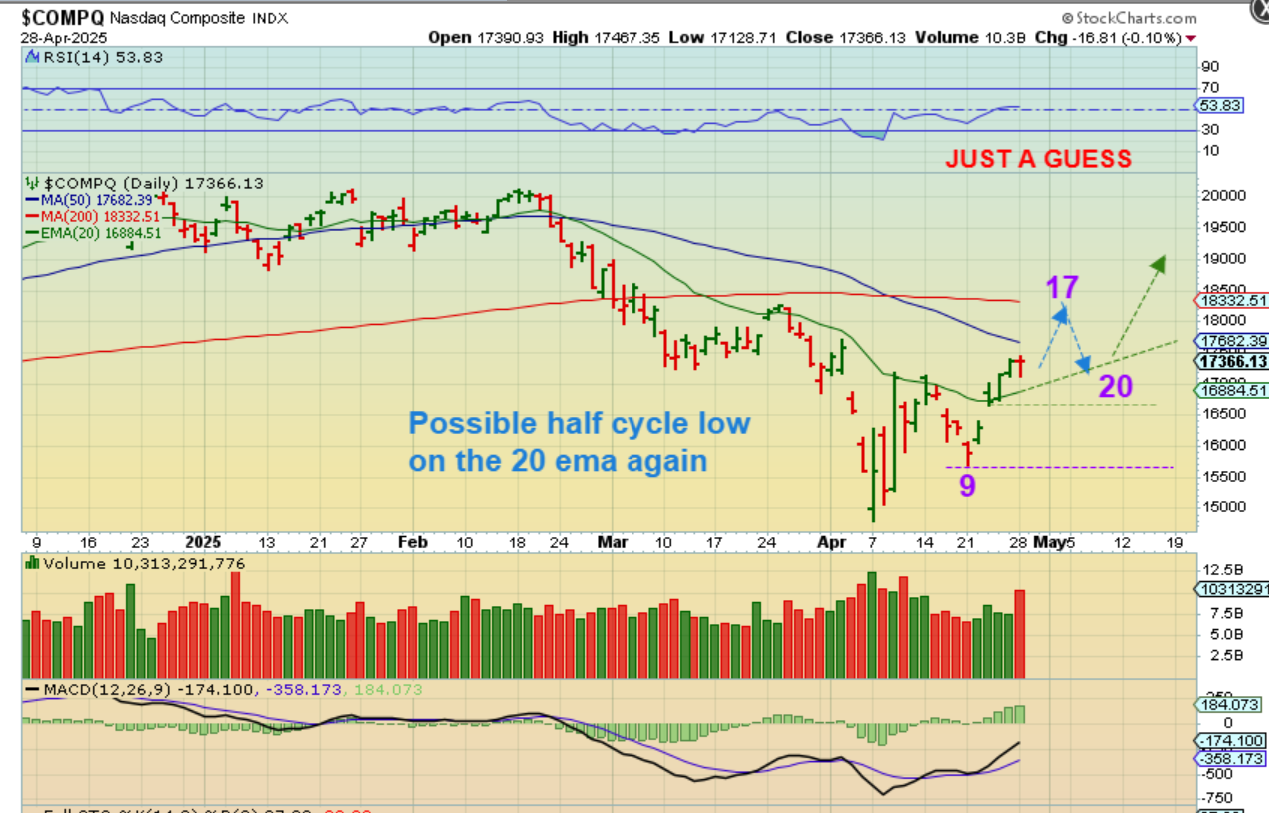
NASDAQ – Raise stops again? This is just an idea of how this could play out if it remains bullish. Price might just crawl at the 50sma, but I have drawn it that it breaks above the 50 and tags the 200sma, then dips into a half cycle low. THAT DIP would offer an entry and could be at the 20 ema.
.
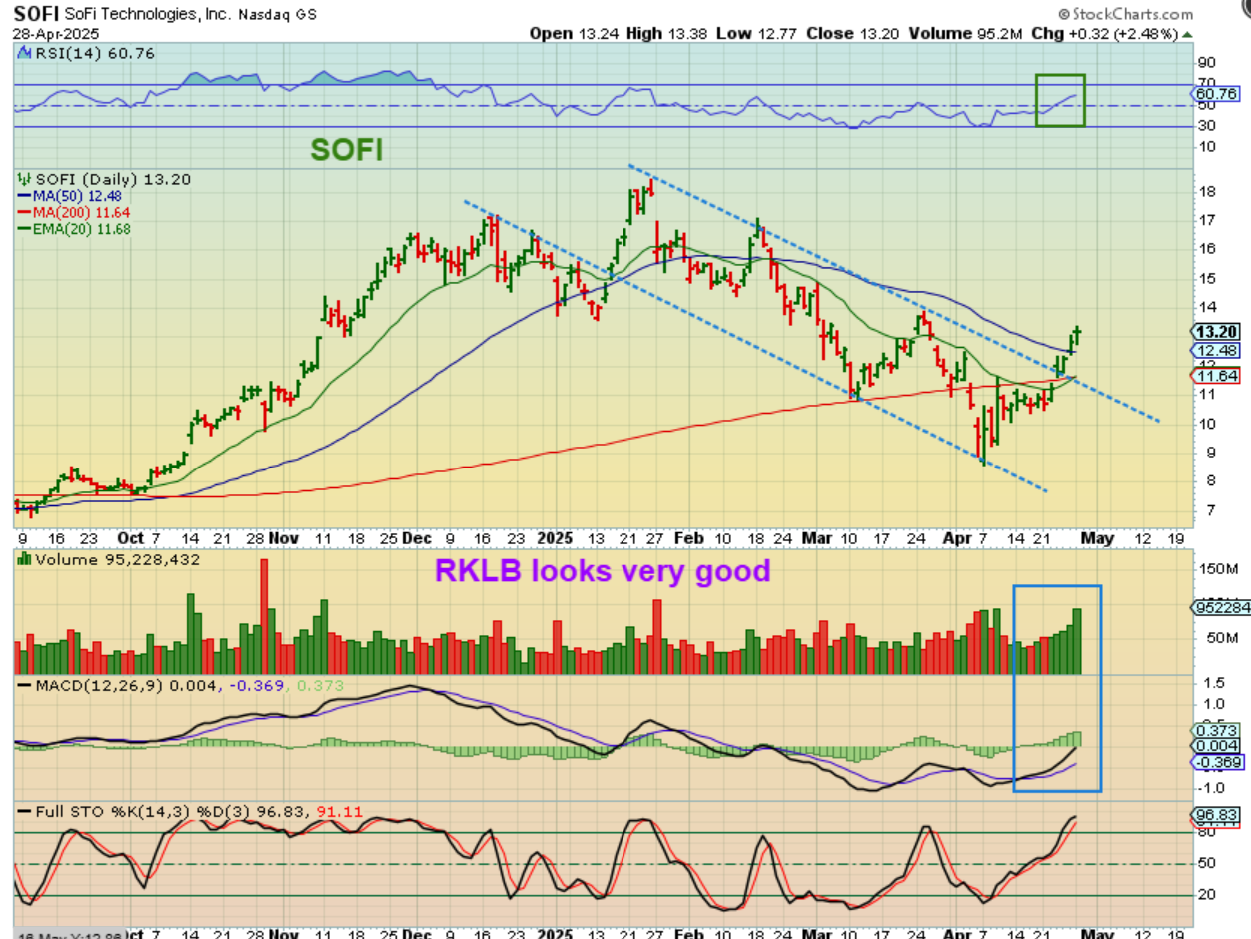
SOFI – I have mentioned keeping an eye on or buying and raising stops on a few of the former bullish leaders (other than GOOG, AMZN, AAPL, etc) like RKLB, SOFI, RDW, TSLA, GRPN, UBER, etc. These are doing very well. SOFI has now regained the 50 & 200sma and volume has increased daily. $9 to $13 is a great trade, but over time a stock like this should make new highs if the markets remain bullish.
.
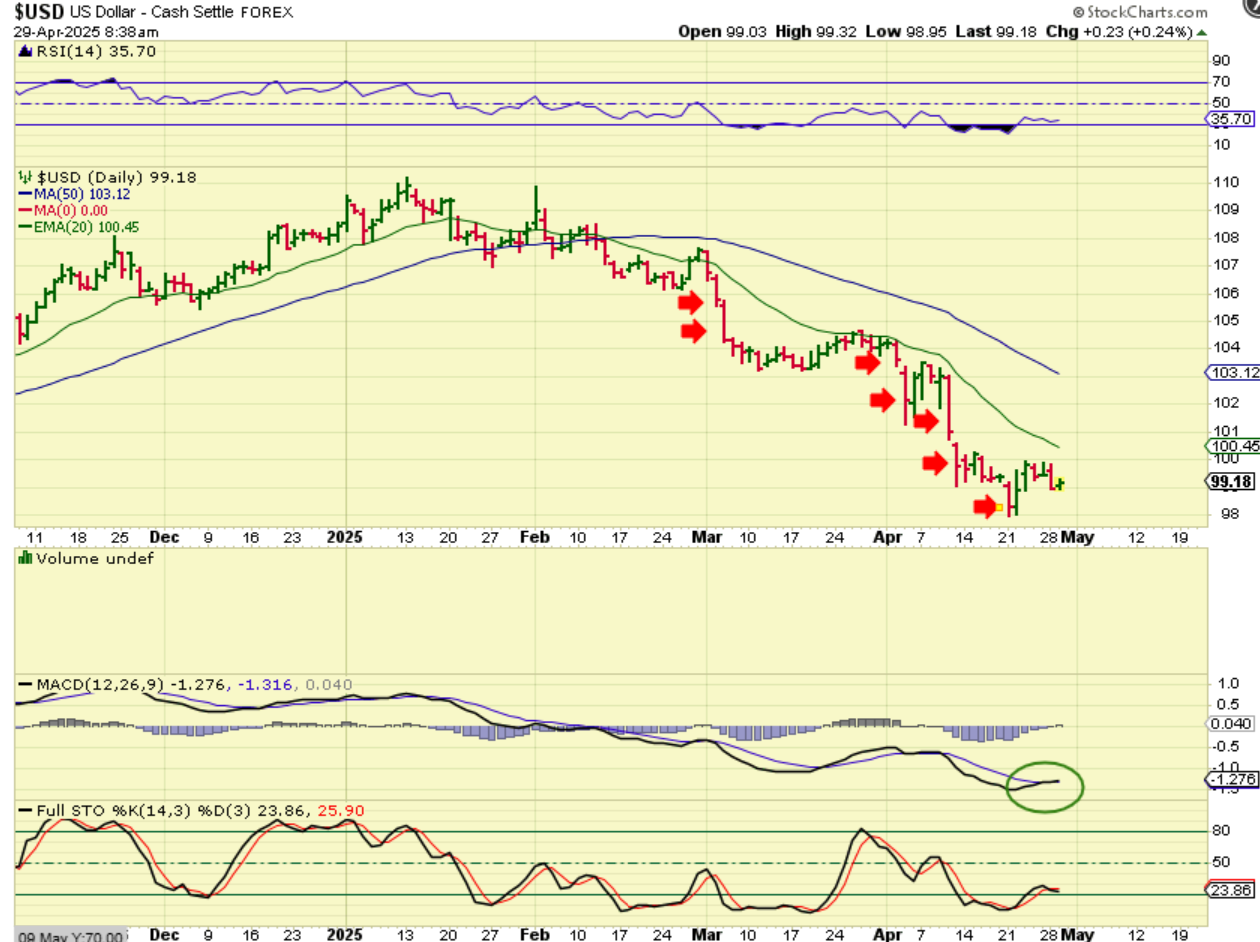
THE USD is due for a dcl and this may be one, but it has been quite weak and needs more time to get above the 20 ema (or not). Golds inverse relationship may be back in play, so if the USD runs higher, Gold MIGHT dip into the next dcl.
.
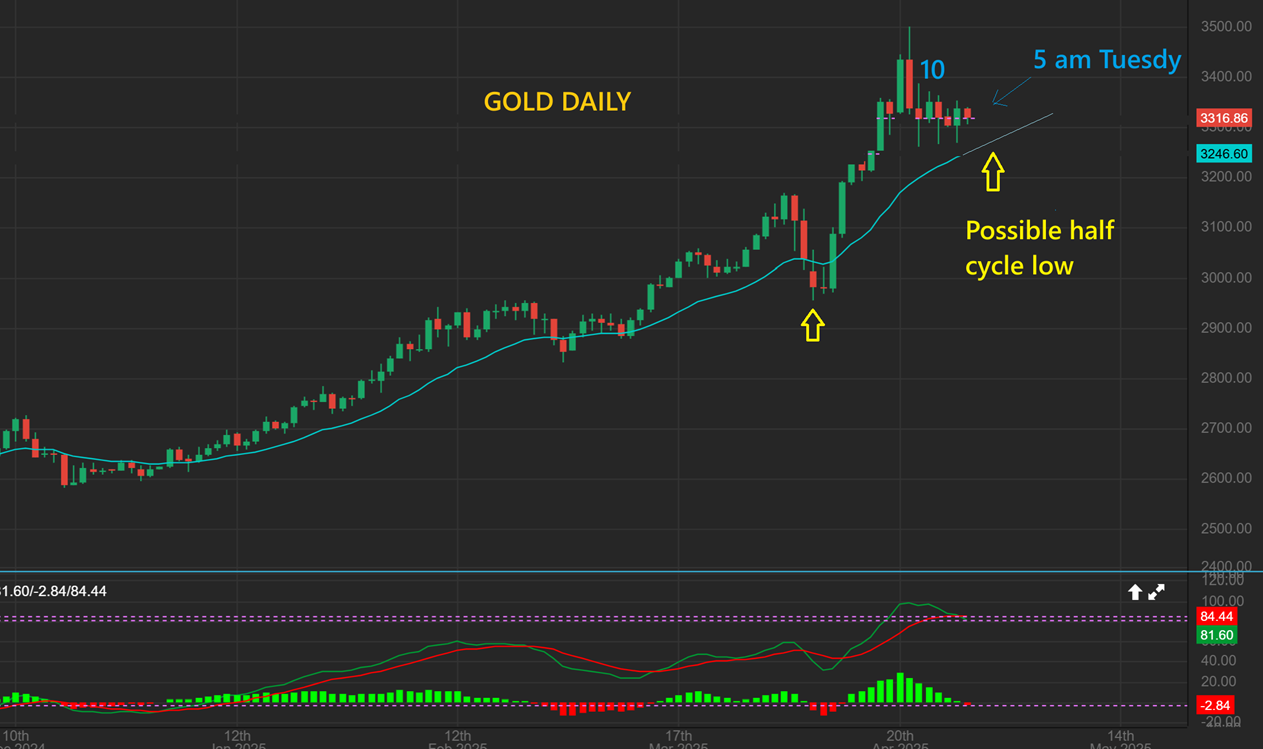
GOLD SPOT DAY 16 – When I look at Gold however, it is crawling sideways and is not selling down below the 20 ema. It is possible that it is forming a half cycle low and could make one more run to a new high into day 20+ or it may do a double top. At a glance, I think that this looks more Bullish rather than weak.
.
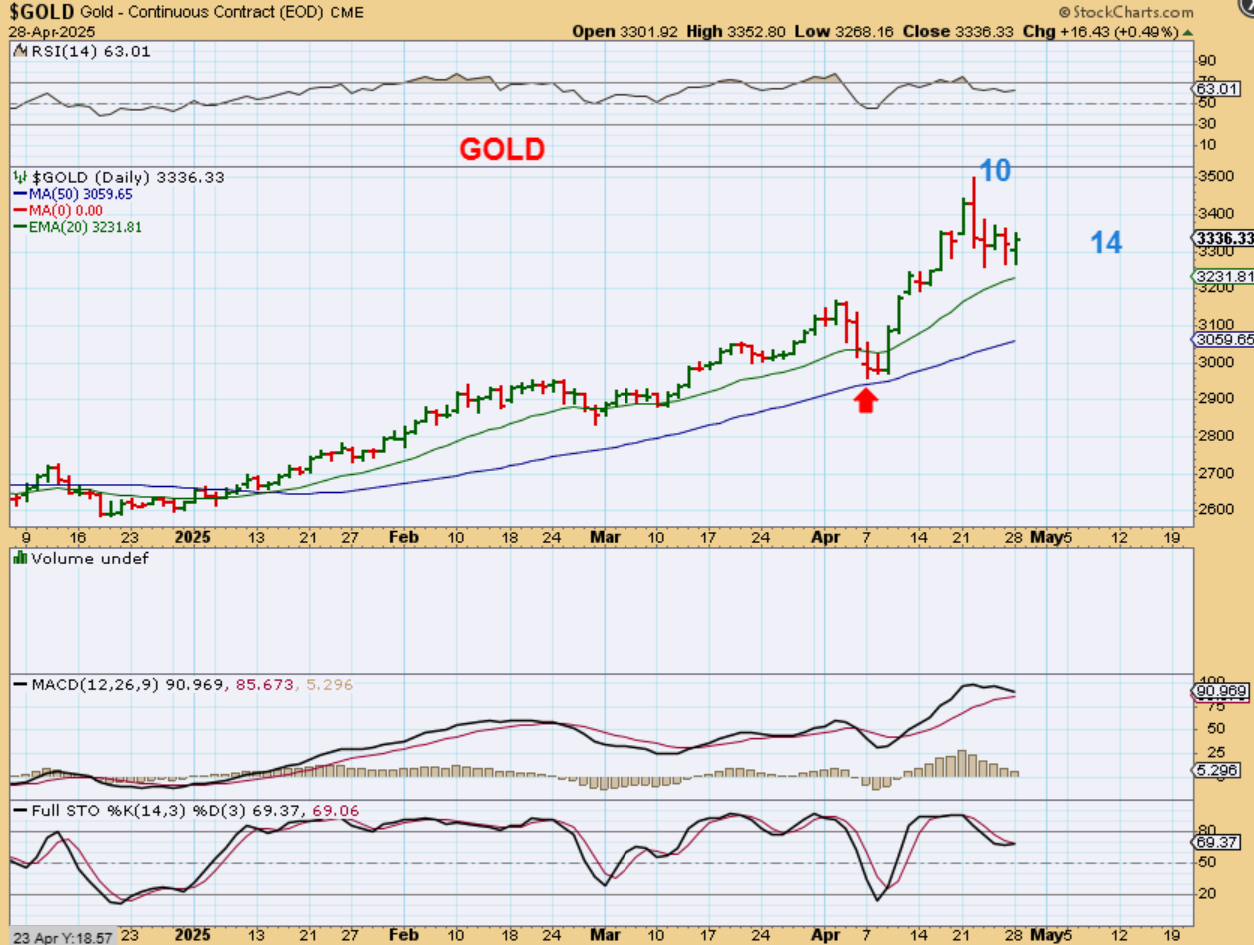
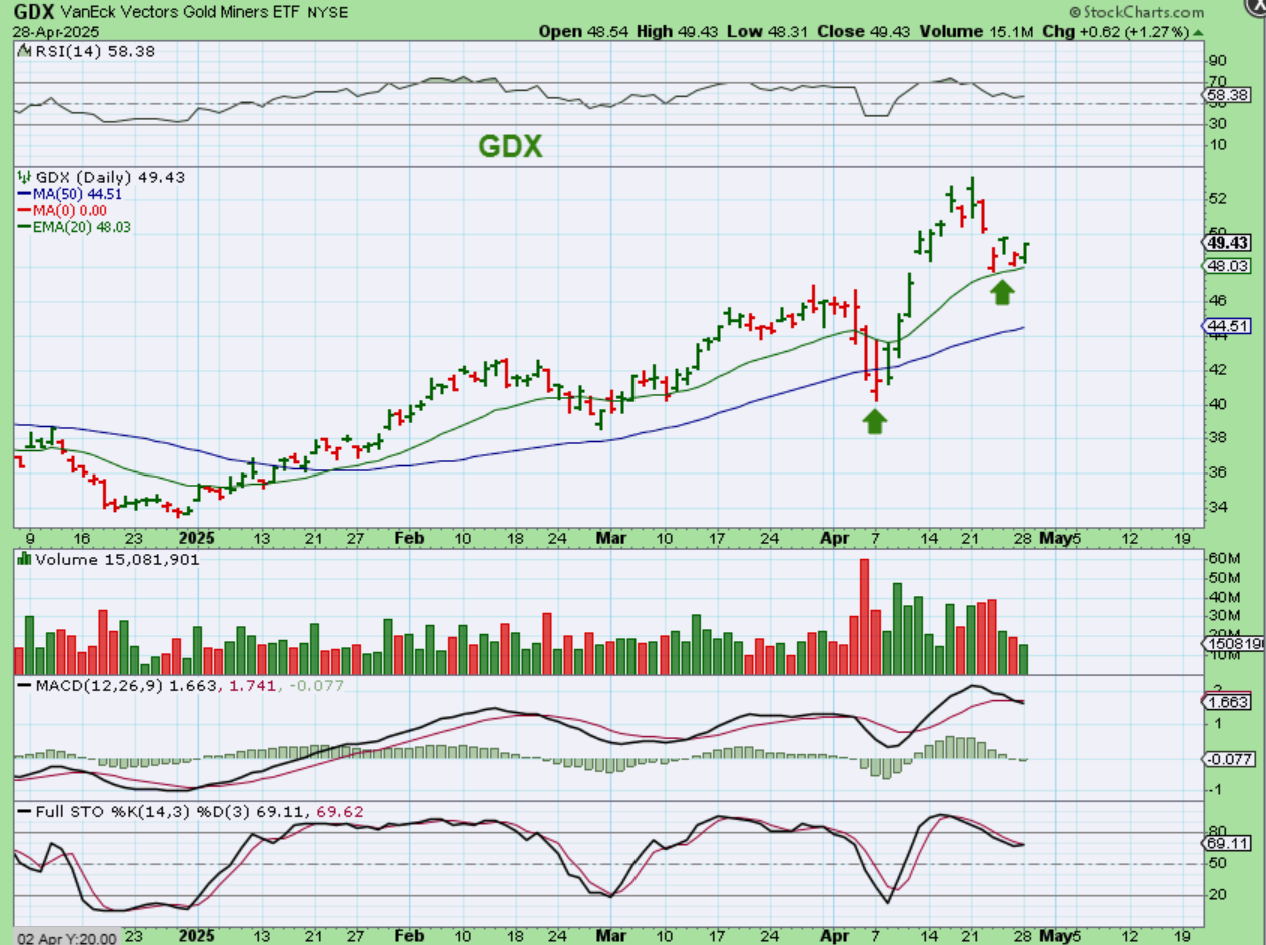
I wanted to point out the count again on Stockcharts for GOLD, because it is different than Spot Gold. Here it was day 14 on Monday and also looks like a possible half cycle low with available ‘time’ to possibly run again. GDX also still looks similar to Gold.
.
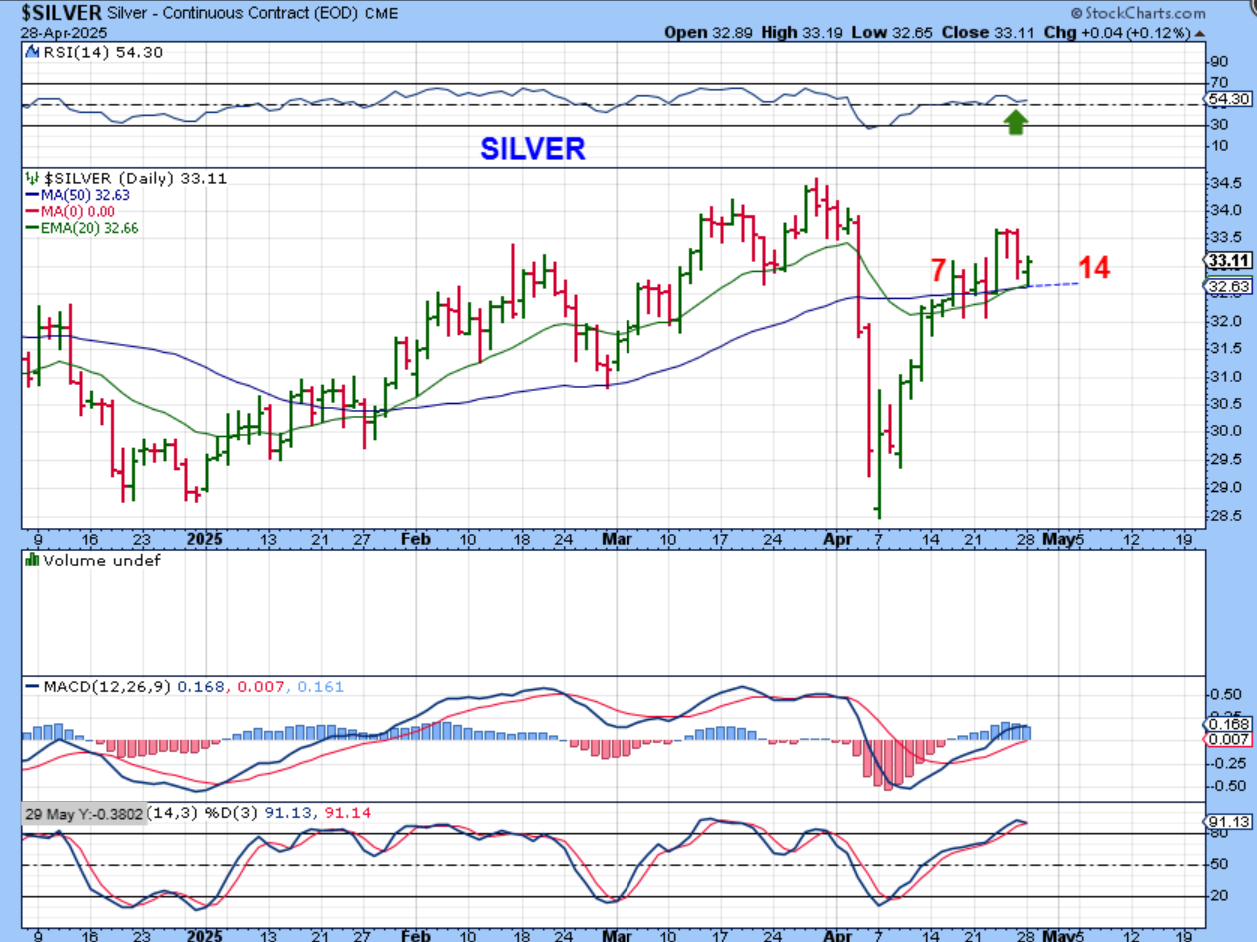
SILVER turned higher at the 50sma. Most Silver stocks do not look as good as Silver yet, but I do think that some Gold stocks look as good as Gold.
.
GDX looks as good as Gold, and this may be a half cycle low for the Miners. Something like this can be bought with a stop.
.
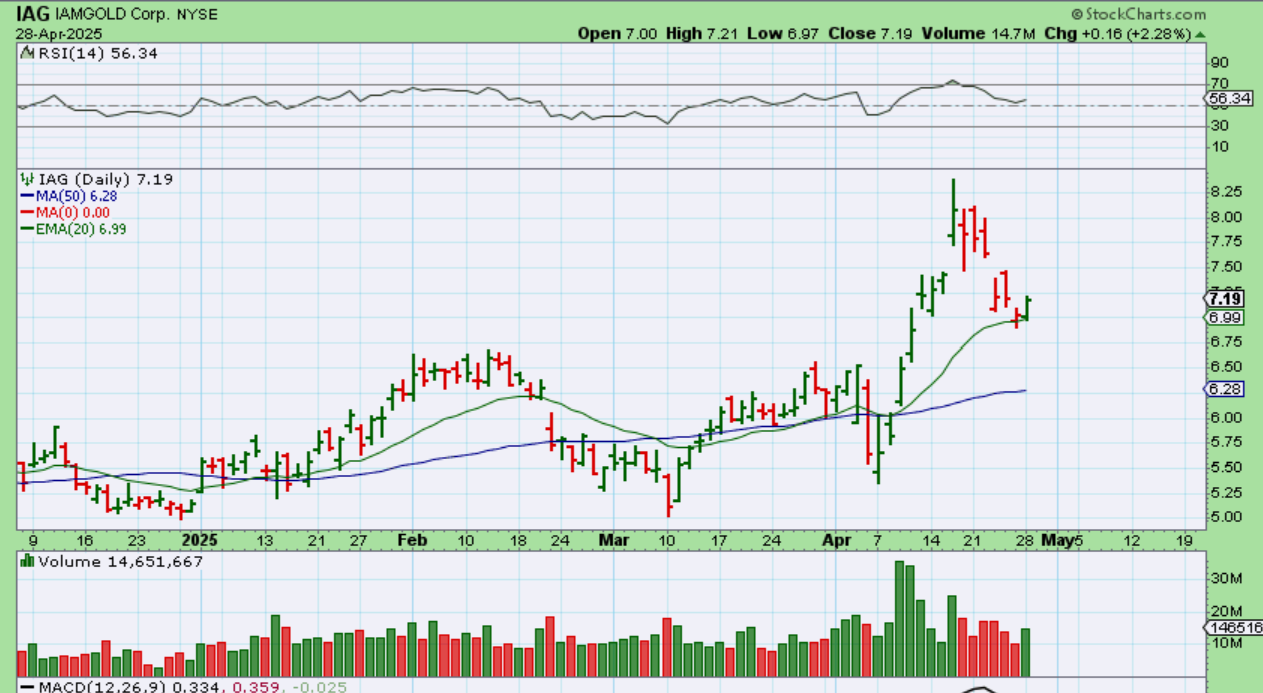
IAG curled upward at the 20 ema.
.
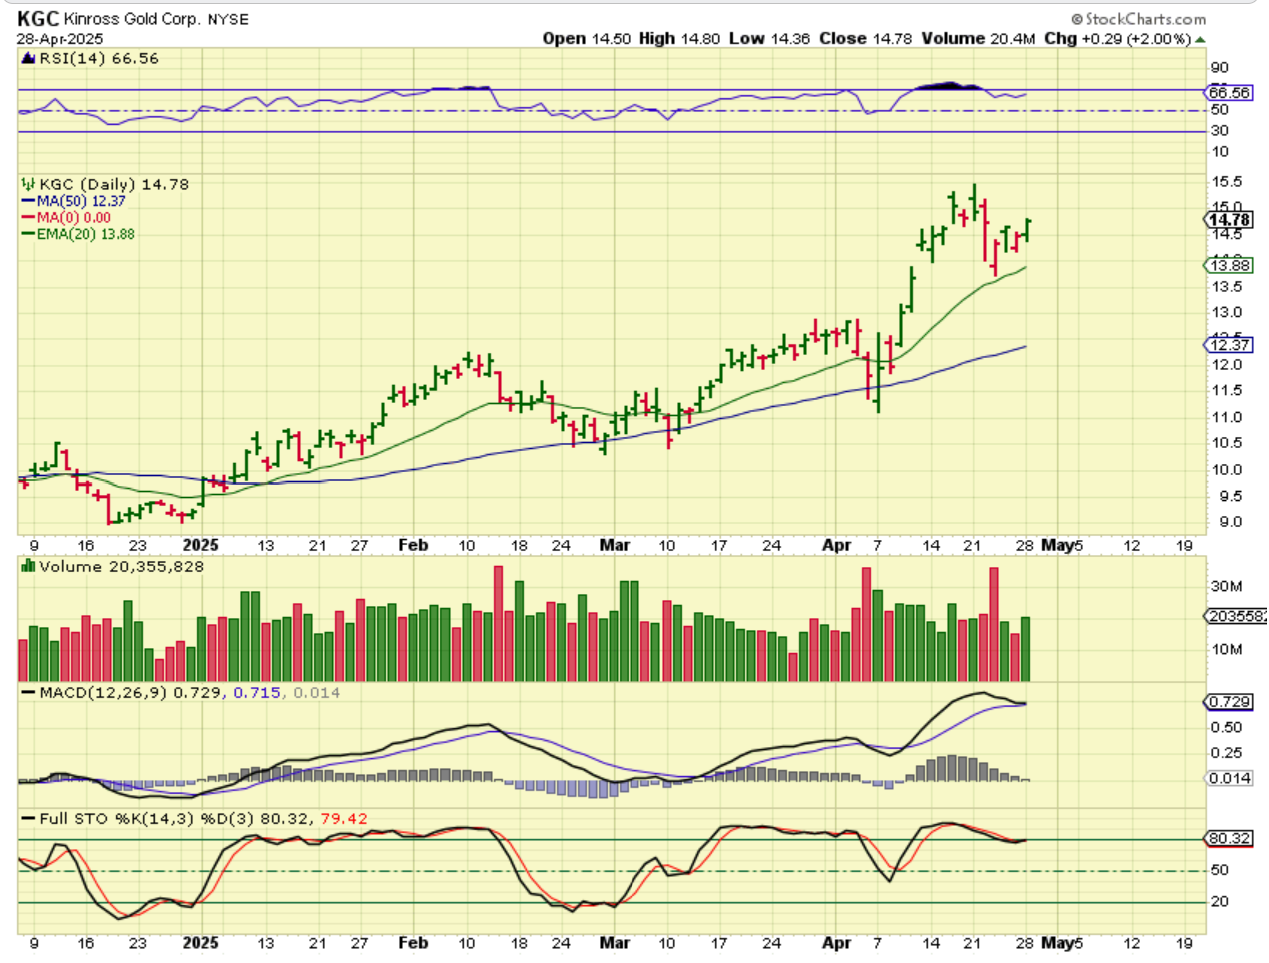
KGC reversed there last week and is slowly climbing higher, so the set ups are bullish at this time.
.
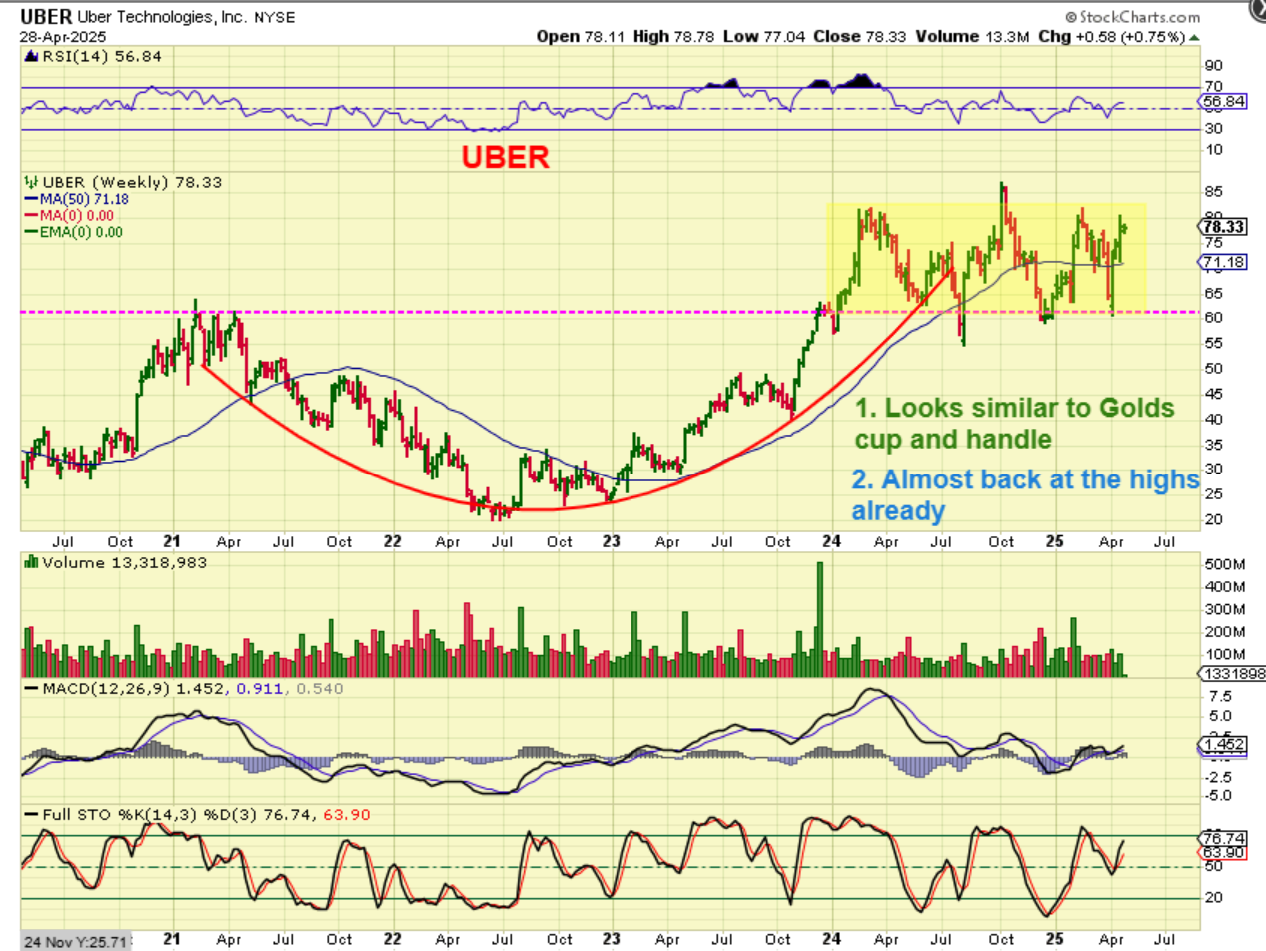
I want to share with you something that I have discussed and view as important during times of uncertainty, massive fluctuation, and ongoing change in the markets. When you are looking for clues about a chart / company that you may be looking to buy, flip it to a Weekly Chart. Take a look at UBER, for example. The general markets had that April 7 slam down low and after that, Uber ran back to the highs. Now it looks similar to Golds cup and handle before it broke out. Very Interesting.
.
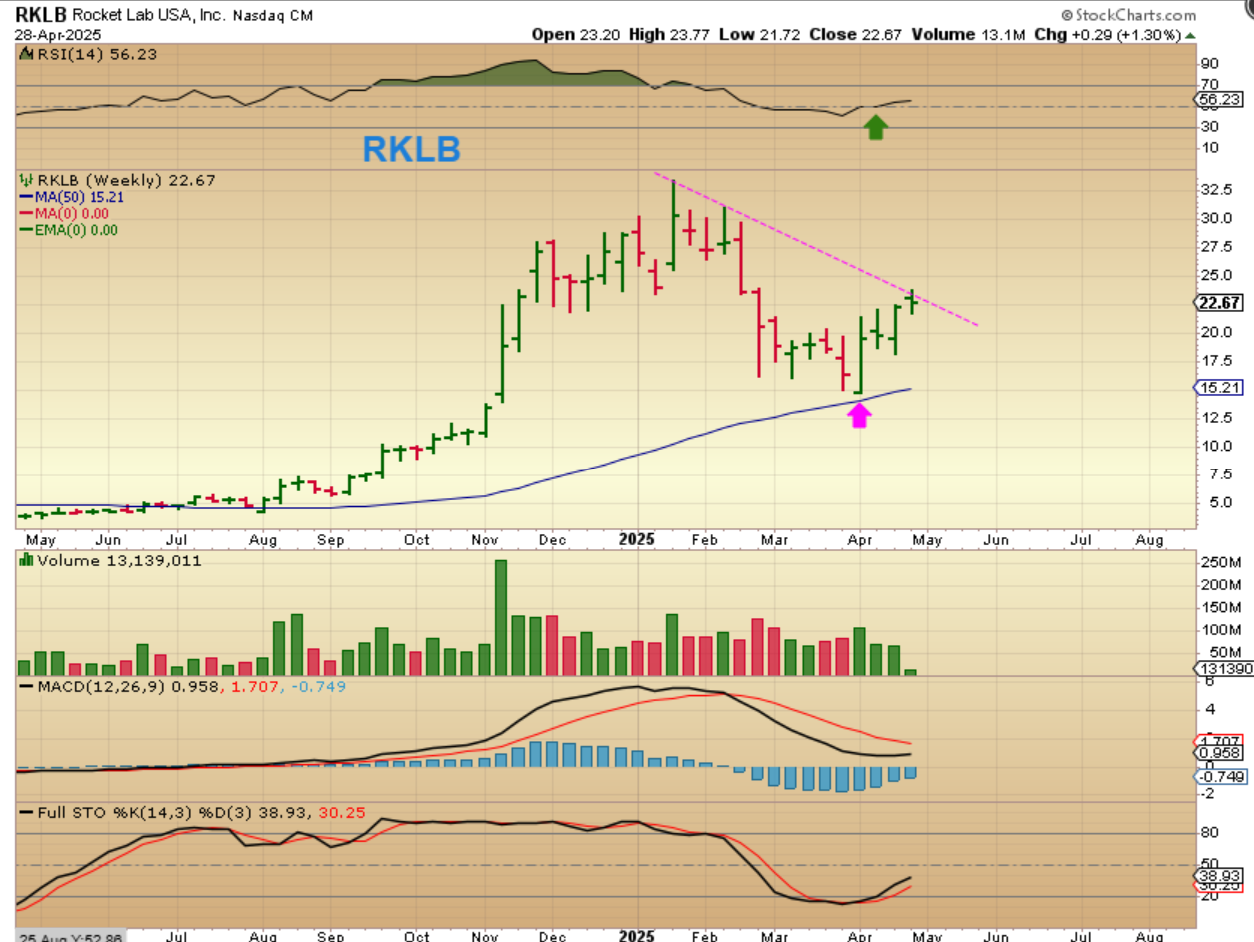
One of my former favorites is RKLB: It has reversed and moved from $15 to almost $24 already. With that, I would look at a daily chart and look to Buy the dip when we get a half cycle low or pull back to support.
.
As I look at some Tech stocks, General Market stocks and now Bitcoin and even some crypto stocks, I am seeing charts that are changing from bearish ‘crash down’ charts on April 7th to more bullish looking charts, especially the weekly charts. I am going to write up something important for Bitcoin below, so please don’t miss it if that is a sector that interest you. Enjoy your Tuesday trading!
.
~ALEX
.
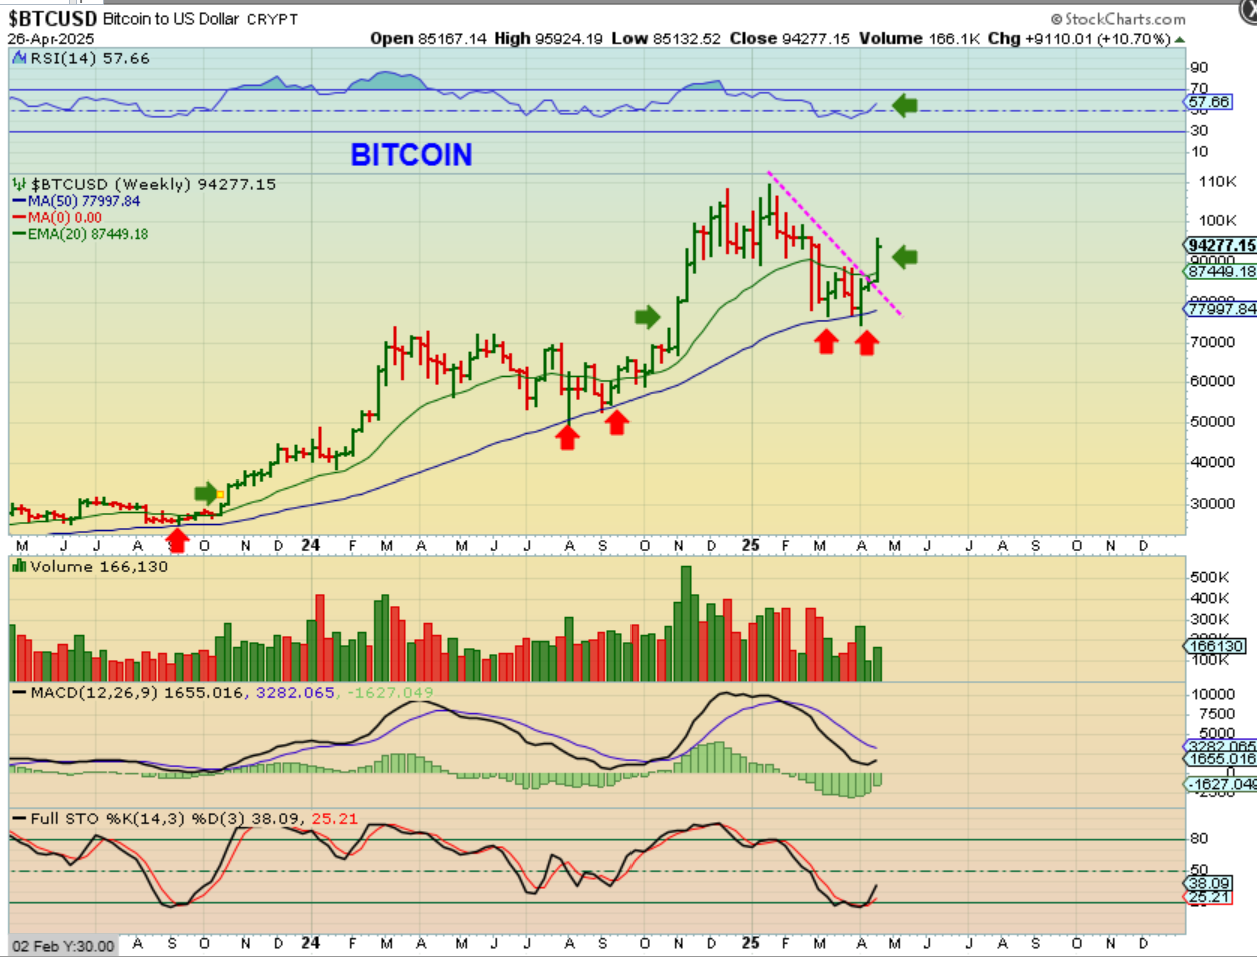
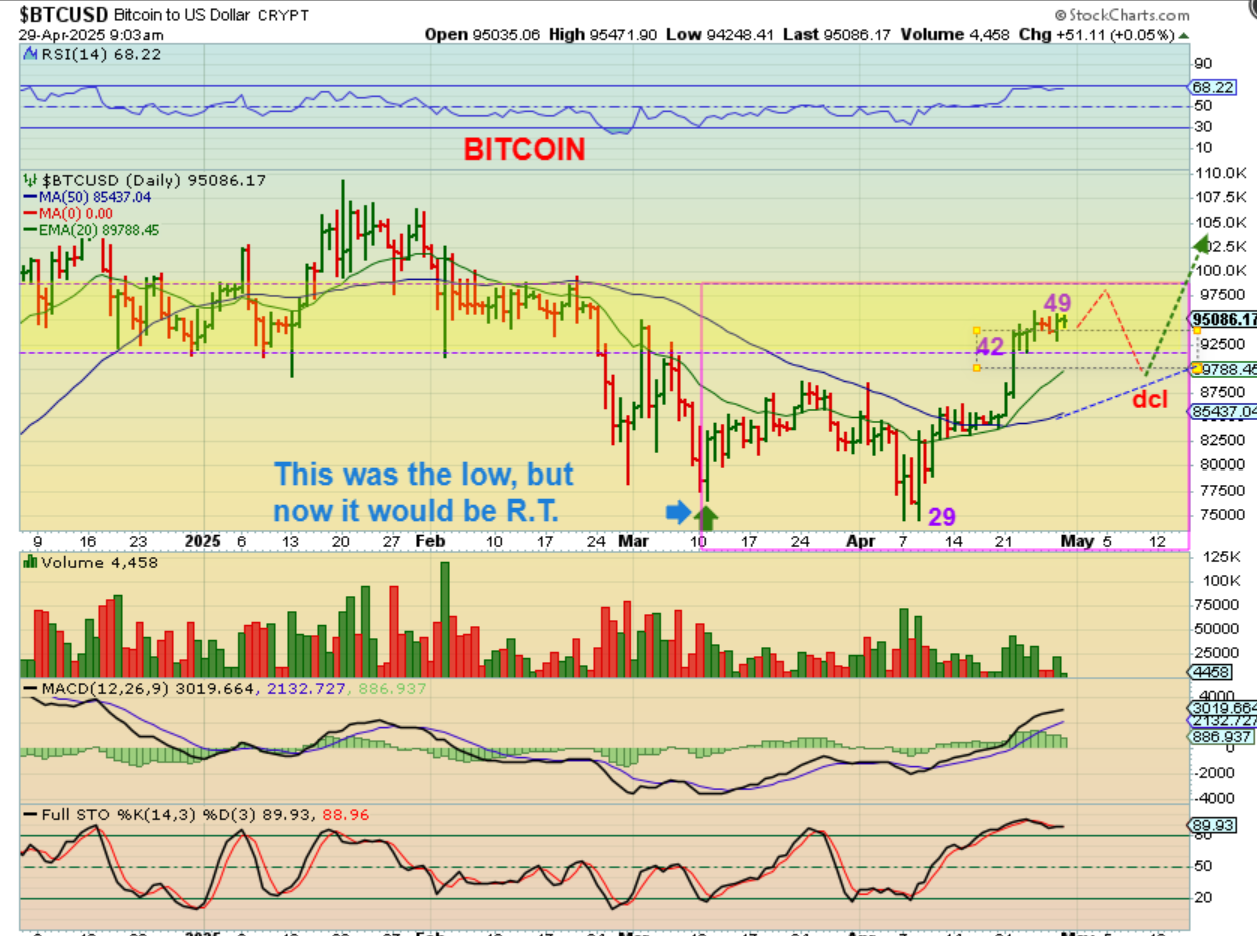
BITCOIN: Recently I have been showing that the Weekly Chart of Bitcoin was actually a bullish set up, and then it broke out. This might indicate a change has taken place. Why? Note that the deepest low was only 3 weeks ago. Is that an ICL, similar to what might be happening to the general markets after the usually steep sell off? It is possible.
.
BITCOIN is working through an area of resistance, and is above the 20ema. In the past, you can see that price would often dip to that point, so we may see that in the near future. Let’s discuss the cycle count with that possible dip in mind…
.
BITCOIN 1. We saw the low come into place in March and it was right on time.
2. It is important to me to note that after the March lows came into place for the general markets, then they crashed into that day 17 low due to tariff talk and uncertainty.
3. Bitcoin dipped then too, only making a slight new low, but the question now is: IS BITCOIN IN SYNC with the general Markets? Or…
4. Did that become an ICL in April? I ask because Bitcoin broke a downtrend, made some higher highs, and is now very R.T. if we keep that count out of the march lows. THAT seems very important to me, along with the weekly chart.
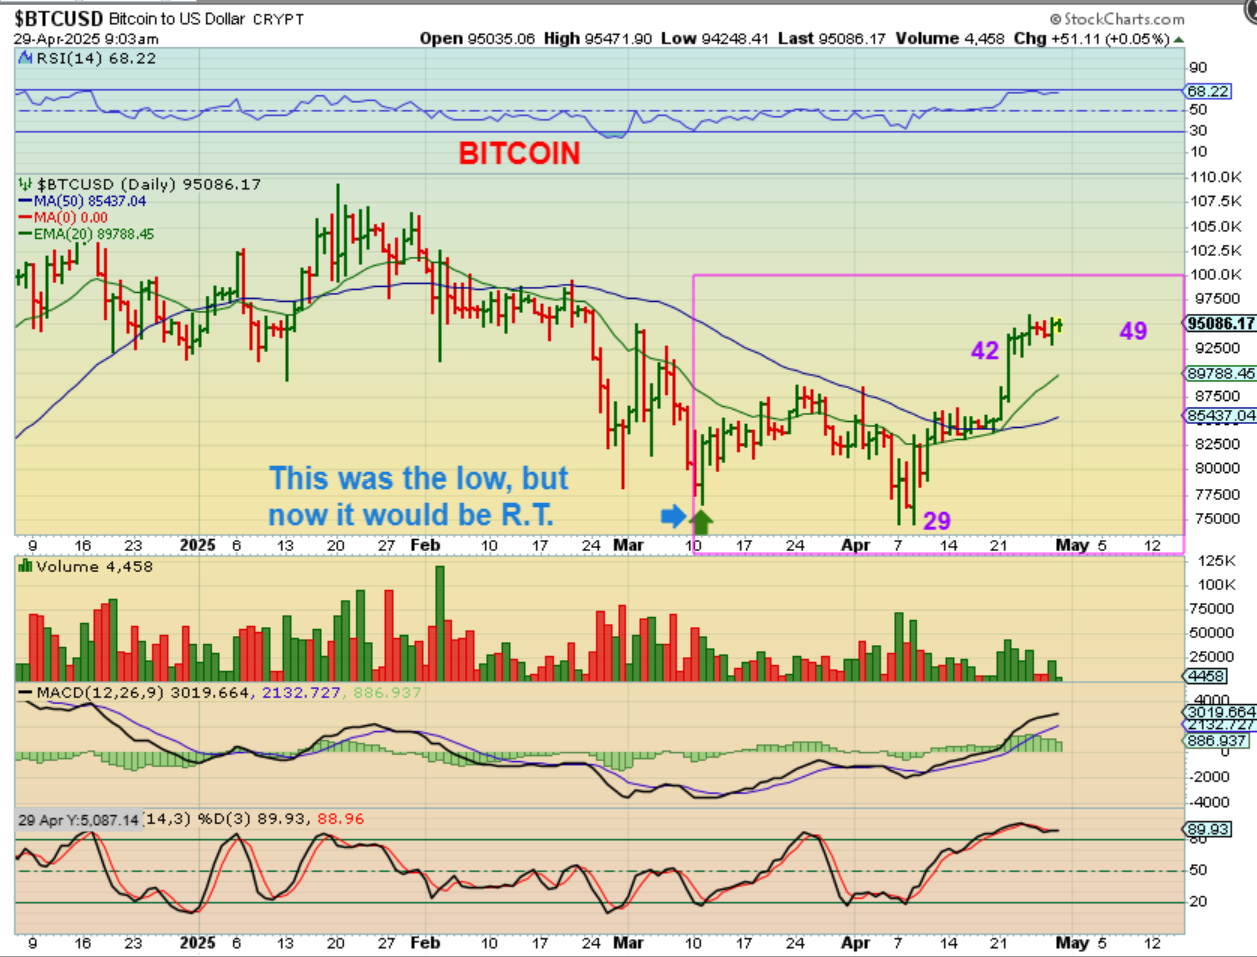
.BITCOIN If we keep the current count, we’d be due for a dip around day 60ish, so this would be very Right Translated and it might dip down to the 20ema, but that may be a very bullish pause if an ICL is in place. In a similar way that the Covid crash changed cycle counts, and it did back then, I think that the Uncertainty of tariffs and inflation, etc has caused a shift too. In other words…
.
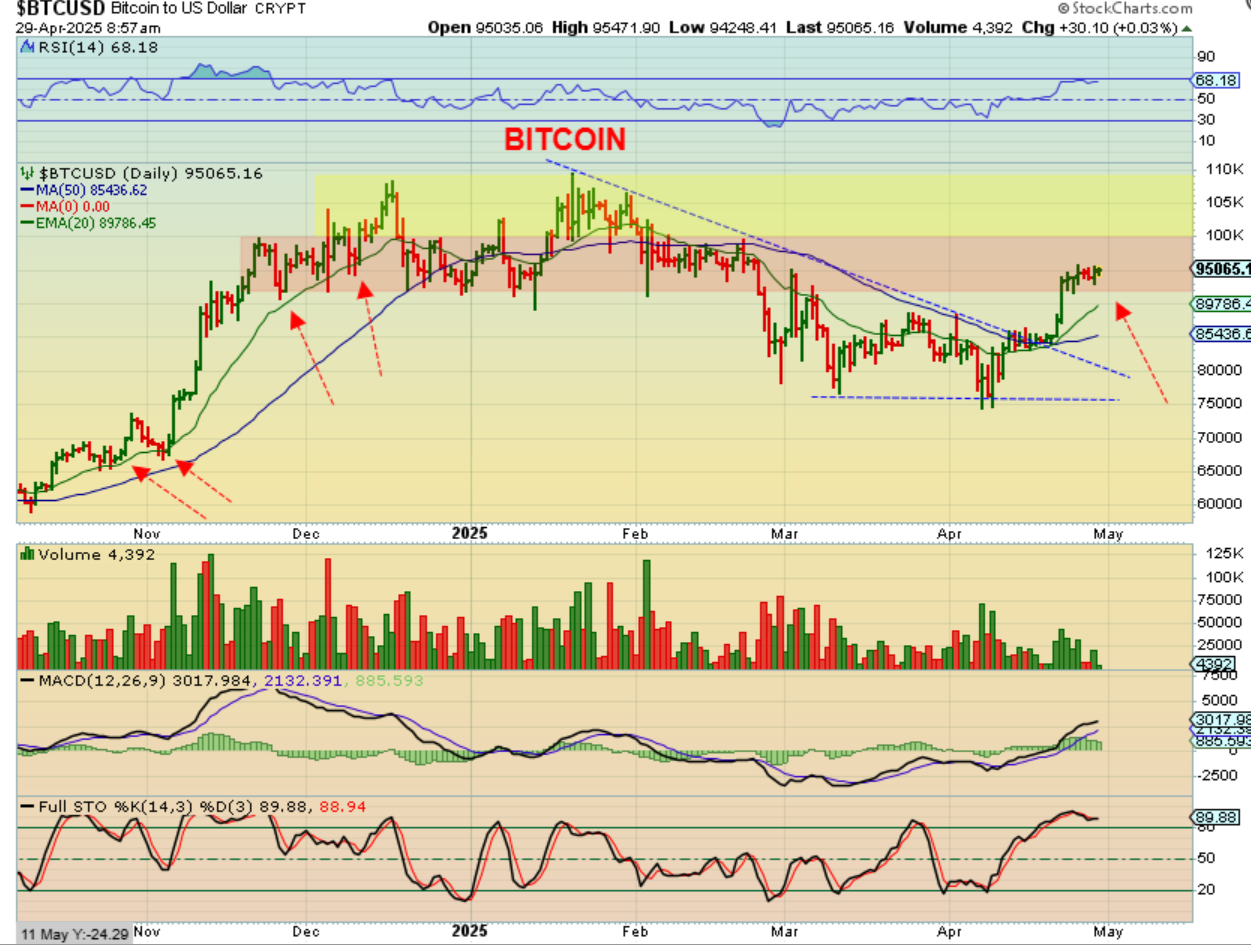
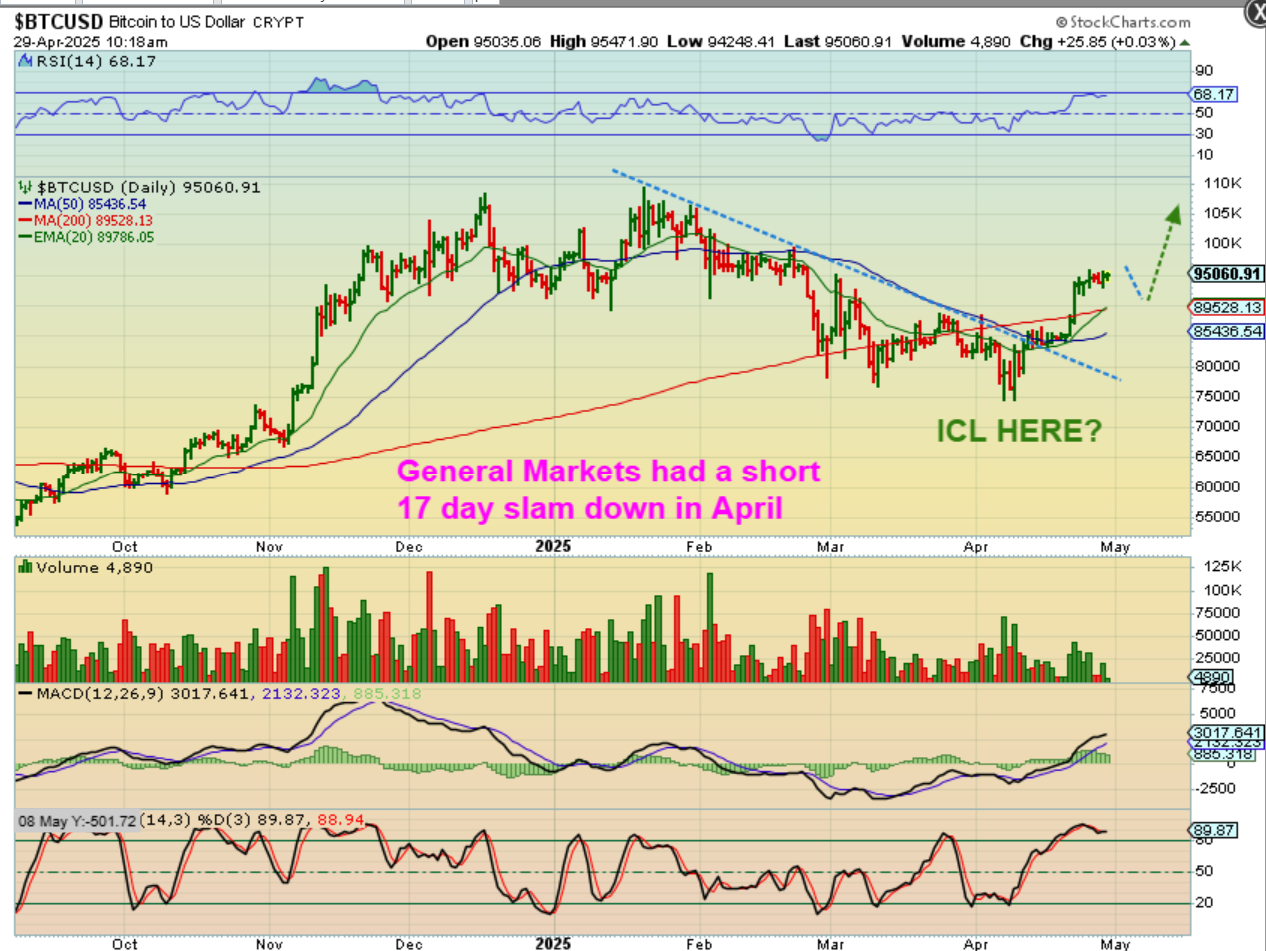
In other words, if we are saying that we had a shortened 17 day exhaustion slam down in April, and that became the ICL just like we saw in the Covid crash (an anomaly), then Bitcoin may actually have done a reset in April too. Look at April 7 on this chart with the new slam down low…
.
BITCOIN A low also formed in Bitcoin on April 7, so I am just going to watch this play out as bullish, because the weekly chart turned bullish, and now the daily chart turned bullish when…
1. It broke the trend line & regained the 200sma
2. started making higher highs / higher lows
3. Became Right Translated.
.
BTDR: I was running through some of the crypto stocks weekly charts this weekend, and you can see that some had a very big week moving out of the lows.
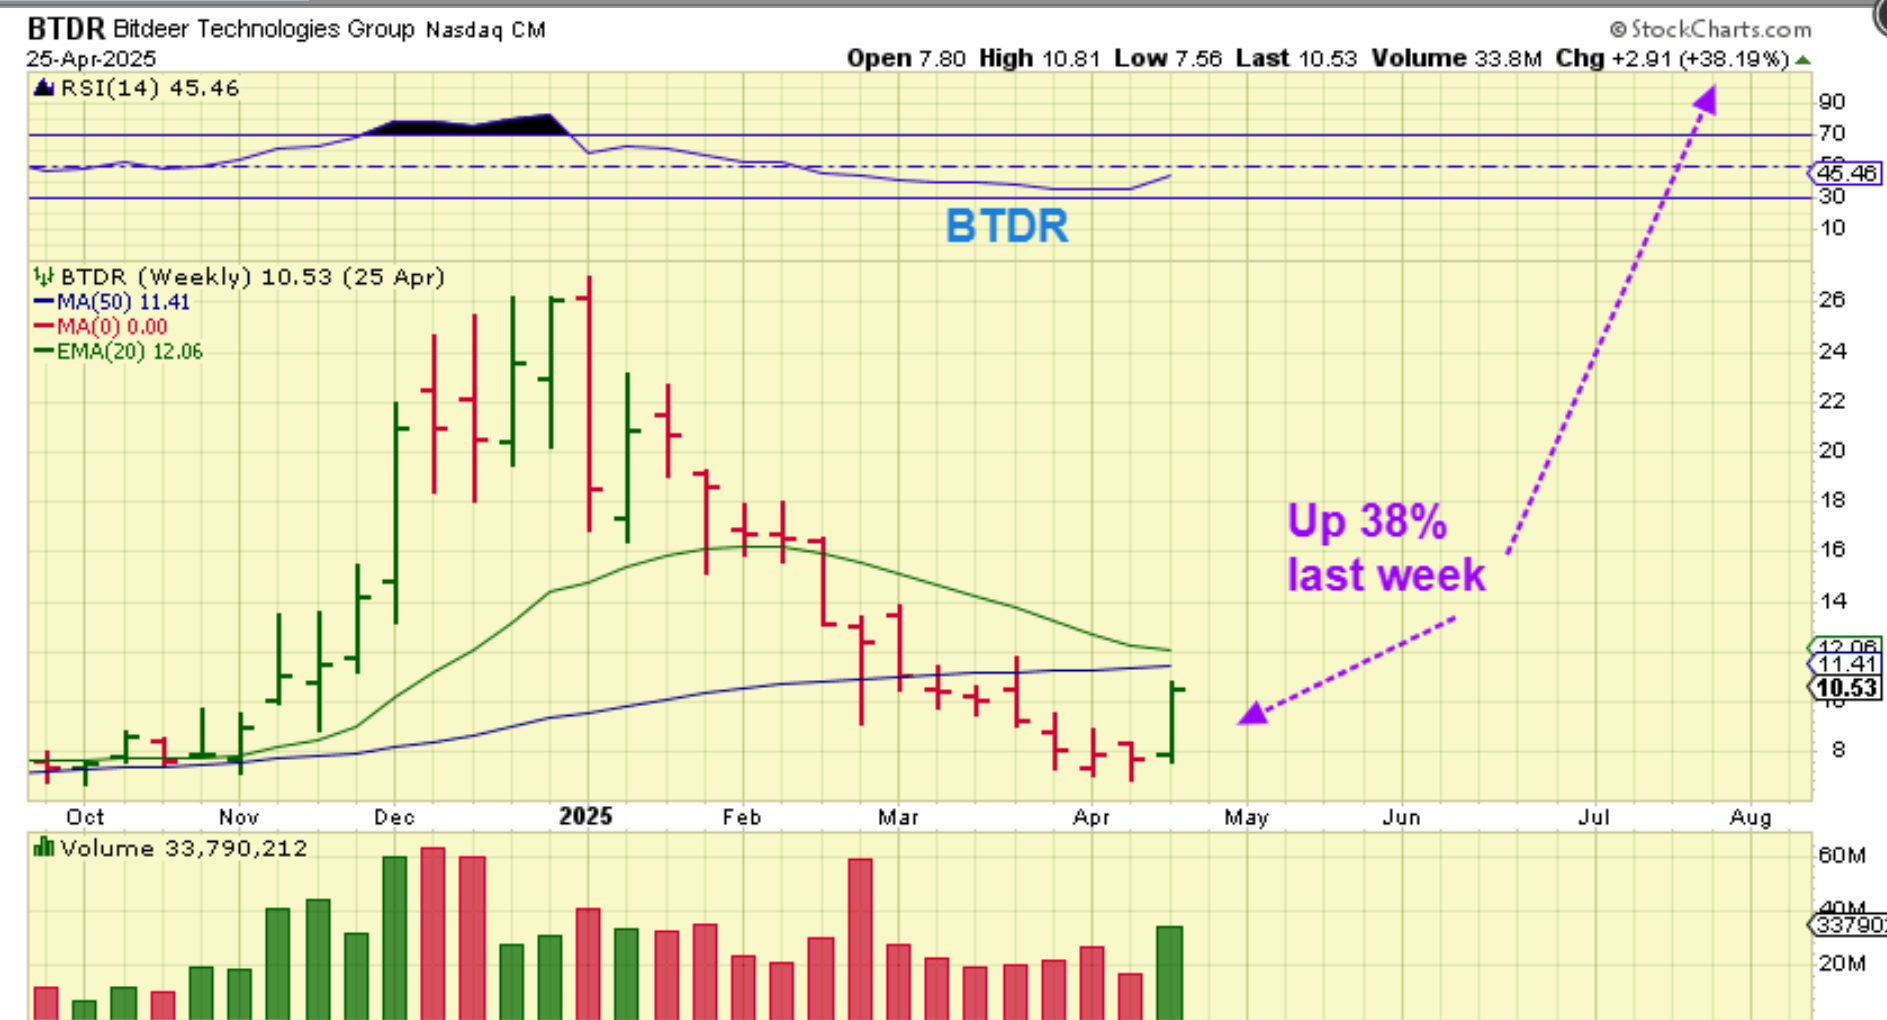
.
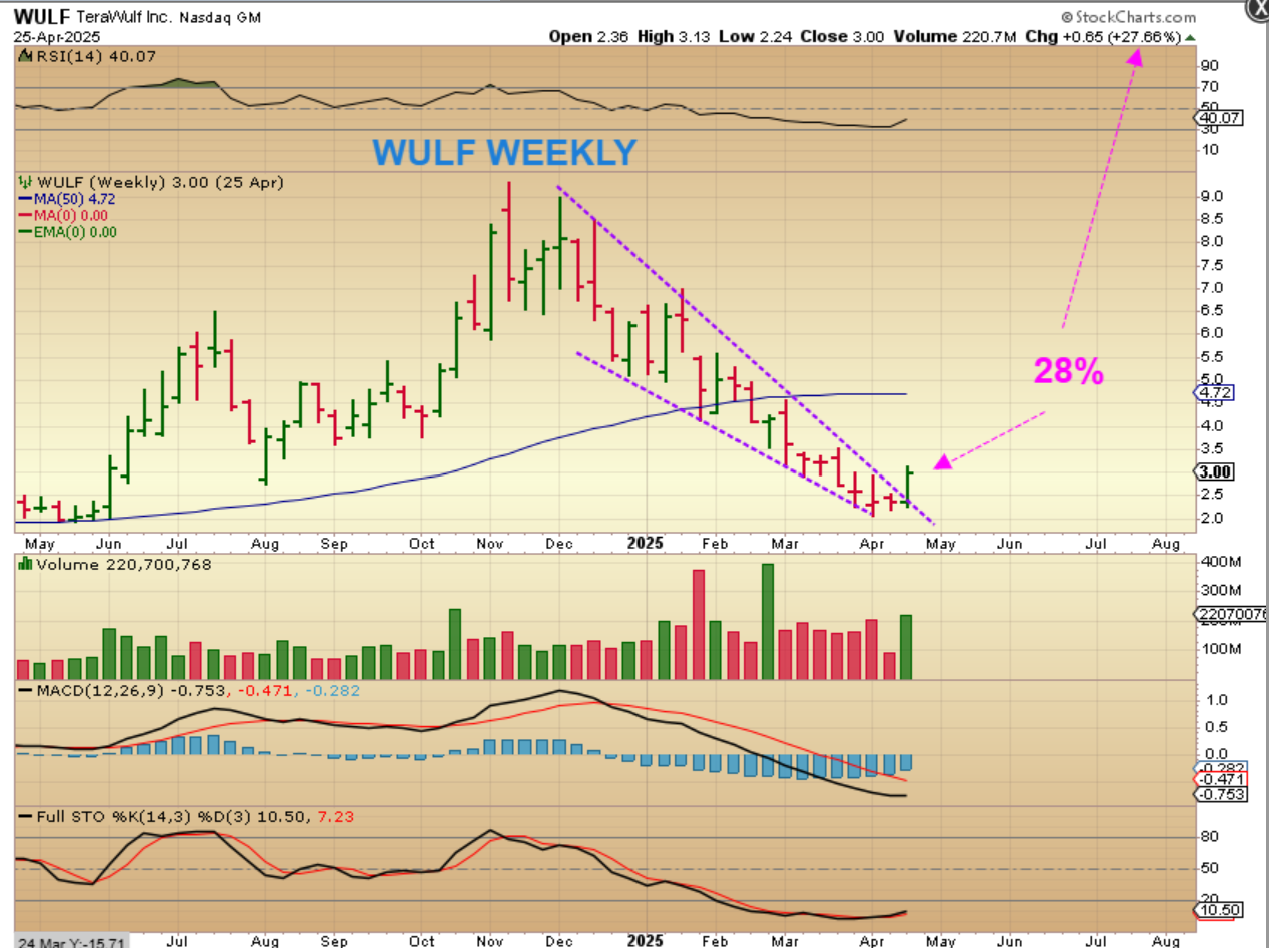
WULF: Wulf was also up almost 30% last week. They can pull back this week and then move higher again, or they can just continue higher, but it is noteworthy that they may have bottomed near the APRIL 7 low too.