Friday April 11th – Bounce
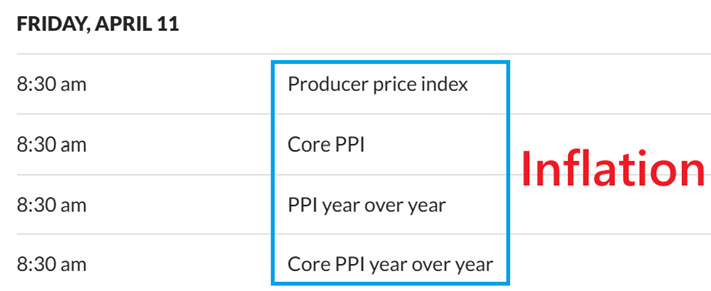
Thursdays ‘Inflation Data’ actually (and surprisingly) came in on the tame side. Today we have more data on inflation, so we’ll see if that matches what we had on Thursday. Also, China announced an increase to their tariffs too, now at 125%. That could hinder the markets bottoming progress too, we’ll see.
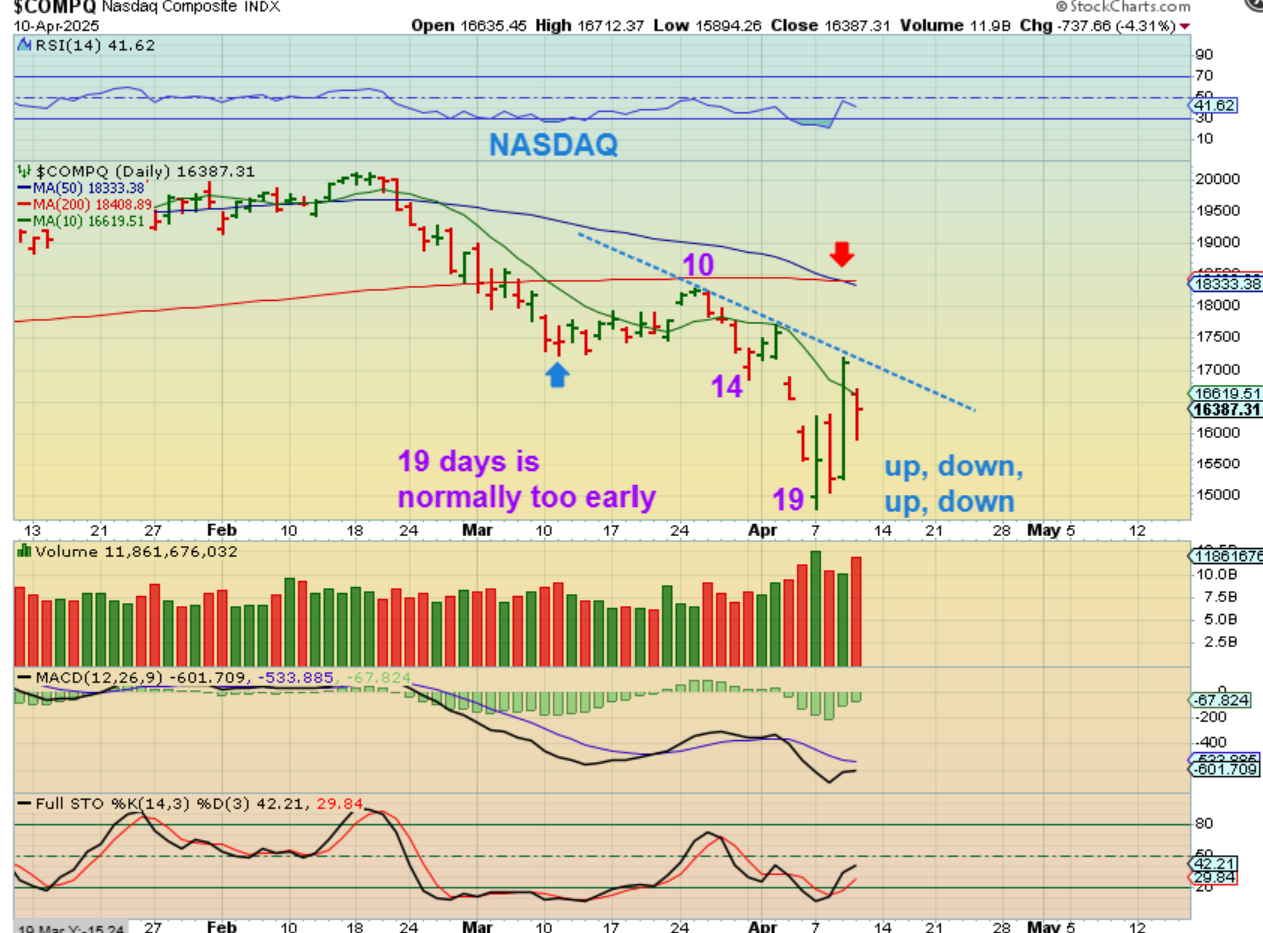
Starting with the NASDAQ, I just wanted to show what kind of a bottom or ‘bounce’ we currently have. This is not a short covering V-Bottom, as I had hoped for. This is the more difficult chop up and down, up and down. THIS CAN CHANGE, but for now this is what we have as a result of indecision and environmental change. Also…
.
Also a day 19 low is usually only a half cycle pause, so we would normally expect another leg down. That said, I’ve pointed out that 18 day drop in 2023 that became THE low, so with such an extreme flush here, this could become the lows if certain bullish conditions are met and markets can stabilize.
.
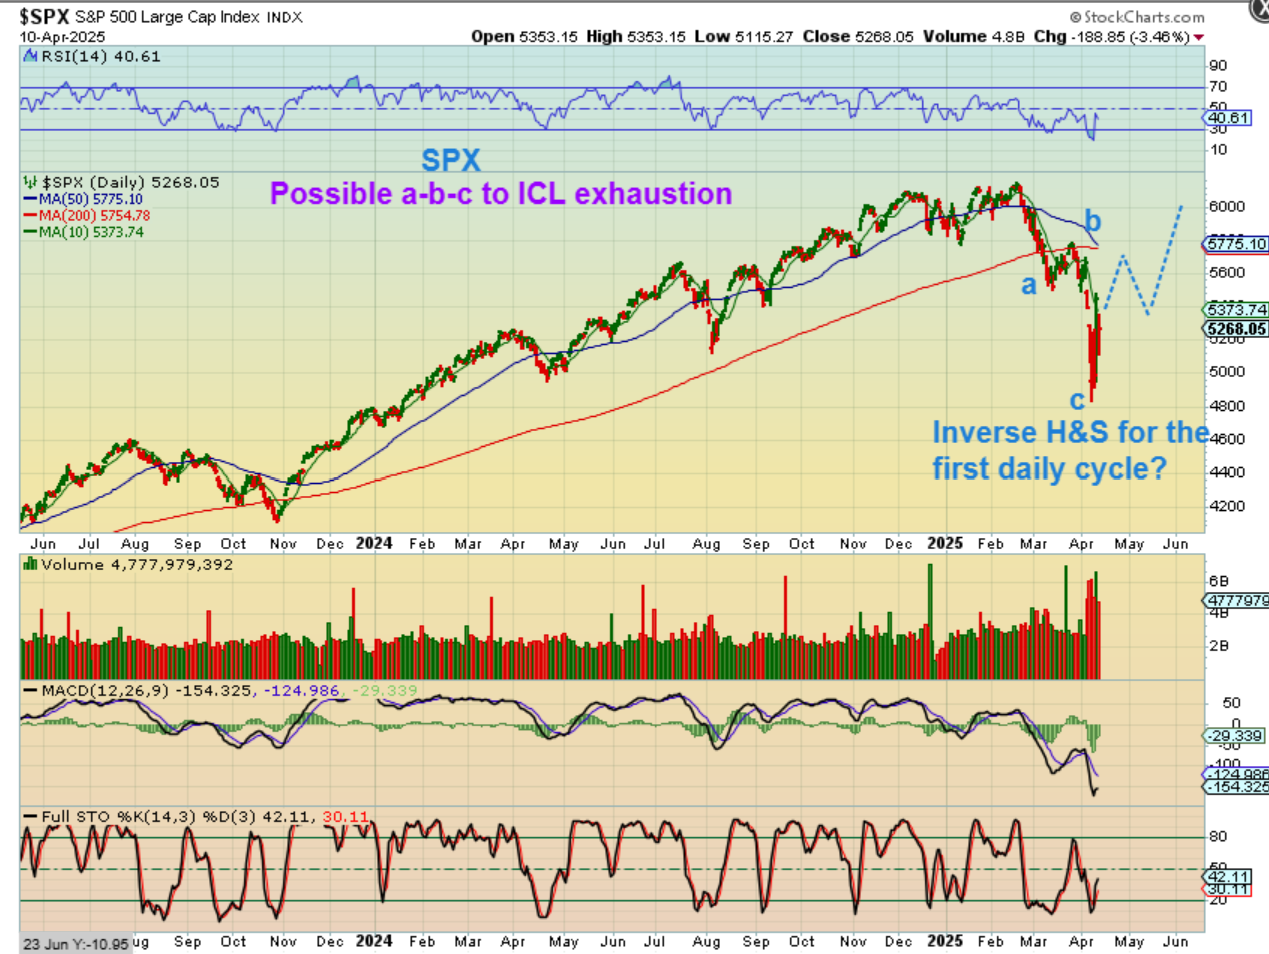
SPX #1: Having this become an A-B-C down that exhausts selling and forms an ICL, we could see the first daily cycle form a ‘shoulder’ to an inverse H&S. The markets would become more bullish, possibly if ‘tariff pausing’ and ‘ international negotiations’ become less impactful on earnings, etc.
.
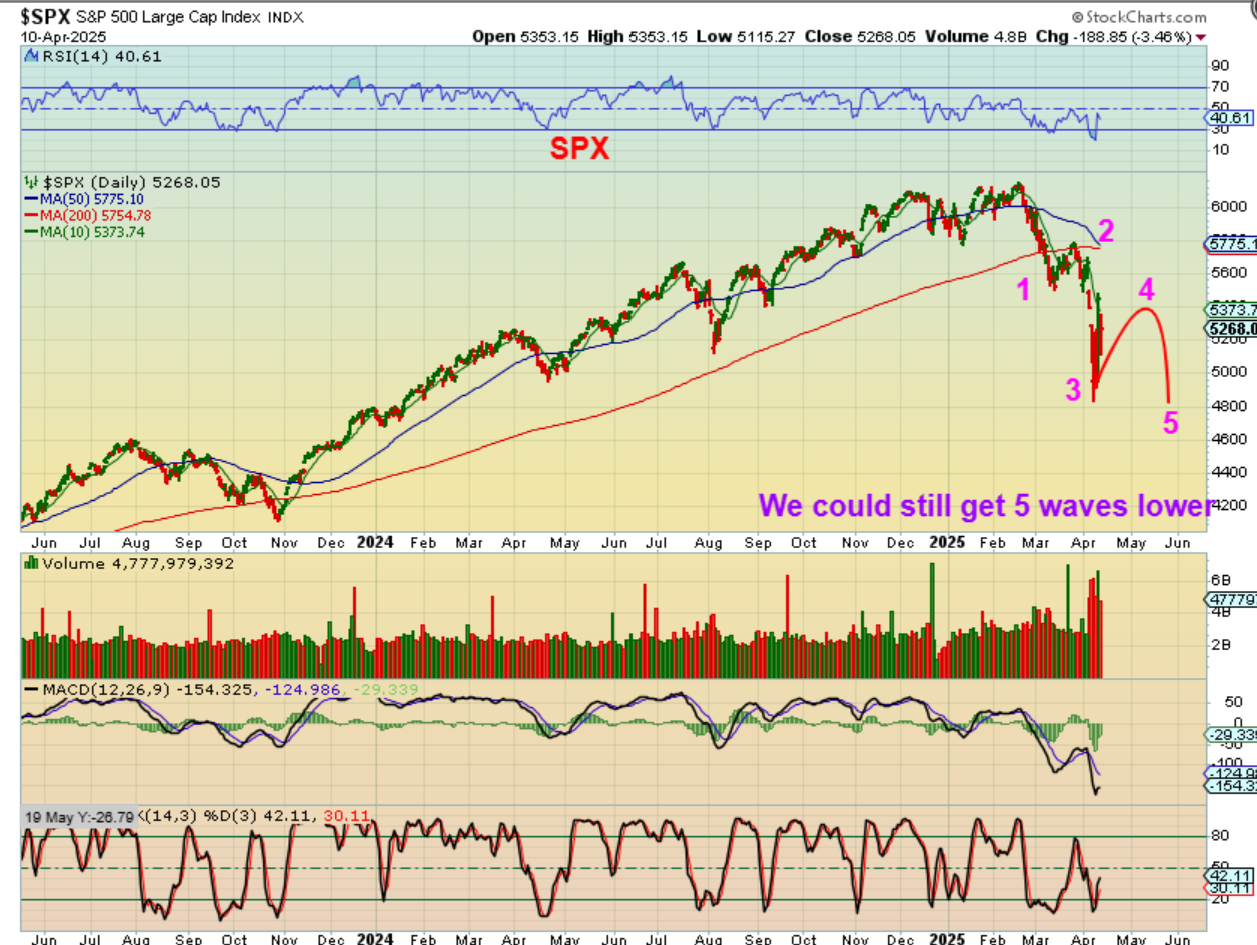
SPX #2– Of course, the current environment being quite unpredictable, we could see a bounce now and then that next leg down that I have pointed out in past reports too. This would change our a-b-c to a 5 wave drop.
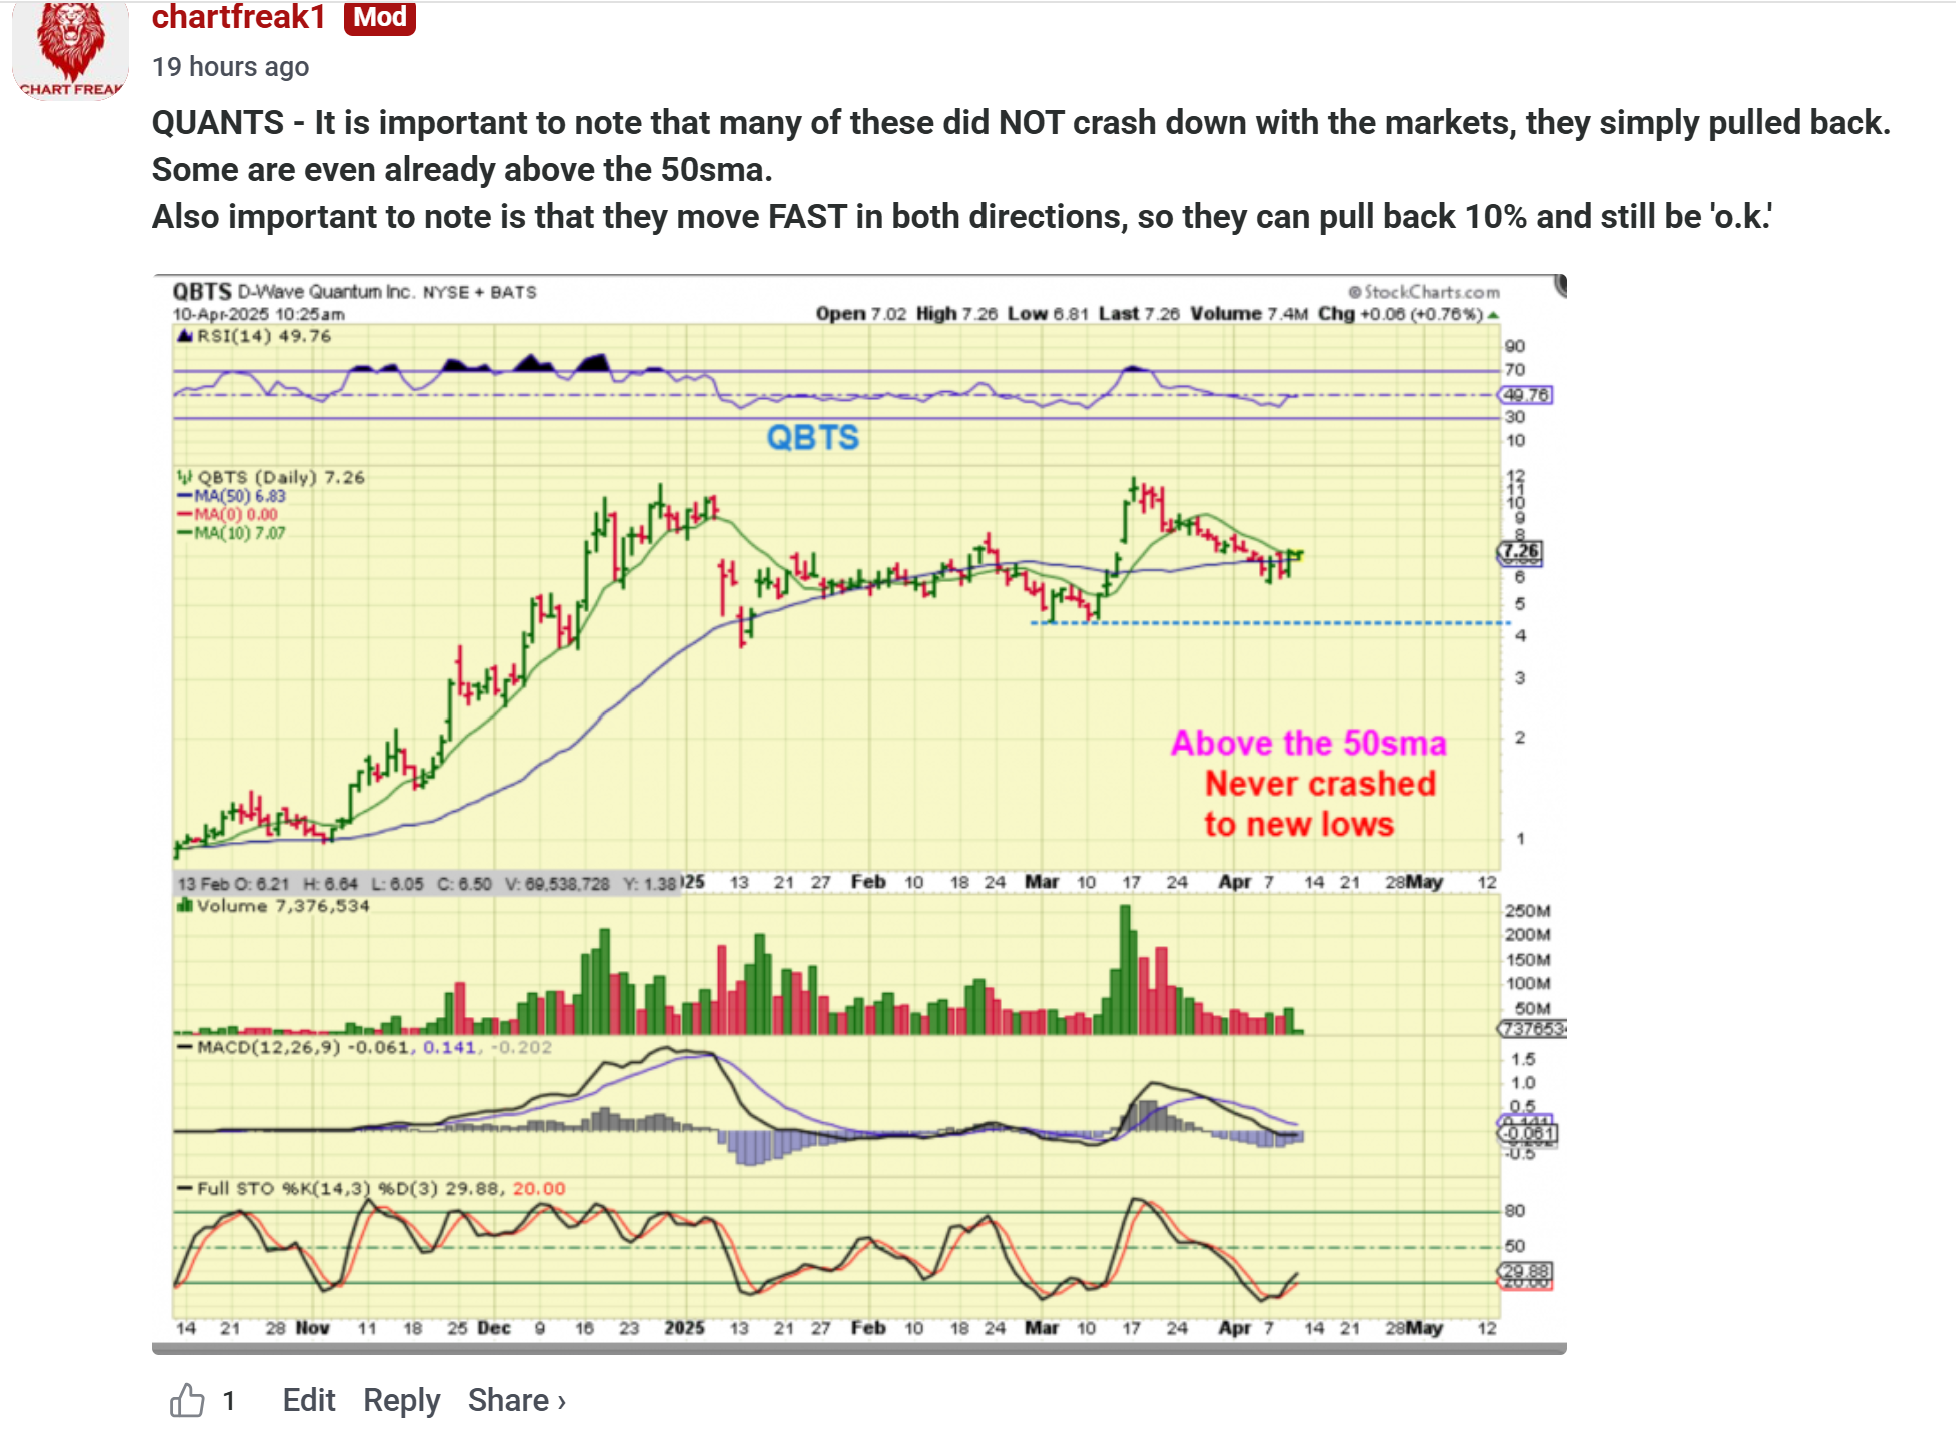
I just wanted to mention that if you check out the ‘Quantum Stocks’, you may be surprised to see that many have higher lows during the markets crash. I put this in our comments section as an example.
.
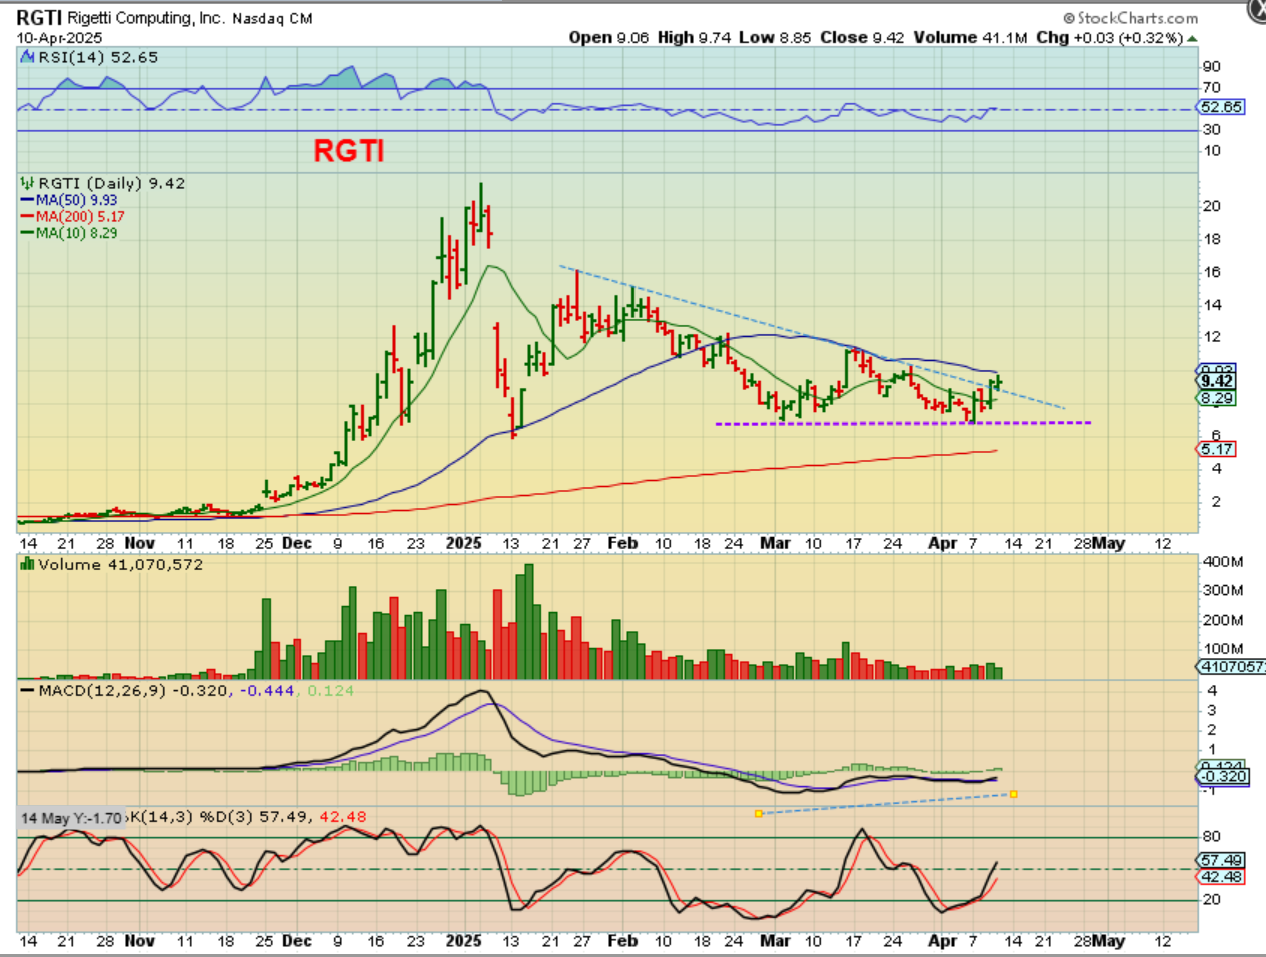
RGTI is another example of a quant company that does not look like it is crashing down viciously in a bear market from February to now. Yes, it did get cut in half though, from $14 to $7, but it seemed to stabilize a bit sooner over the past 2 weeks. It is now at resistance and if the markets do 5 waves down it could drop to $7 again, but I think that would be a nice buy. If the markets A-B-C drop is the final low, then I think that this was the final low too.
.
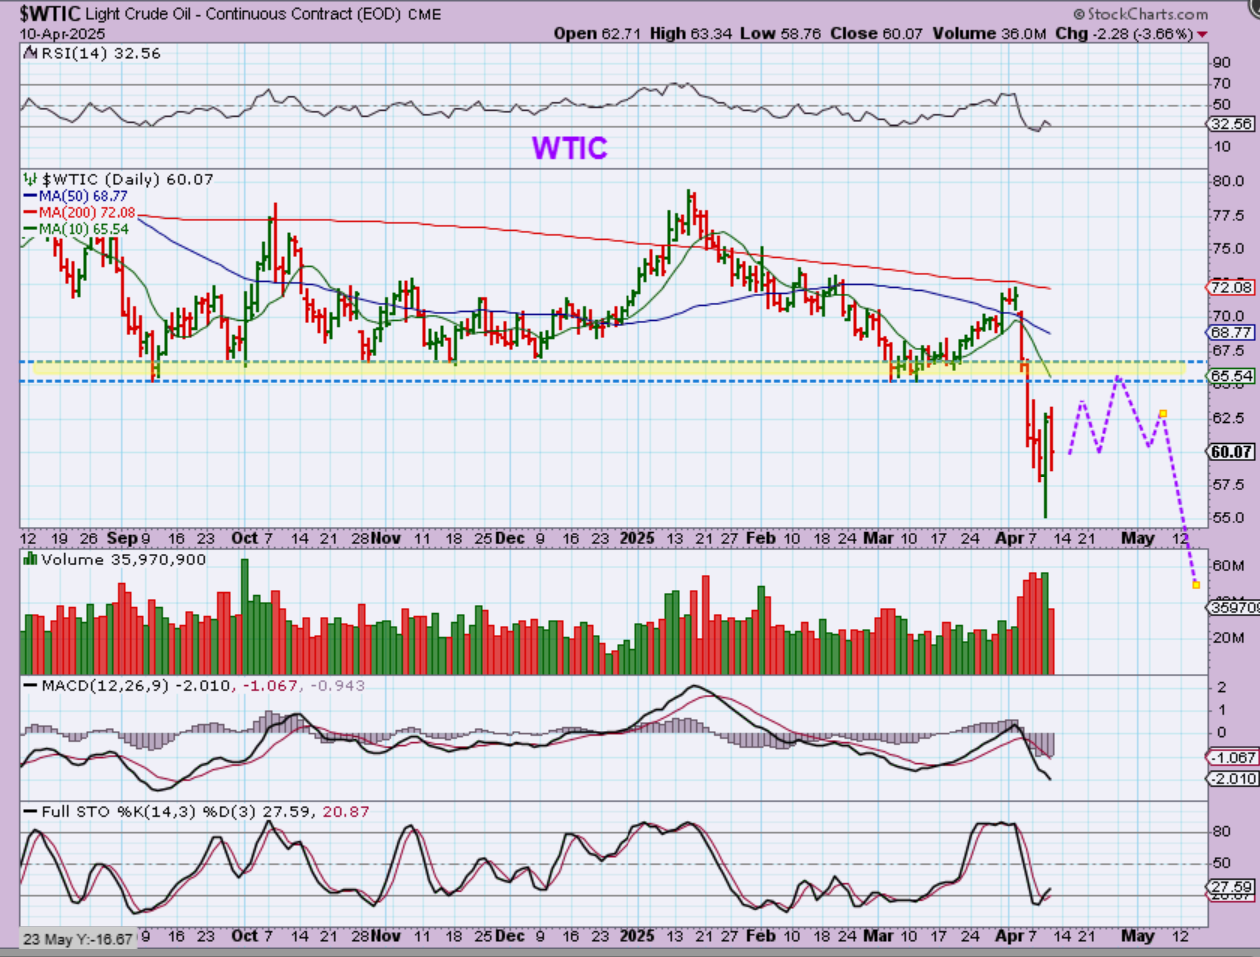
WTIC – Oil sold off 3.66% yesterday after that strong reversal. I have been calling for this breakdown for months and I was looking at the $42 area after a bounce here. We’ll see if anything changes after the bounce takes hold. I’m basically looking for a back test.
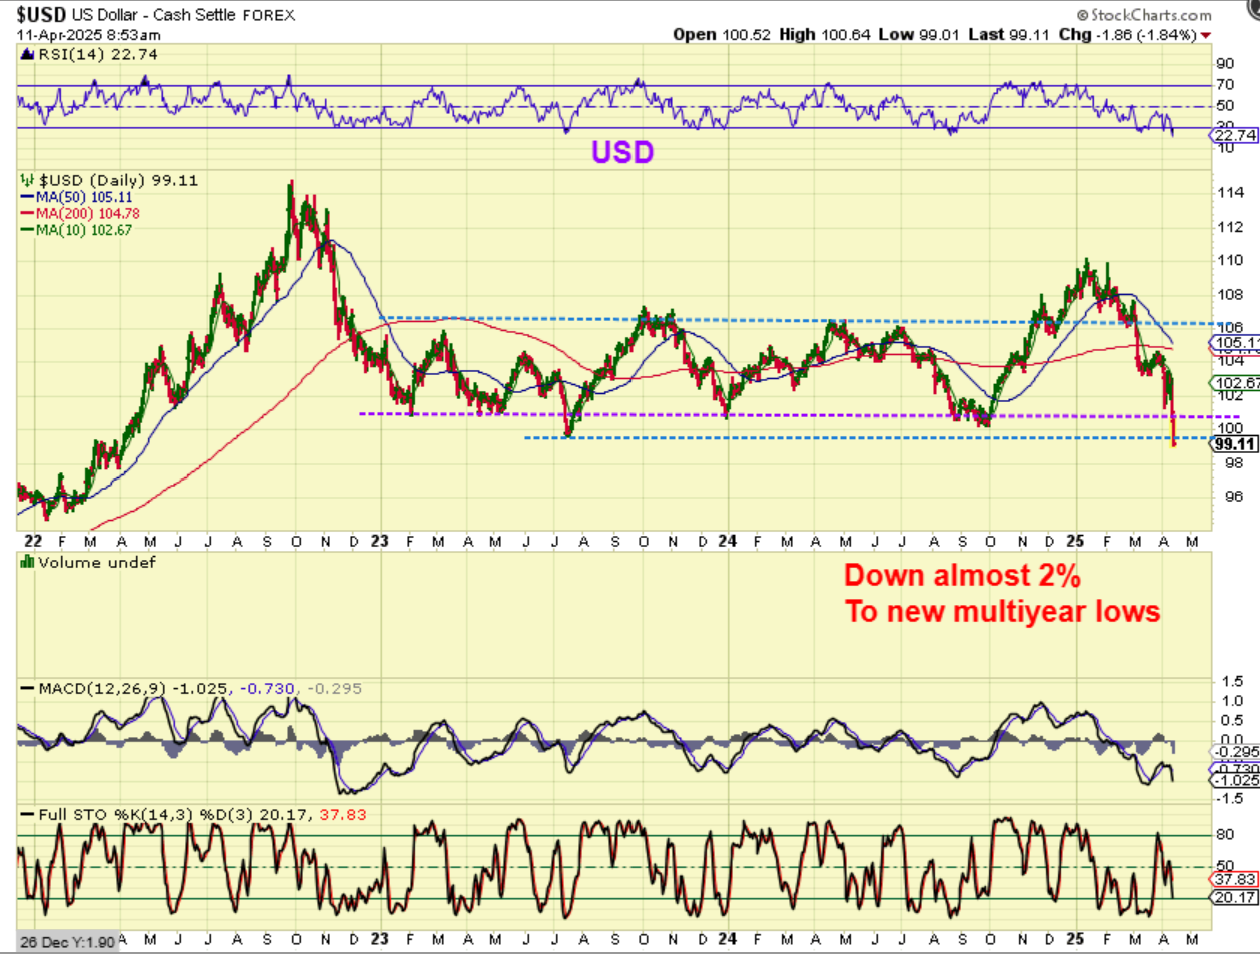
THE USD broke down to new multiyear lows yesterday. This could now become an ICL for the USD, so we’ll watch for more downside(?) or a reversal shake out and bounce.
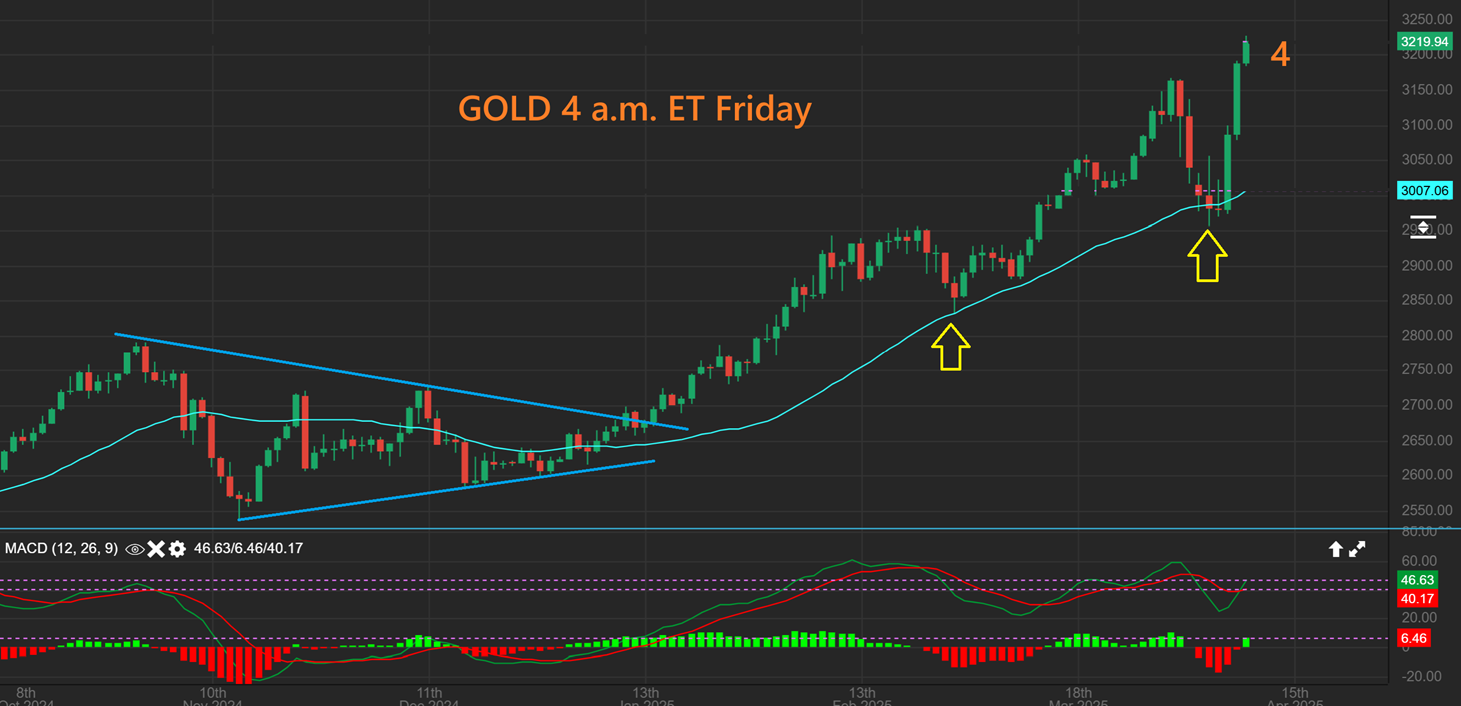
GOLD sold off last week and found support at the 34 sma, in time for a dcl. This would only be day 4, but Gold is a rocket out of those lows. One slight concern that I have is that, as pointed out in past reports, Gold looks to be going parabolic. When that happens you get minimal dips and strong rips to a blow off top. I’m hoping that the blow off top comes later in the year, so that Silver has a chance to play catch up in the next intermediate cycle. I’ll discuss that in the weekend report.
.
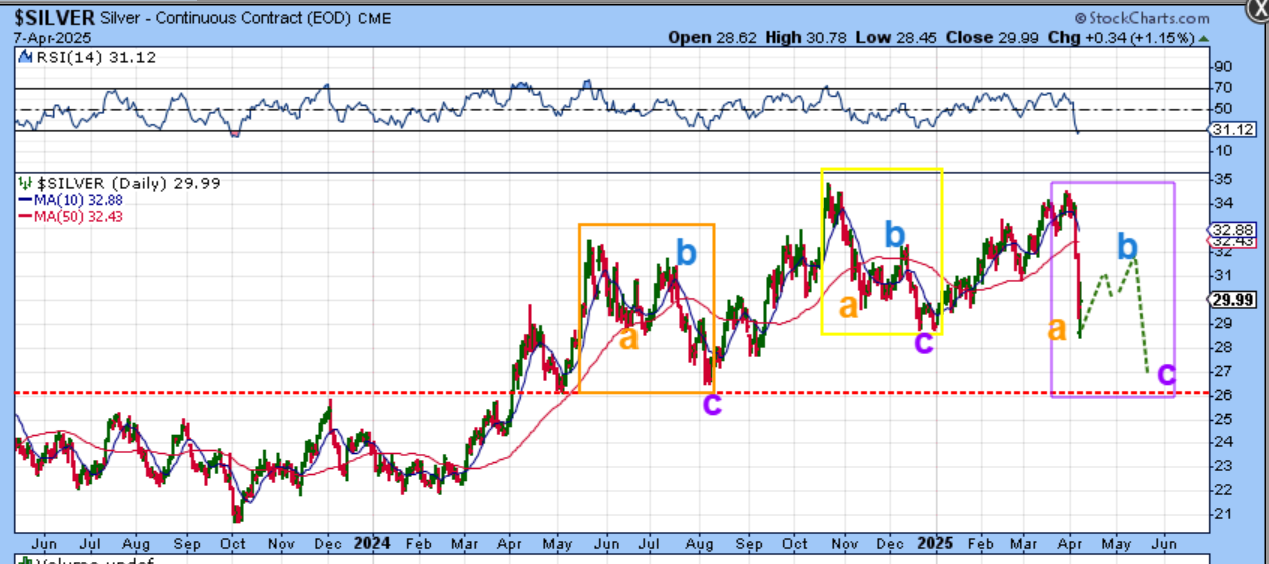
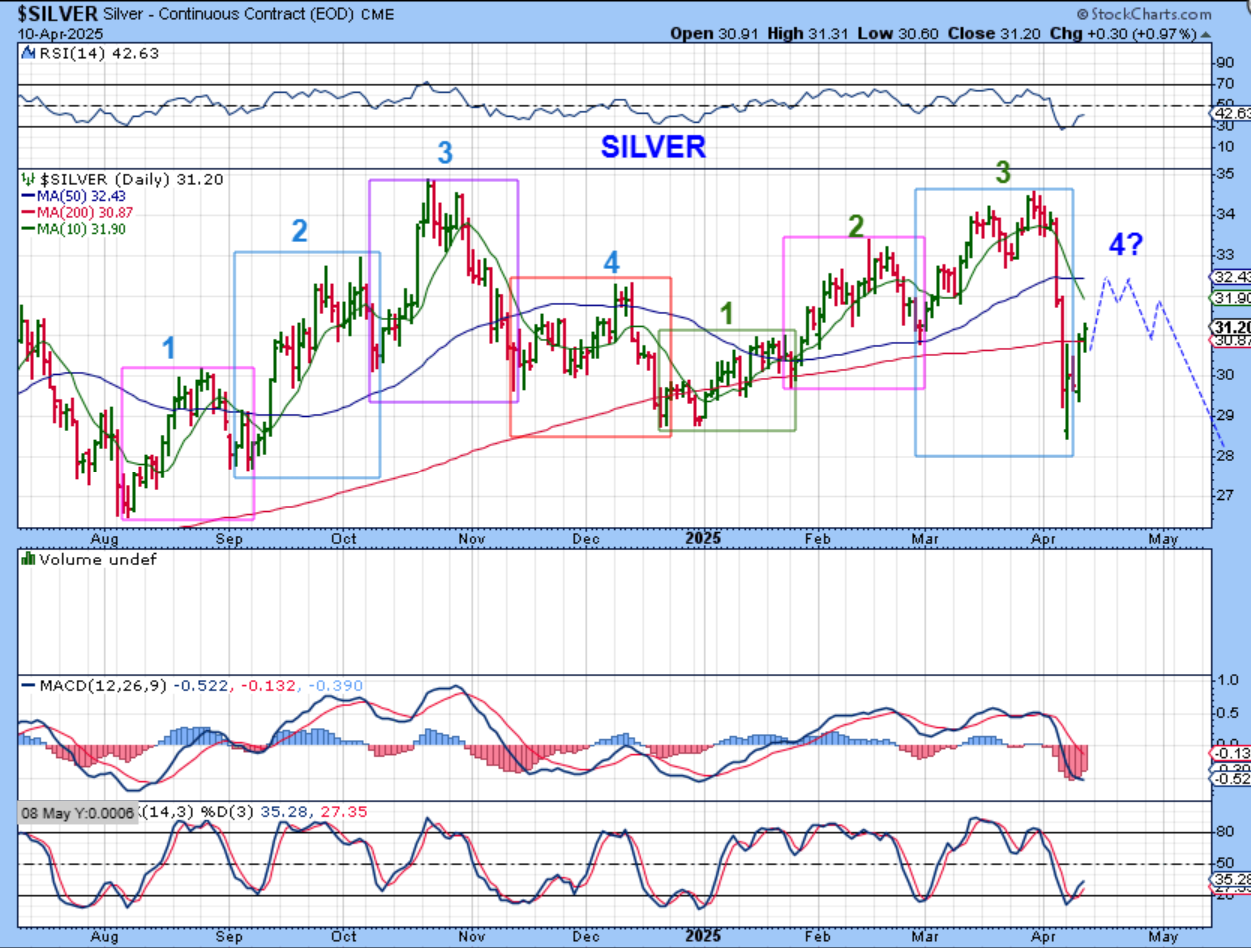
For Mondays trading I mentioned that SILVER just couldn’t hold up last week. I drew a repeating pattern with daily cycles here too. It is an A-B-C drop into the ICL. August ICL, December ICL, May ICL? I feel that this is reasonable to expect, but Aug to Dec is 5 months, and Dec to April is 5 months. I still have to think that we’ll see another bounce and drop to give us the a-b-c drop.
.
SILVER is now giving us that bounce that I mentioned. This could be the 4th daily cycle, similar to the last intermediate cycle. Have you seen the Miners this week? The next ICL should be a strong buy.
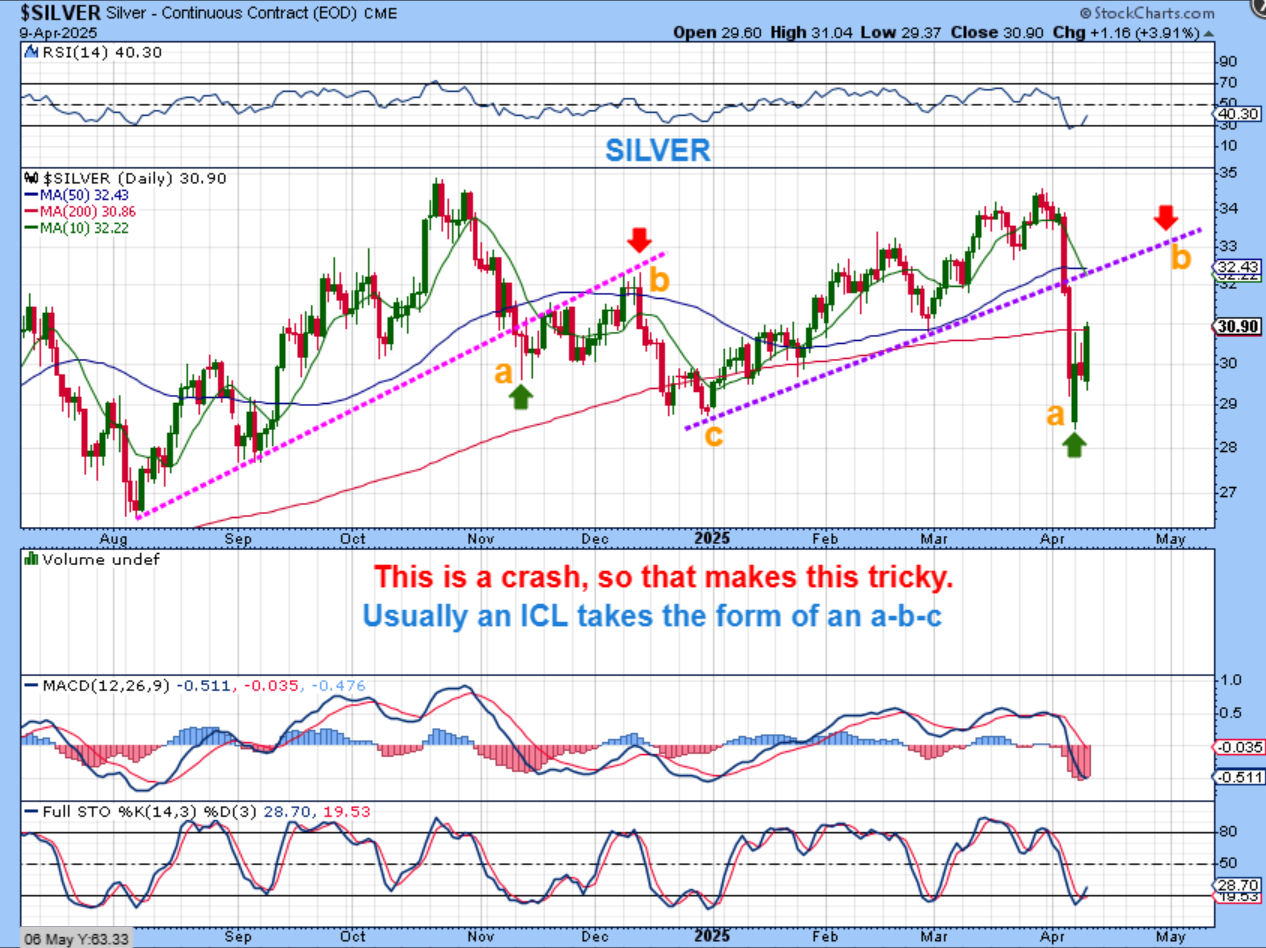
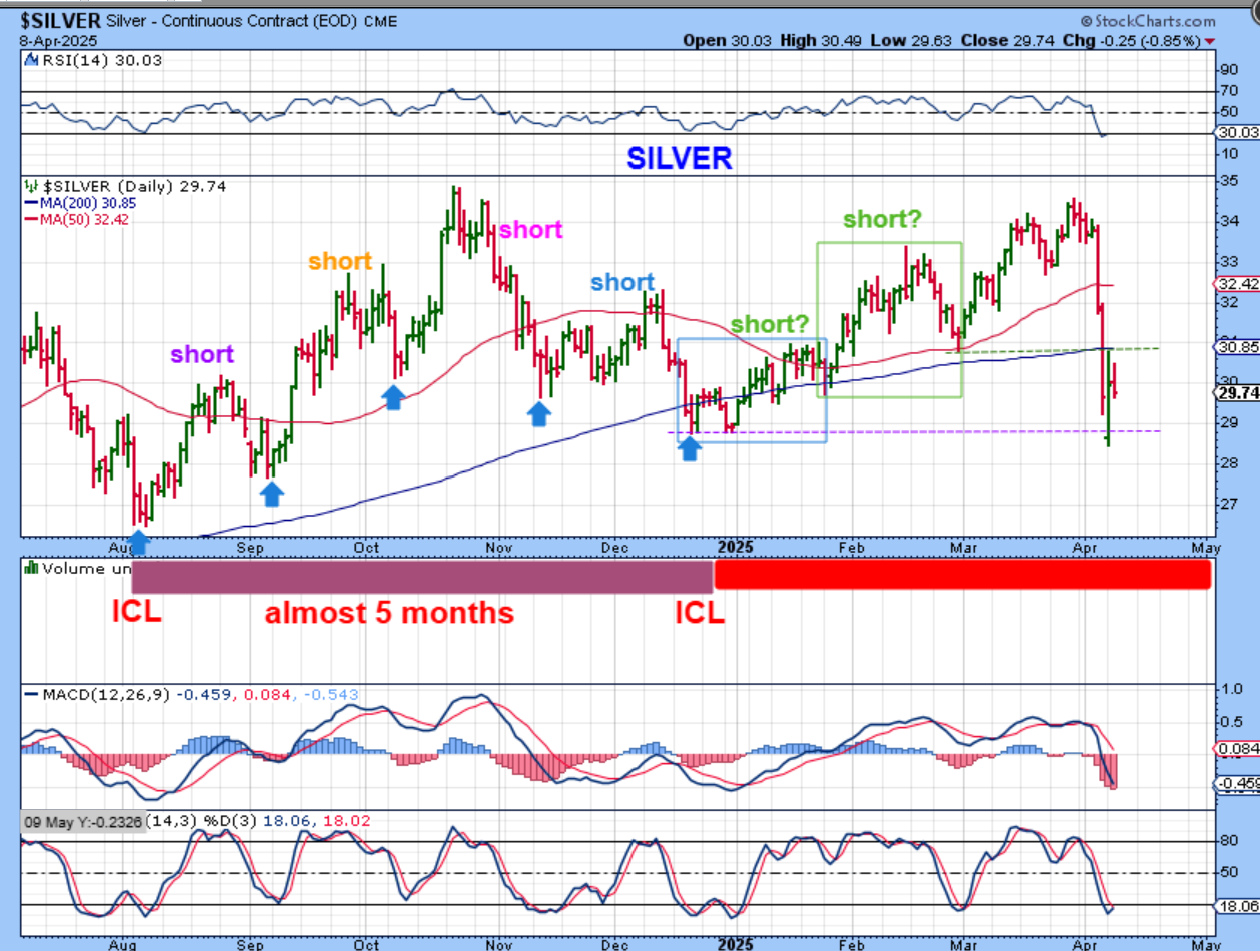
I DREW THE FOLLOWING 2 CHARTS FOR SILVER EARLIER IN THE WEEK TOO:
.
APRIL: Will SILVER do the a-b-c dip into an ICL that I was predicting? Or is this drop so extreme that it exhausted the selling? It is hard to know but it can be bought and raise a stop. Tuesday I said…
.
SILVER has a number of short daily cycles in the last intermediate cycle, as seen here. It lasted roughly 5 months. It may also have short daily cycles in this intermediate cycle, which is now oversold and could put in a low soon, as a dcl. The ICL may come later, and I showed that idea yesterday. The selling here was extreme and may be ‘exhausted’.
.
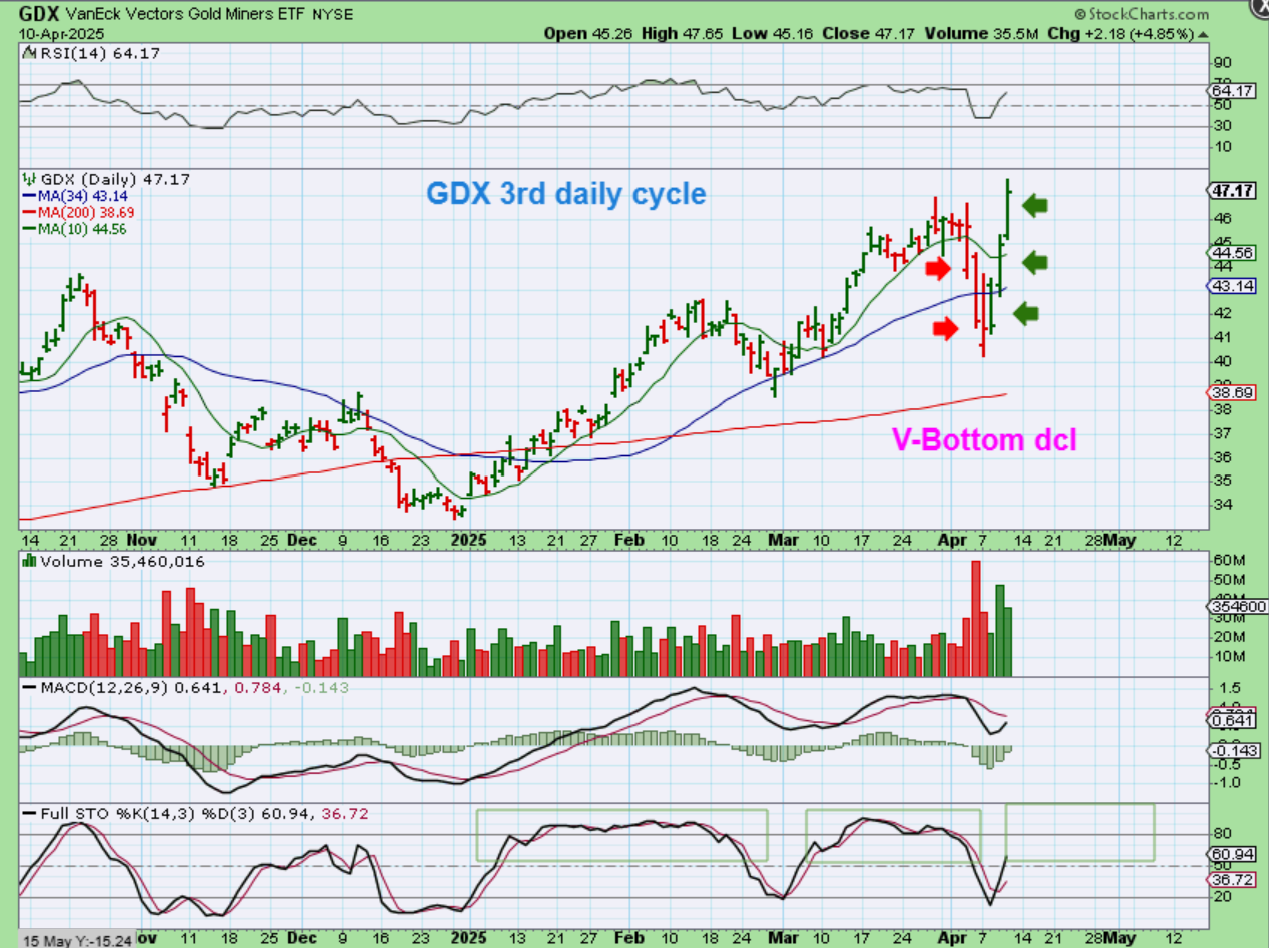
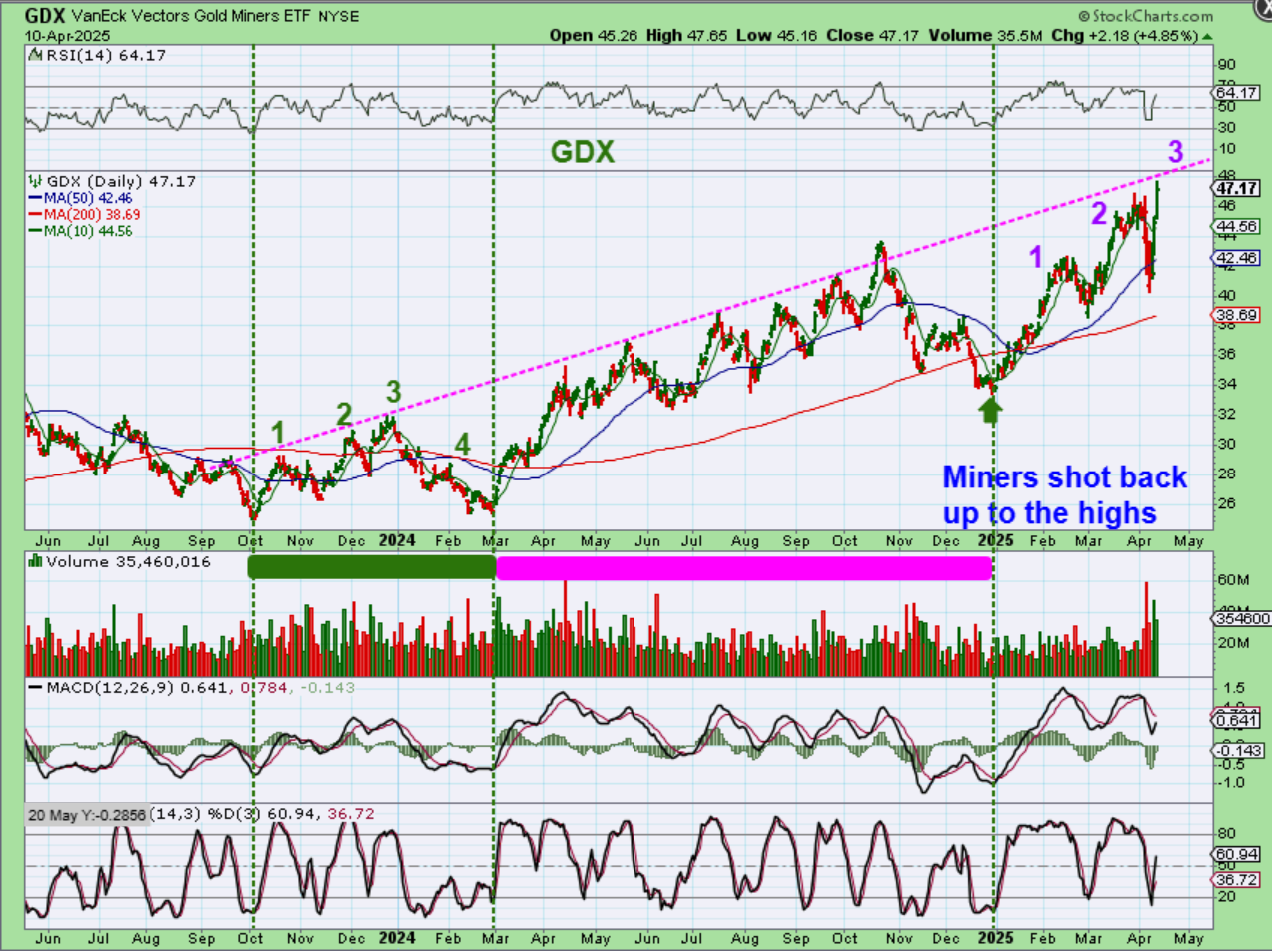
Last week it looked like ‘shorting’ the miners may have been a good move. This week the Miners shot up very quickly, giving us a V-Bottom. You can see the buying pressure over the past couple of days and the strength of Miners as opposed to how they used to act in a 3rd daily cycle. This helps us to see how they could act during the next intermediate cycle too. Again, I just hope that Gold isn’t doing a parabolic blow off top right now, if so, Miners could do the same.
.
Picture the Miners starting to chop and then peak around $49-$50, and then dropping down to the 200sma again, like they did with the last ICL drop . THAT would be an excellent buy area (200 sma).
.
Peak $49-$50 and then drop to the 200sma? What a great buying opportunity that would be. This helps us to see how much of a strong buy they’ll be at the next ICL too, as long as we don’t see a blow off top here now. This Gold bull has been strong, GDX may break that upper trendline again, but it can still roll over into an ICL drop over time. Last October to December is an example of that drop false break out and drop.
Inflation Data will be released at 8;30 a.m. ET, and then we’ll see what happens with Fridays’ trading. The General Markets are trying to bottom, and the lows could be in place, but realistically a day 19 dcl is much earlier than normal. If you go long, use stops and anticipate another drop. Gold and the Miners went from a slam down last week to a rocket out of the lows, v-bottom this week. I’ll be discussing the 2 likely scenarios in the weekend report, which will be out on Sunday. We should see another dip with the precious metals sector, into an ICL around May. The weekend report will be out on Sunday, since I have a full day on Saturday and Saturday night. Bitcoin is below, enjoy your Friday trading!
~ALEX
YESTERDAY:
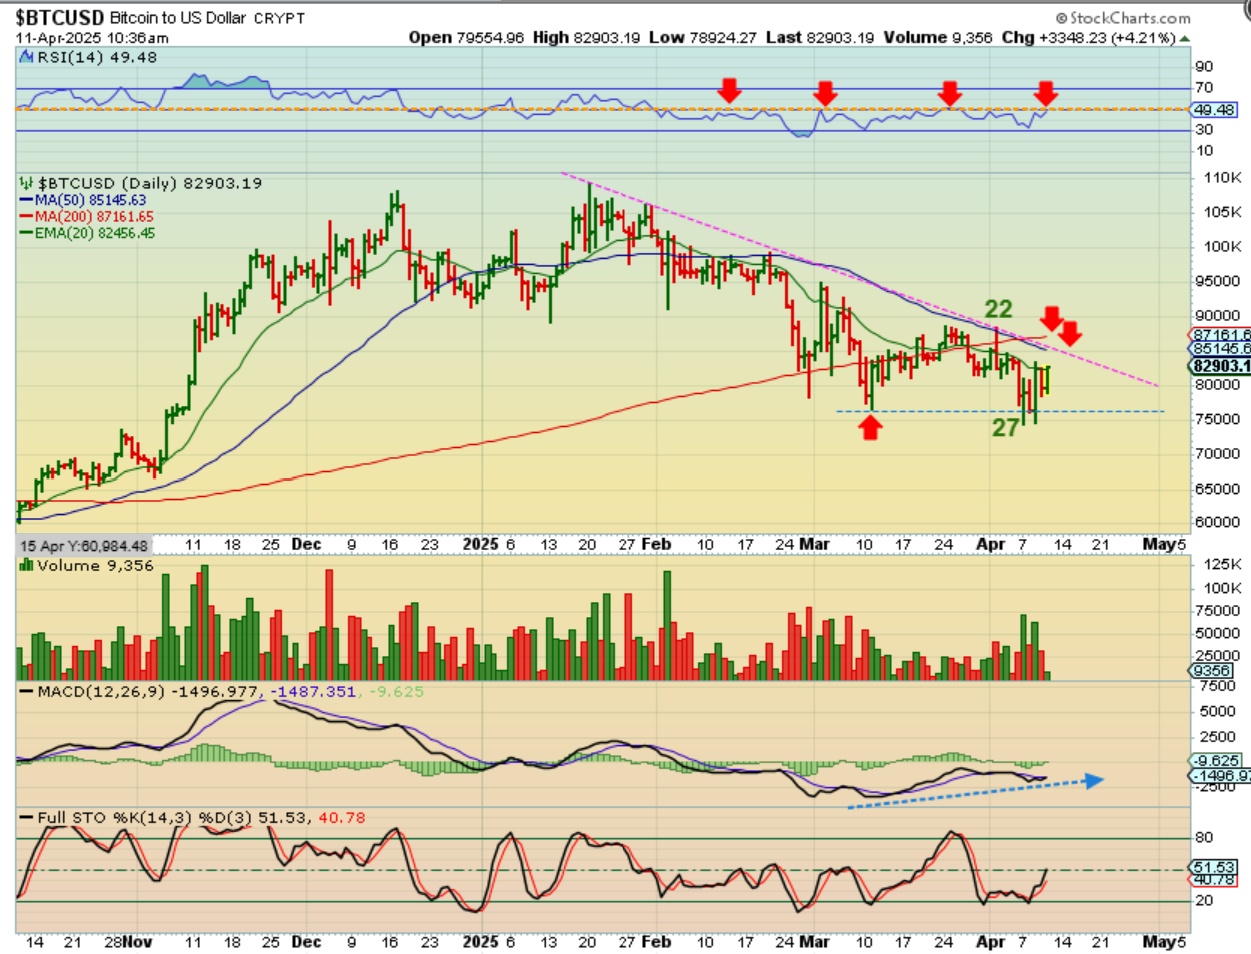
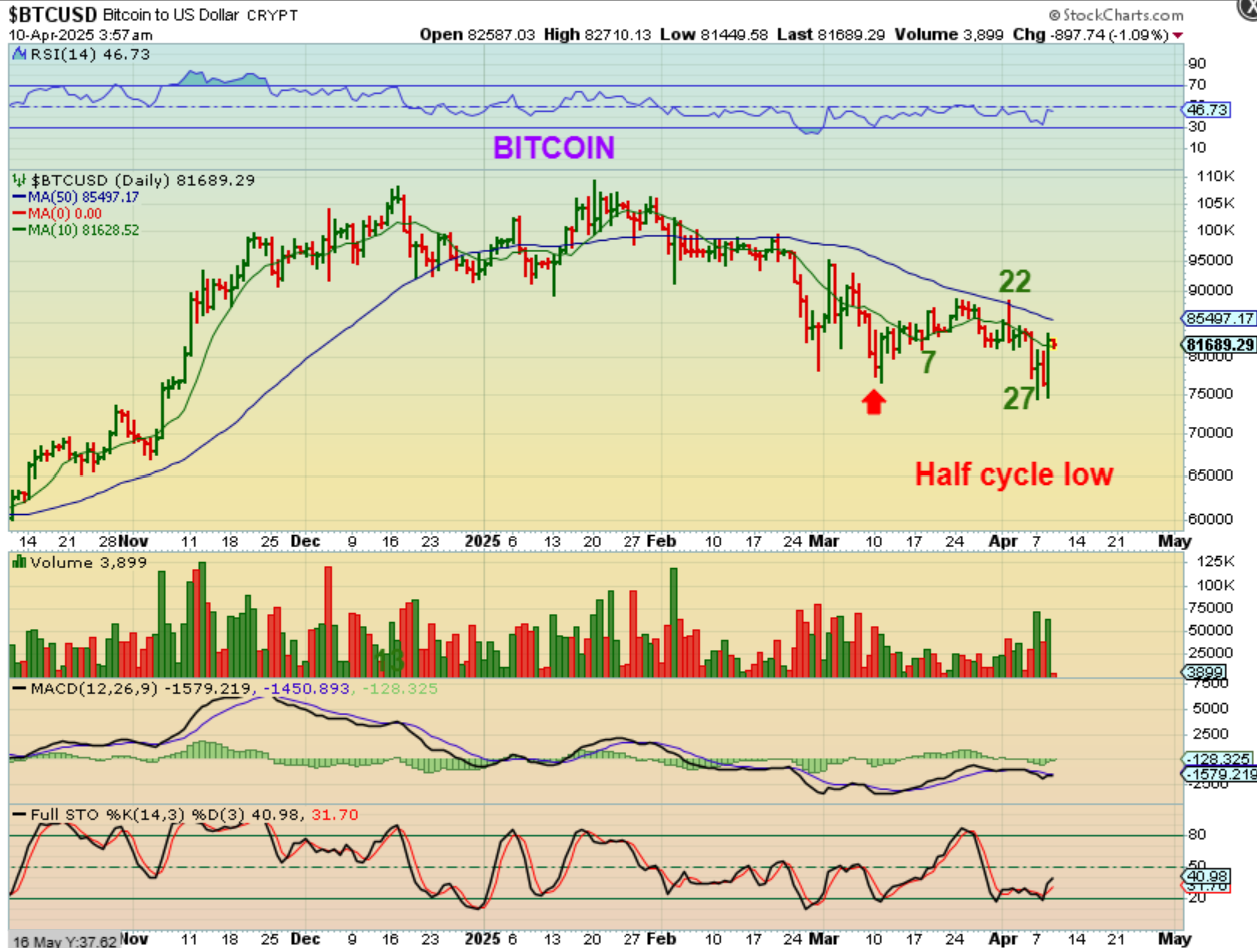
BITCOIN has that day 27 & 29 low in place that I was expecting (due around day 30) and then it surged out of that day 29 dip. Again, this broke the last low in early March and that represents a failure, so we can expect some upside, but we need to be cautious as to how much we will get.
.
Bitcoin – Today is day 31 and this is a live chart from 6 am. Bitcoin is up this morning, but it does have resistance overhead and with a failure recently taking place, I just don’t know if it’ll have the strength to breakout or not. Obviously, you can be long from day 27 or 29 with a stop that can be raised.