April 26th Weekend Report – Parabolic Tops
At the very end of this report, I have a special write up on Parabolic tops. It can be found below my coverage of Bitcoin, but you should probably read my coverage of Gold first. Enjoy!
.
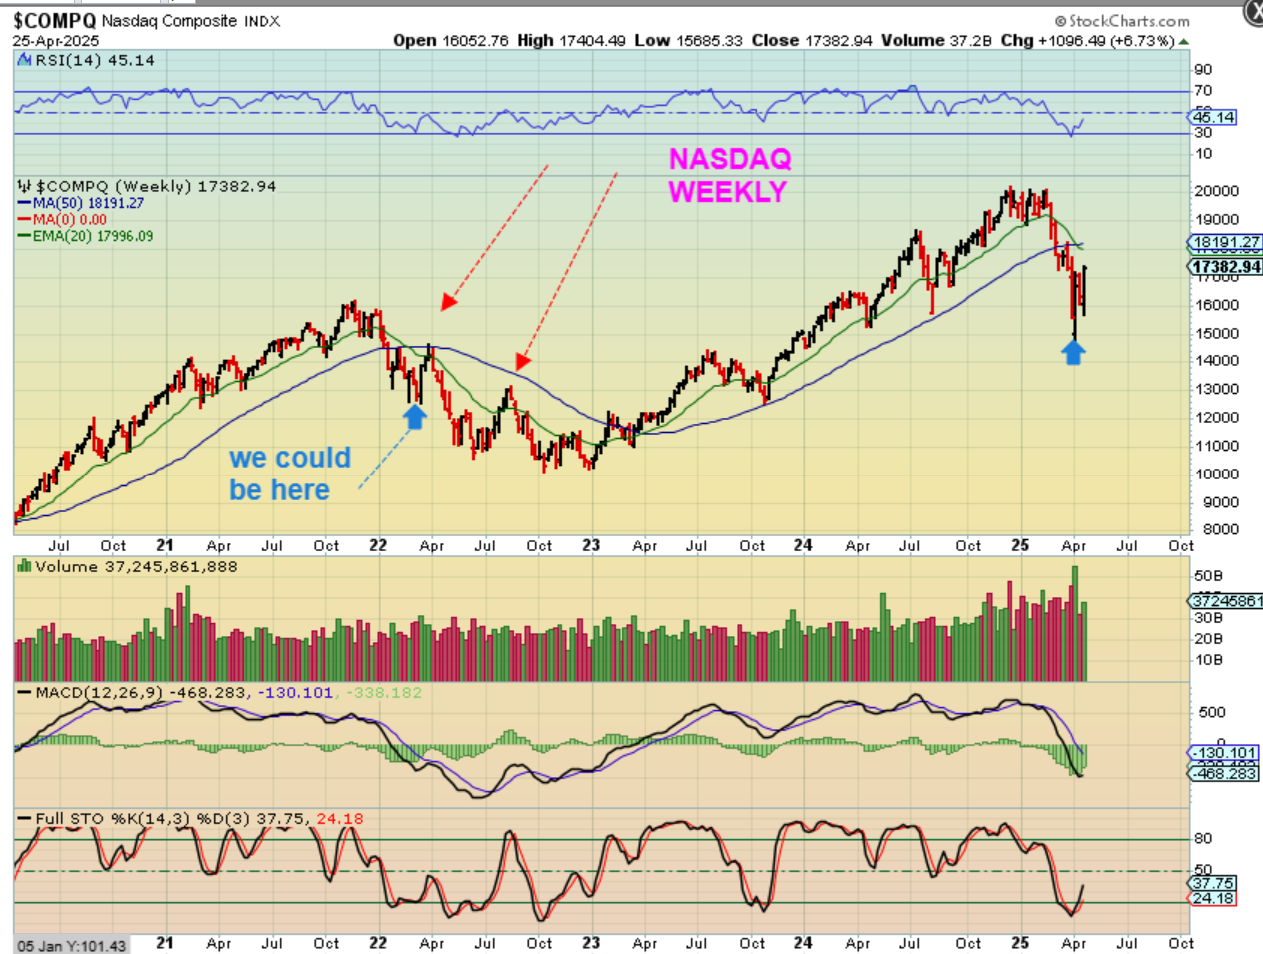
NASDAQ – We have a weekly swing low now. We still want to keep an eye on the blue 50 week ma, since we rallied there in 2022 and the markets then rolled over. I drew that on this chart. That said, when this market first sold off I pointed to the crash in 2020 with Covid, and showed how it was able to recover and climb a wall of worry during the most difficult times of the pandemic. That reversal was a buy with stops and we can raise the stops. We may be seeing an important low right here after a sharp 20% plus correction.
.
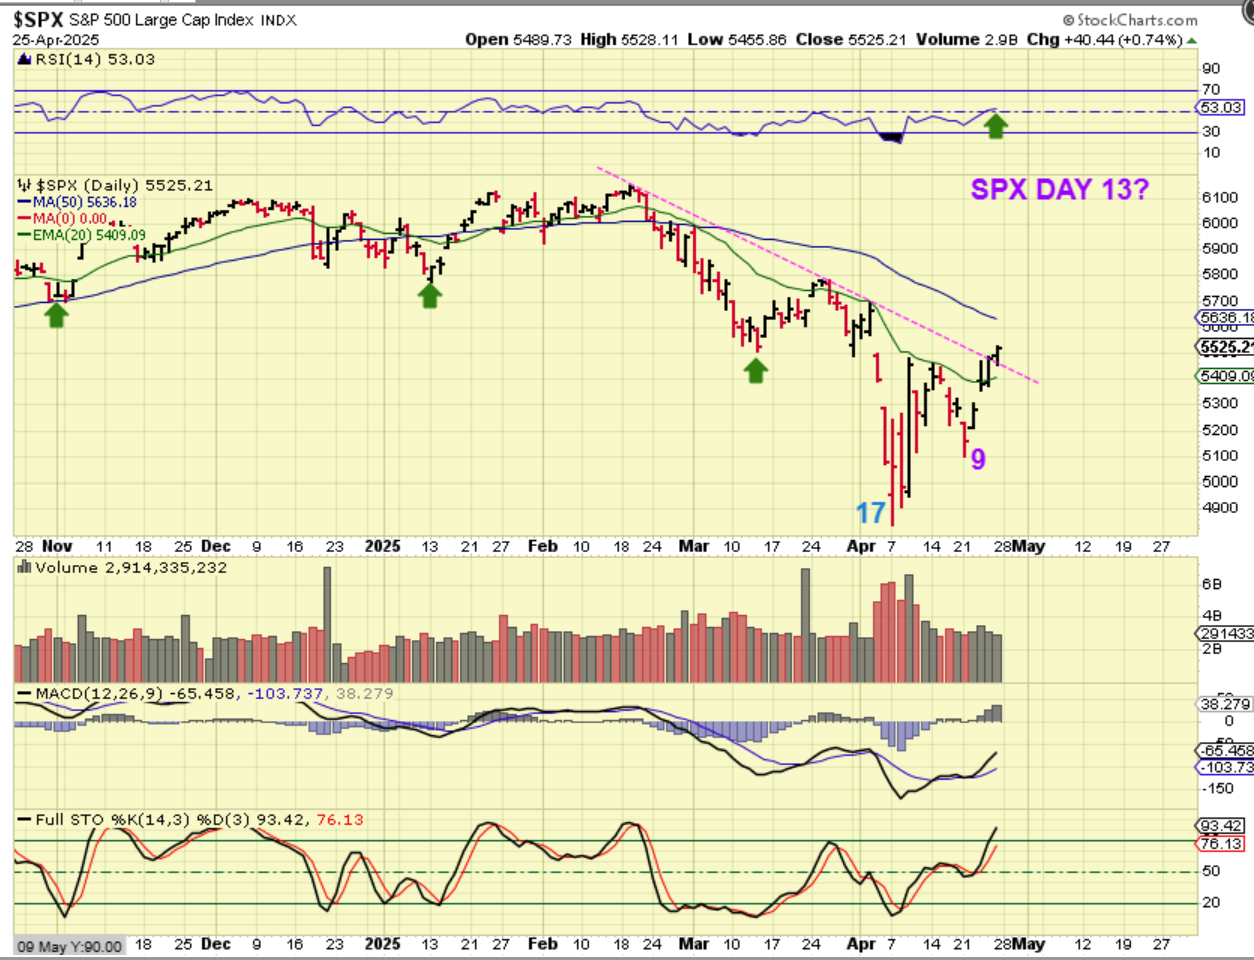
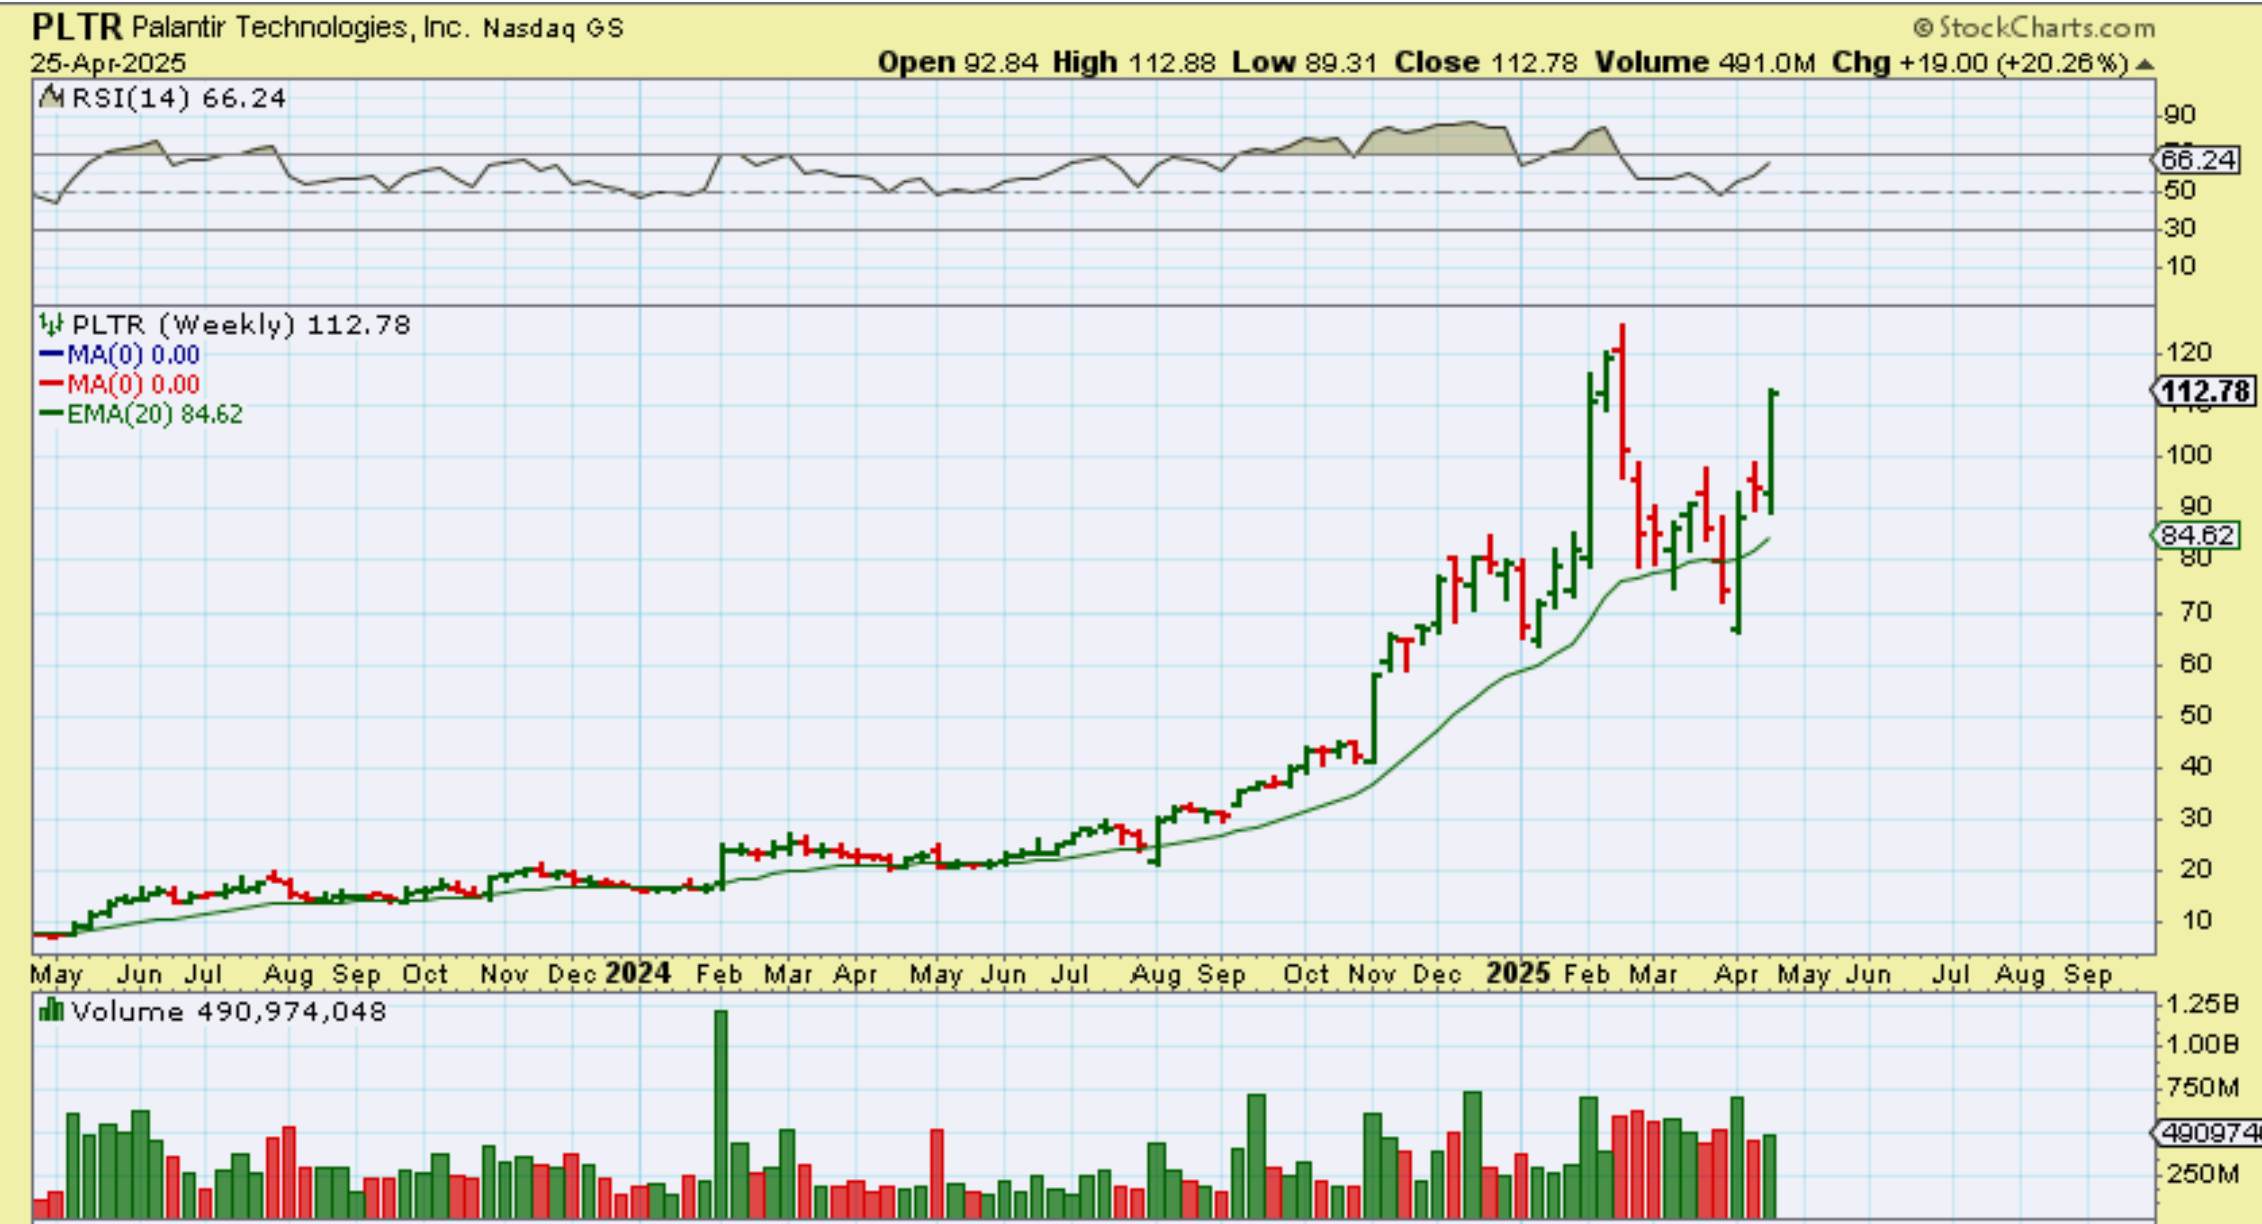
SPX – On the daily cycle count we saw day 17 act as the low, and I also pointed out that this happened before too. Now we could be on day 13 of a first daily cycle out of an ICL. I have also pointed out quite a few ‘stocks’ that are performing better than the markets themselves (PLTR, CRWD, CVNA, etc). In fact, take a look at this…
.
In fact, take a look at this weekly chart of PLTR. What do you think of that? That is almost 80% off of the recent lows. These markets could be in recovery mode to resume the Bull Market Run.
.
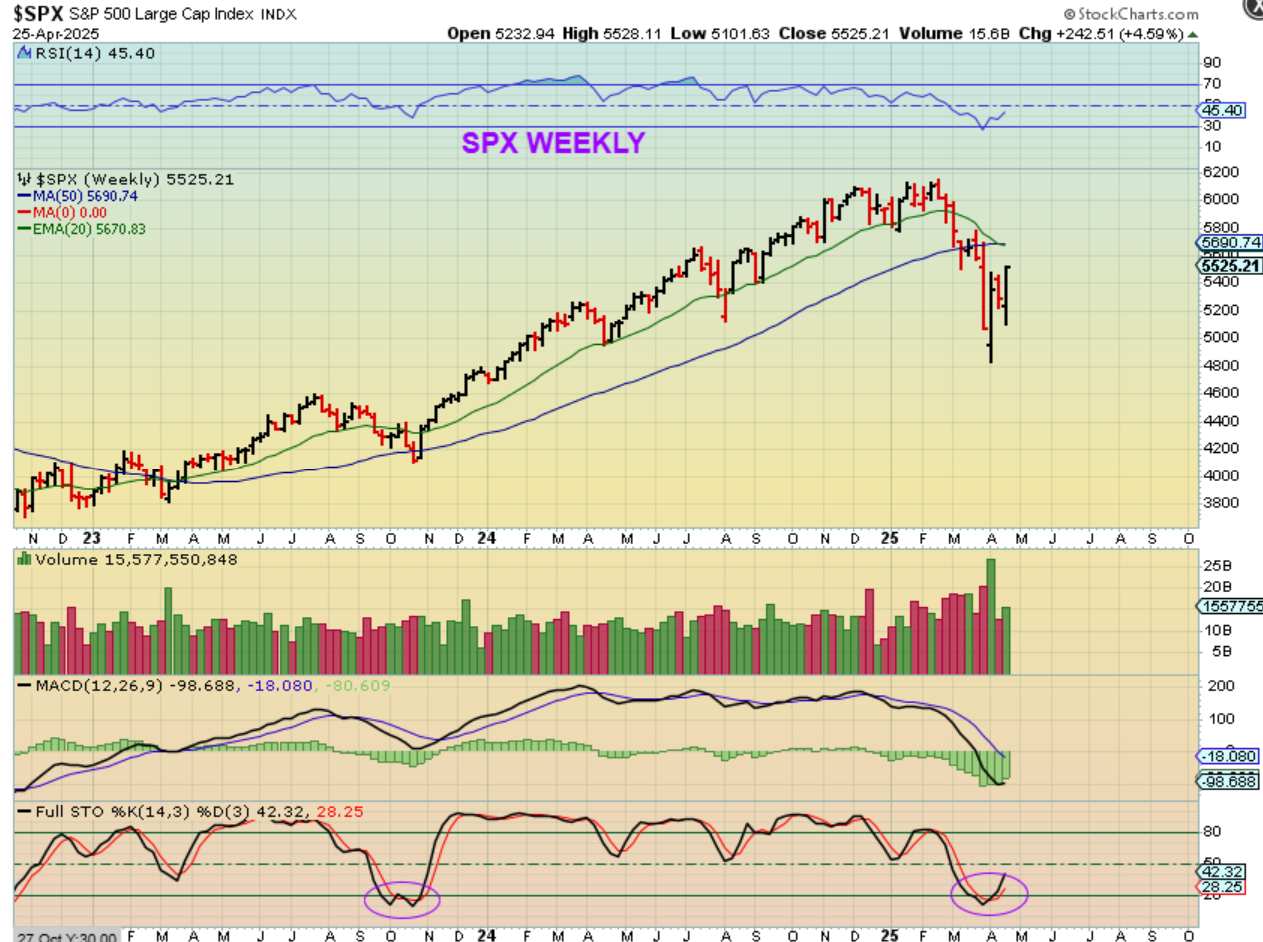
The SPX Weekly has a weekly swing low in place now and it’s still on the oversold side.
.
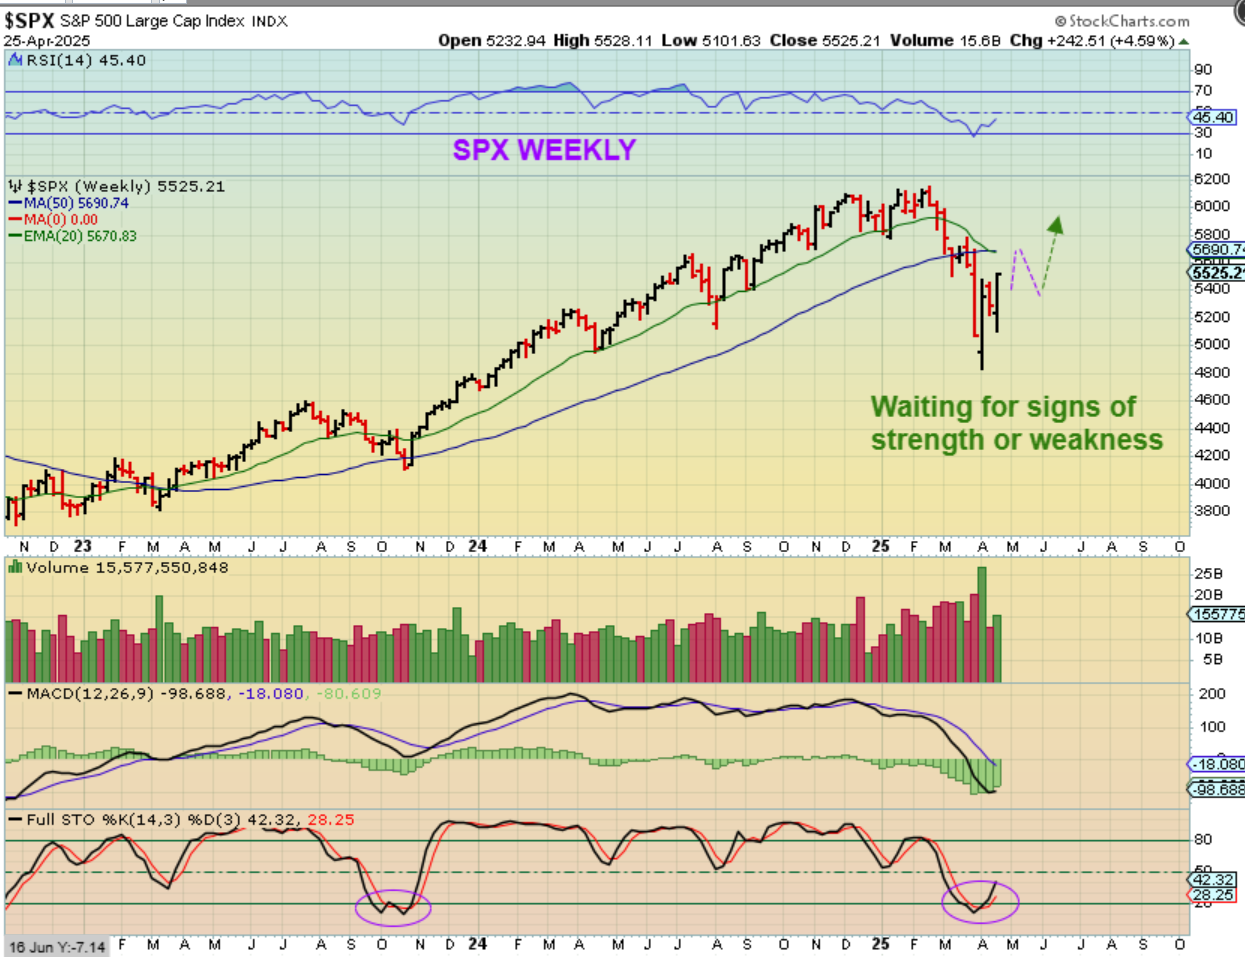
SPX – The indecision and rapid change with Trumps constant tariff threats and adjustments has died down and the markets are responding favorably. I t is possible that, just like the covid crash, the markets just climb higher and money flows back into the markets.
.
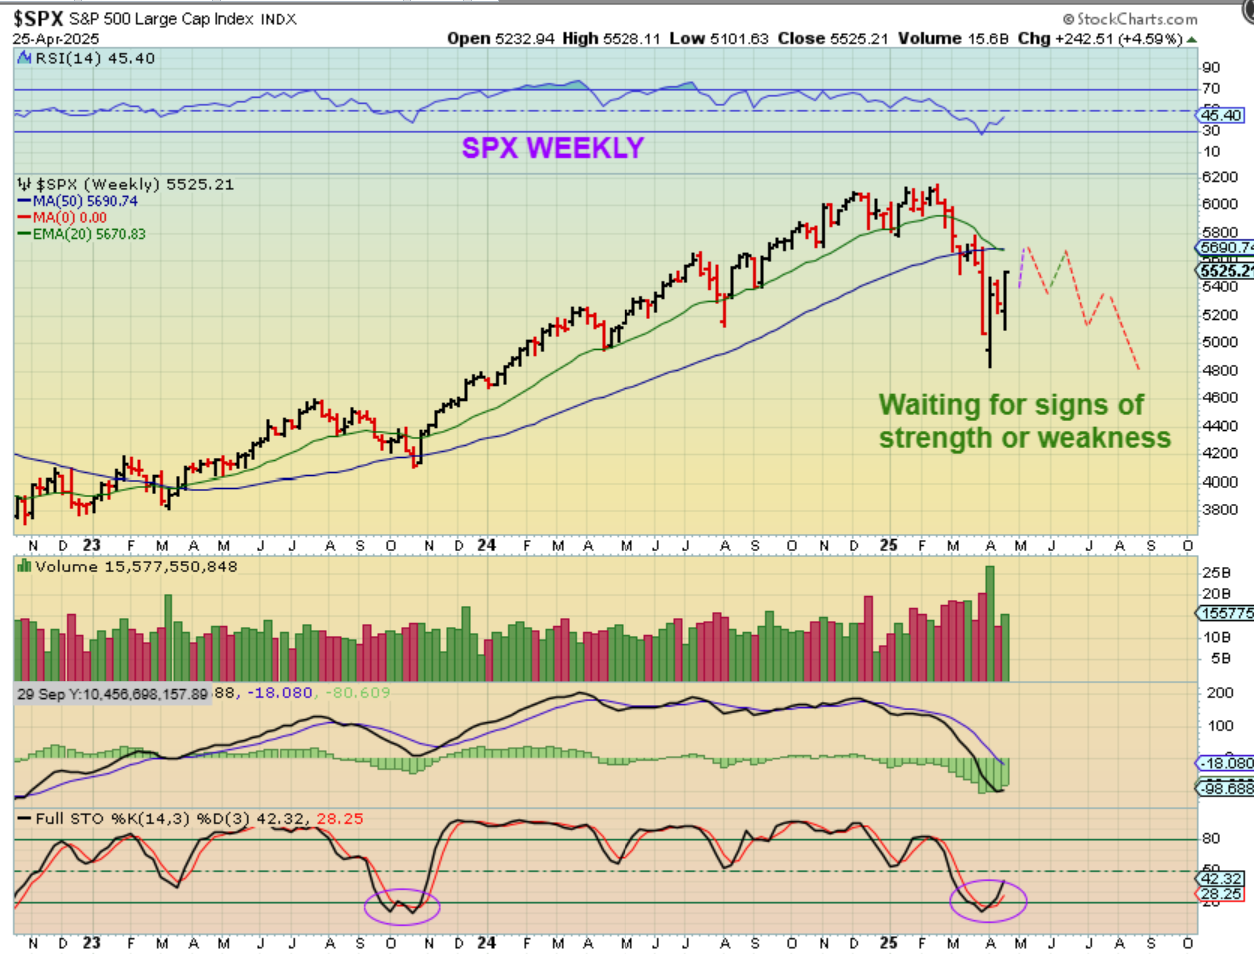
SPX – This would be the opposite of that as price runs up to test that 20ema / 50sma and weakens, possibly with more tariff talk and deals not being made over time. So far though, the markets have been giving us a sign of strength.
.
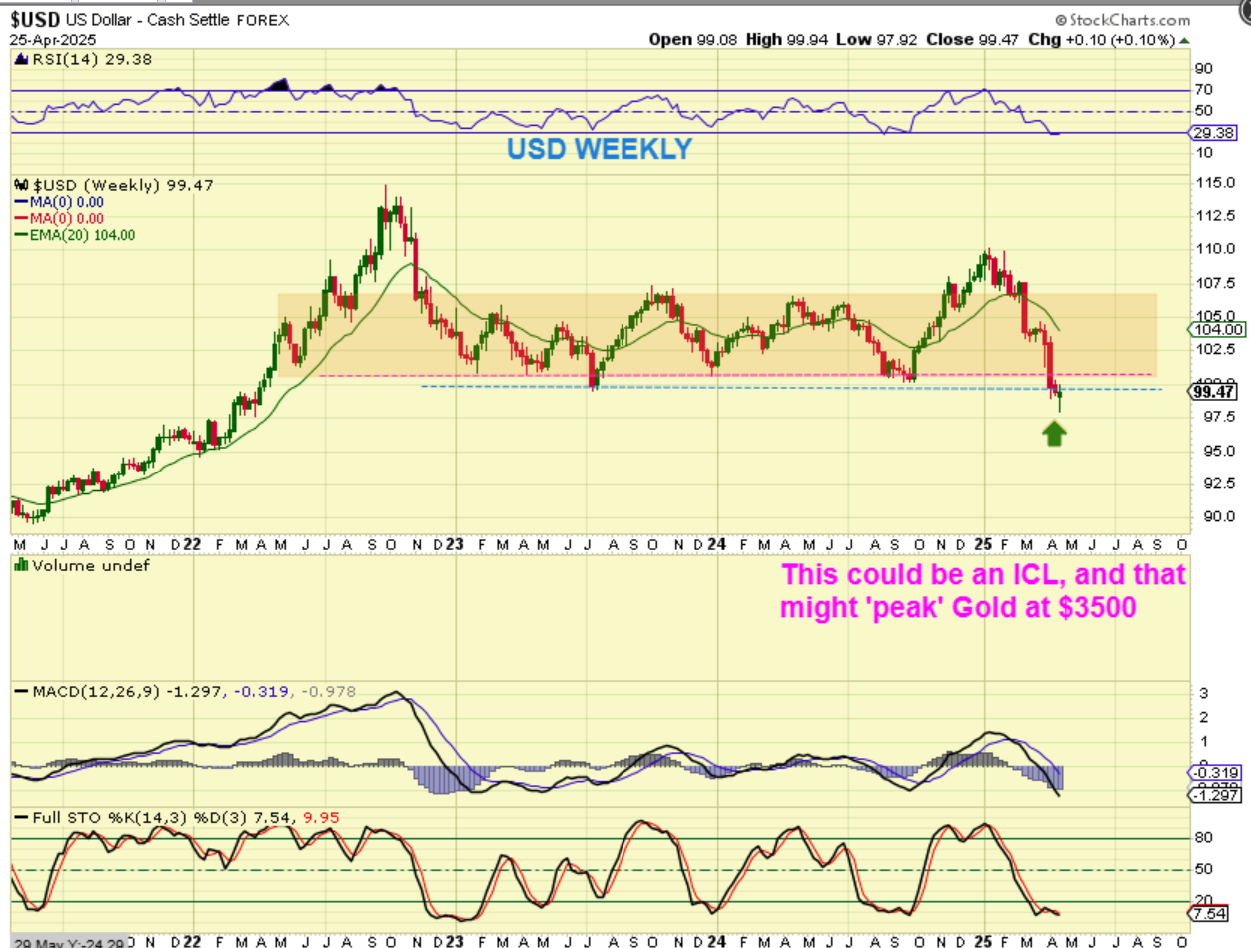
THE USD broke down and then put in a weekly reversal candle. Now it is due for a dcl and an ICL, so if this is an ICL, Gold may have ‘peaked’, and we need to discuss that. If this is just a dcl and this bounces and rolls over 1 more time, then Gold could dip lower, dcl, and run up one more time.
.
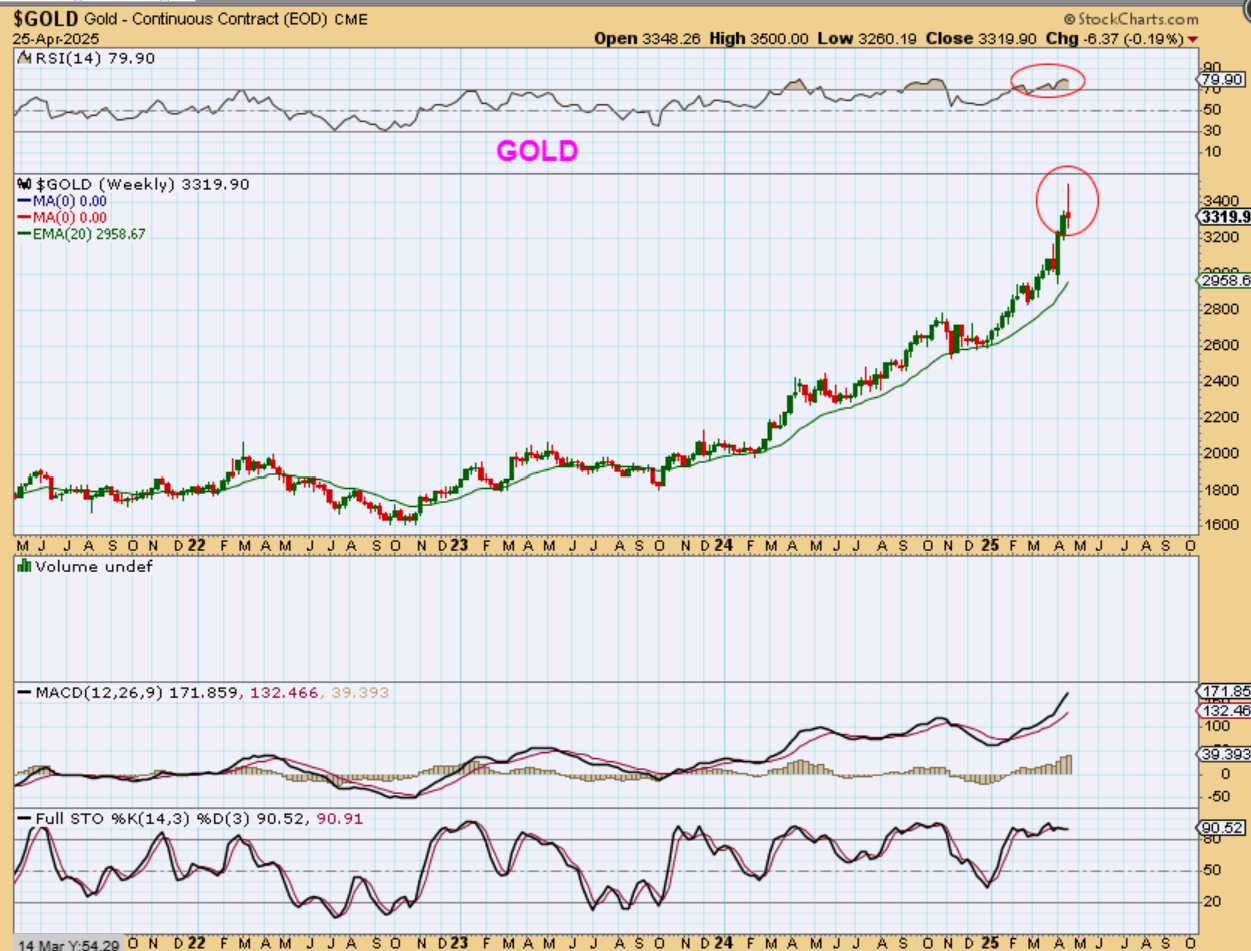
GOLD WEEKLY – To be honest, this is more often than not, a topping candle. It would seem that gold is now going to work its way down into an ICL, and that could come in a couple of weeks (or more).
The big question is:
– Is this the final top for this run?
– Or can this drop and then take off higher again for a steeper blow off top?
.
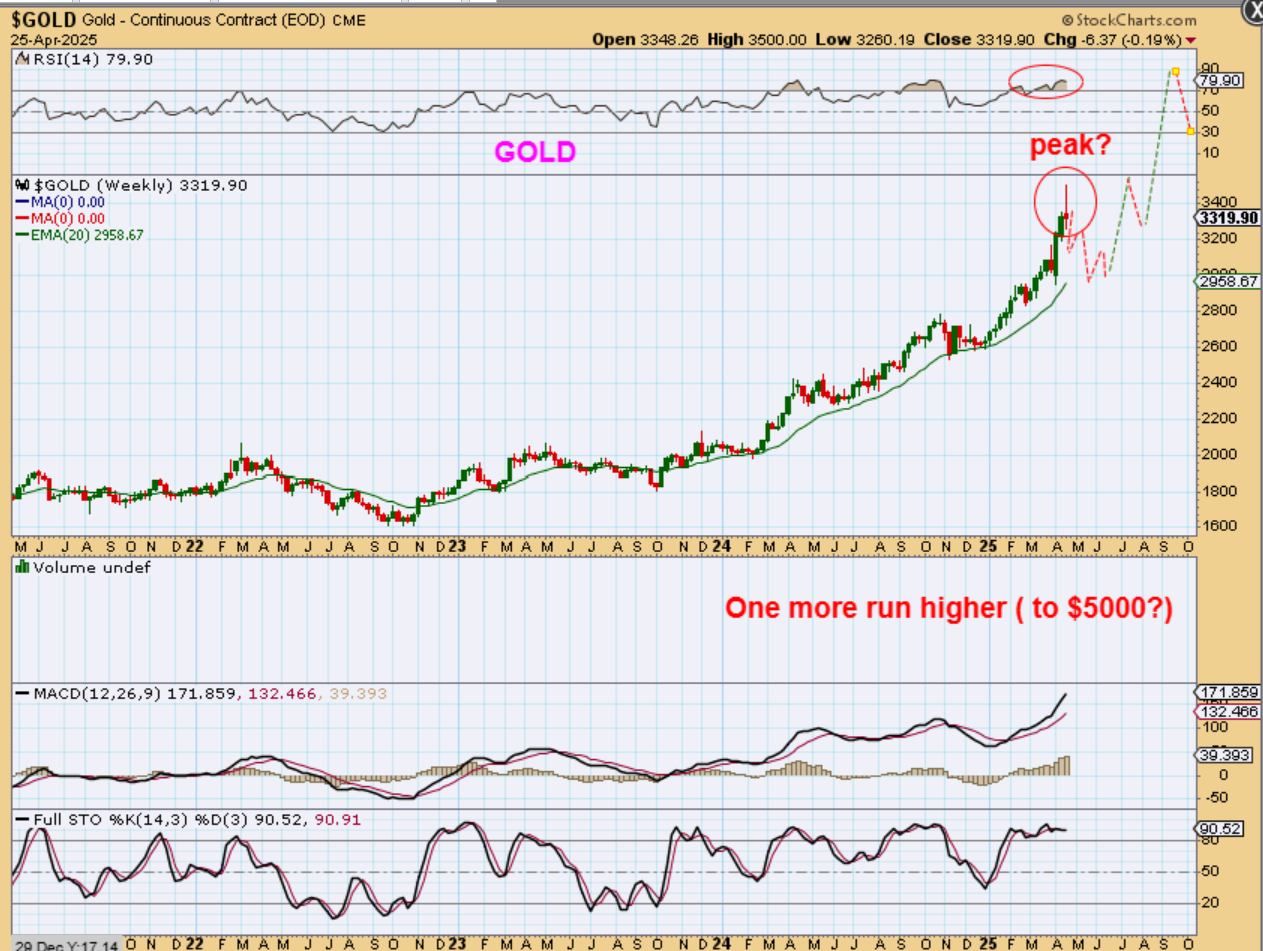
GOLD could drop lower like this and then take off higher again out of an ICL. This is a possibility with the idea that maybe Silver would join in for that final run higher.
.
GOLD also may have just put in a shorter term parabolic ‘peak’, and then it would need to consolidate for quite some time (an entire intermediate cycle of 6-8 months), before it then starts to move higher again.

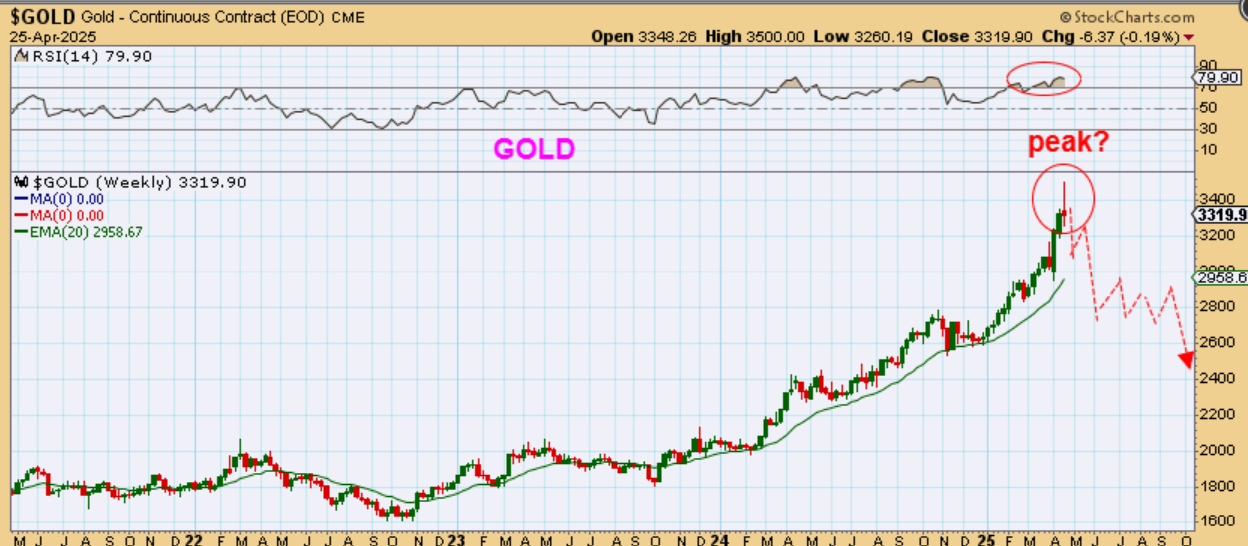
.GOLD – And finally, we may have a final blow off top at $3500 and this would drop the way the NASDAQ dropped in the parabolic top of the 2000 tech bubble. I will discuss this more at the end of the report.
.
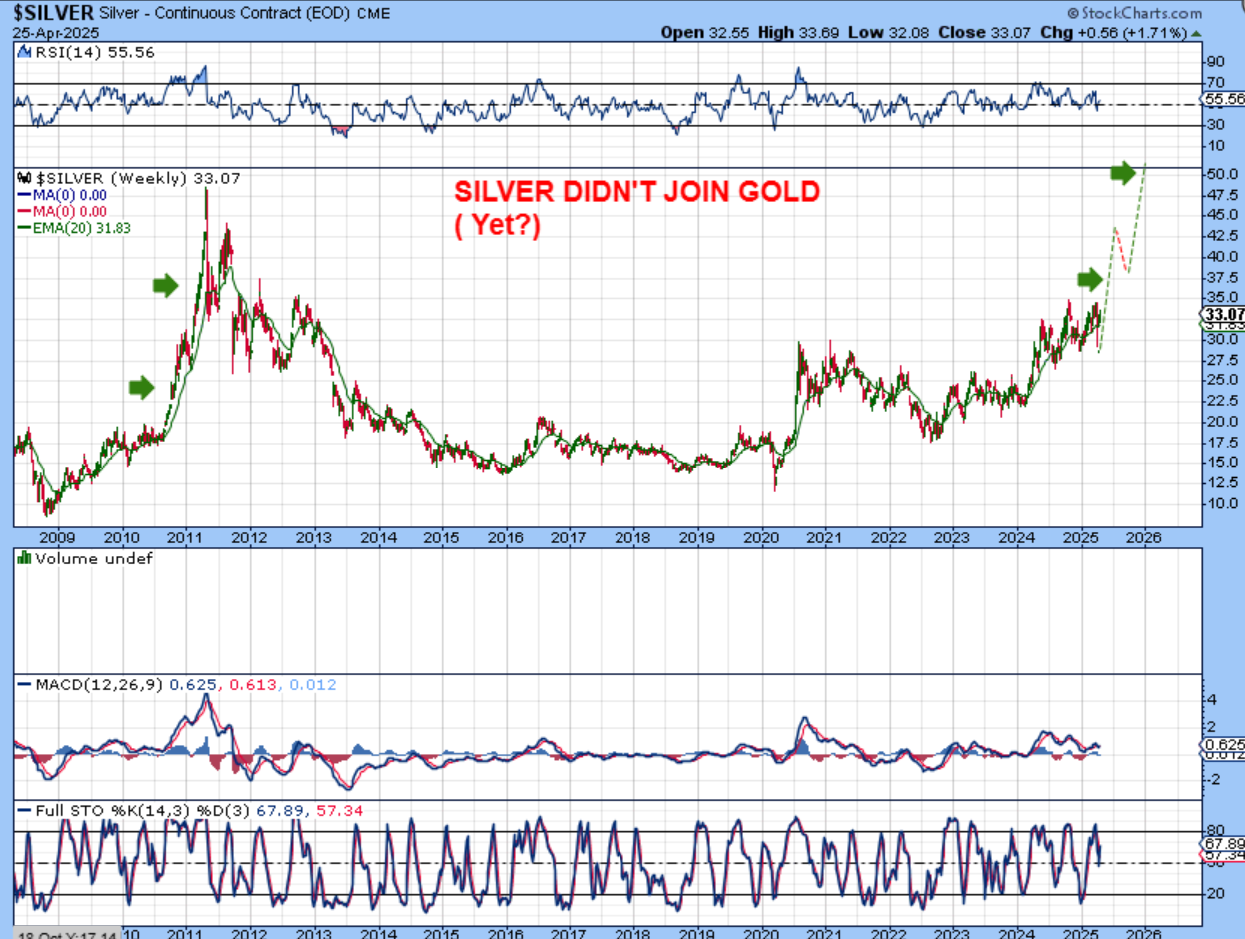
SILVER -I was thinking that Gold would do 1 more run now, so that Silver has a chance to join in. Silver and Miners lagged Golds run but the Miners finally started to go while Silver really didn’t yet.
.
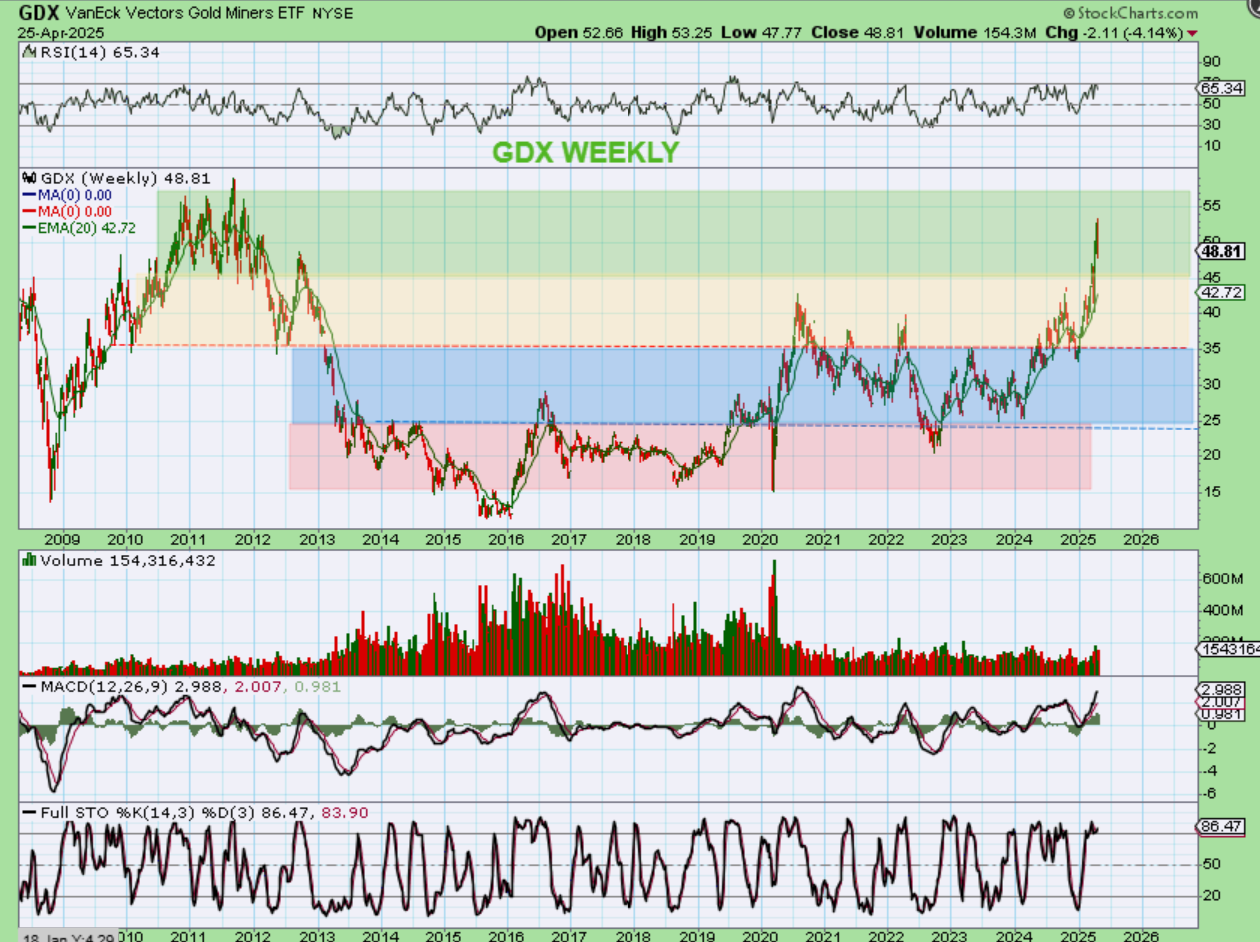
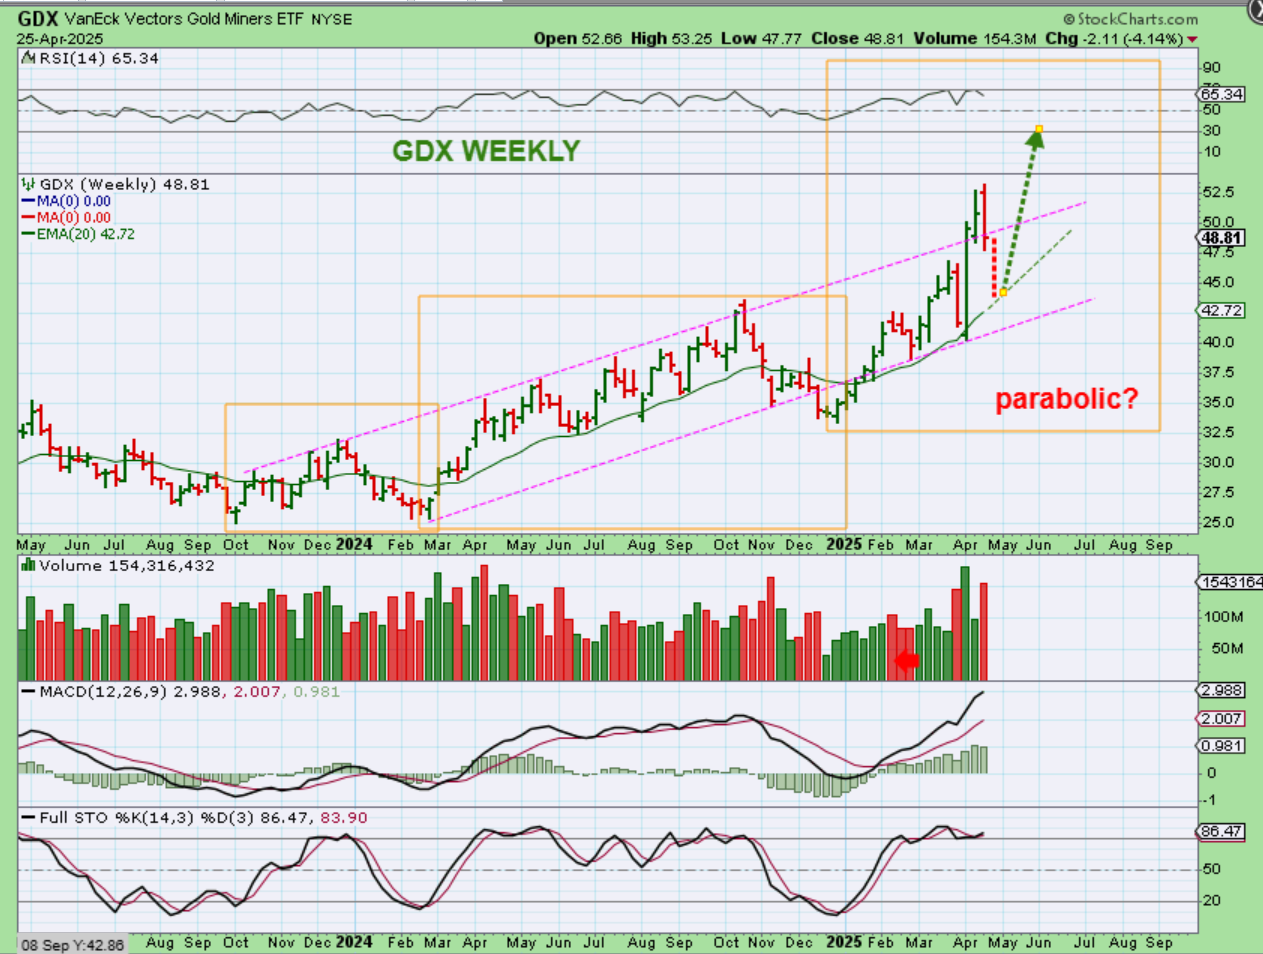
GDX – The Miners did finally start to follow Gold and they shot up over the past few weeks. This was a resistance area that I had pointed out and it ran right through it when Gold took off higher.
.
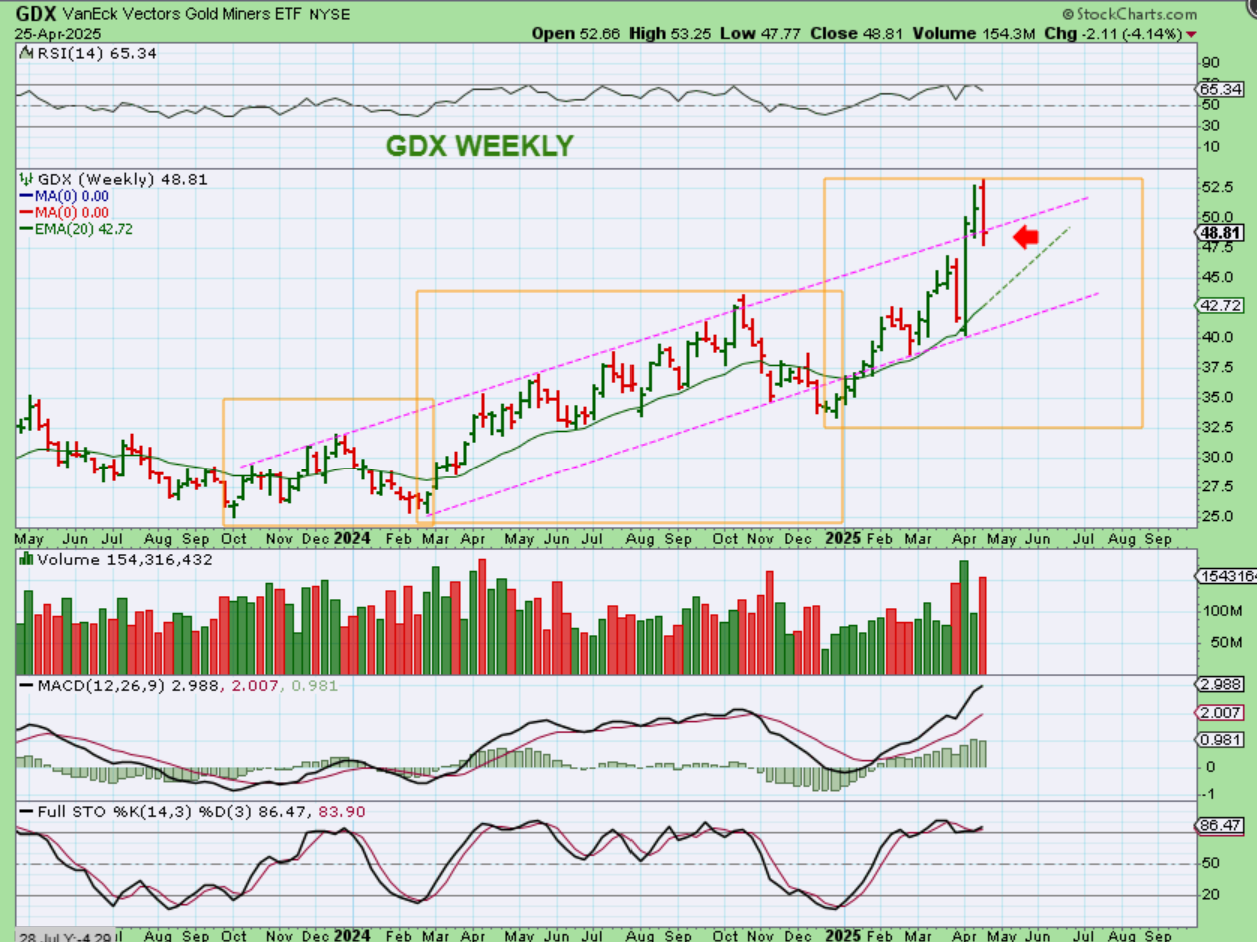
GDX – As you can see from a close up though, Miners also fell last week when Gold dropped lower. We have a high volume sell from the top and now it is pretty much back inside of that channel. Miners will likely follow Gold from here.
.
GDX – Look at the drop into the ICL from October to November 2024. GDX broke above the channel then too but then reversed and dropped to the lower end of that channel. We may see that here.
.
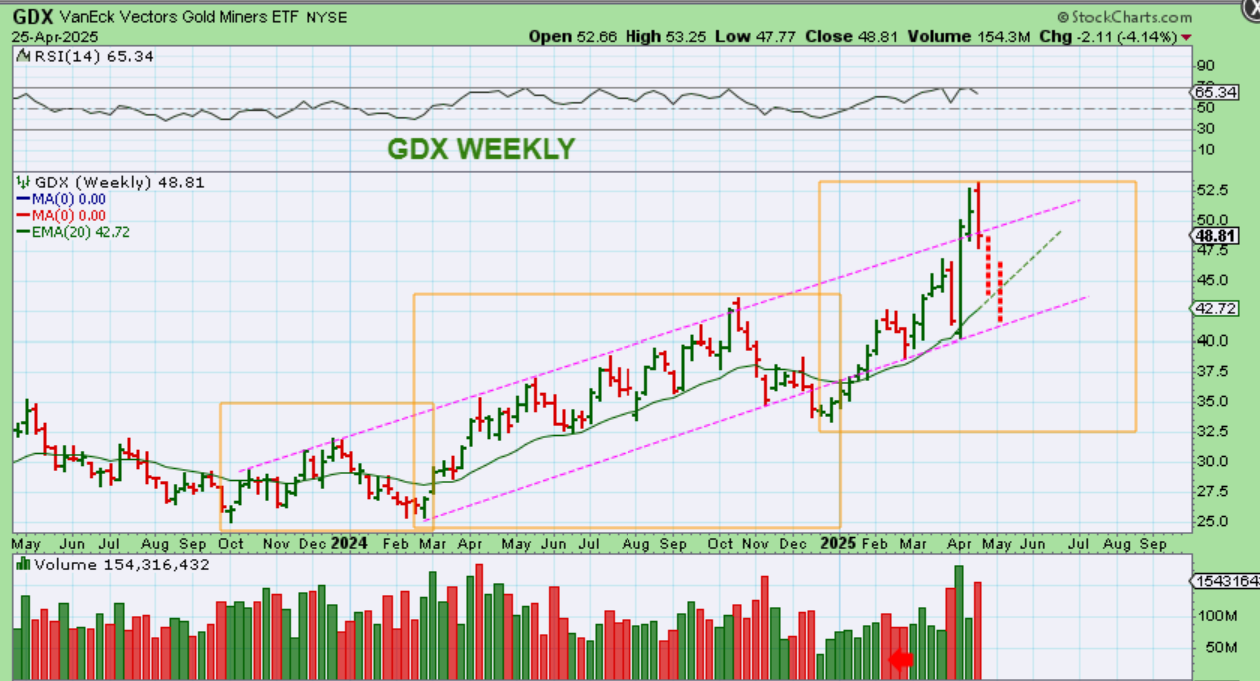
GDX – Dropping to the green 20 ema could be a dcl and then a run higher, if we have 1 more run in this intermediate cycle.
.
Please continue on below, because after Bitcoin I am going to discuss the parabolic blow off top in greater detail. Enjoy your weekend!
.
~ALEX
.
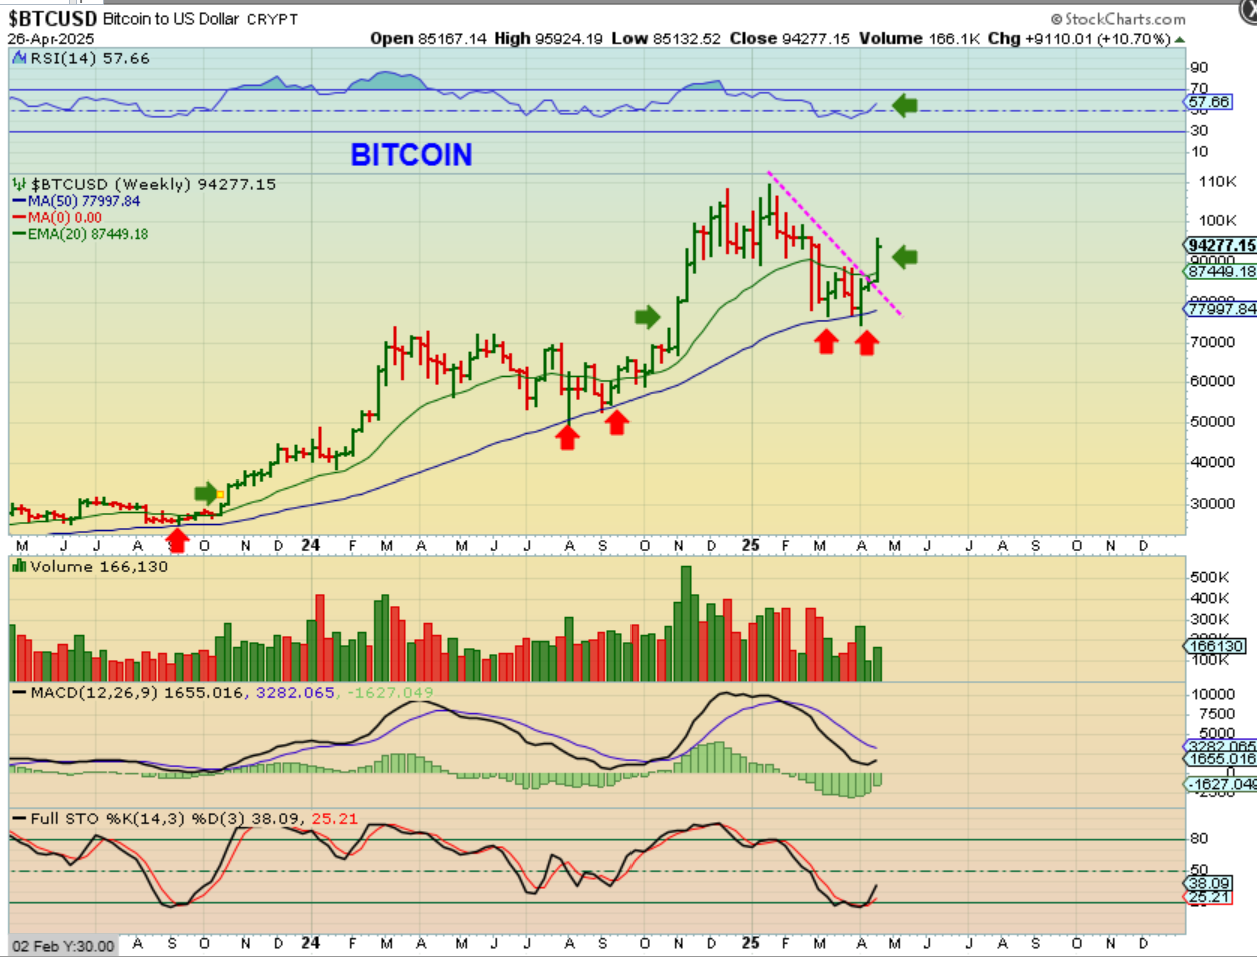
BITCOIN – For the last 2 weeks I have mentioned that the weekly chart of Bitcoin is just a bullish set up. We were pressing on the downtrend line and a break of that was considered bullish. Well, last week Bitcoin surged 10% and clearly broke that downtrend line, and crypto stick are trying to follow it out of their recent lows. SO far, so good.
.
PARABOLIC BLOW OFF TOP – I want to try to keep this simple, but I want to show you why it is so hard to detect a blow off top in ‘real time’.
.
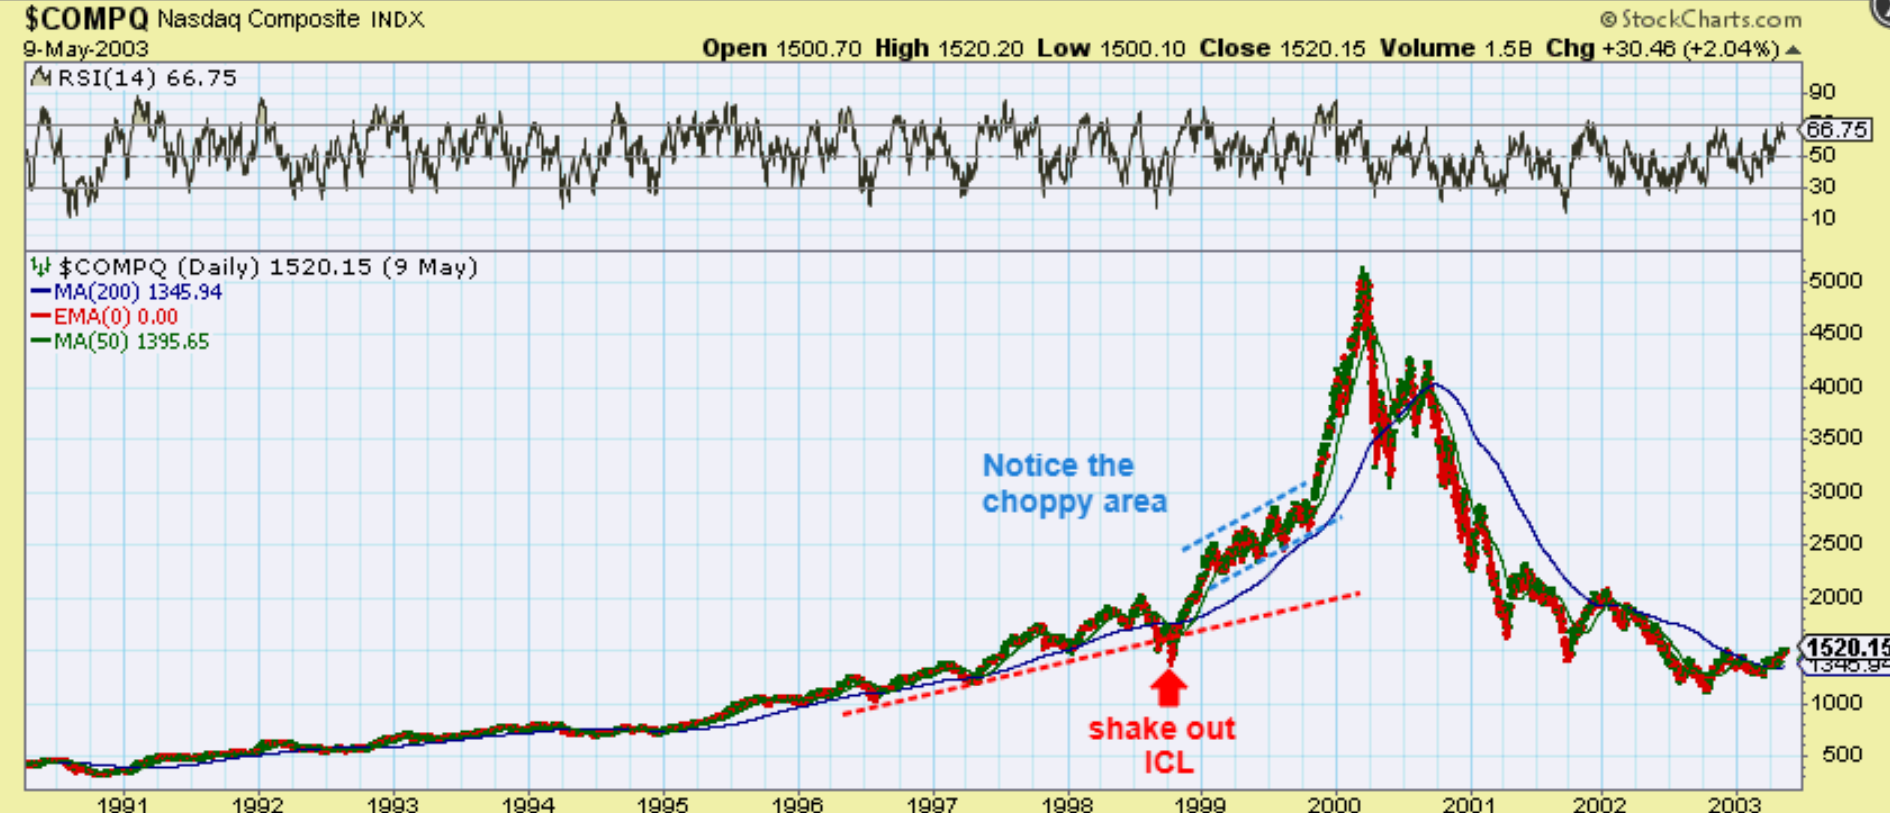
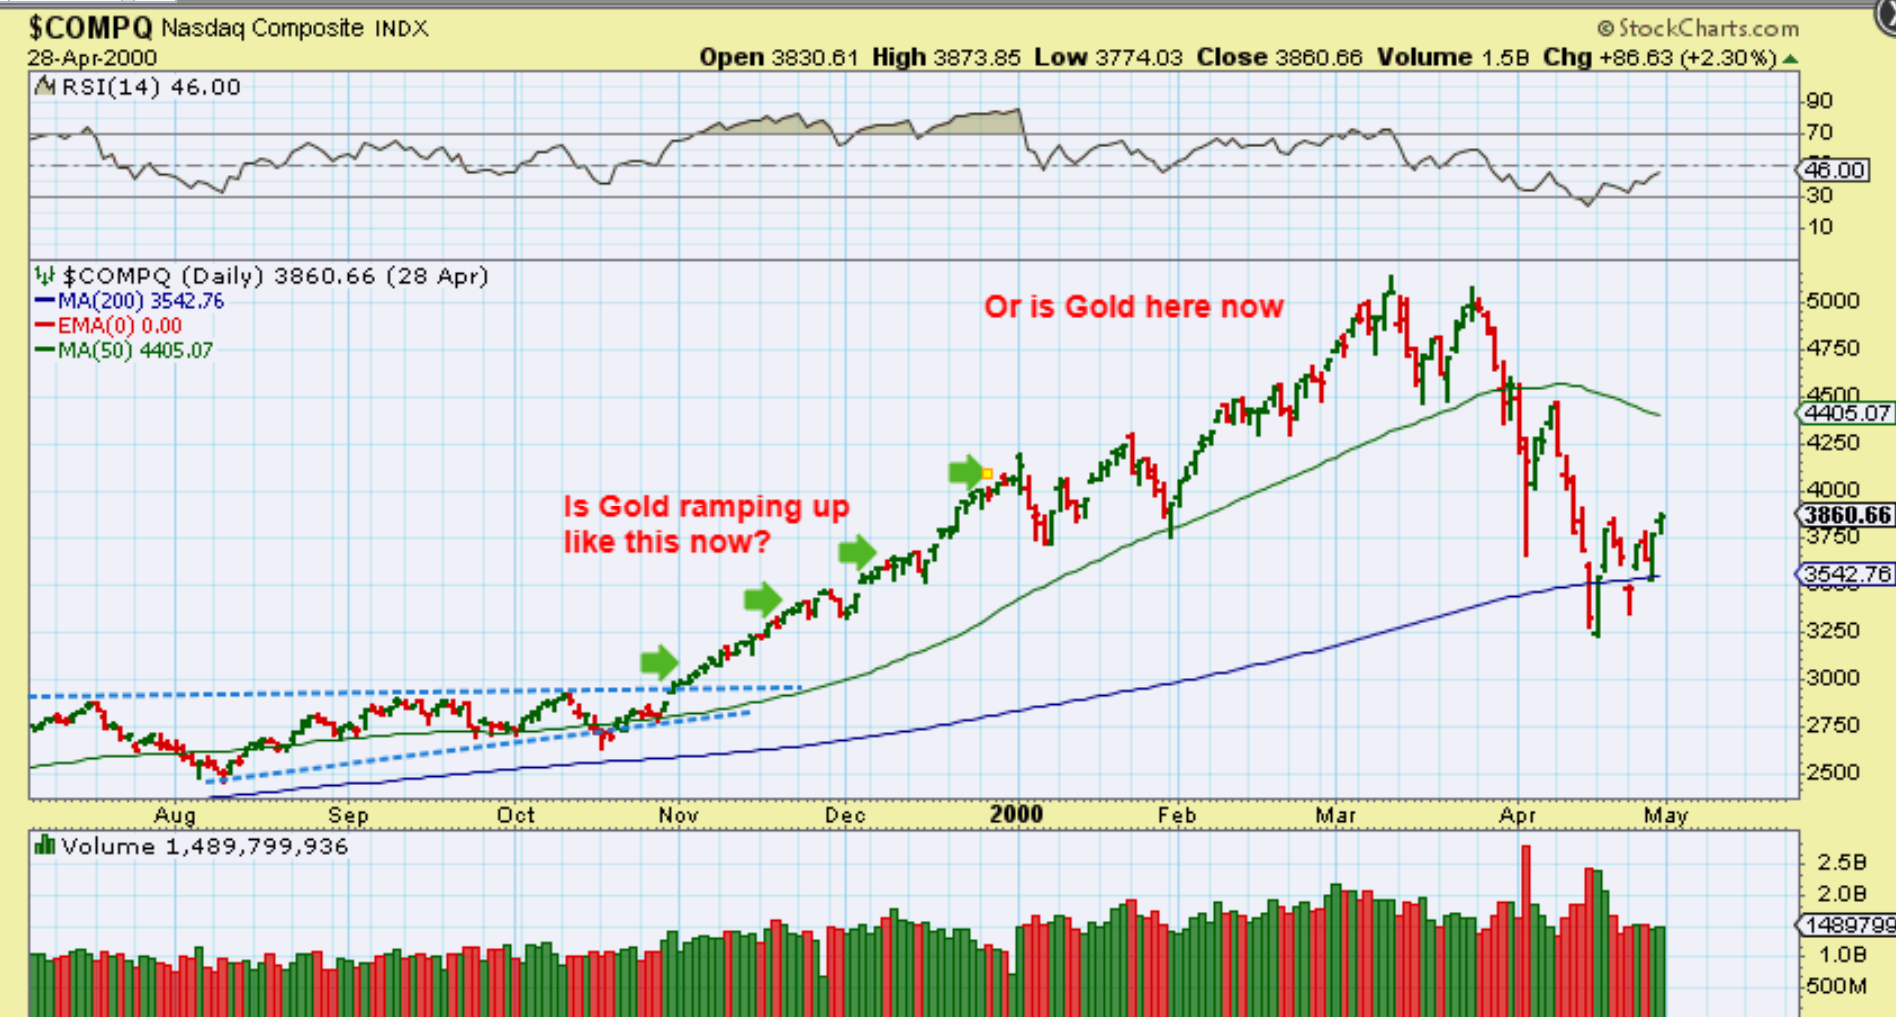
This is The NASDAQ Tech Bubble ‘blow off top’.
It is pretty easy to recognize this extreme ramp up as being a bit overheated, right? It is running so steep that it is unsustainable after a while. So, we basically saw a choppy channel higher that then ramped up, and it looks almost straight up. Now watch what happens when we zoom in.
.
Now watch what happens when we zoom in.
.
NASDAQ – That straight up move that we saw above looks a bit less extreme, right? It just looks like a ramp up like we just had with Gold. So with Gold, we could have moved out of the choppy stage and ramped up in that first run higher. After an ICL, we could get that 2nd ramp up. Now I want to show you something else…
.
Now I want to show you something else…
.
Take a look again at that very steep extreme run up again at the end of 1999 into 2000. It looks way too steep to continue, it is straight up! Well, now I’m REALLY going to zoom in…
.
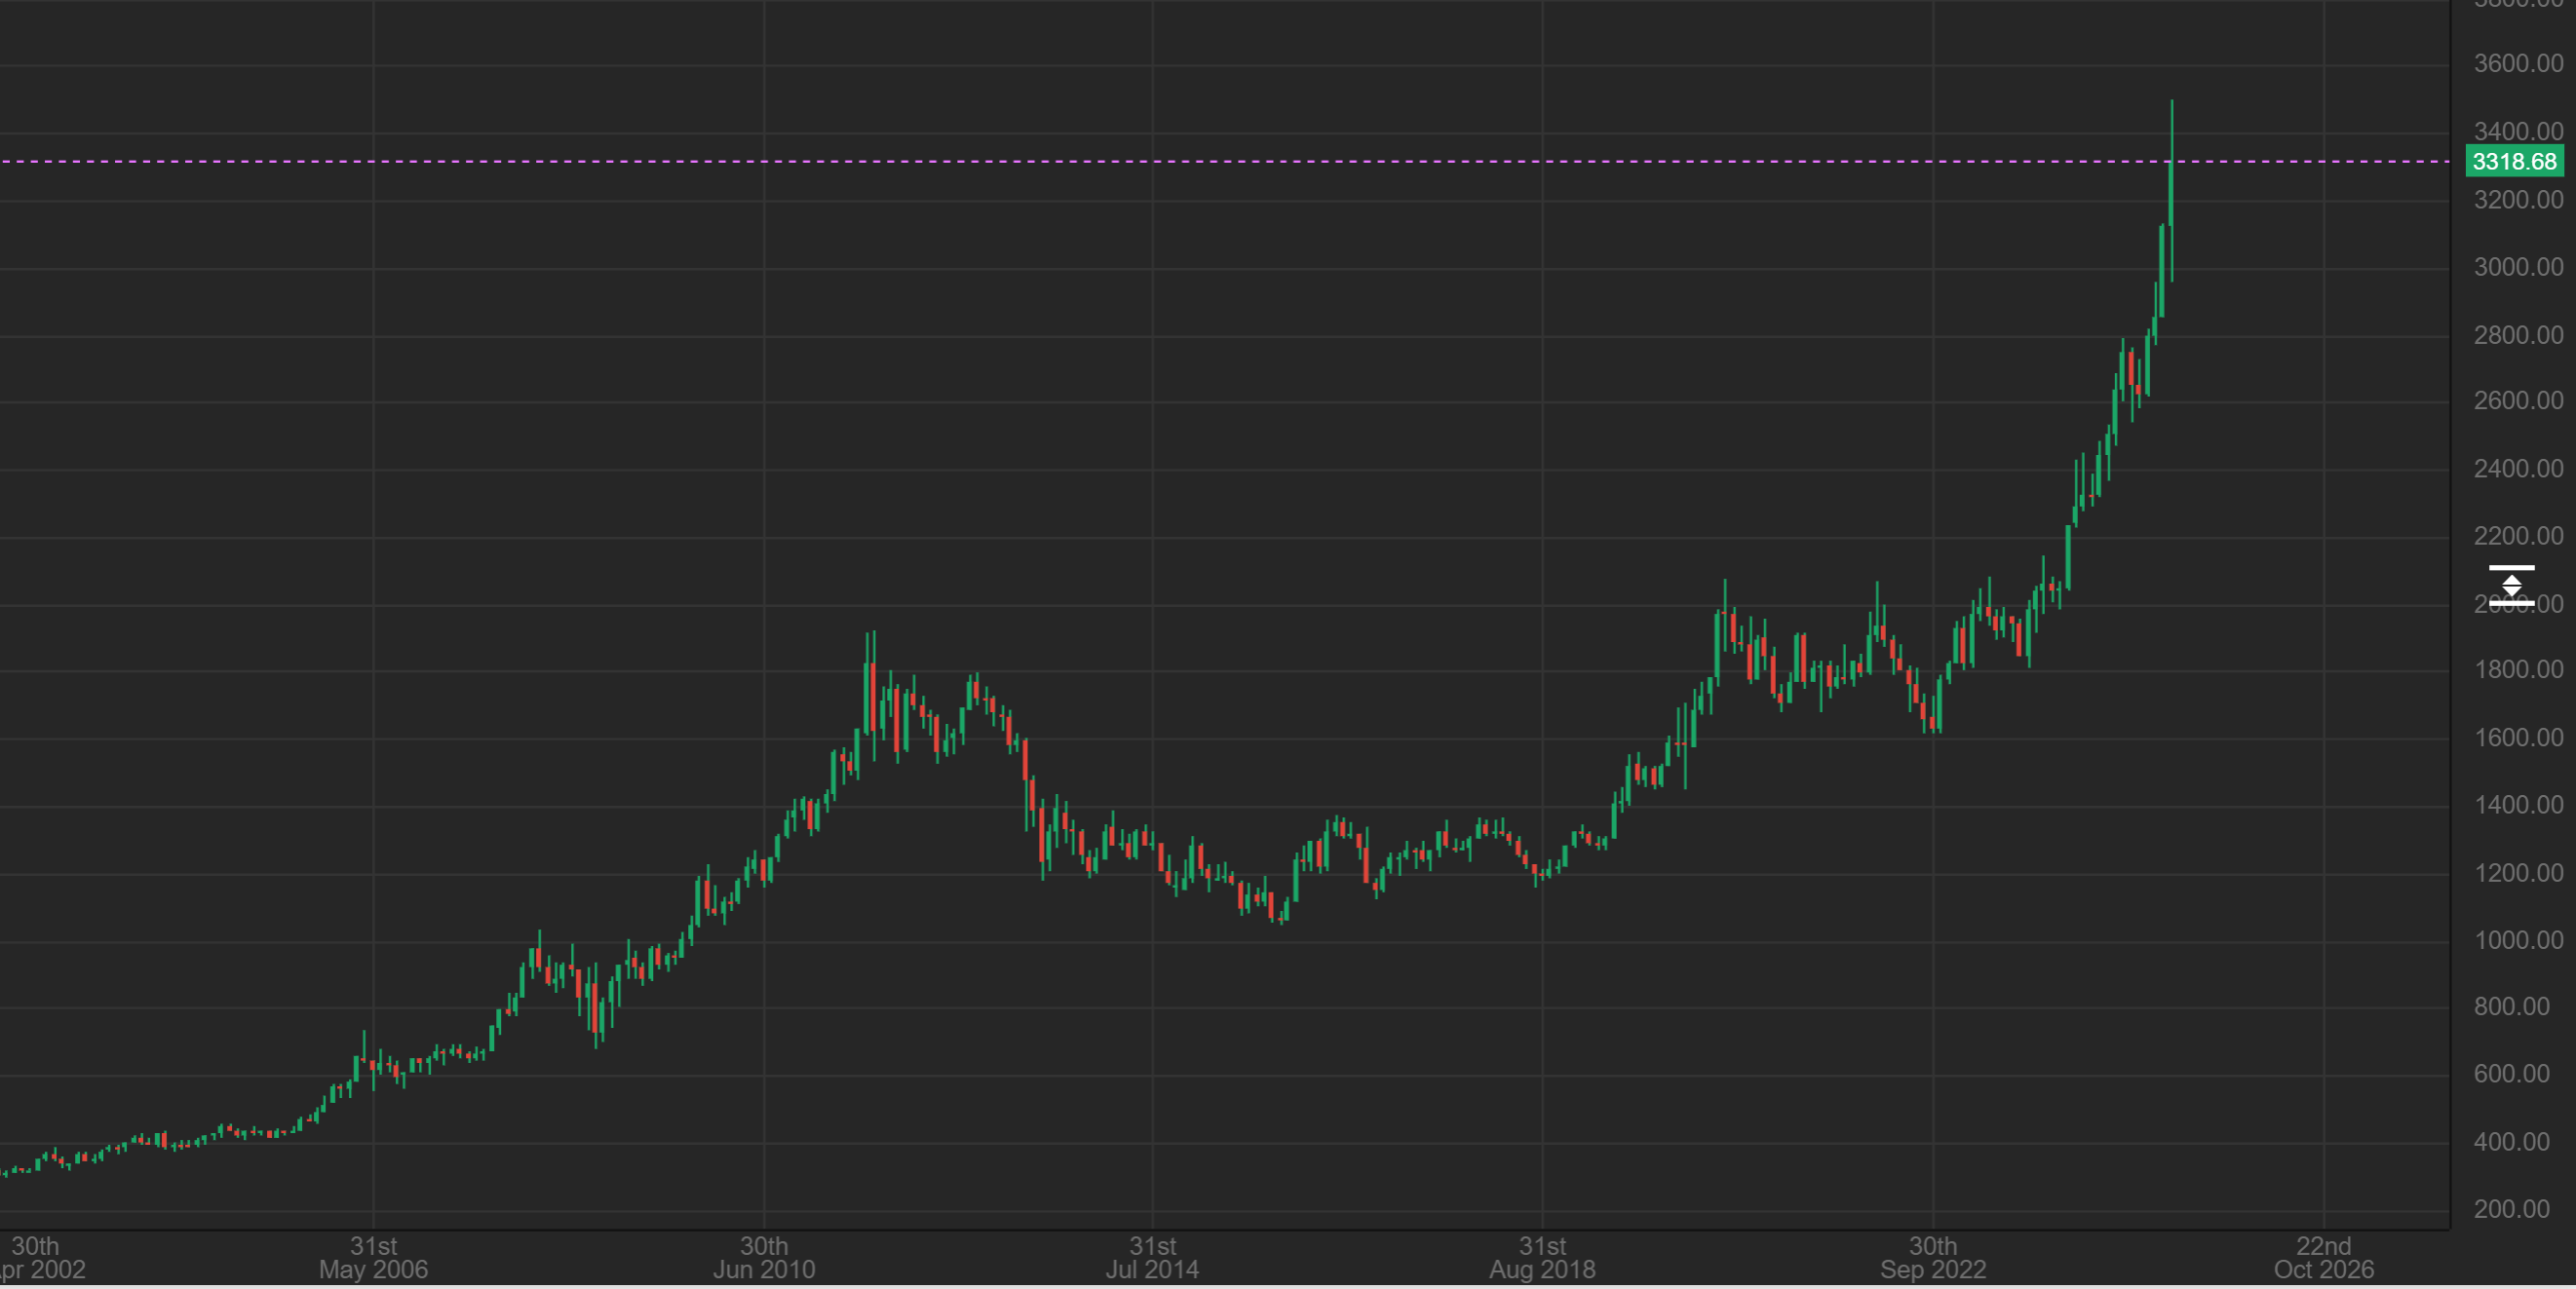
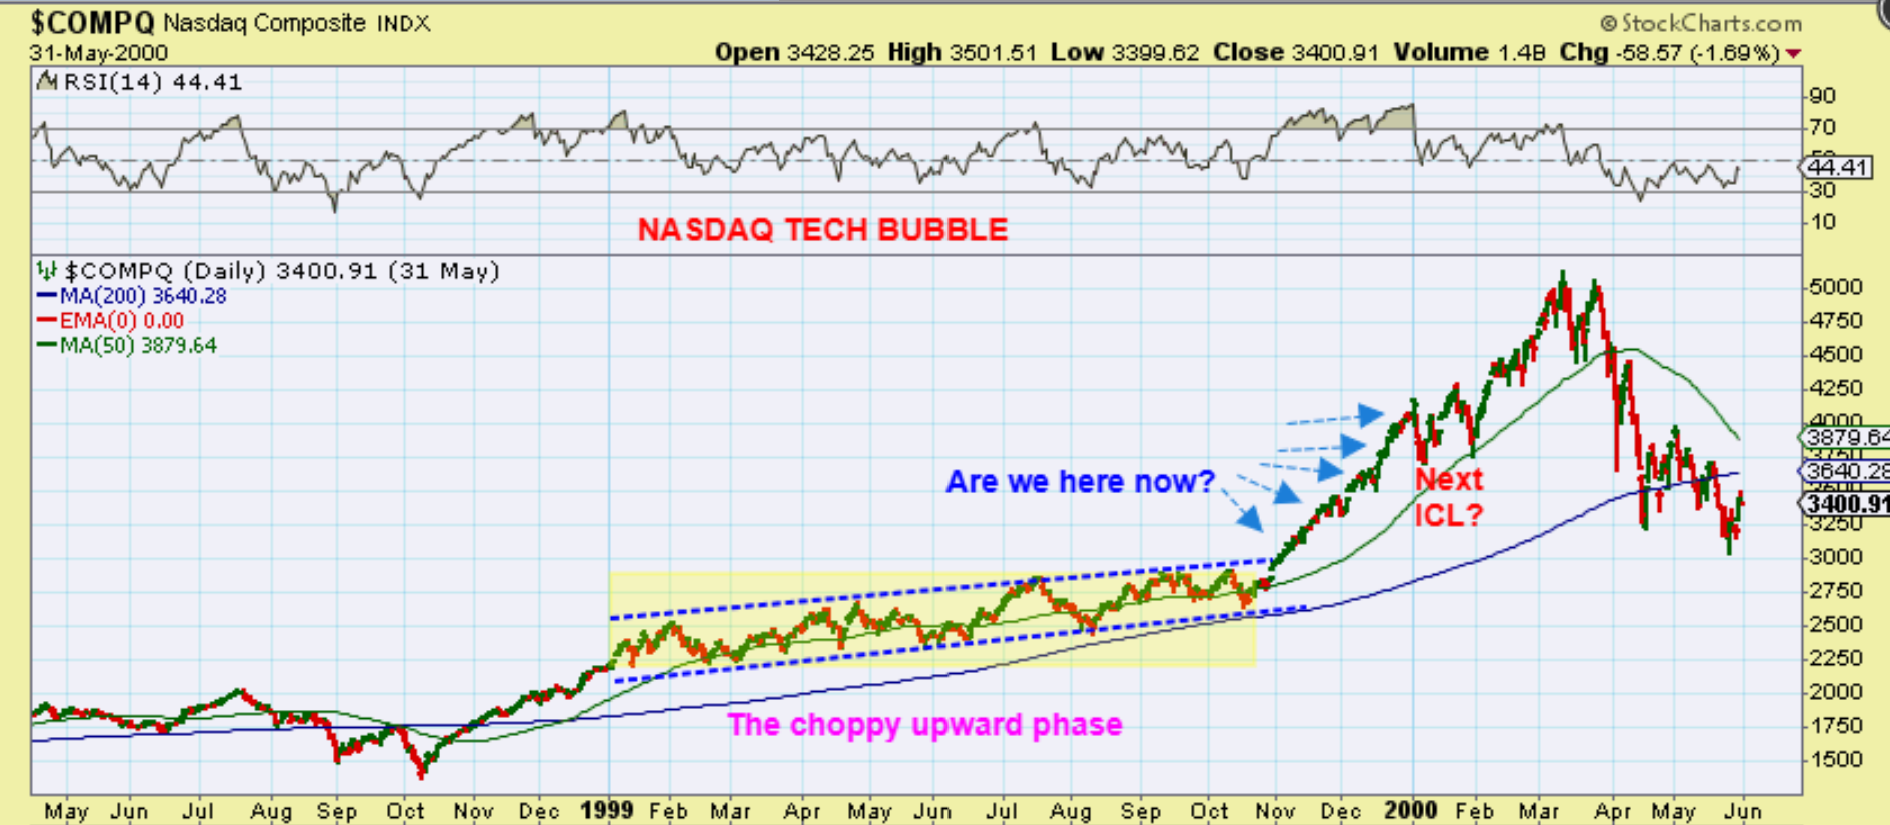
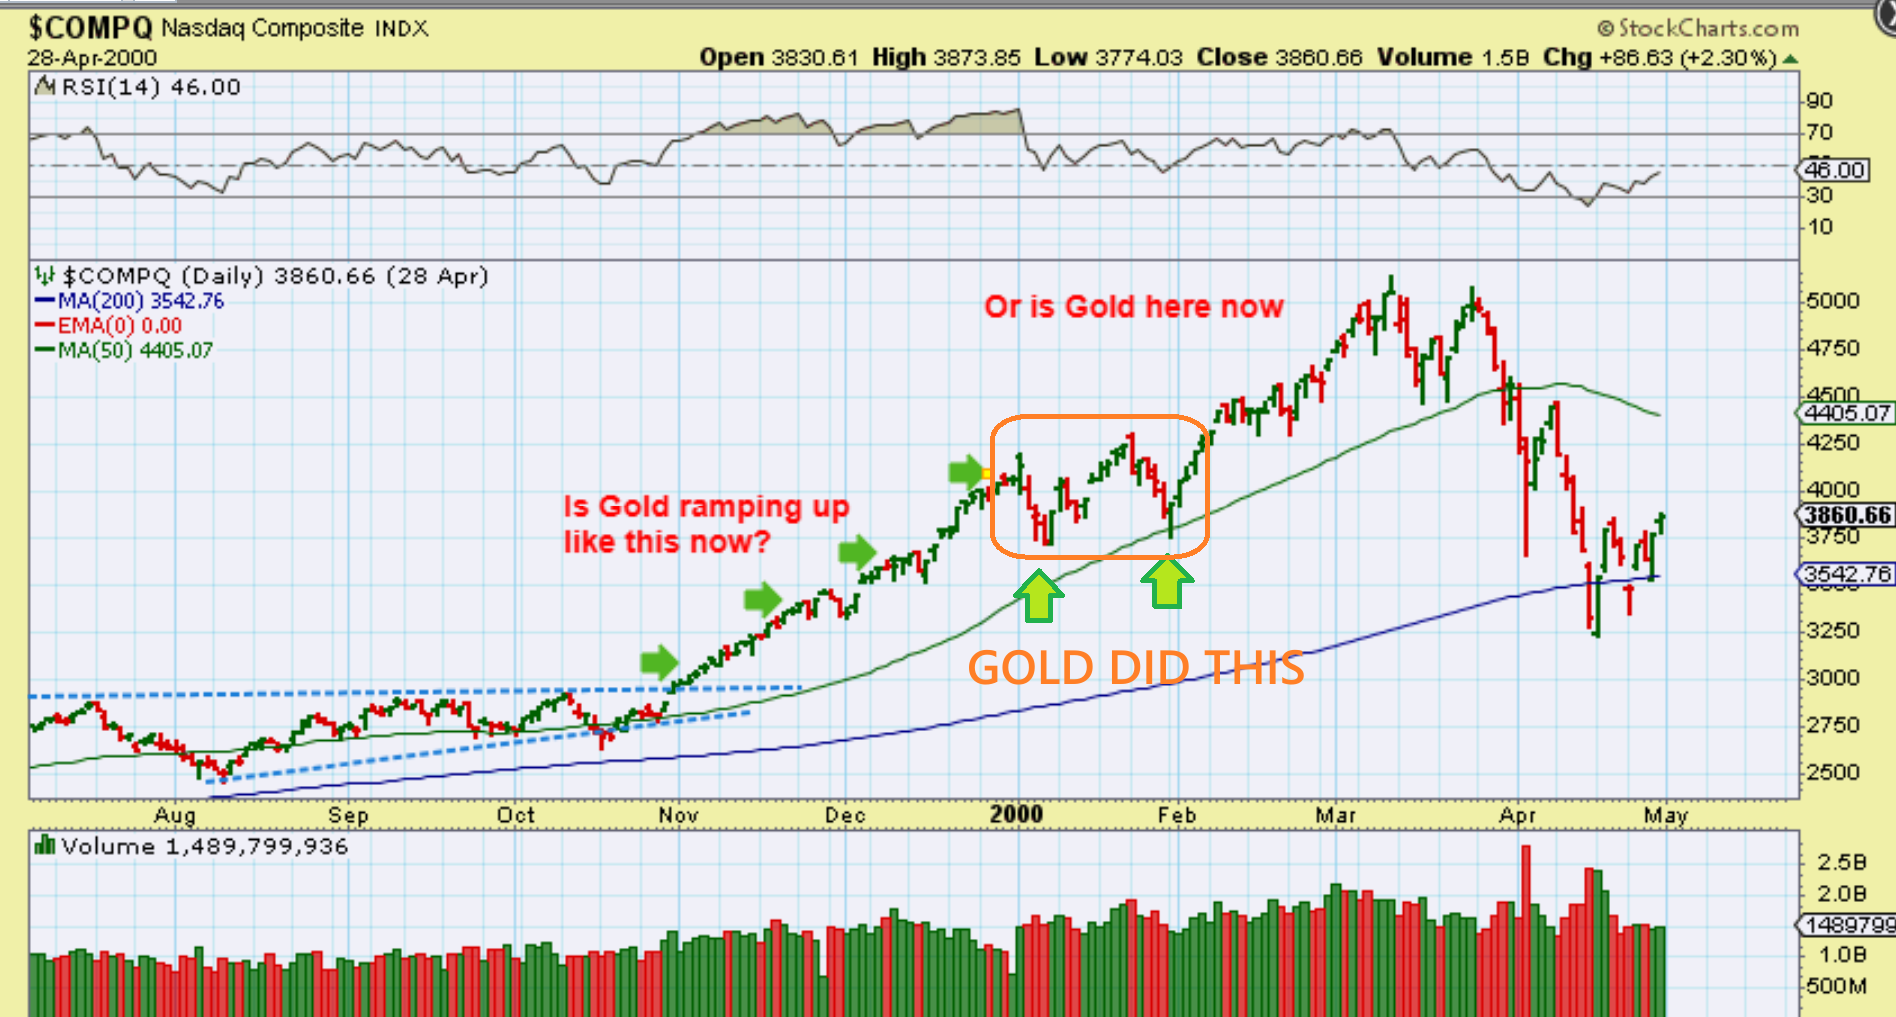
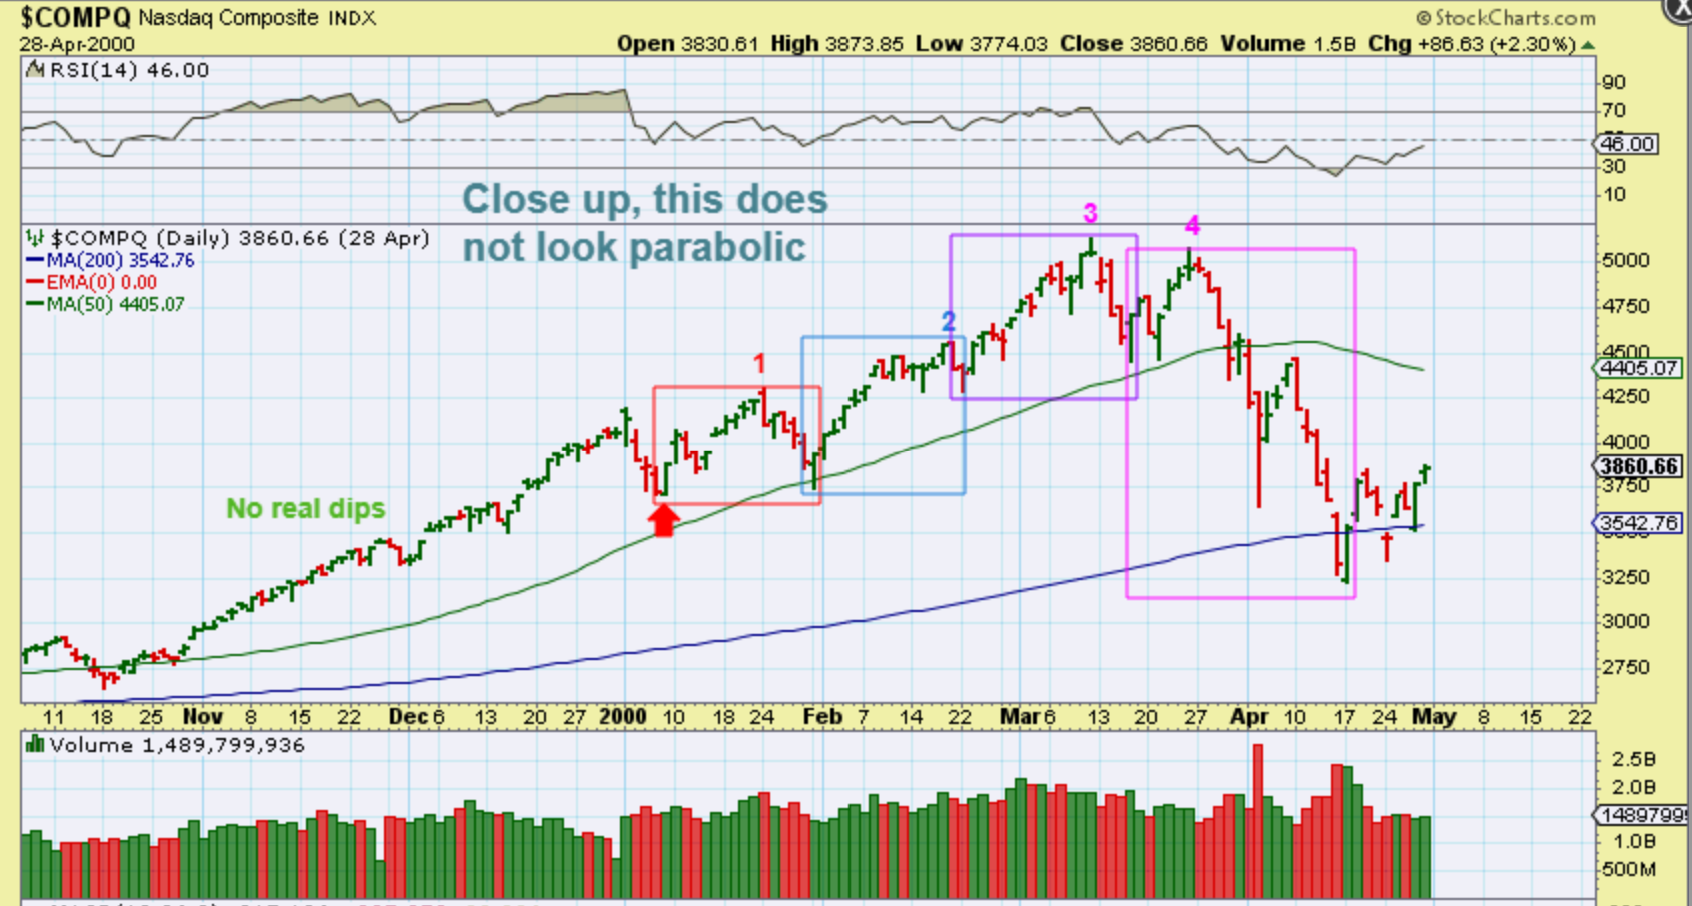
This is that same area at the end of 1999 into 2000 for The NASDAQ. This was that tech bubble blow off top in early 2000, but it looks much less extreme close up, right? This doesn’t look straight up at all (but it was). So where would Gold be on this chart with the recent ramp up? Was it even steeper than this run? Well, lets take another look…
.
FIRST: NOTICE THAT DROP INTO AN ICL in the orange square and then the 2nd run up was the ‘peak’.
.
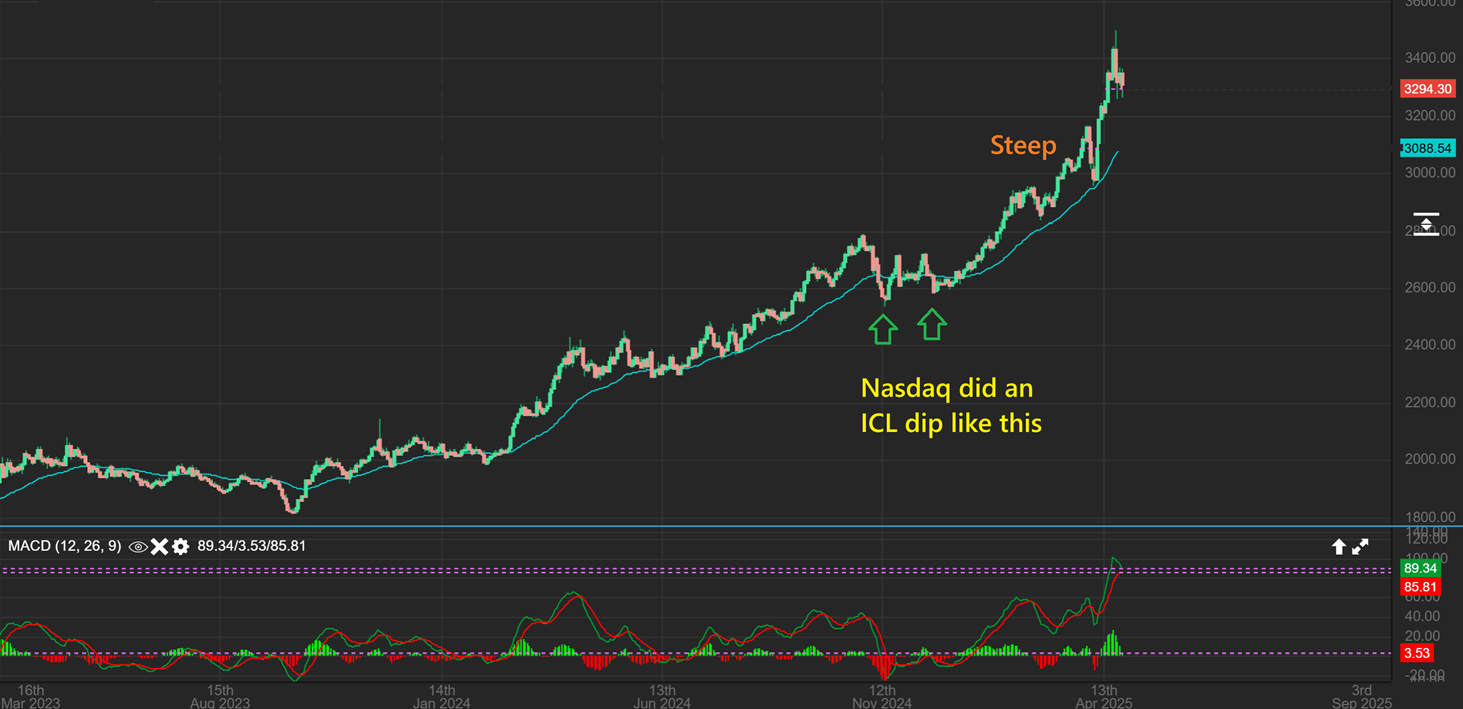
NOW TAKE A LOOK AT GOLD, and we had the same drop into an ICL before a final ramp up. And when I look at Gold here, it looks like it might be steeper than that NASDAQ run.
.
NASDAQ – And again, that straight up run in the NASDAQ does not look all that steep here. Gold looks steeper than this. The NASDAQ did 3 daily cycles higher and peaked. Gold just did maybe 4 daily cycles and peaked.
.
NASDAQ -Finally, this was, again, that tech bubble blow off top, and it looks very steep from a distance, but not so steep close up. And…
.
GOLD MONTHLY -This is Gold compared to that tech bubble blow off top above, and it looks very steep from a distance, and gold even looked steep close up. WAS THIS A TOP FOR GOLD AT $3500? Based on these charts, it just might be a temporary top at $3500, unless we do one more run to $5000. It is not always easy to tell in ‘real time’, because it doesn’t look ‘too steep’ close up. Will Gold make 1 more run now or not? It is hard to say for sure, but we have a weekly topping candle on a steep run higher. Stay Frosty and USE STOPS.