April 13th Weekend Report
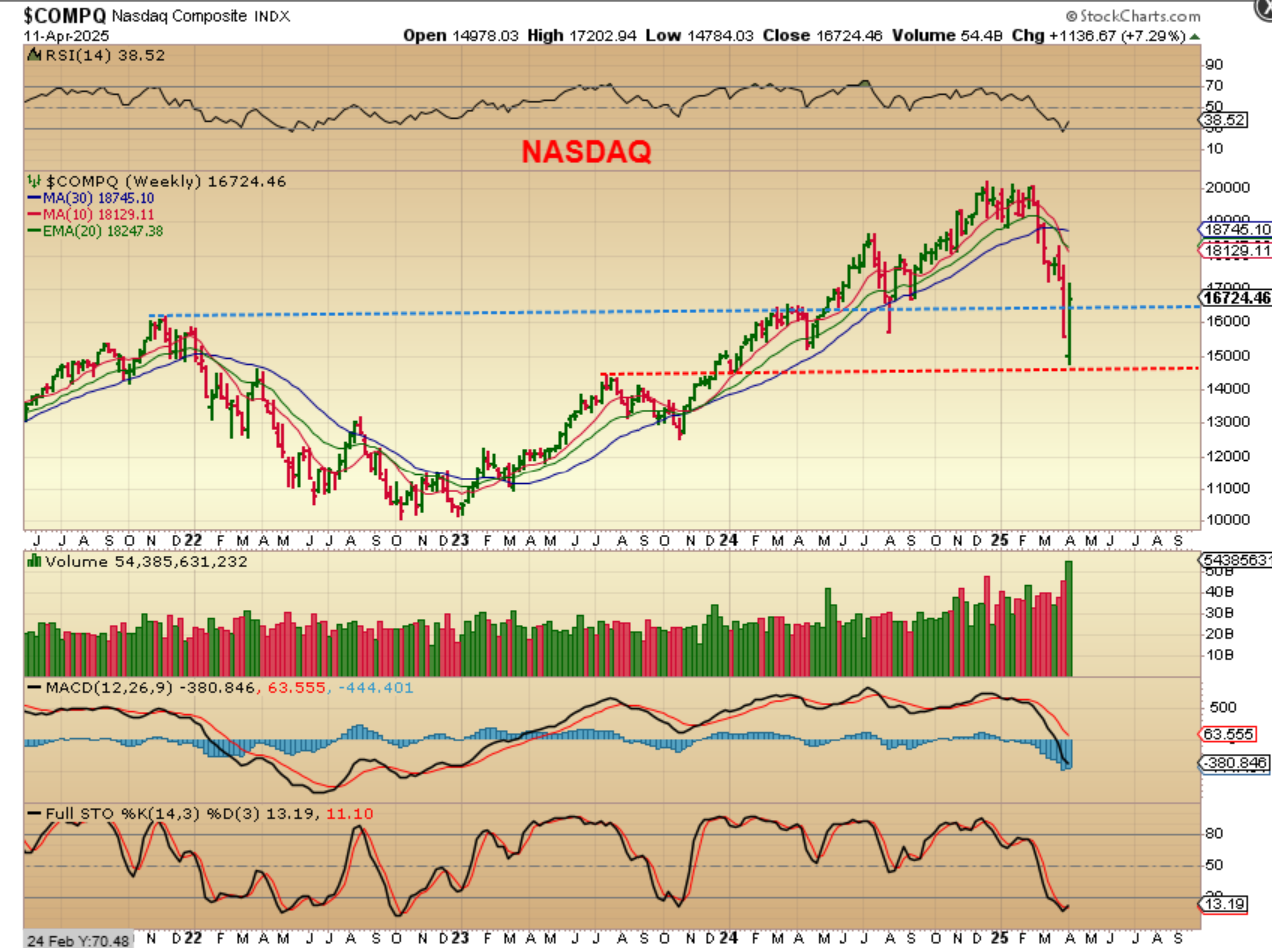
NASDAQ WEEKLY – This could be an A-B-C Crash down into an ICL, but as you know, the ‘timing’ on the daily cycle is shorter than normal. It has happened in the past and I’ve discussed that, but it has to be noted that more downside is possible. I’ll discuss that, but for now we see a very large reversal in the general markets last week.
SPX – This is where I point out that normal daily cycles are roughly 35 days long and we would only have a day 17 low at this point. Last week I showed you where this HAS happened in the past in 2023, when we had a crash into a day 18 low.
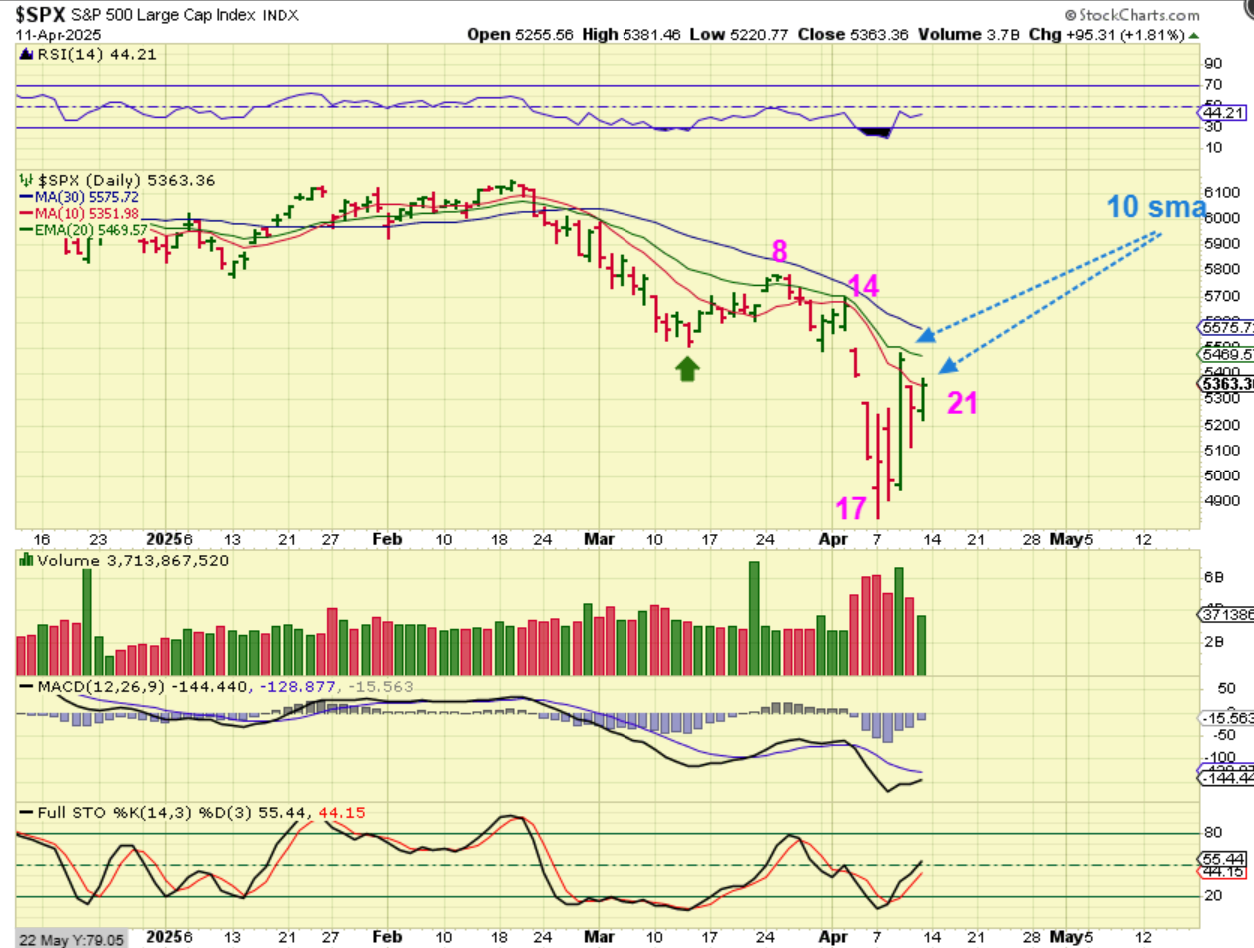
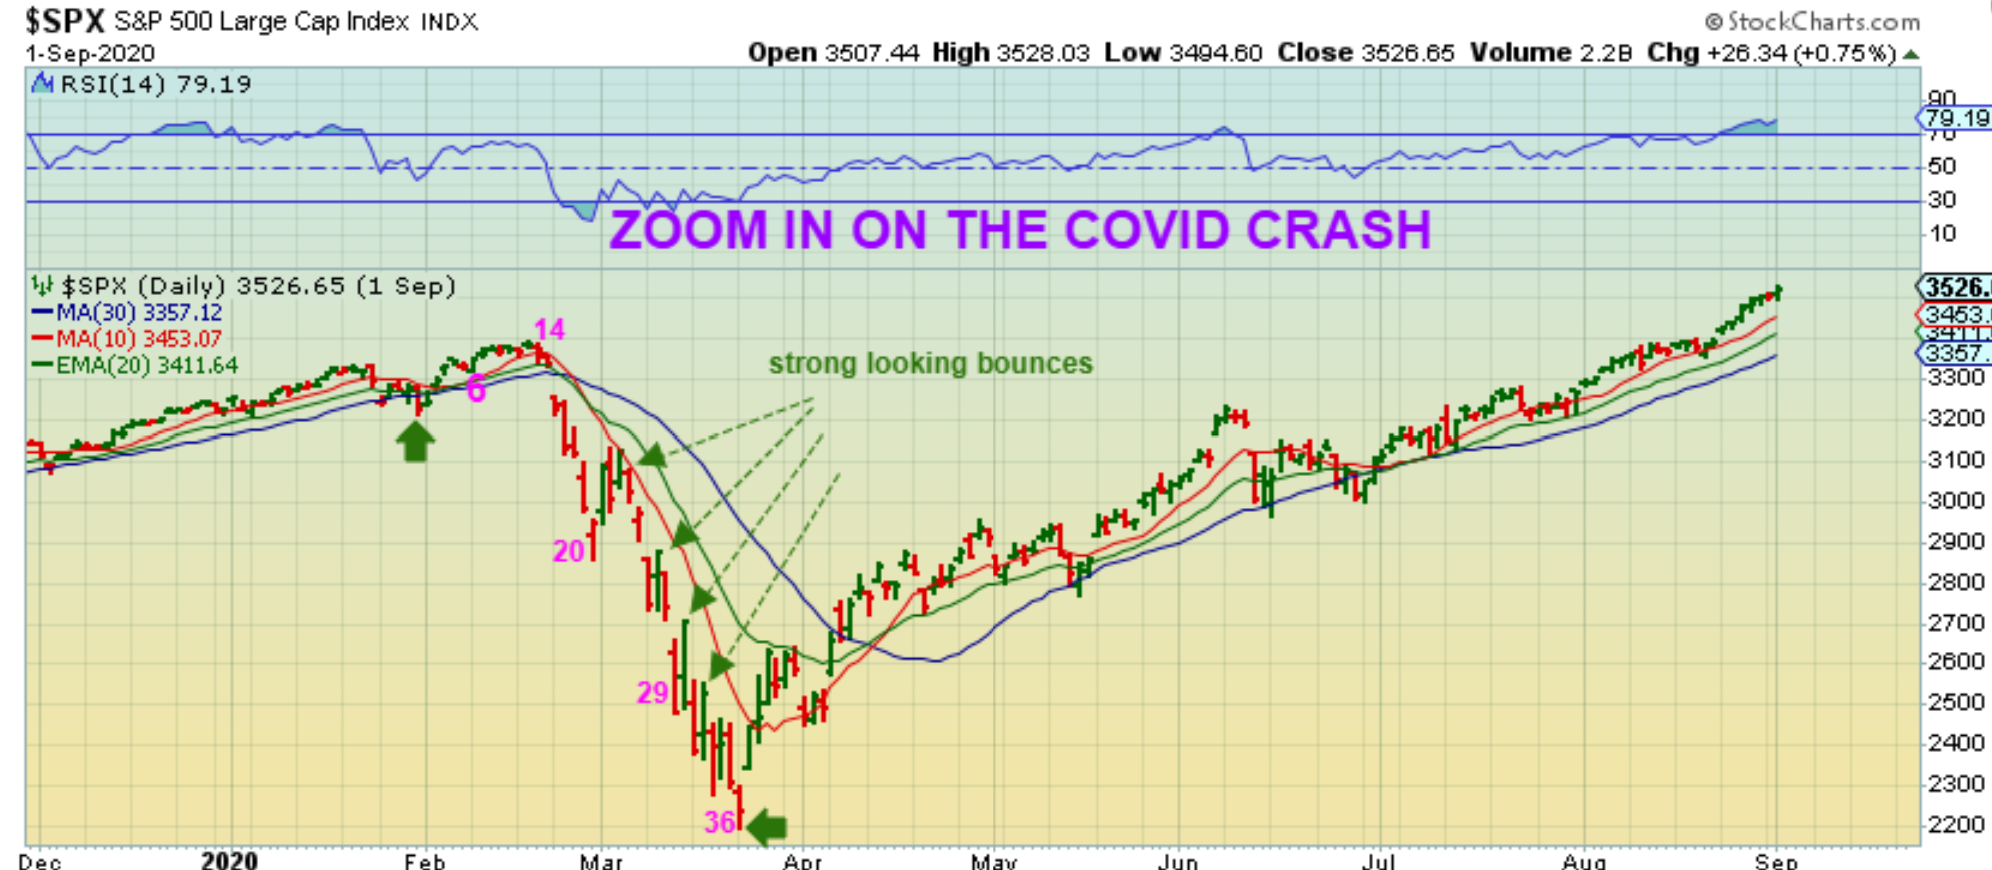
SPX – So now I’m pointing out a reversal at day 20 during the covid crash that bounced, dropped, bounced, dropped, bounced, etc. This is why we would use a stop if we go long and raise it as price runs higher. Noteworthy is the fact that price couldn’t bounce above the red 10 sma. The current bounce is at the 10sma now.
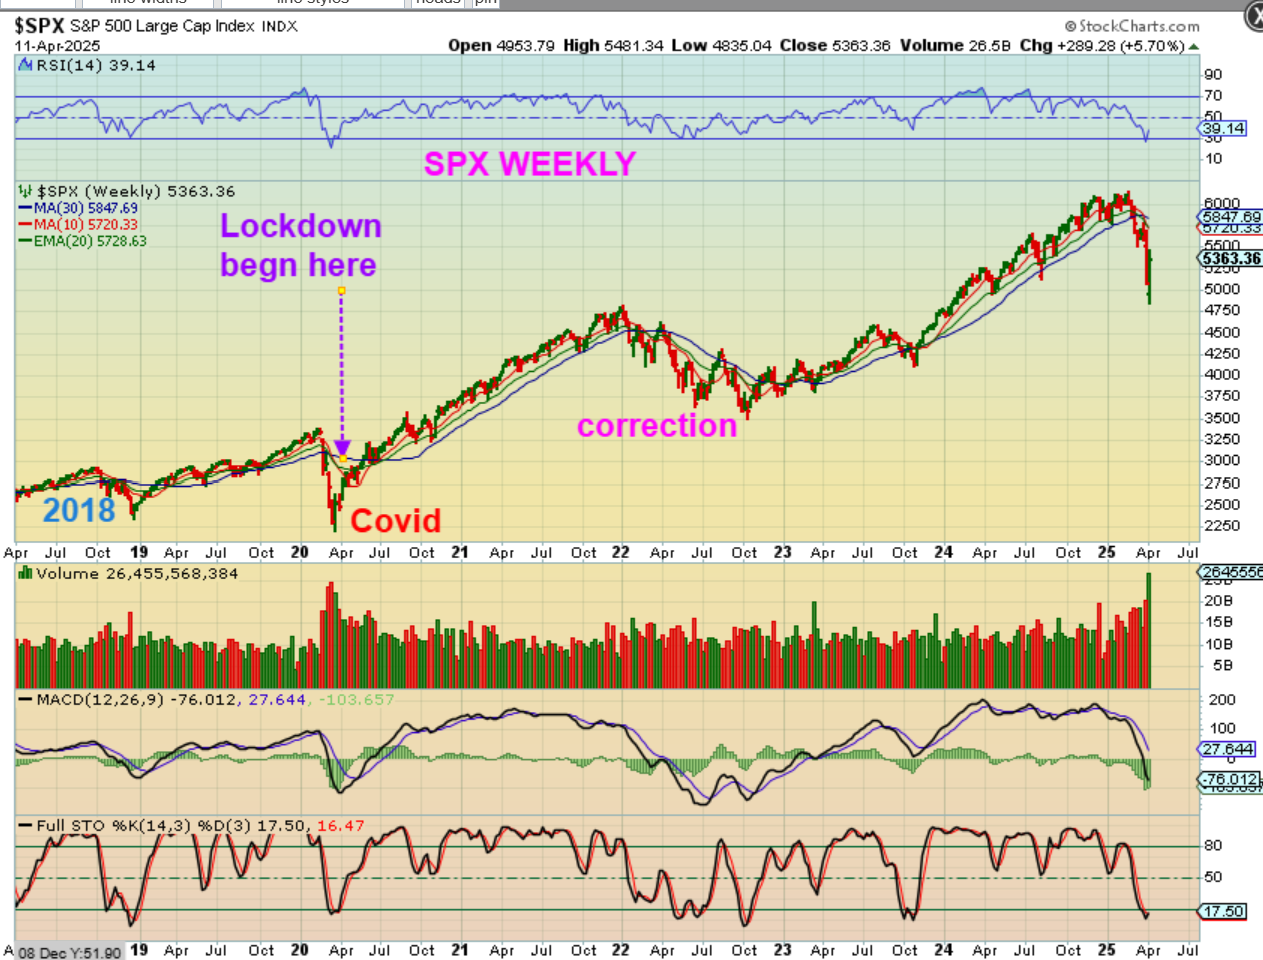
SPX WEEKLY –
1. Currently we saw a strong reversal last week after a steep crash.
2. It looks similar to the Covid crash & weekly reversal at the lows
3. What about future tariff changes, economic bad news, and recession threats? Well, when the Covid crash took place, it bottomed right when the ‘lockdown’ phase came about, there were no vaccines yet, and deaths contributed to Covid ramped up fast all through 2020 and into 2021. The markets rallied as they climbed a wall of worry. We’ll see if that can happen again.
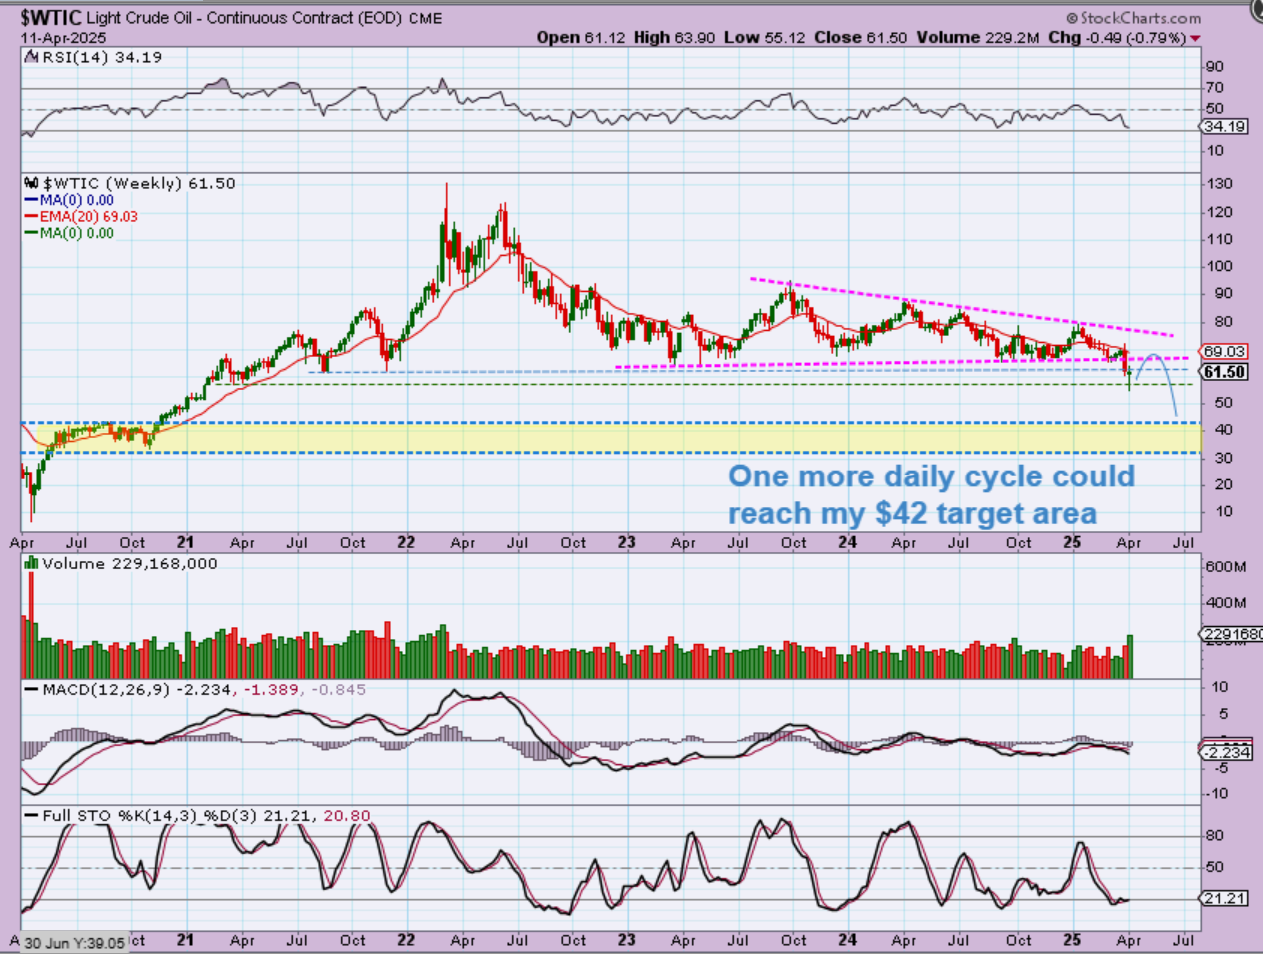
WTIC also gave us a bounce and a reversal candle on the weekly chart. Timewise we could have another daily cycle and that would give us a bounce, a back-test, and another drop.
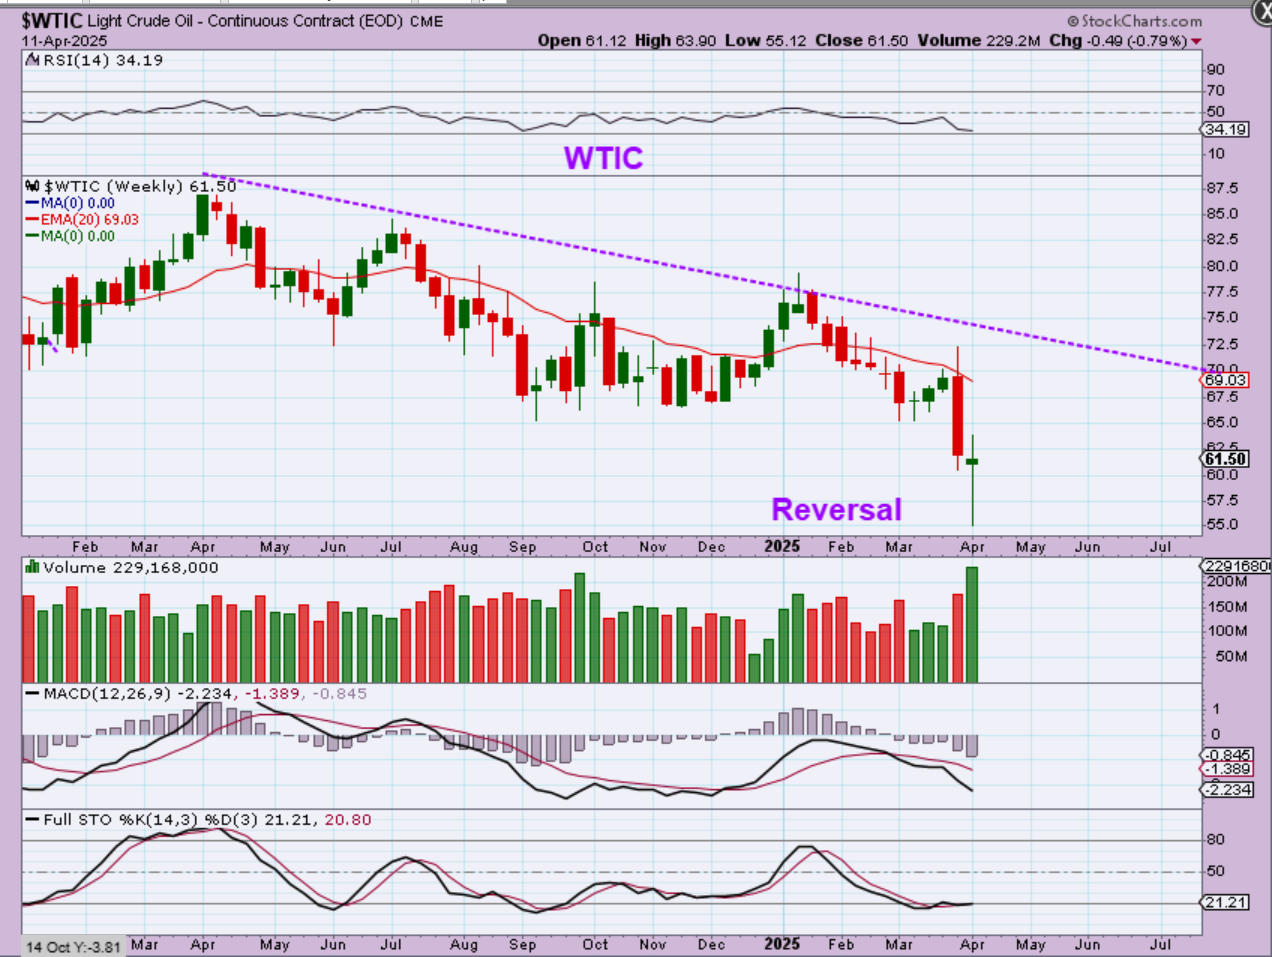
WTIC – Timewise we could have another daily cycle and that would give us a bounce, a back-test, and another drop that could look like this.
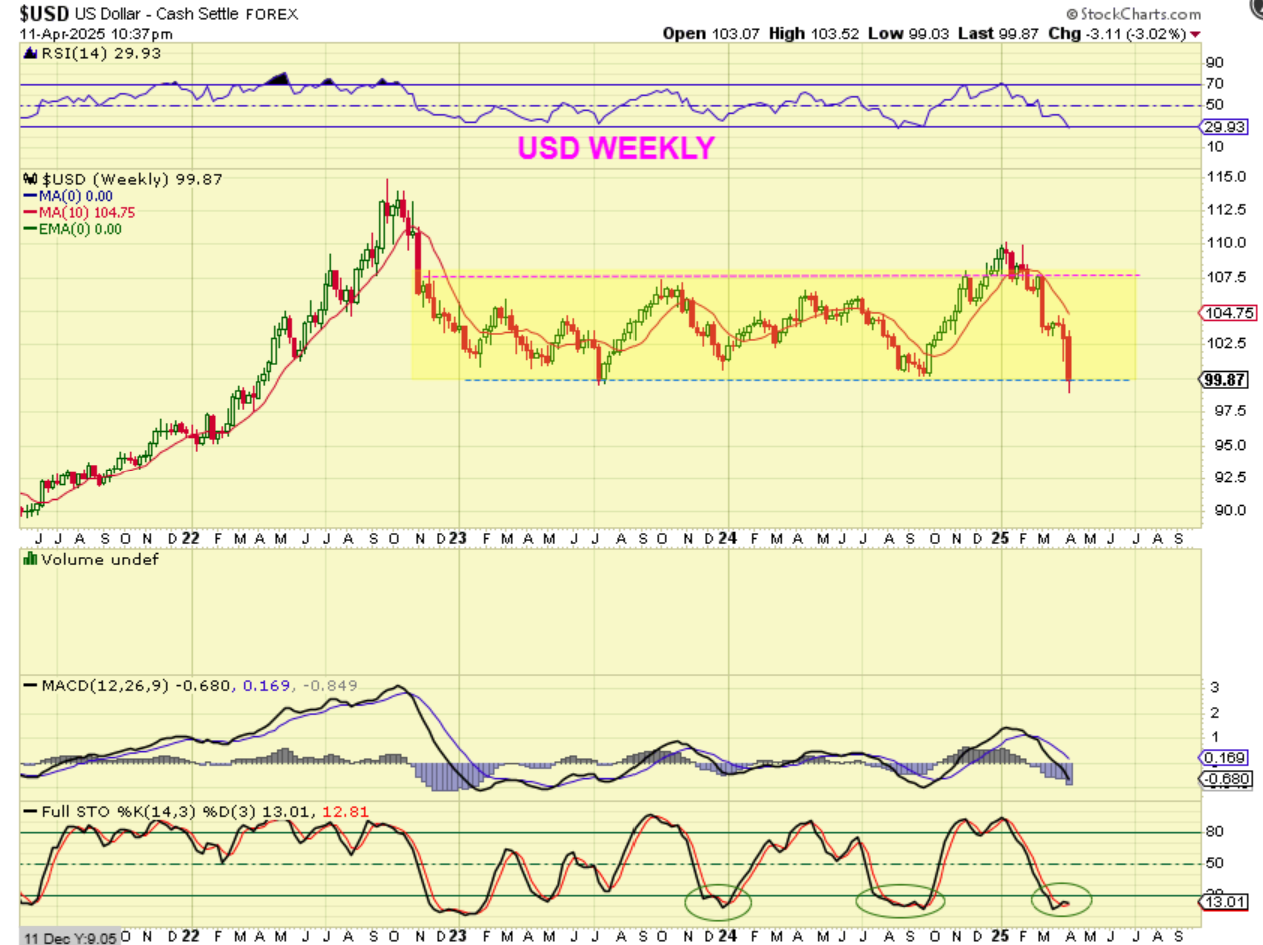
THE USD broke lower as expected, but it actually took out the multiyear lows already. This is the area that I felt the USD could bottom, act as support, and move higher. So far the USD has not affected Gold, but if this bottomed and runs higher, Gold may ‘peak’ and drop into an ICL.
.
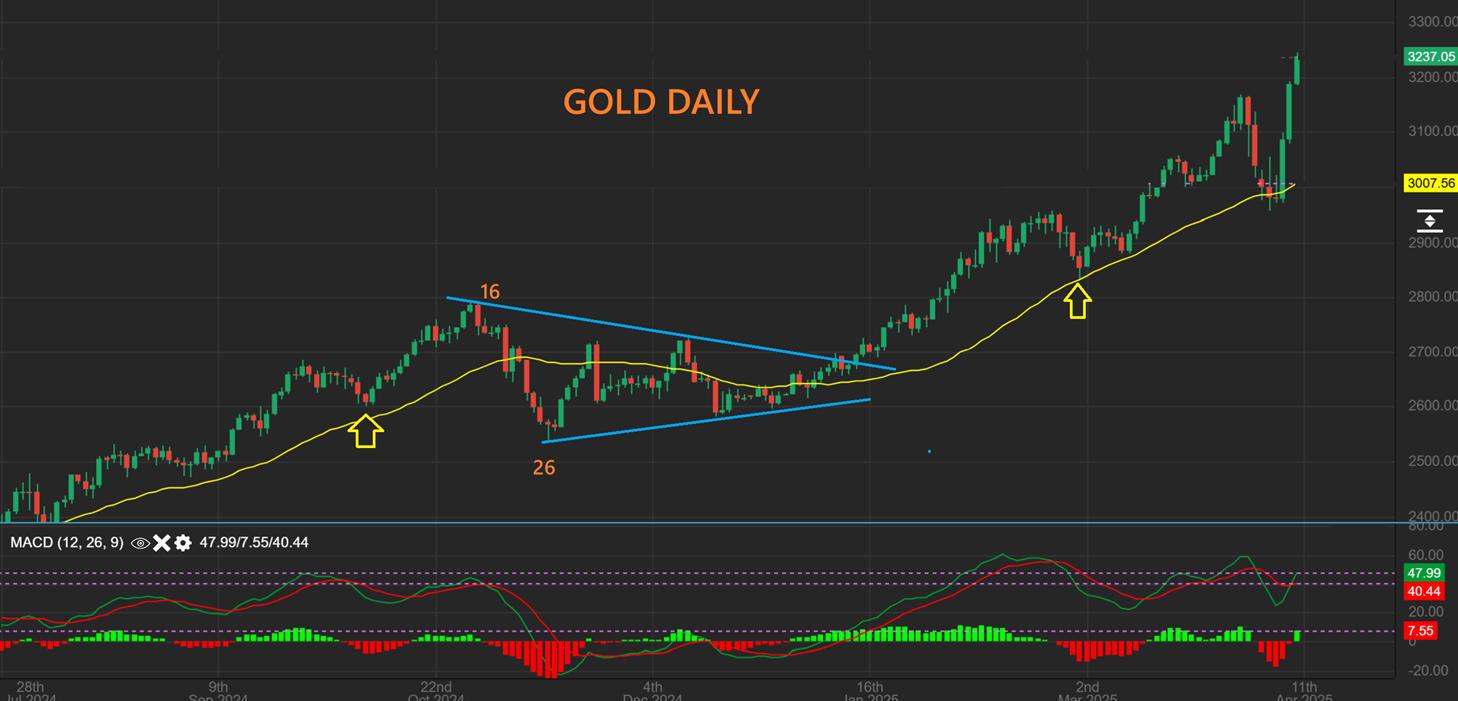
GOLD put in a dcl last week and then it shot straight up to new highs on day 2,3, & 4. Now what?
.
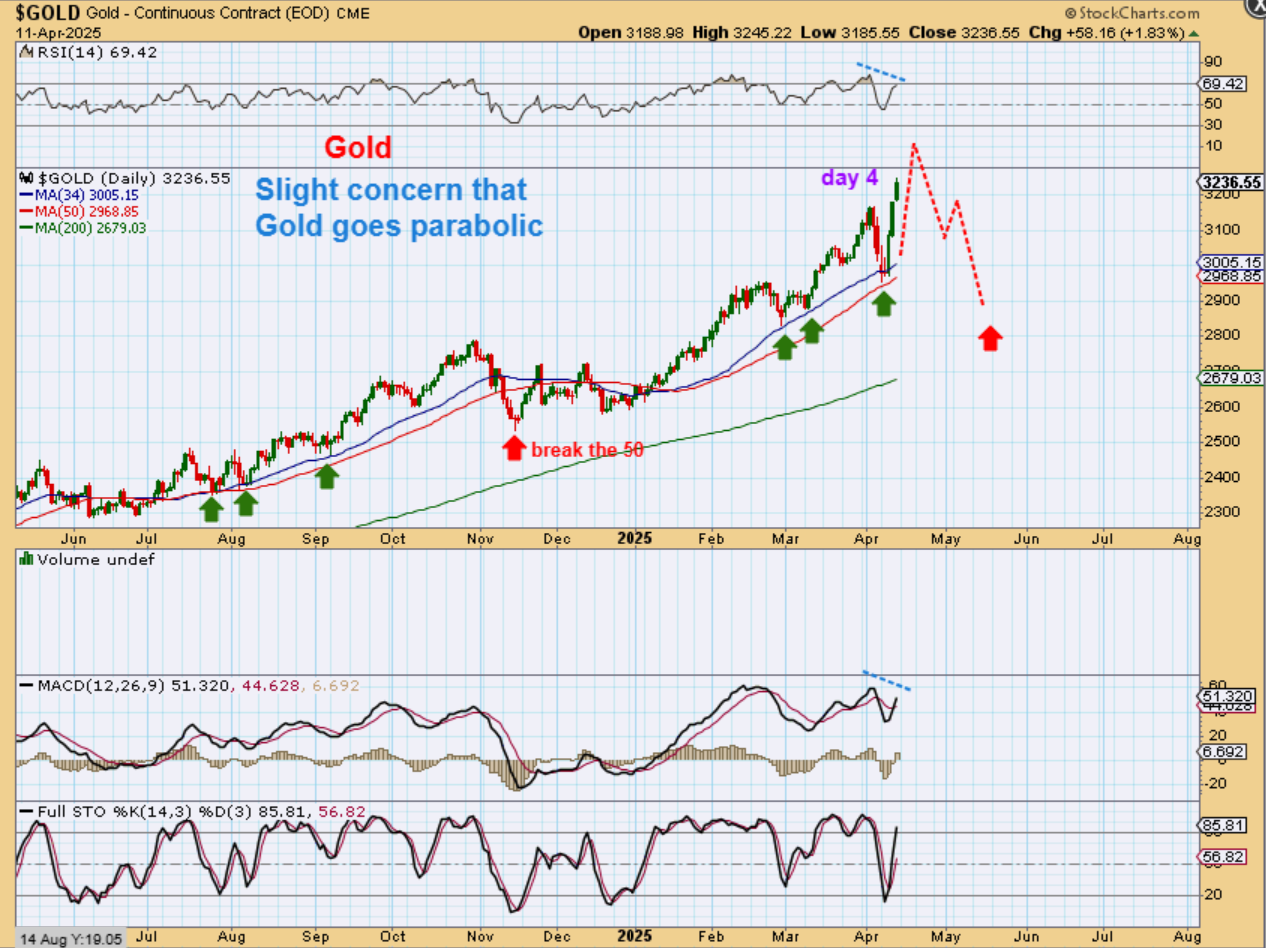
Now what? That is a tough call in such a strong bull market, especially since we are only on day 4 and even a L.T. Daily cycle can peak at day 11 or so. That DOES concern me that Gold could go parabolic and then crash into an ICL. For now, though, I’ll draw it different from that.
.
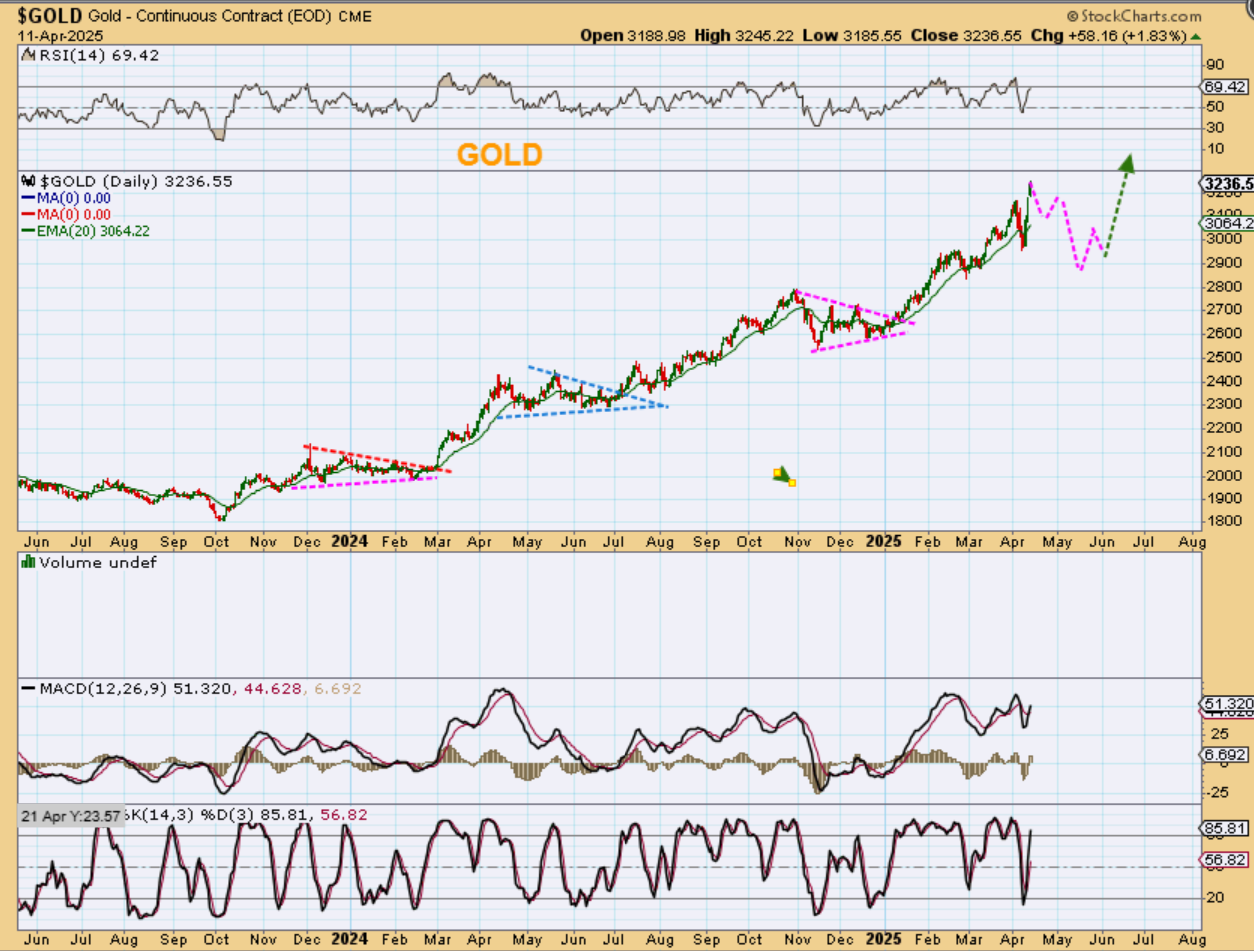
GOLD – If we get another normal daily cycle and drop into an ICL, it could give us a pop and drop similar to what I have drawn here. That selloff into an ICL in November was quick and Gold may have seemed too strong to fall like that at the time. That is why I am pointing out that it dropped and lost the 50sma, and we can see that happen again (possibly with a USD bounce).
GOLD – So again, based on past choppiness that gradually dipped Gold into an ICL, I can draw this daily cycle this way as a possibility going forward. It could include a little more upside first, since we are only on day 5 Monday.
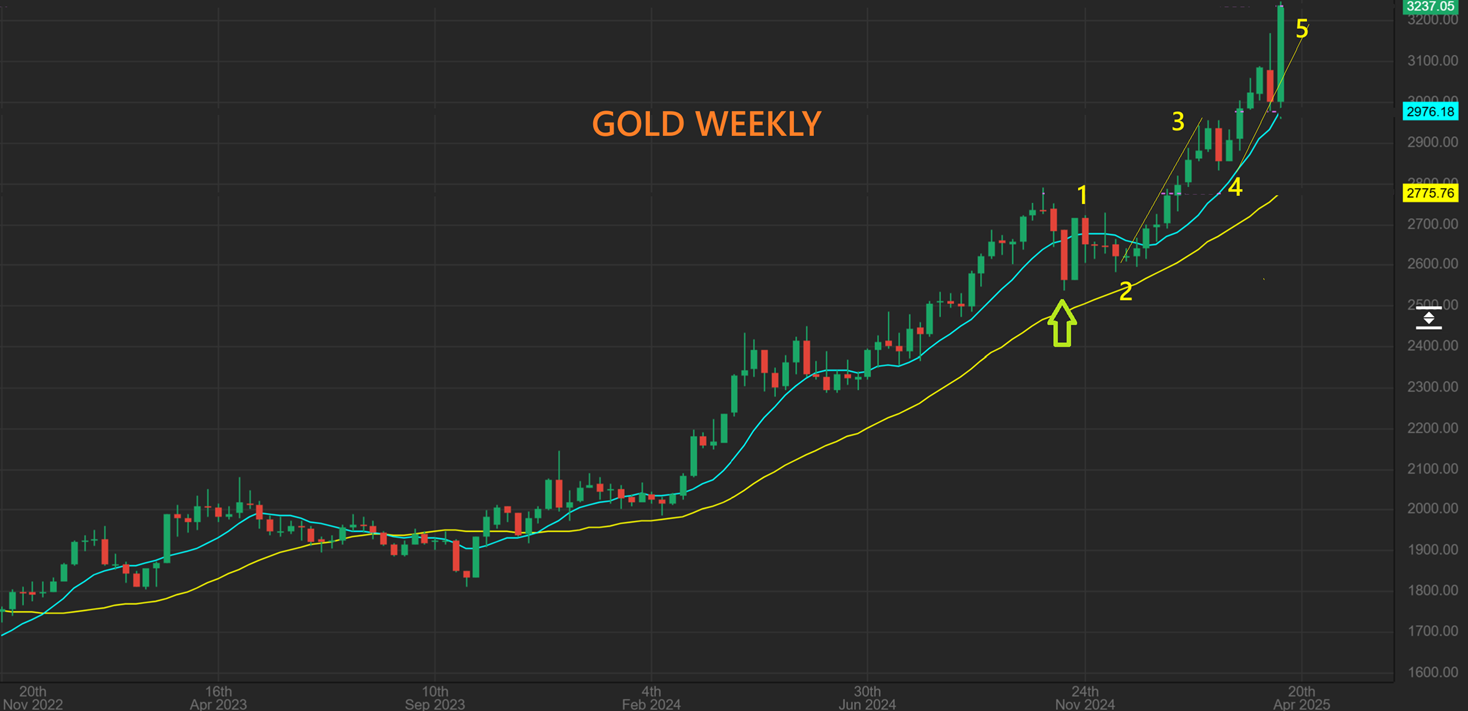
Now we take a look at the weekly chart for Gold:
This large surge was not really expected to happen in a 3rd or 4th daily cycle. This is why I am slightly concerned that GOLD may be ready to run in a parabolic ‘blow – off – top’ manner. Take a look at my next charts…
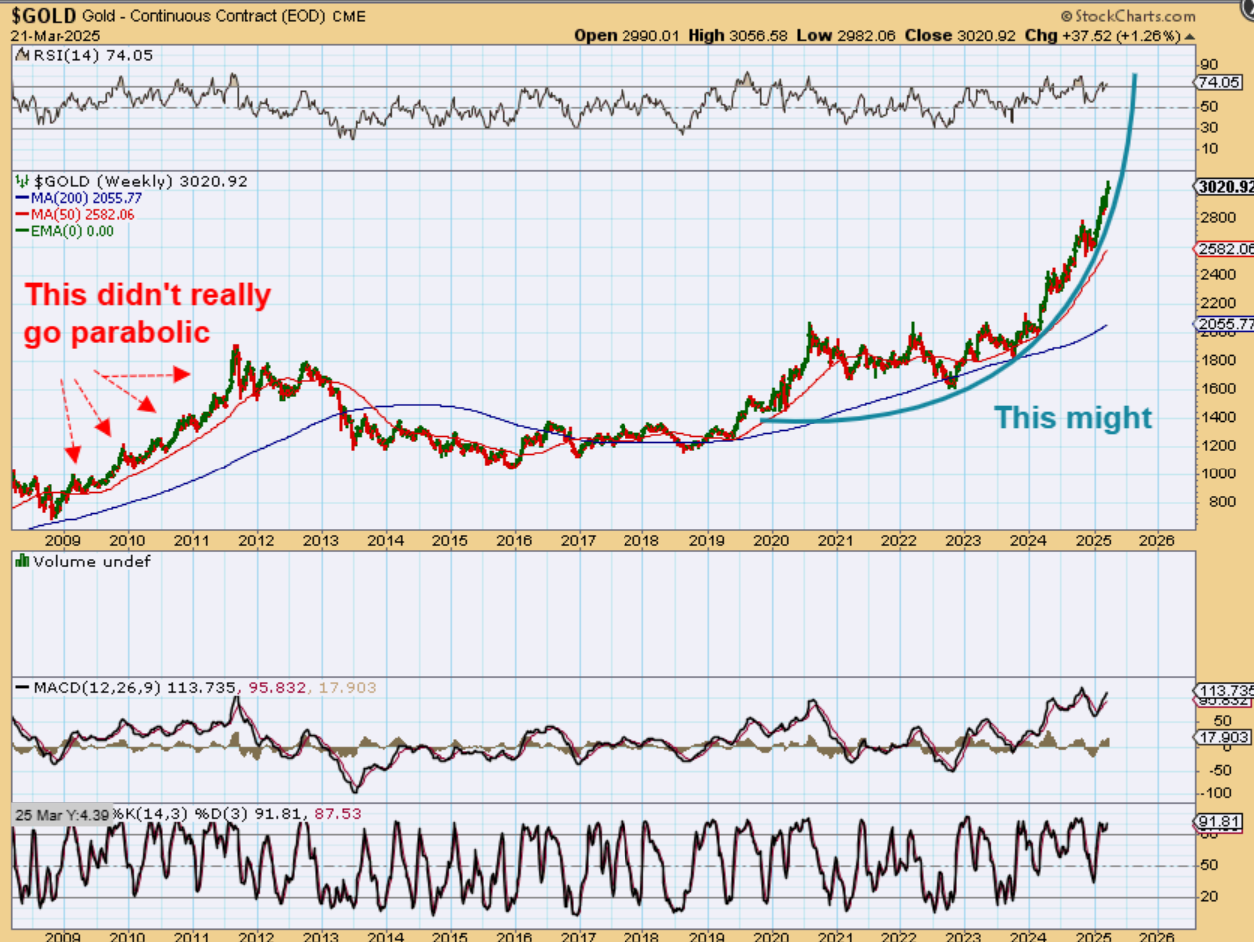
Take a look at my next charts. I have been saying for a while that Gold could go parabolic. This was my March 21st chart to show how that could take place.
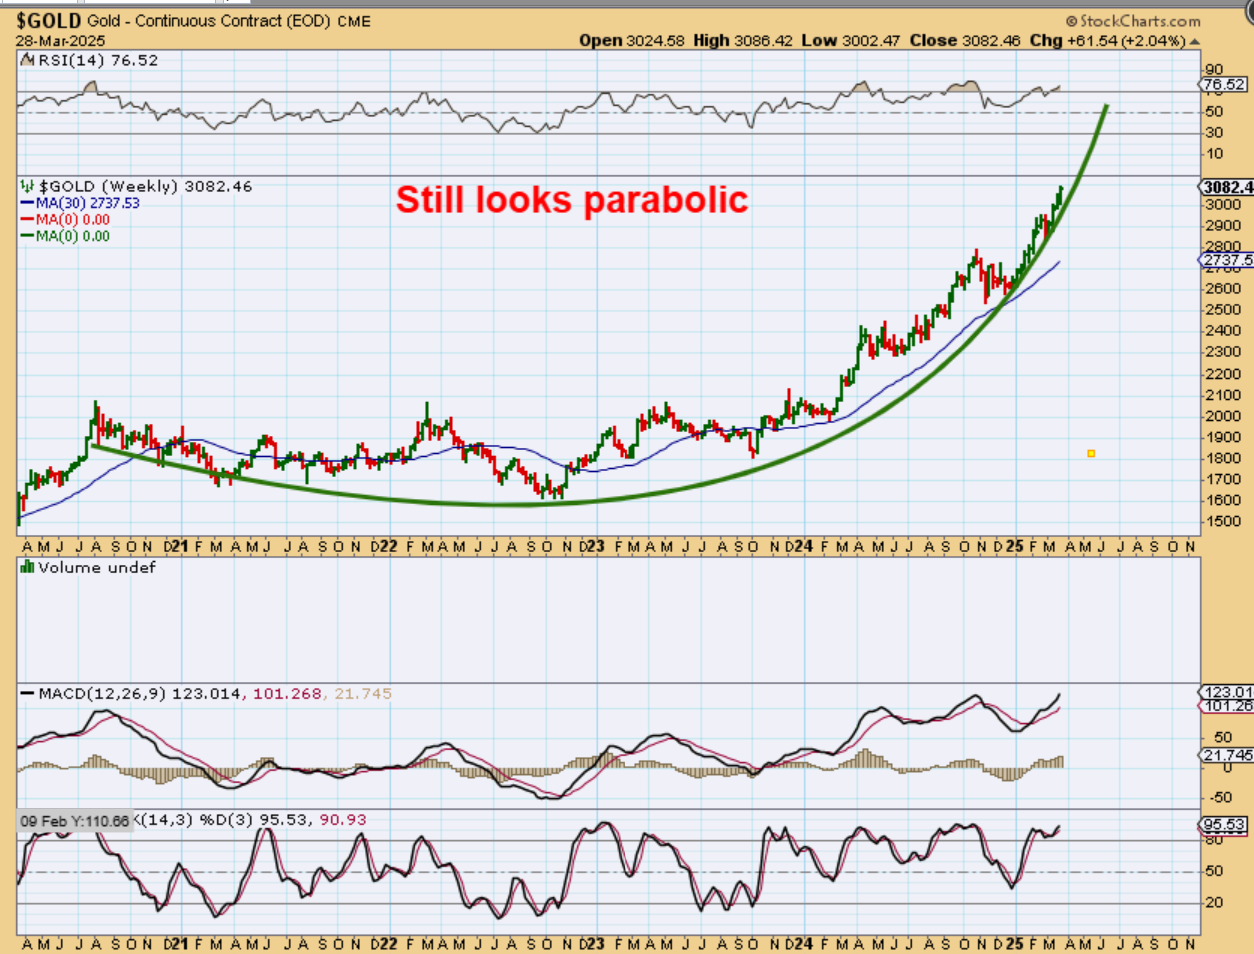
The steep incline continued after a 1 week pause, so this was my March 28th weekly chart to show how parabolic run could still be taking place.
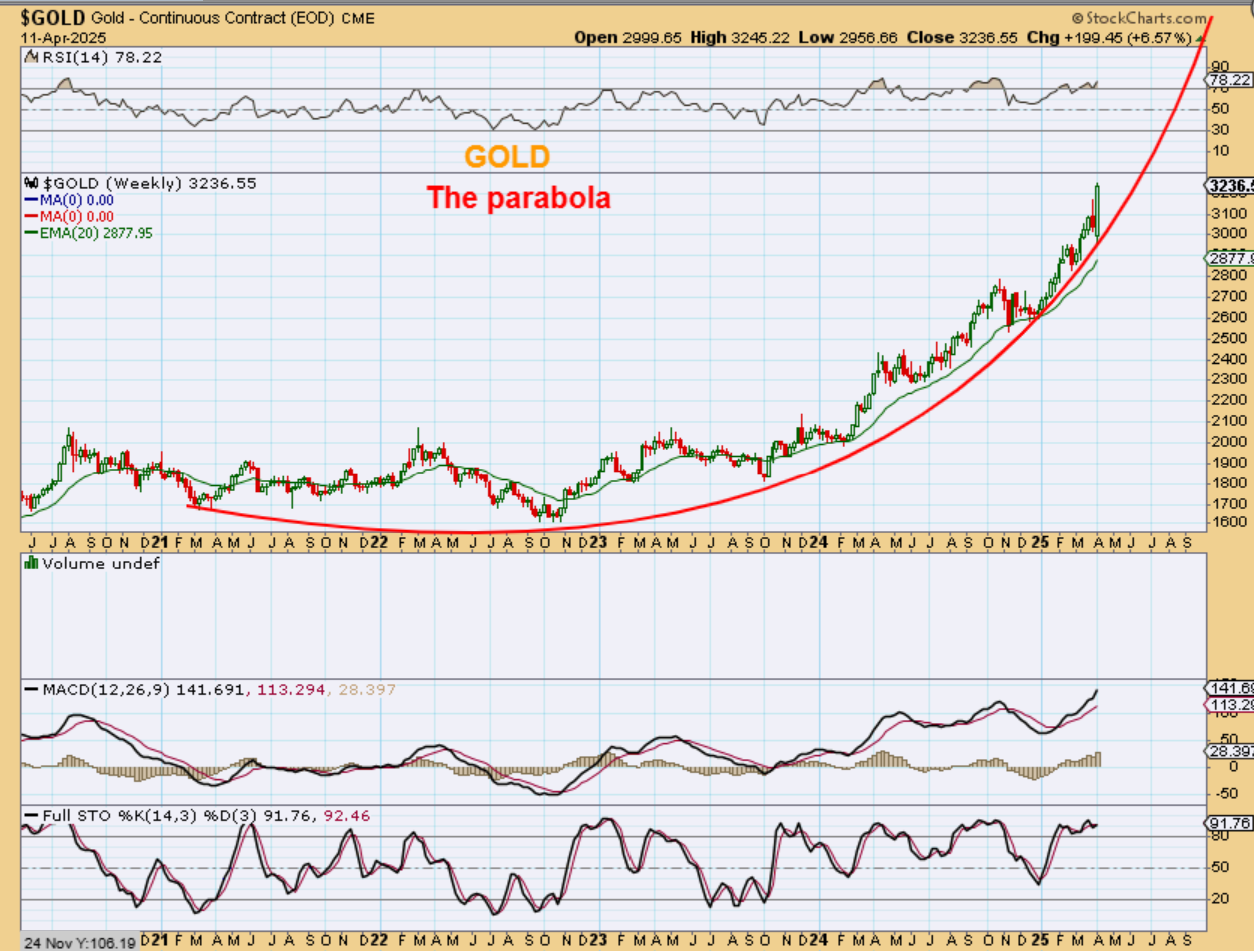
And this weeks very large surge for GOLD after 1 red week does make this look like it could be going straight up in a parabolic blow off top. Let me draw that.
.
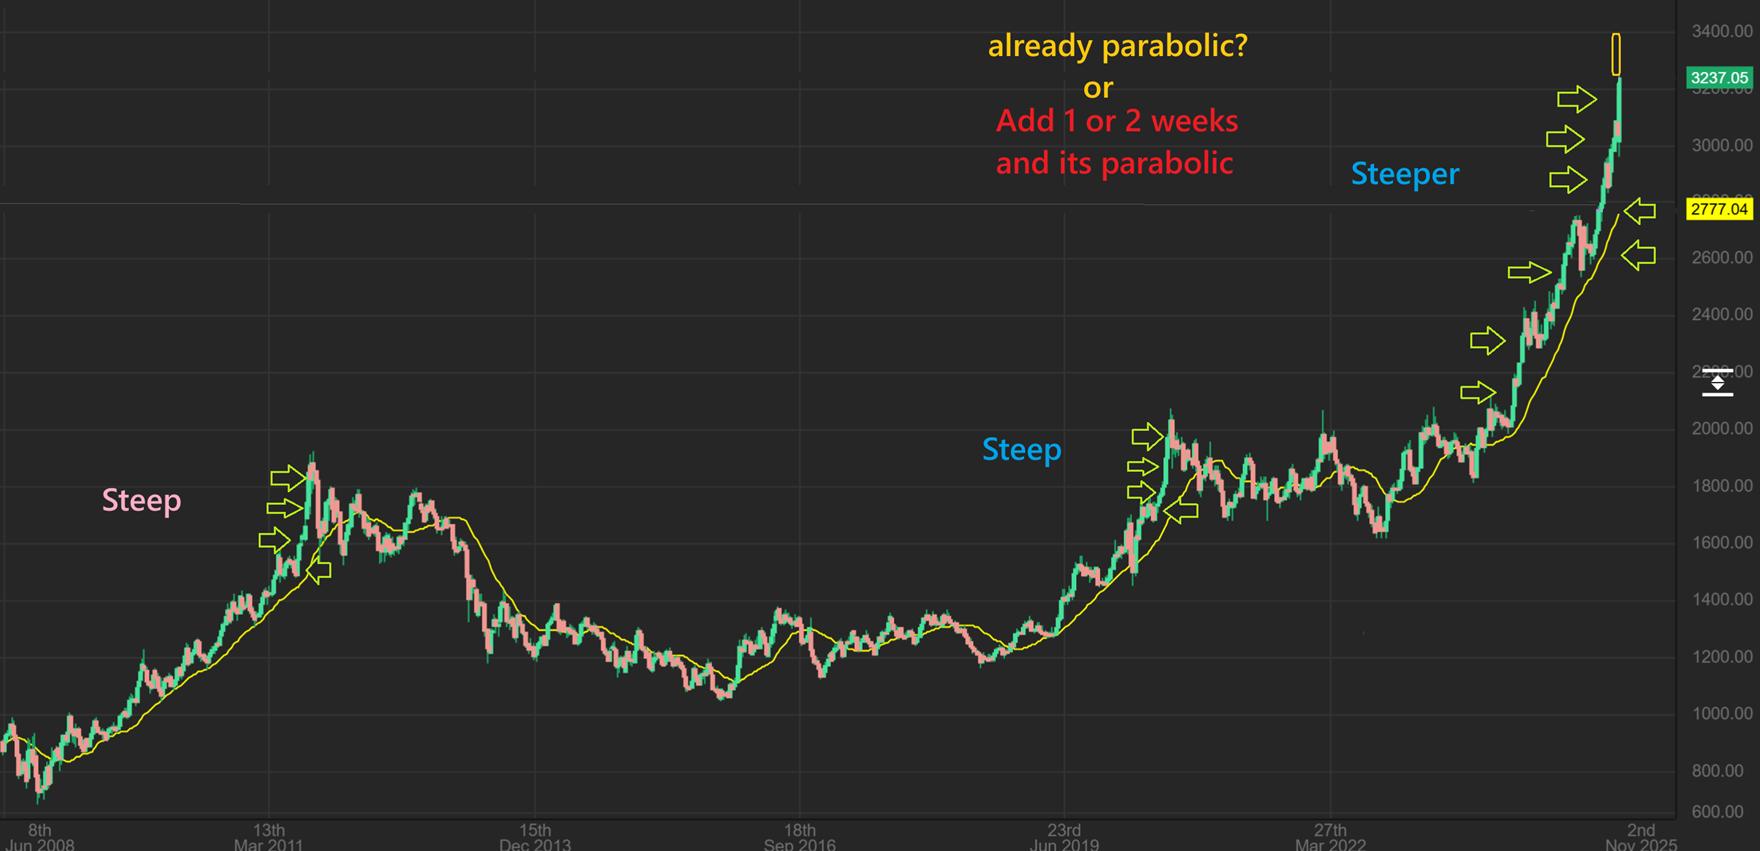
Last week was a big 1 week move for Gold, and here I have added just one more yellow week like it, to represent another possible move next week. This view does make this look like it could already be in a parabolic move to a blow off top. This has been a steep almost straight up run higher. I’d rather see one more daily cycle lower and then a run higher, so Silver can really join in. When Silver runs, it moves very fast.
.
CONCLUSION: I’d rather see GOLD do this and THEN a final ramp up to a parabolic blow off top, but we’ll have to see what it does for the next week or 2, since we are only on day 5 Monday.
.
SILVER really has not run nearly as strongly as Gold has. It is not at new highs like gold, it is running up out of a slam down low. I was asked if this is an ICL, and I don’t think so, since they usually come in the form of an a-b-c down ( or 5 waves). This seems like it just got caught up in some of the General markets extreme selling for a first leg down.
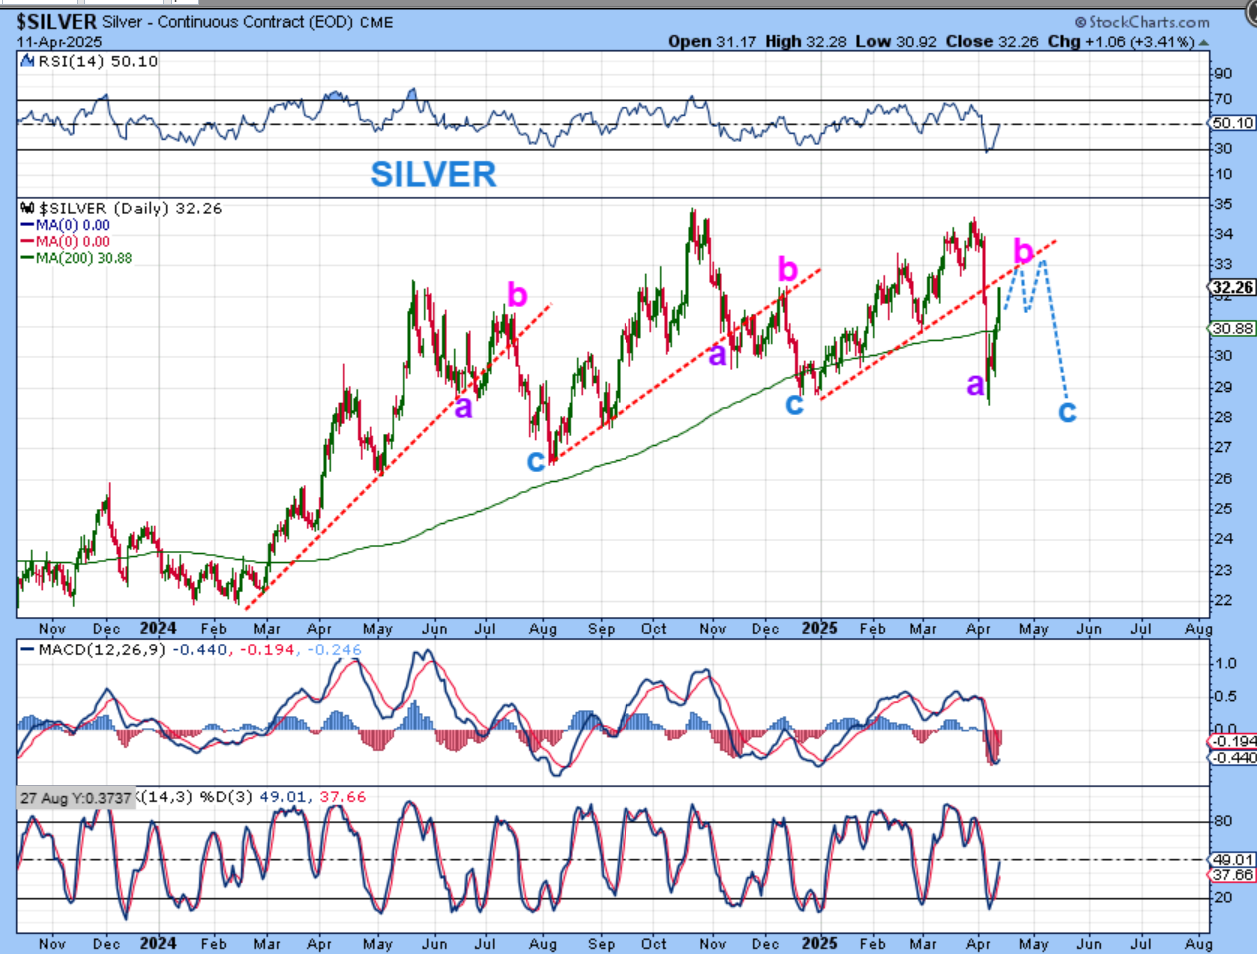
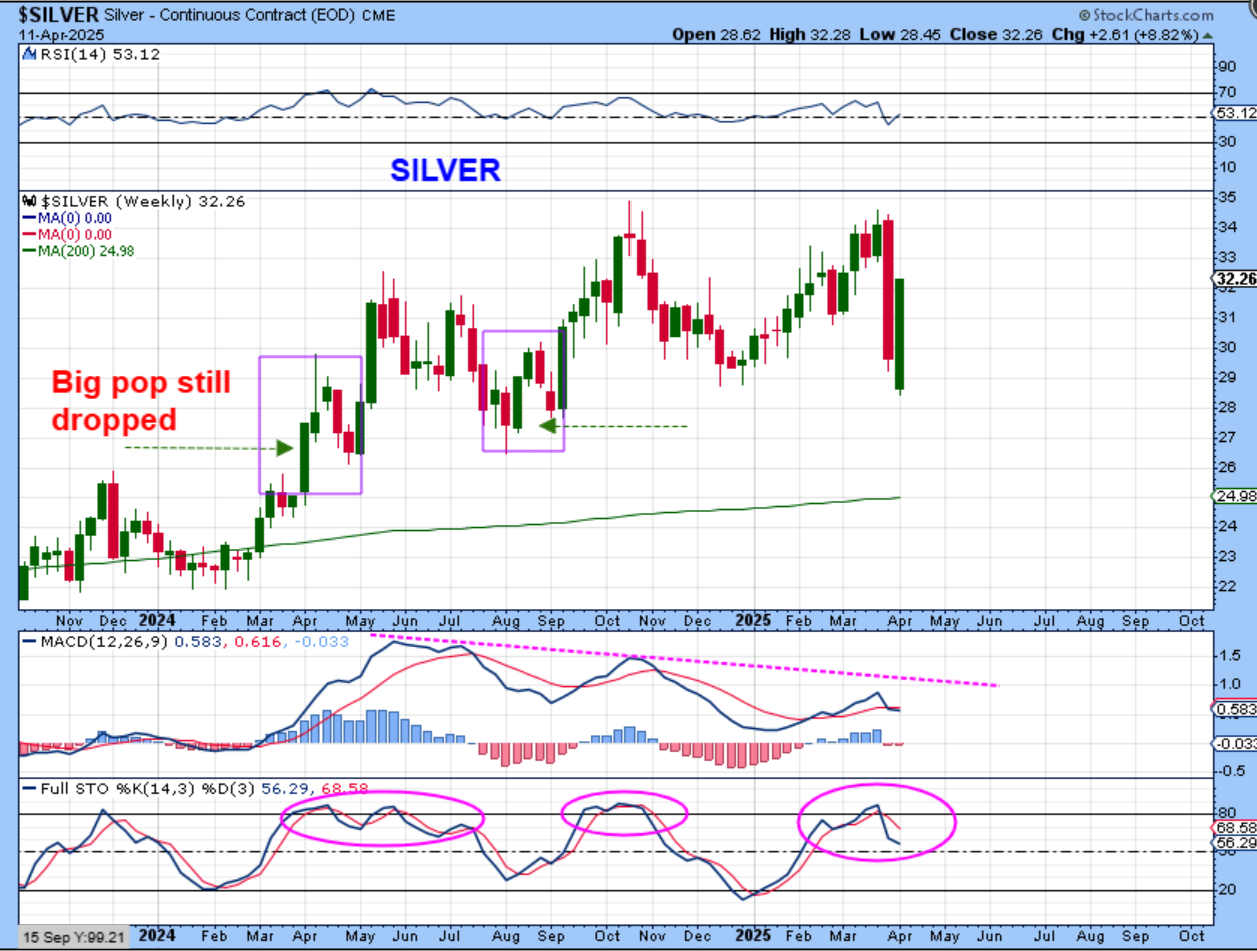
SILVER had a very large reversal last week. We have seen other fairly large moves up that gradually weaken and pull back though, so I drew a couple of those pops in boxes here. Could we see 2 weeks up and then a dip into a dcl? I think so. So this CAN move up and still roll over (or less likely is that it suddenly catches fire and goes parabolic with gold).
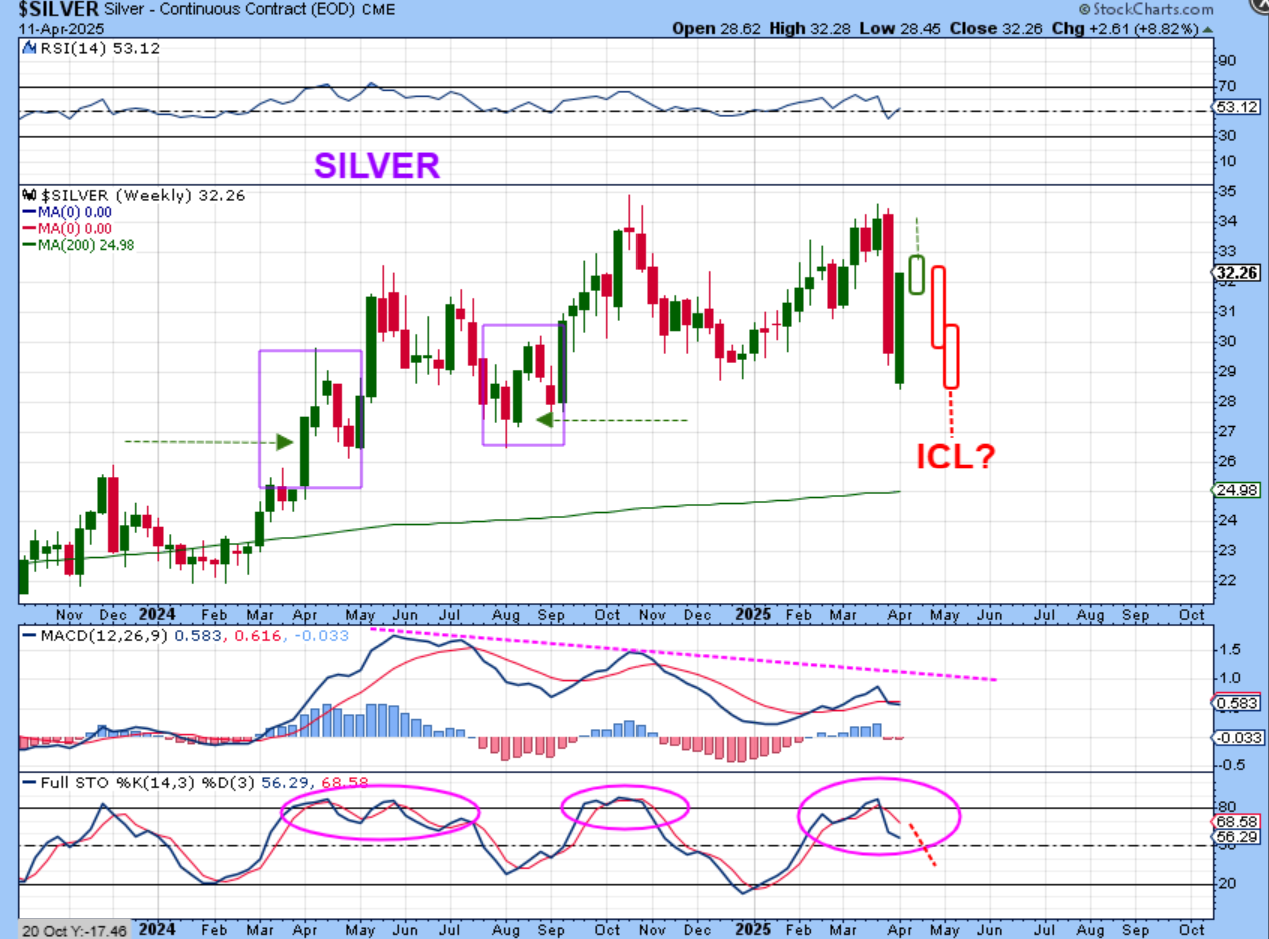
SILVER – I’ll draw it like this as it becomes due for a drop into an ICL. This would be a ‘buy’ in May in the hopes that it finally plays catch up.
.
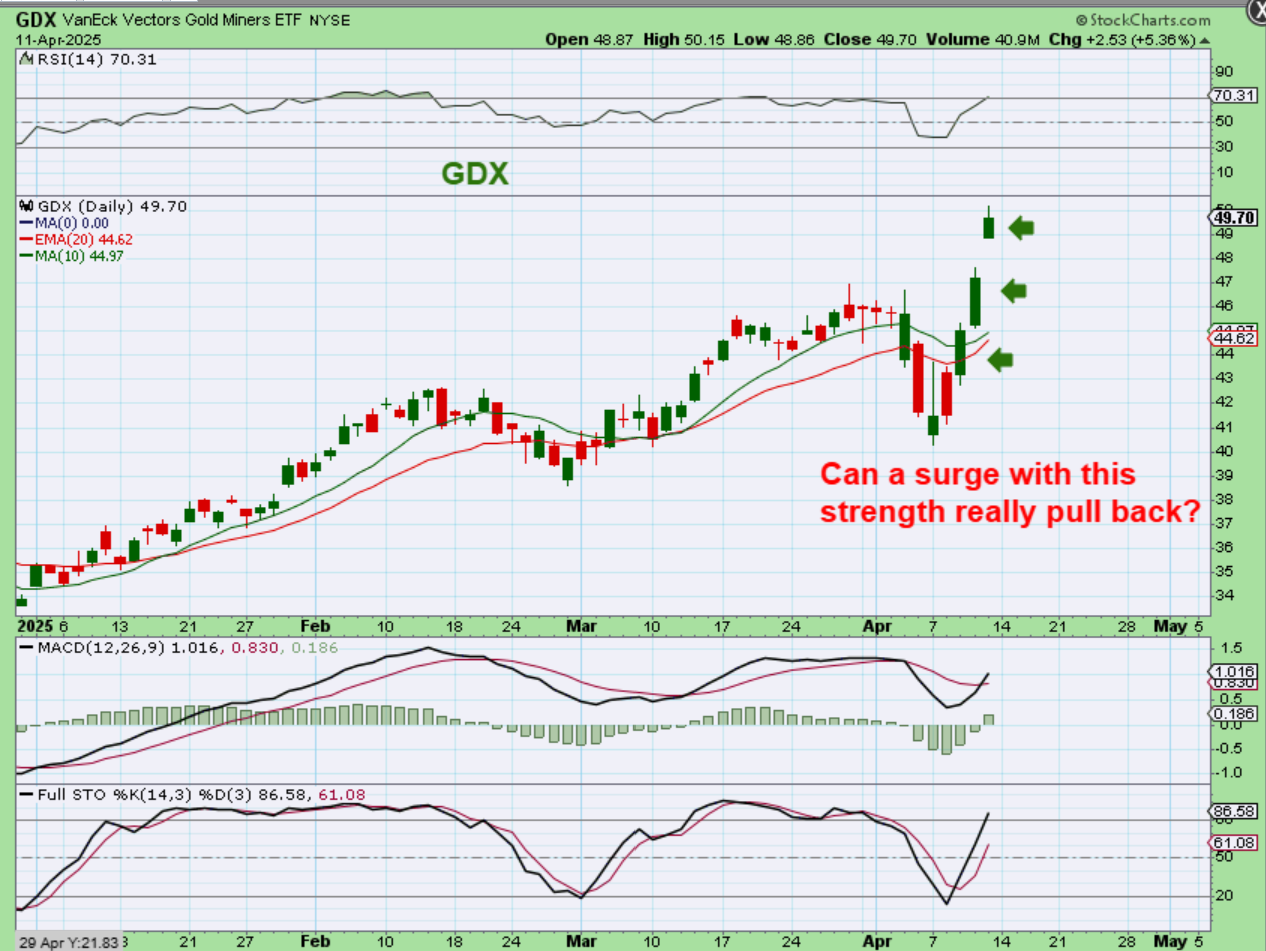
Friday was a 5.36% Gap up day! That was 3 big days up in what seems to be the 3rd daily cycle for Miners. I mentioned that I was expecting an eventual pullback, and this is only day 4? CAN THIS REALLY LOSE STRENGTH? It can, but I will admit that GDX has had quite the strong move in 4 days of the 3rd daily cycle.
Let’s take a look at a past surge higher with The GDX in Dec 2009, when Gold was in a bull run. Did it just keep on ripping higher, or can a strong gap up to new highs like we see here weaken and dip into a dcl?
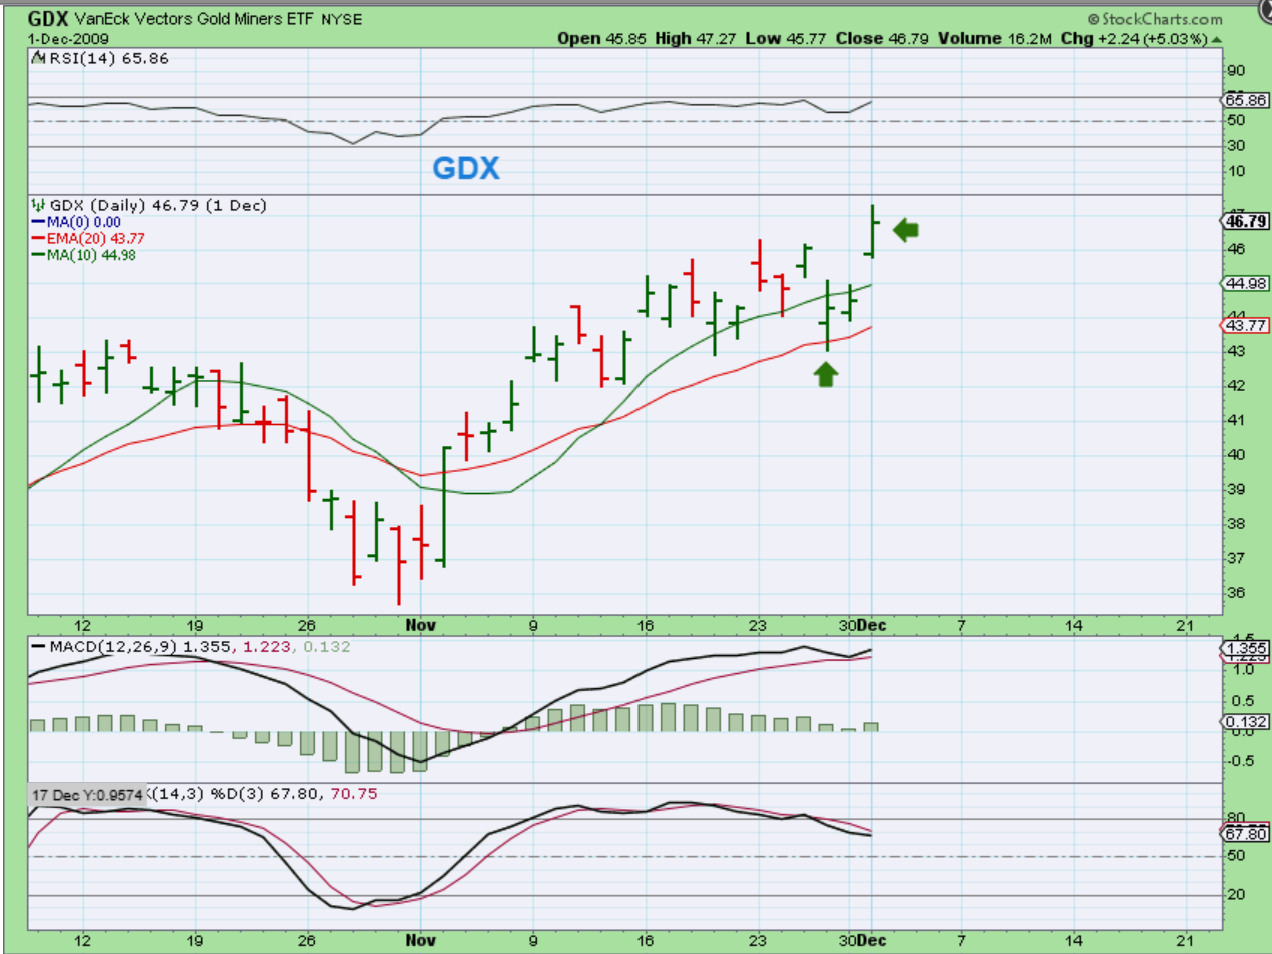
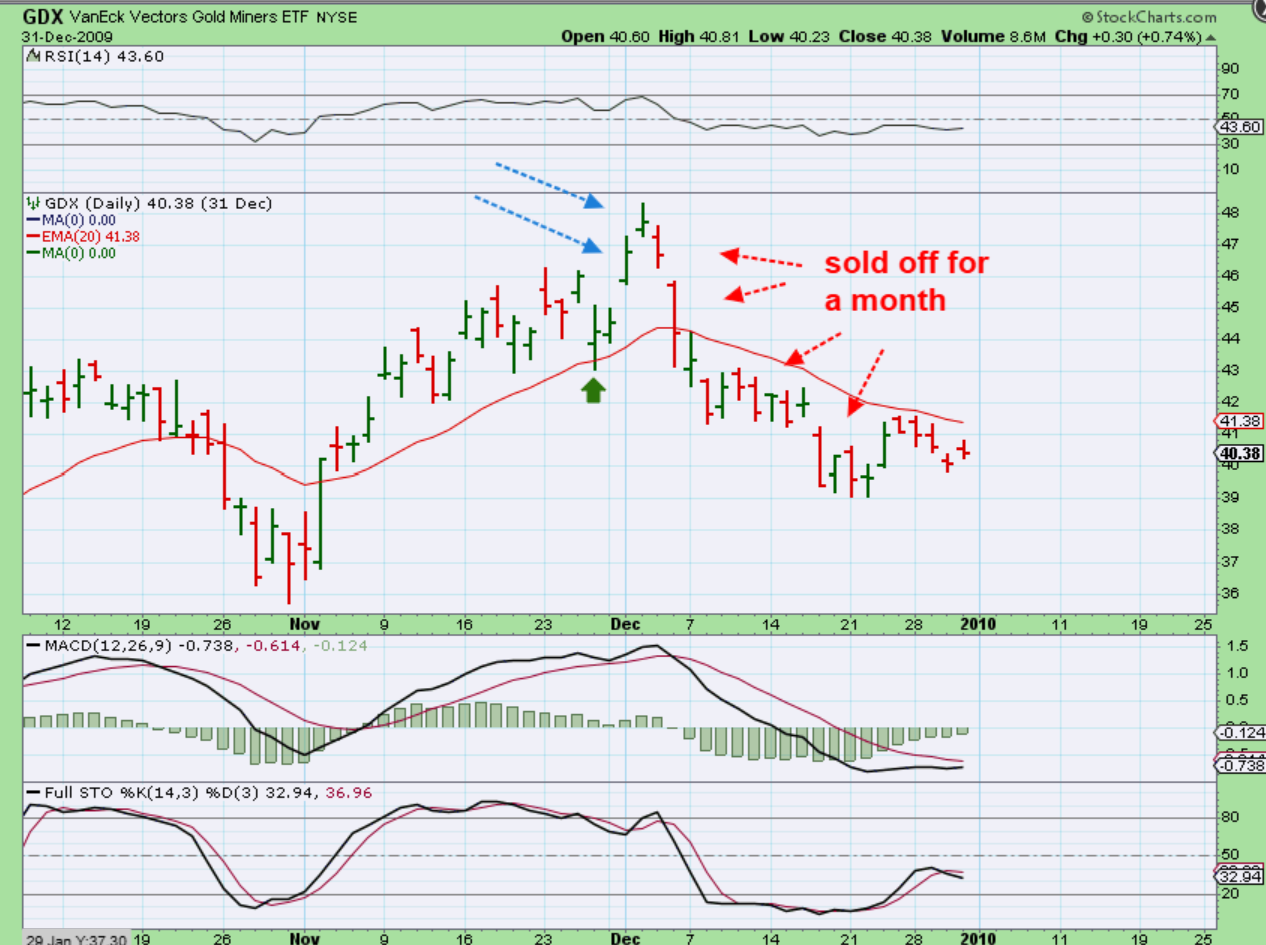
That strong gap up to new highs had 1 more day up and it peaked and rolled over into a dcl. It was later in a daily cycle, but I was just looking for a decent gap up to new highs that failed.
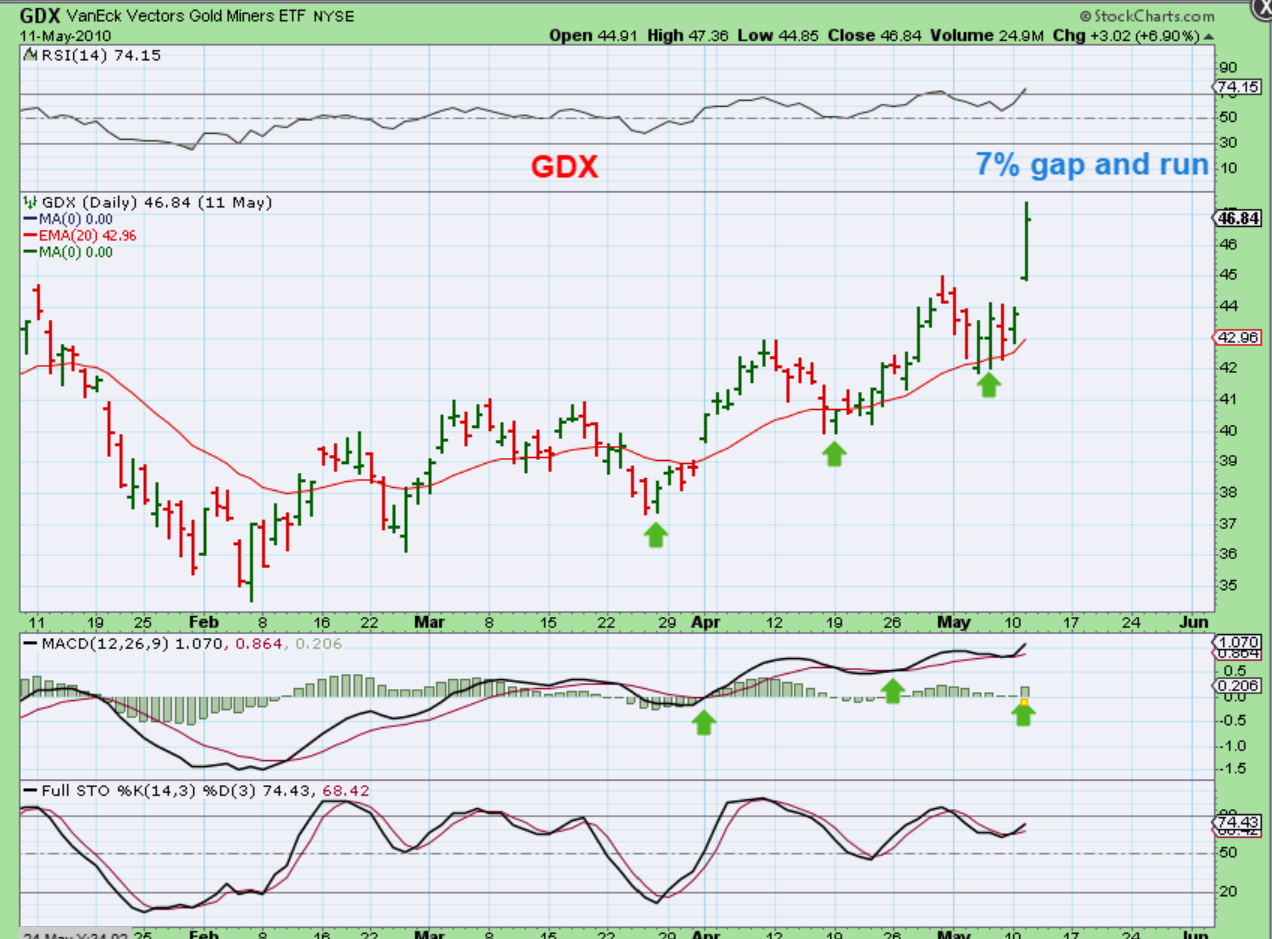
Also take a look at this large 7% gap & run in May 2010.
GDX was running higher in a choppy manner breaking out and looking ready to really accelerate here, right?
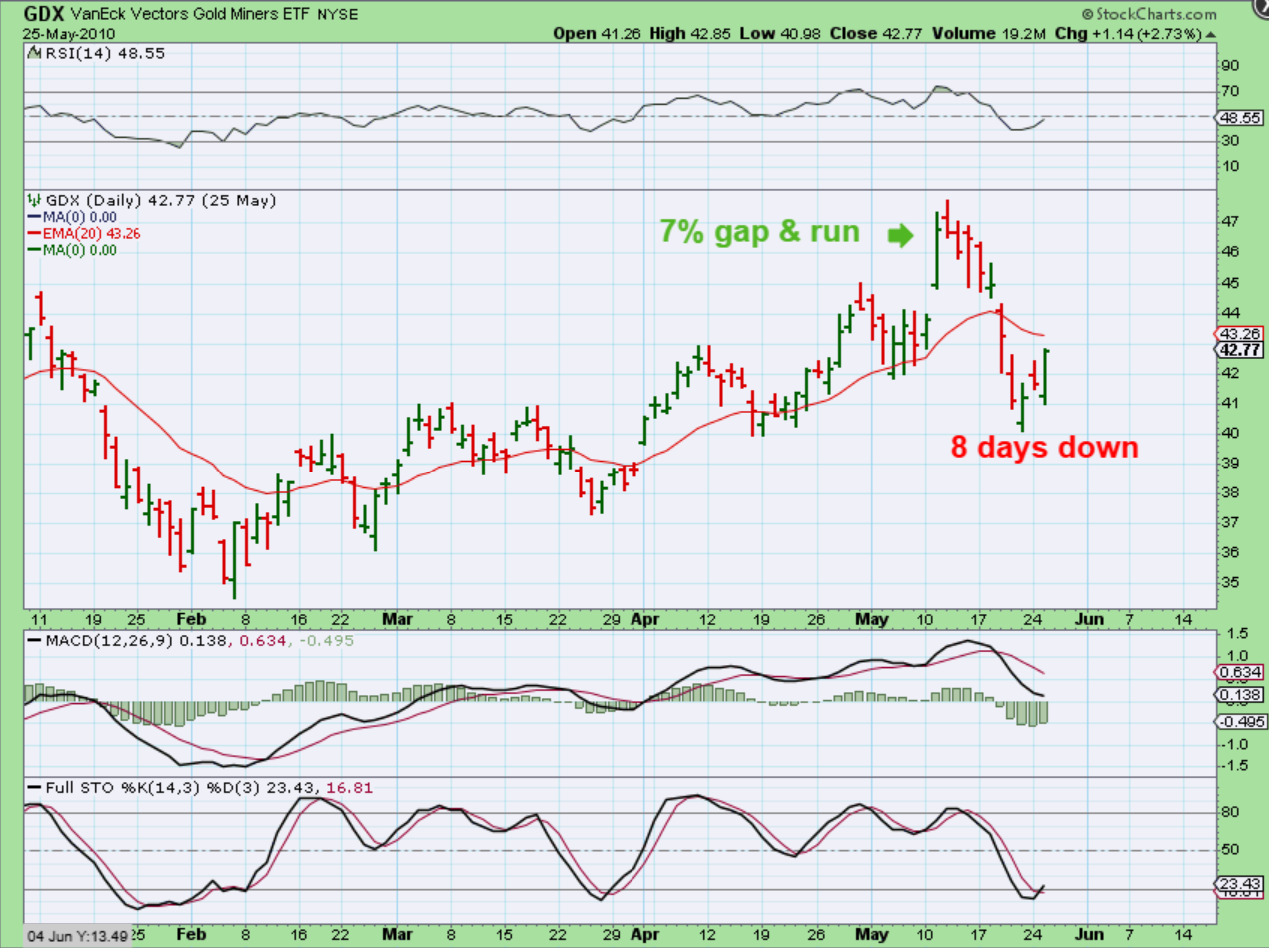
GDX had no acceleration after that bullish looking gap up to a new highs, so this just highlights that we can still dip lower when a dcl/ ICL is due. That being said, we are only on day 4 so the current GDX move does have time to stay elevated.
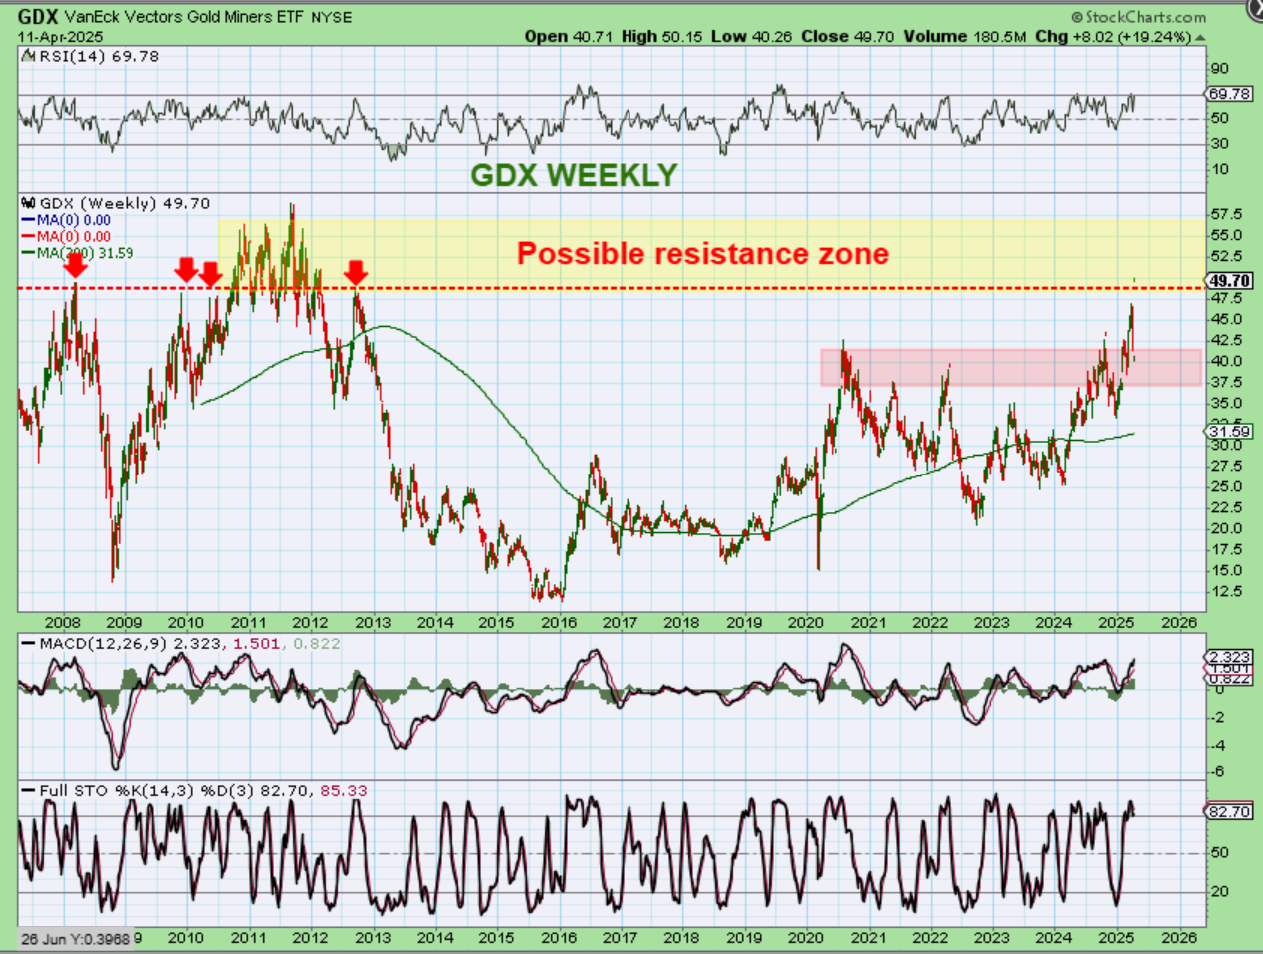
GDX has made it through that resistance area that I pointed out in the past, and there is another one overhead, so I would say that the GDX can move higher next week too.
Gold and the Miners have put in some very nice gains despite the general markets selling off into crash mode. Now we see the General Markets bouncing and this is when we find out of we formed some kind of exhaustion low or is there more downside. Oil looks ready to bounce, the USD broke a multi year low, and Gold? What about Gold. This move does look parabolic, but are we at a ‘blow off top’ part of the move, or will we get a dip into an ICL in May and THEN get the final rally that gives us that blow off top run? We have to see what happens next week, but a dip sooner than later would allow Silver to rally and try to play catch up with a run to $50+. A dip in this bull run would be a strong buy scenario. And Bitcoin? It should have a failed daily cycle, but with 30 days left in that cycle, it actually looks quite bullish, so you may want to check that out below!
Enjoy your weekend!
~ALEX
.
From Fridays report:
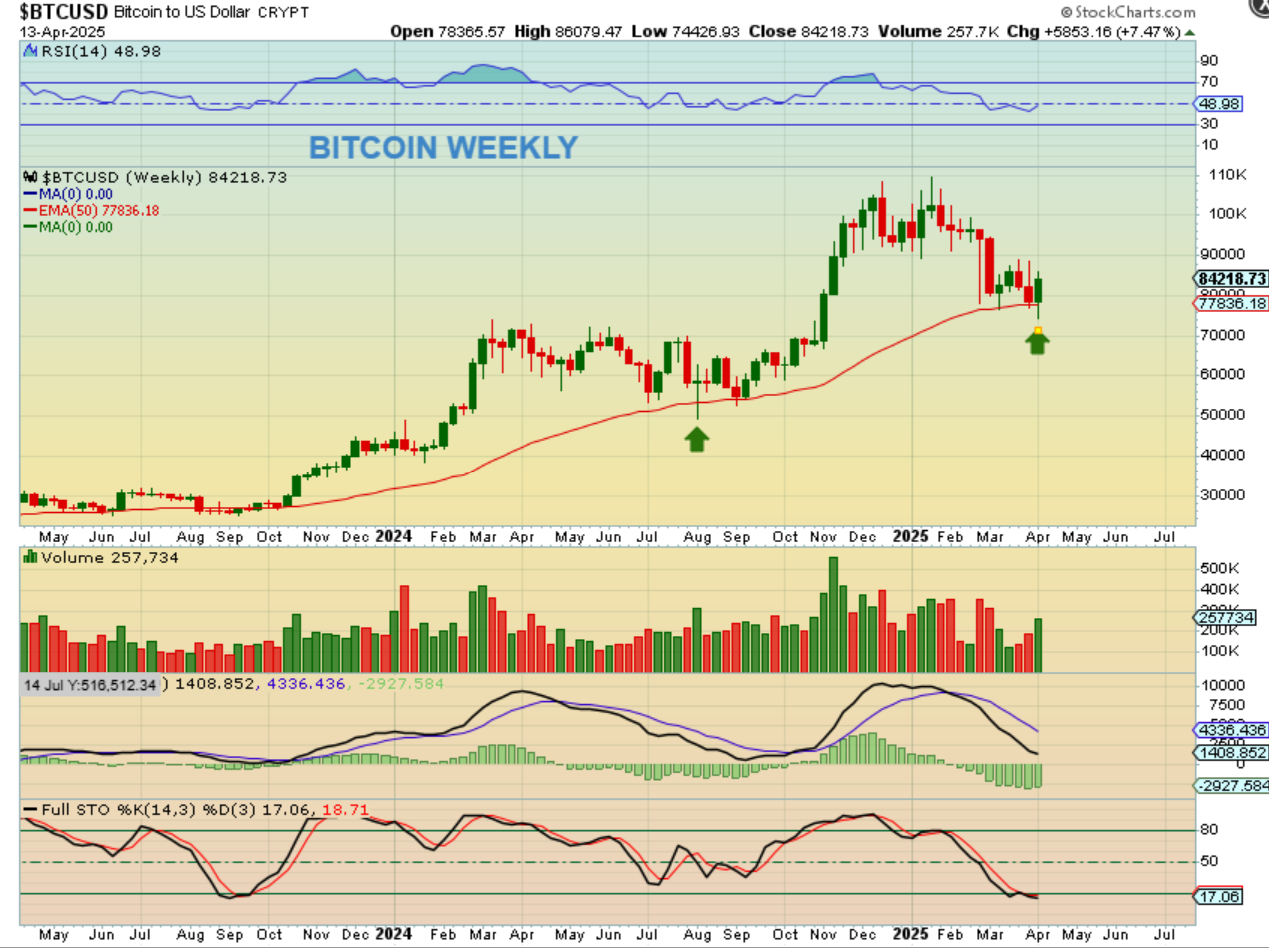
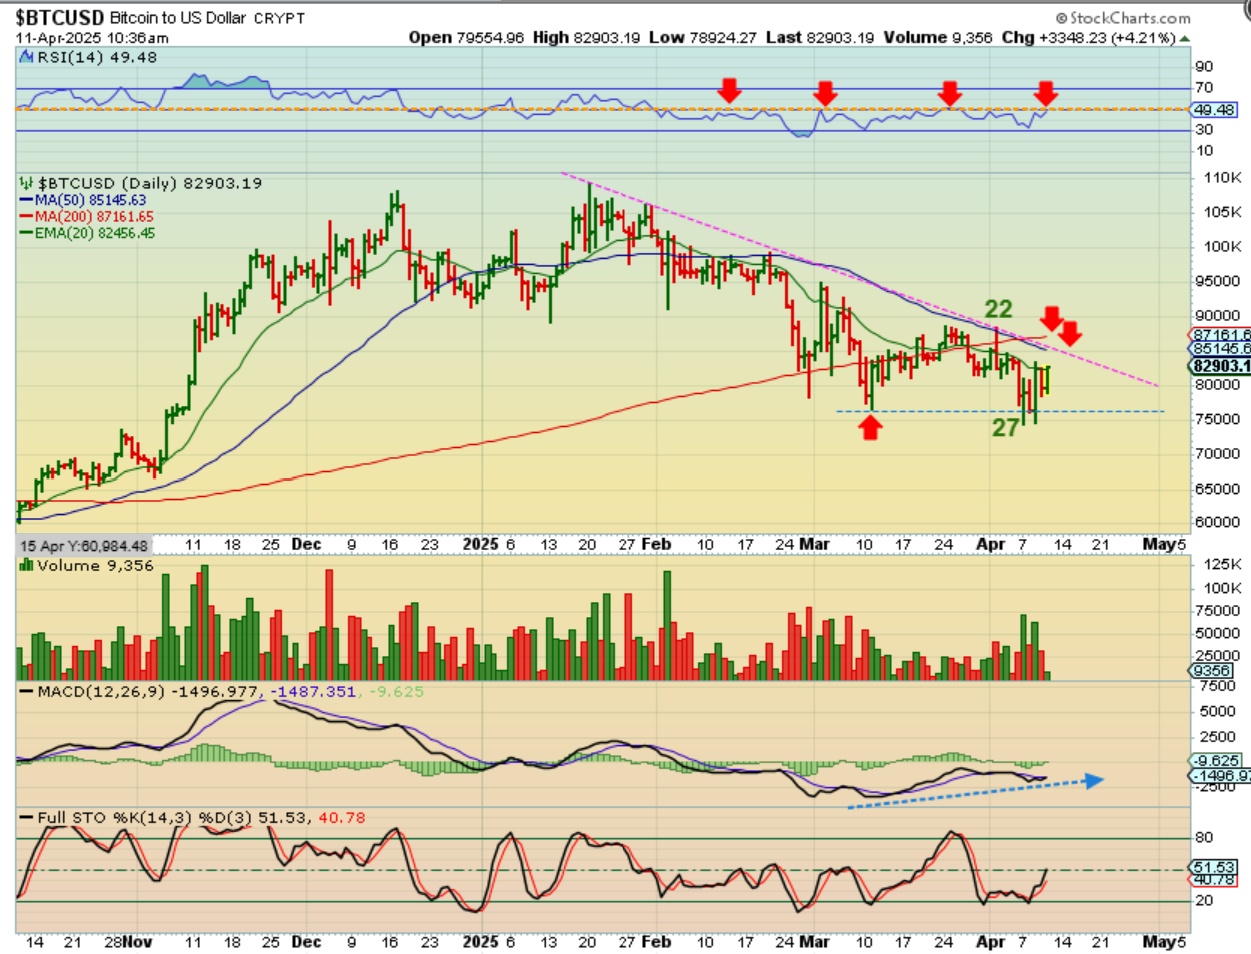
Bitcoin – Today is day 31 and this is a live chart from 6 am Friday. Bitcoin is up this morning, but it does have resistance overhead and with a failure recently taking place, I just don’t know if it’ll have the strength to breakout or not. Obviously, you can be long from day 27 or 29 with a stop that can be raised.
.
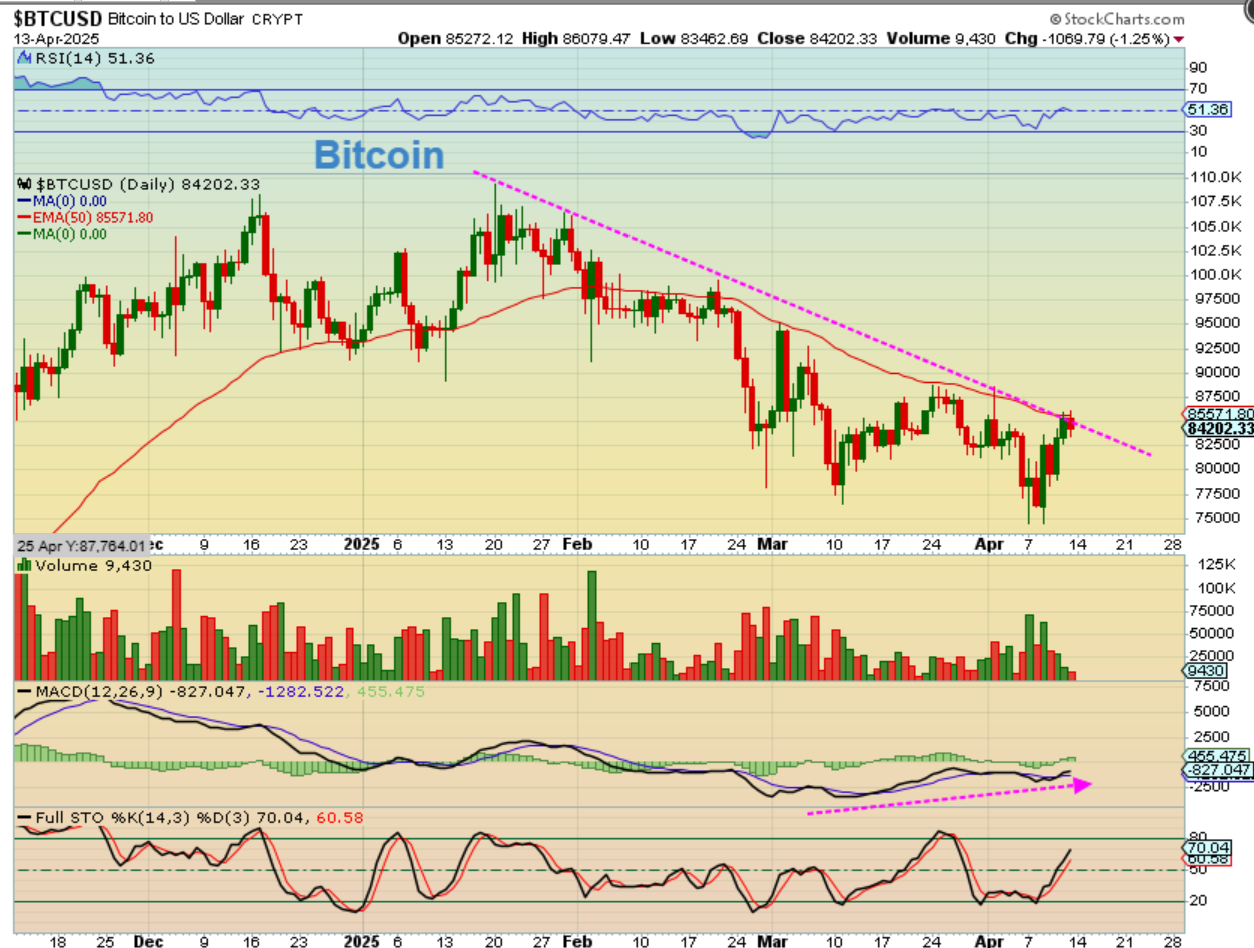
Bitcoin is trying to breakout from that downtrend. It is also pushing against that 50sma at $85571. The MACD has bullish divergence, and I have to admit, this looks like Bitcoin could breakout and have a bullish week or 2 ahead. When I looked at the weekly chart, it too looks very bullish.
.
Bitcoin Weekly – I know that the cycle count has this last drop to a new low as a failure near day 27, but this looks very bullish from a technical analysis standpoint, so this may be a Buy at the lows, and it can run higher for weeks. Watch the Crypto stocks next week, because if they join bitcoin in a run, even a short run, they can tack on several 10% gains in a row at times. Even a failed daily cycle can bounce nicely with 30 days left in the daily cycle.