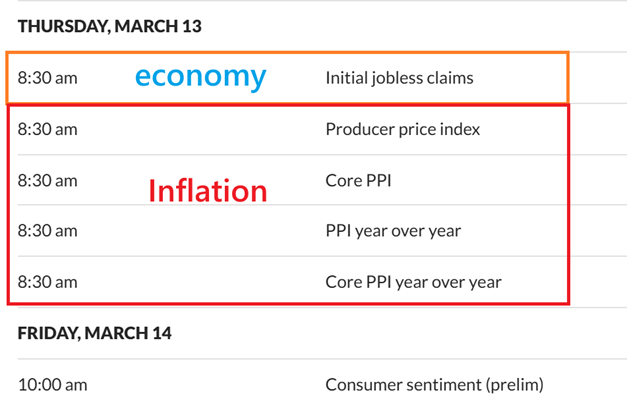
Once the selling starts to dry up, we can begin to see a ‘short covering bounce’ and then Buyers start to step in and the markets can even ‘Climb a Wall Of Worry’. I’m just pointing out the data, because it has been market moving in the past, and with a swing low now in place, we will either push higher and confirm an ICL, or drop again as another failed attempt.
.
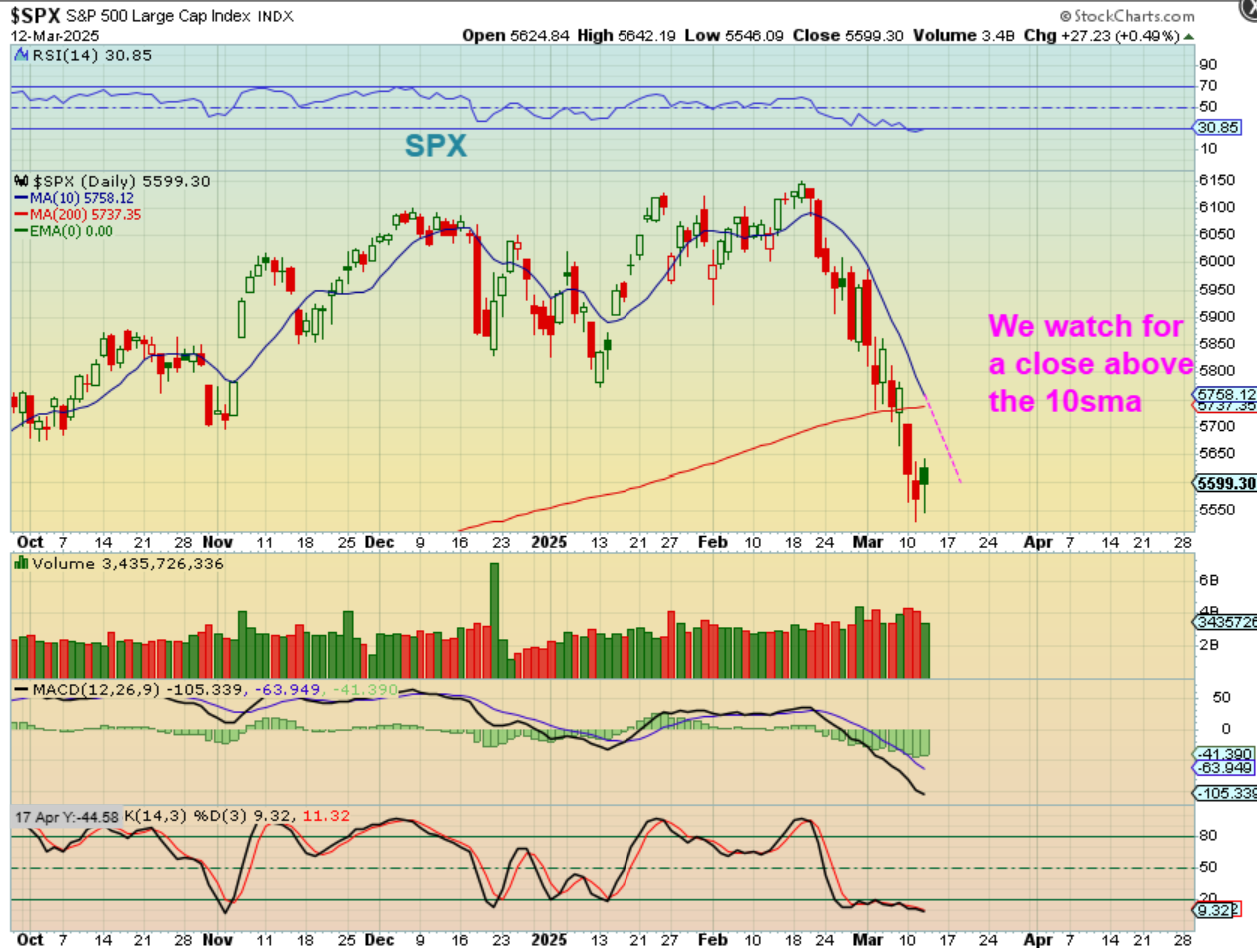
THE SPX formed a swing low, but the 10sma is a bit higher. For that reason, I also personally want to look at this another way:
How many pops do you see recently that lasted for more than 1 day? I see no 2 day pops since that waterfall selling started. We have only had 1 green candle and then the selling resumes, so if Thursday is green and closes green, that is a noteworthy character change and a bigger swing low.
.
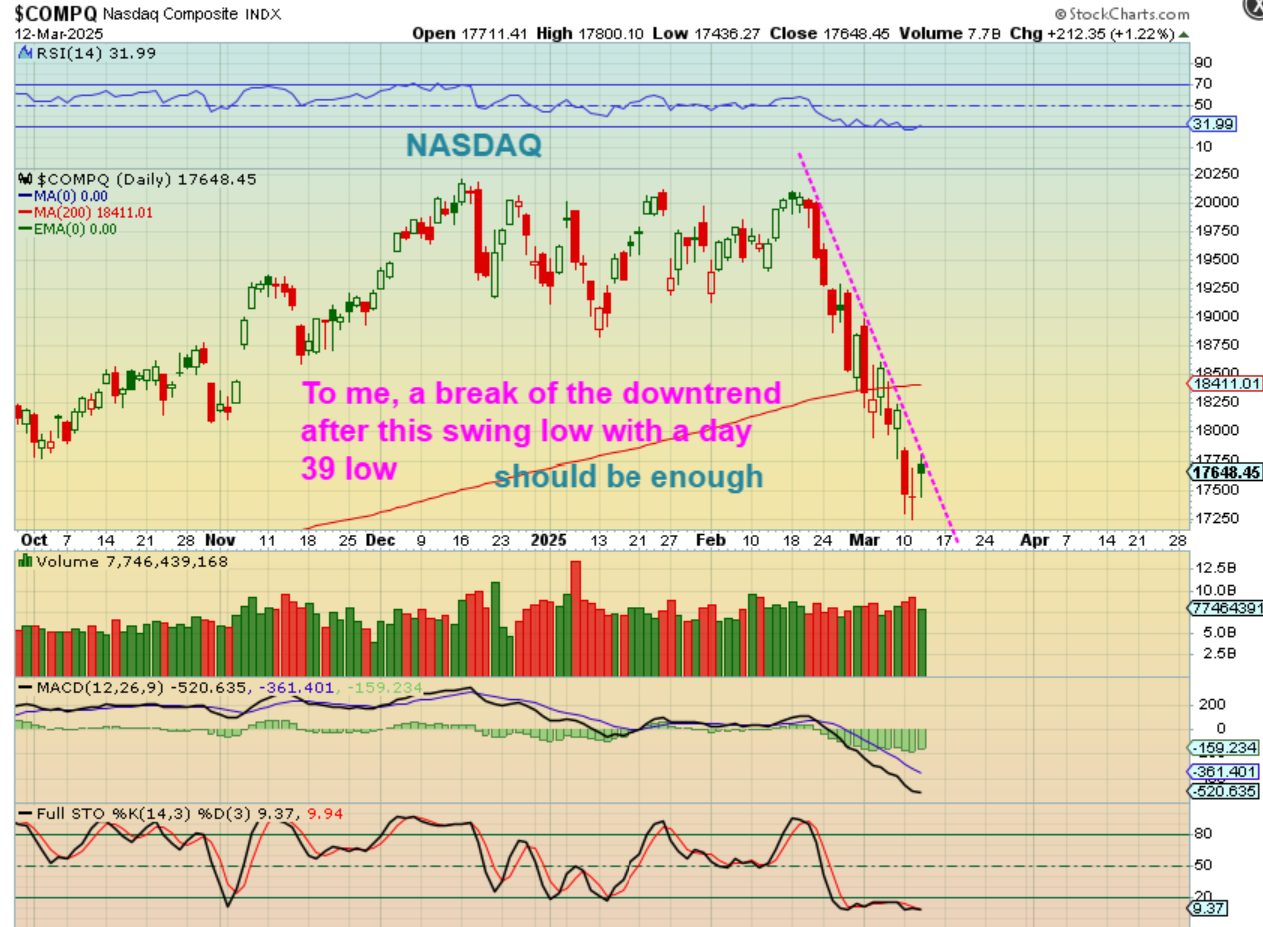
THE NASDAQ has been selling off so steeply that it has a very tight downtrend line. I think that a break of that trendline may signal that the selling is done. We have a swing low here and any buying tomorrow will break that trendline, so again, the reaction to that data may be a clue.
.
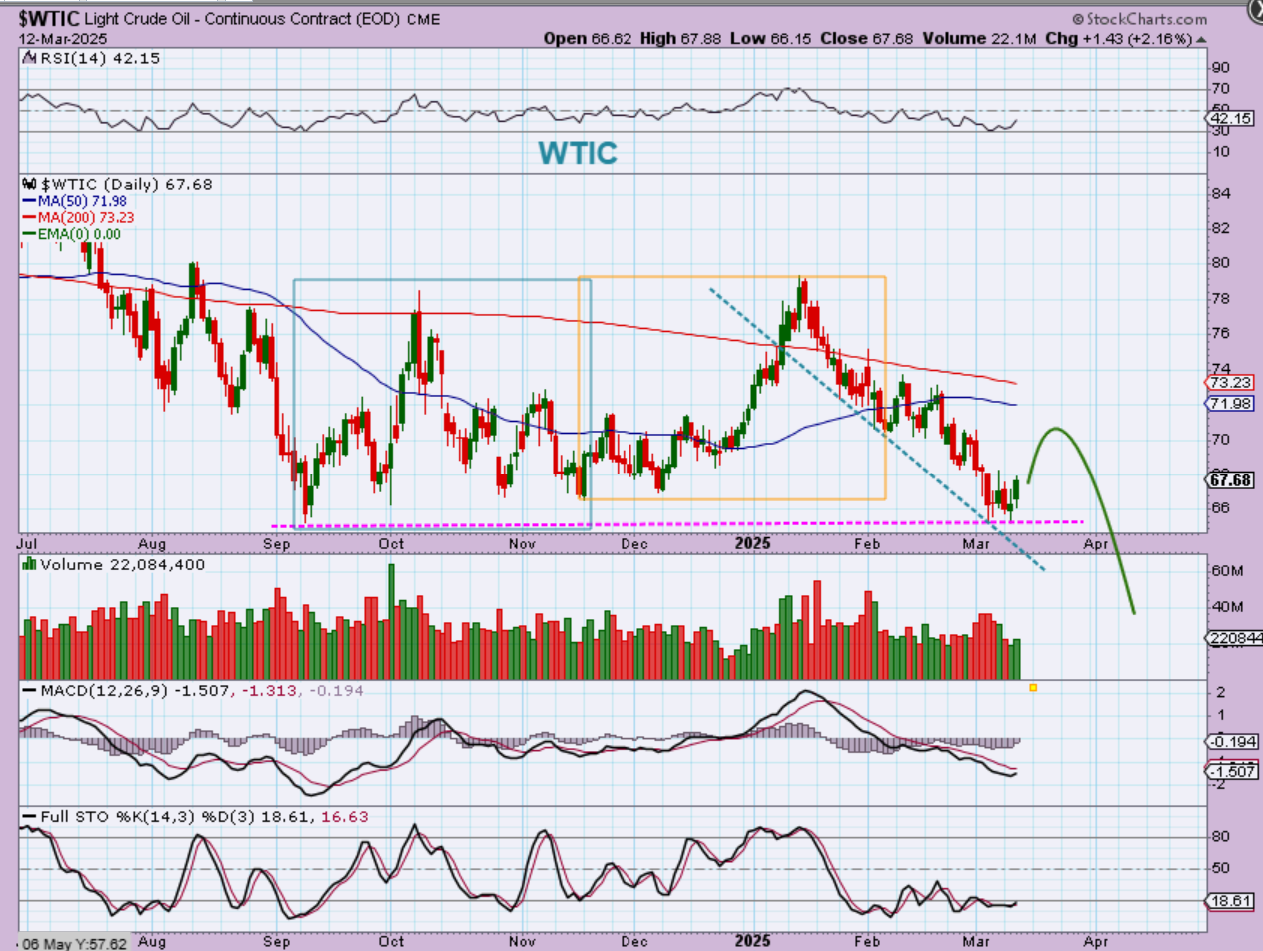
WTIC – Oil can put in a weak bounce, but I would expect it to roll over after that. This 3rd daily is a very L.T. Daily cycle.
.
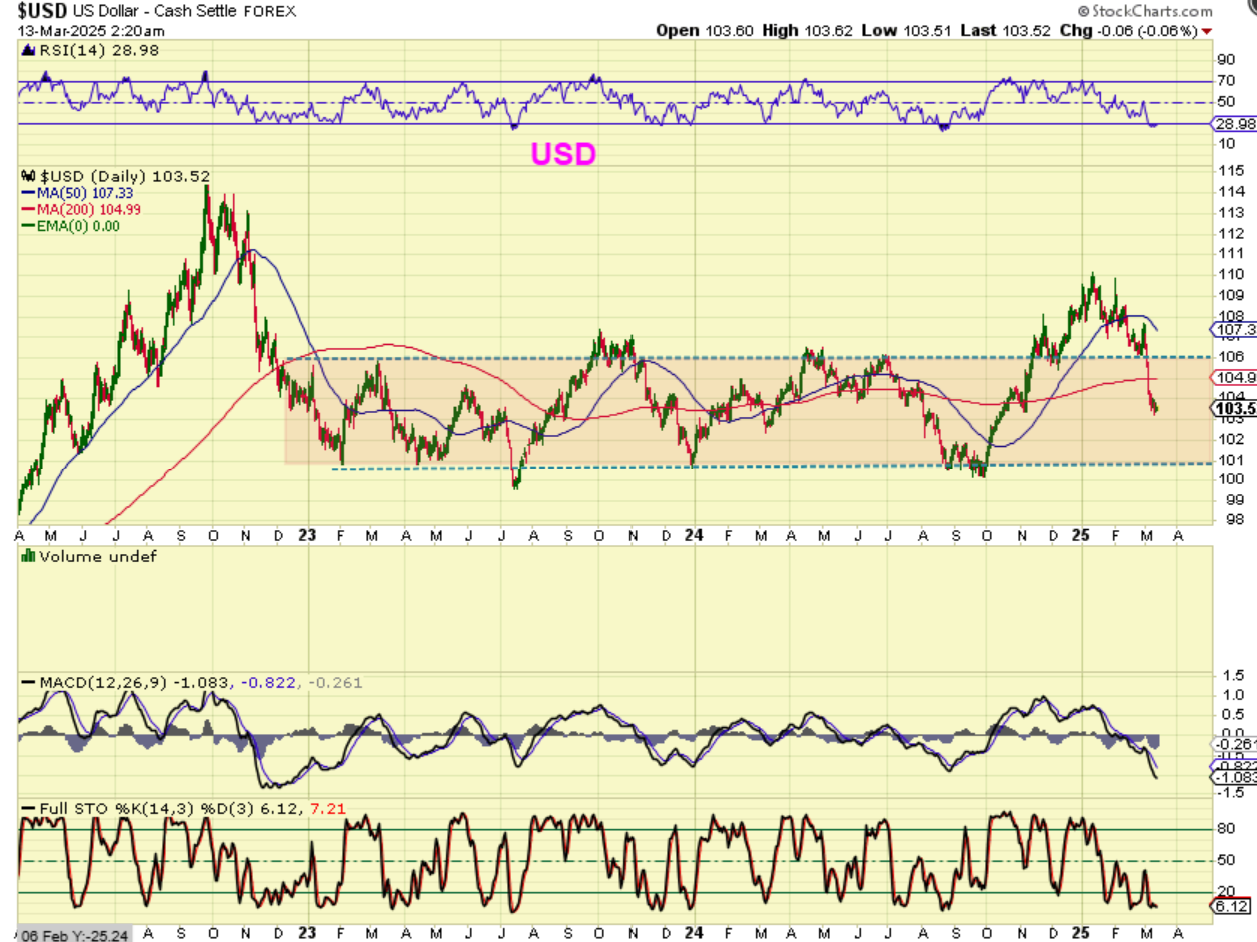
THE USD plunged into the support zone, sliced through the 200sma, and has been hanging down there for days. This is playing out as expected, but it really hasn’t seemed to be affecting Gold for months unfortunately. This plunge would have sent Gold straight up, but…
.
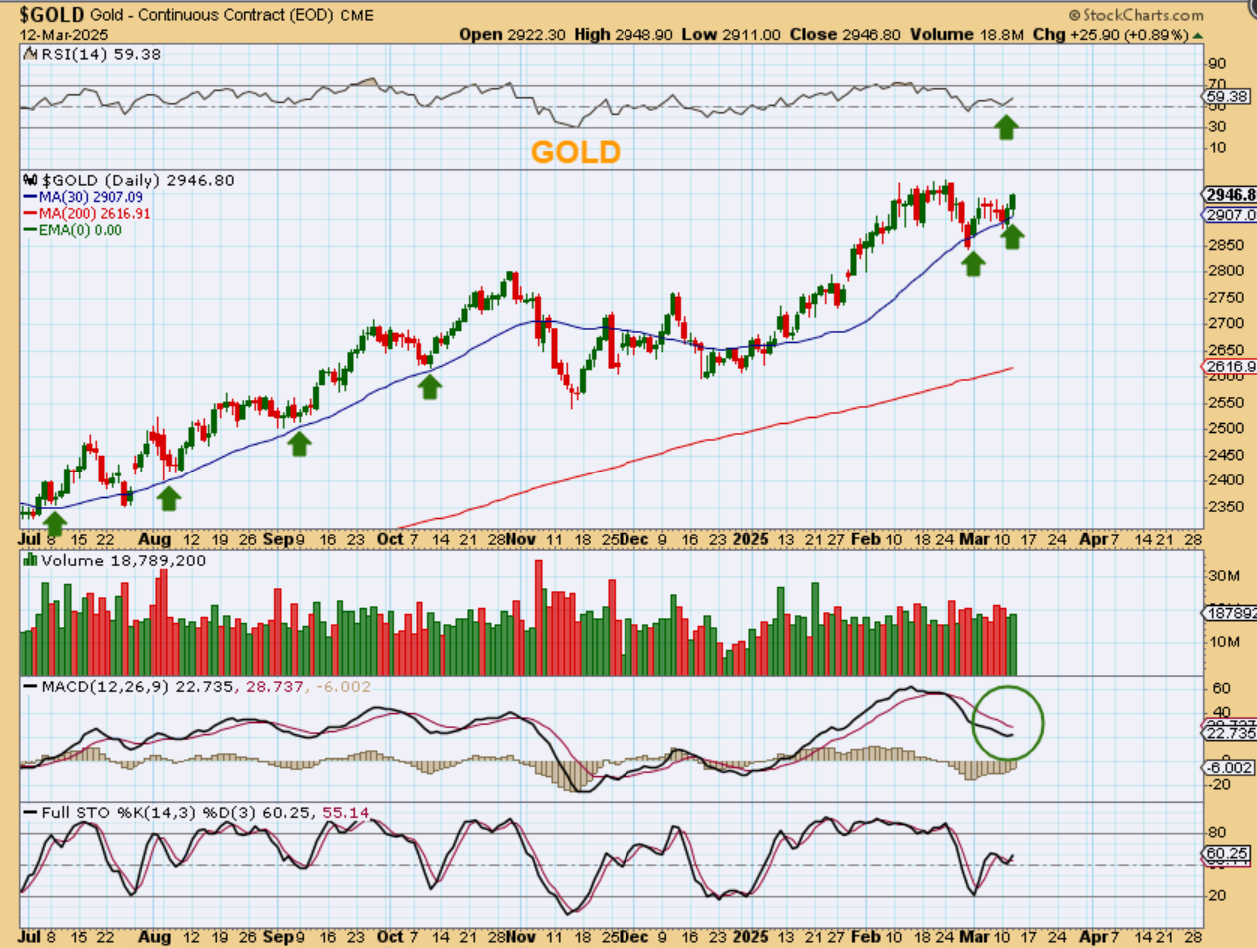
That USD plunge did NOT send Gold straight up. The good news is that the MACD is starting to curl up and we have Gold heading for new highs on day 8.
.
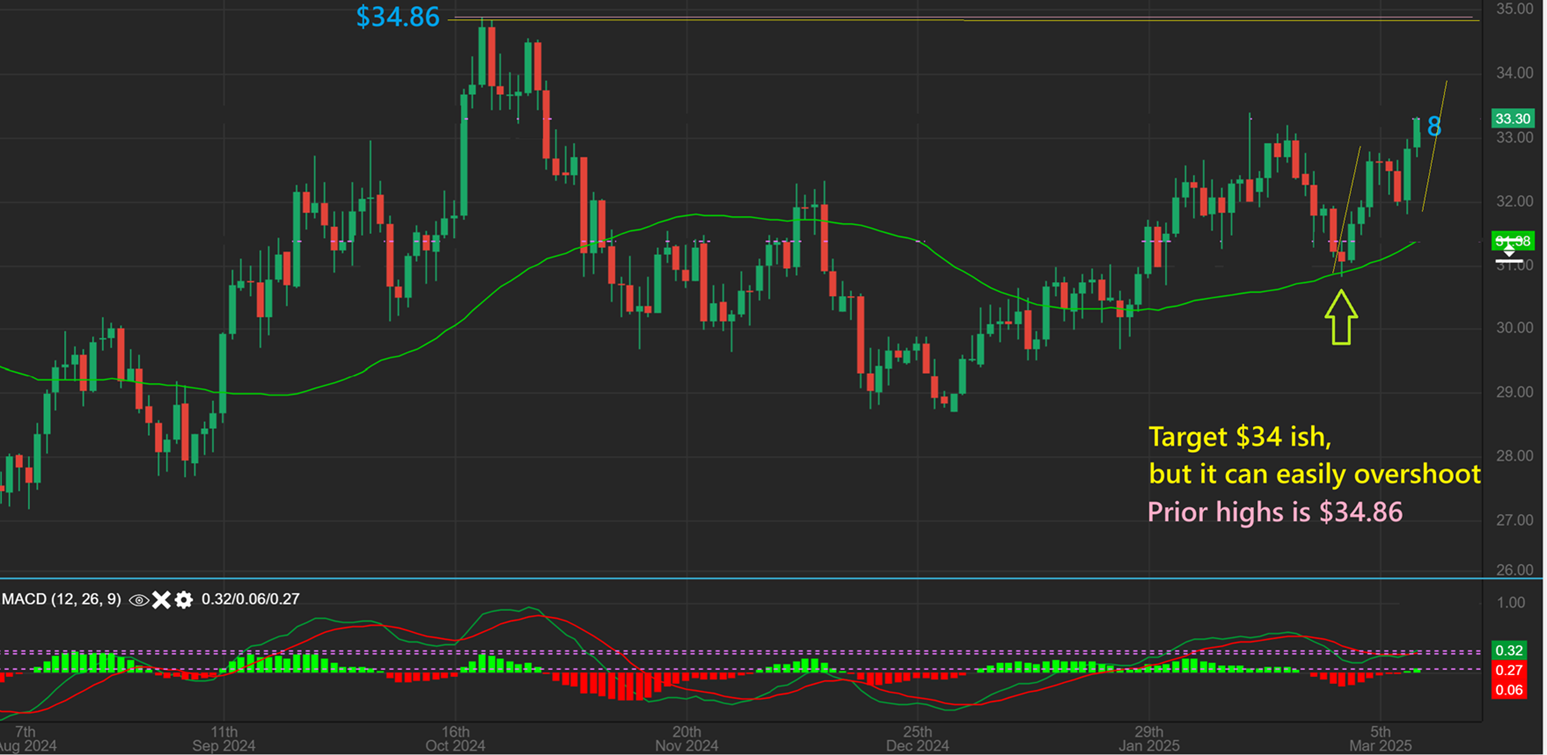
SILVER made new recent highs on day 8 and this should continue higher.
.
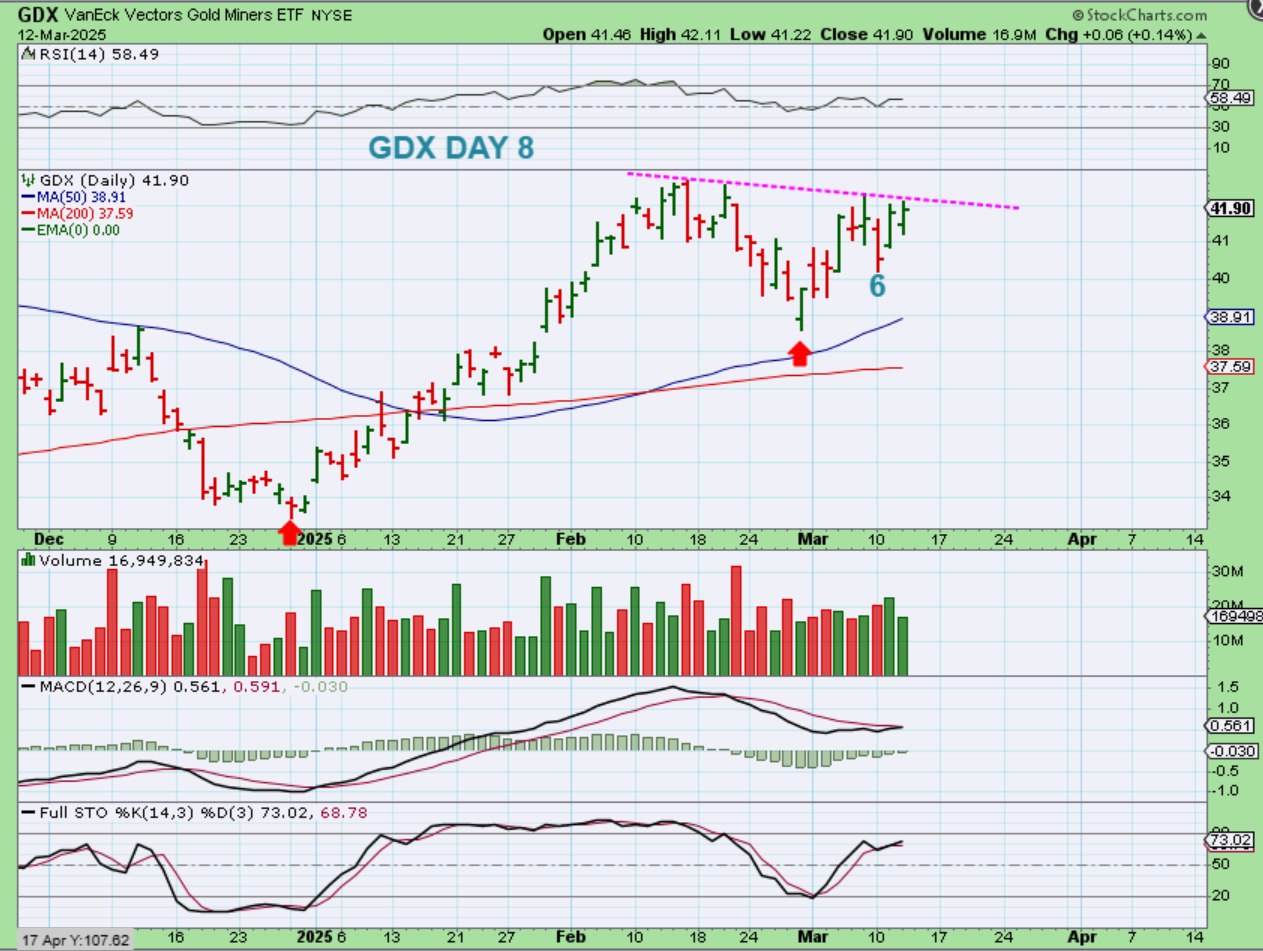
GDX gapped down and then went from red to Green.
.
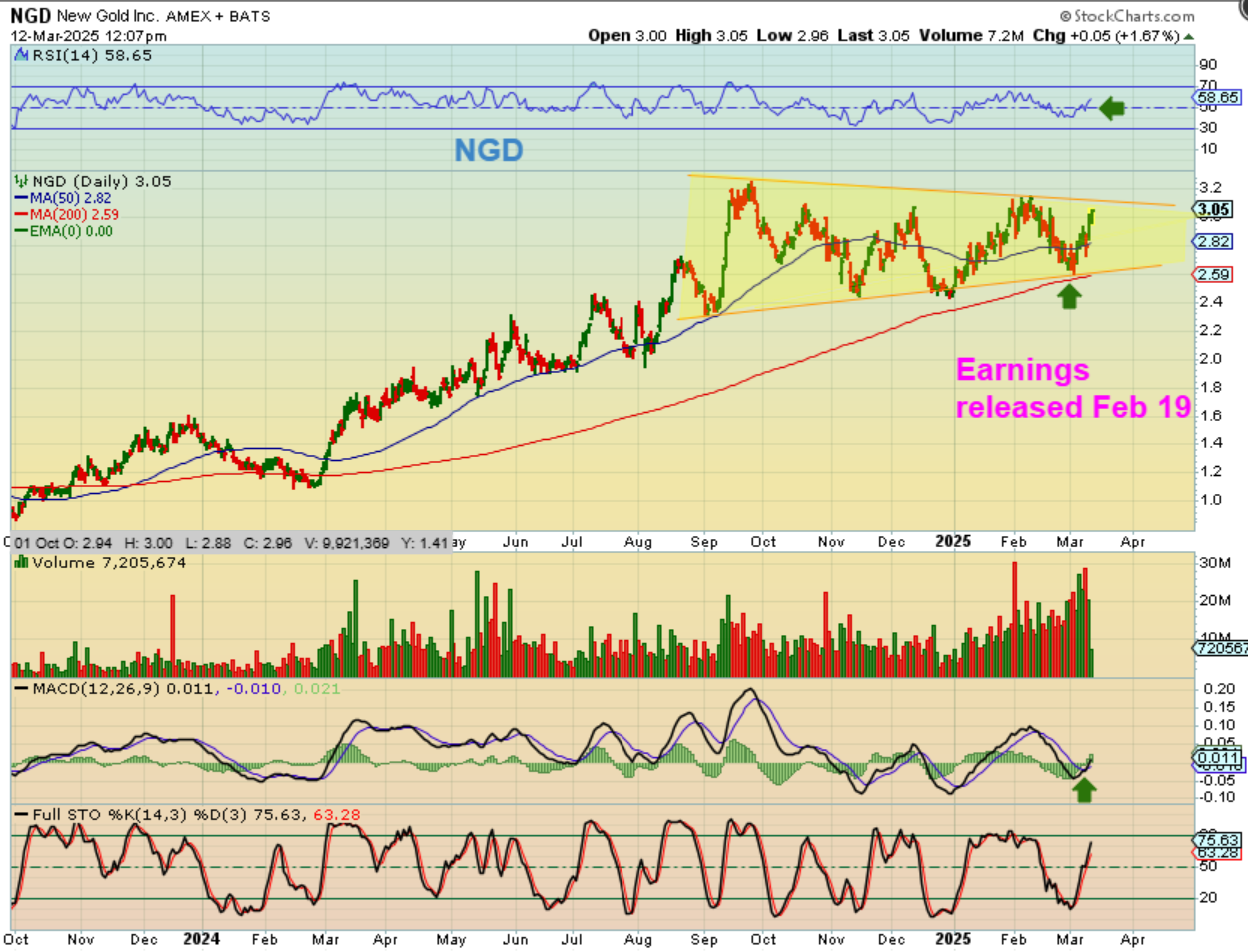
NGD – I posted this in the comments, because I really do like the set ups in NGD and SVM as once being laggers, but post earnings doing well.
.
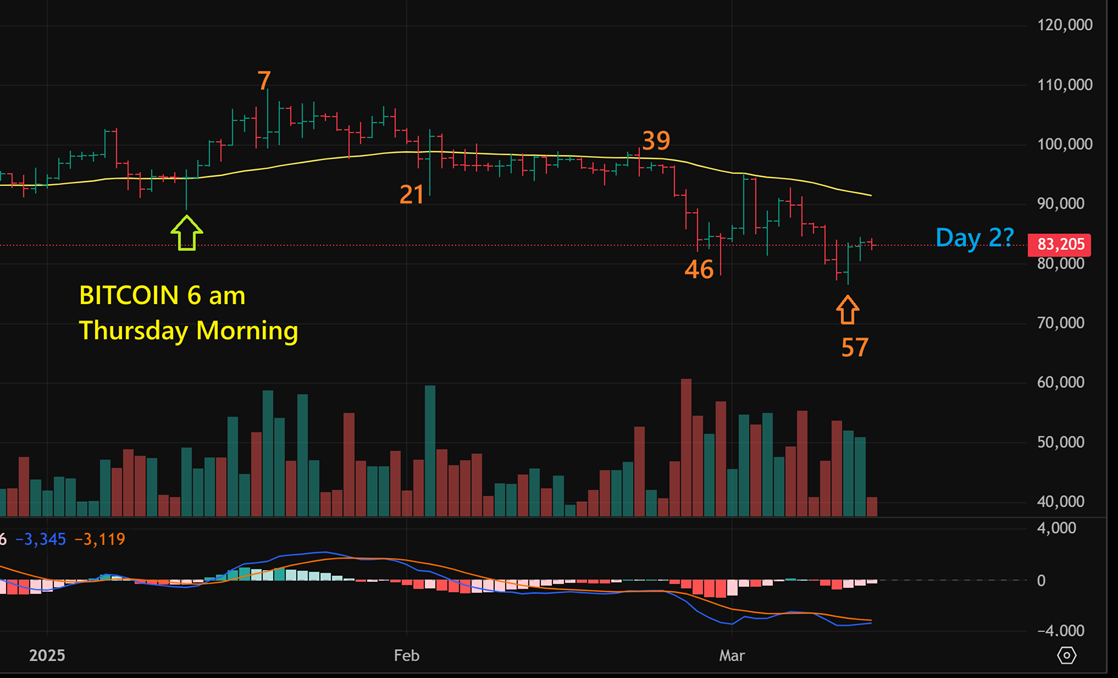
The Precious Metals and their Miners have been doing well, despite the market sell off. We now have a waterfall sell off due to come to an end and a swing low has formed, so we’ll see if we can get some follow through higher after todays economic data. As mentioned in prior reports, once we have confirmed that a low is in place, you should be able to ‘buy & hold’ some of the former bullish stocks. I have been watching PLTR, SOFI, SMCI, AFRM, etc for clues. I lso want to see how AMZN, NFLX, TSLA, NVDA , GOOD, etc recover. Bitcoin is due for a low timing-wise, and that low may be in place. I’ll discuss that below. Enjoy your Thursday trading.
.
~ALEX
.
BITCOIN DAY 57 Low: This is Bitcoin this morning and we are either seeing day 2 out of a low, or day 59 if this eventually drops to another new low. We do now have a ‘swing low’ in place, and I tend to think that when we see confirmation that the General Markets bottomed, we’ll also see that Bitcoin has bottomed.
Wednesday March 12th – Watching For The Lows 
 Friday March 14th – Still Waiting
Scroll to top