March 8th Weekend Report
We do have some great possibilities with our current set ups, but at this point it was only The Precious Metals set up that was ready to go again. Let’s take a look at the charts and see what the possibilities going forward look like. It still could be very bullish, once things settle down.
.
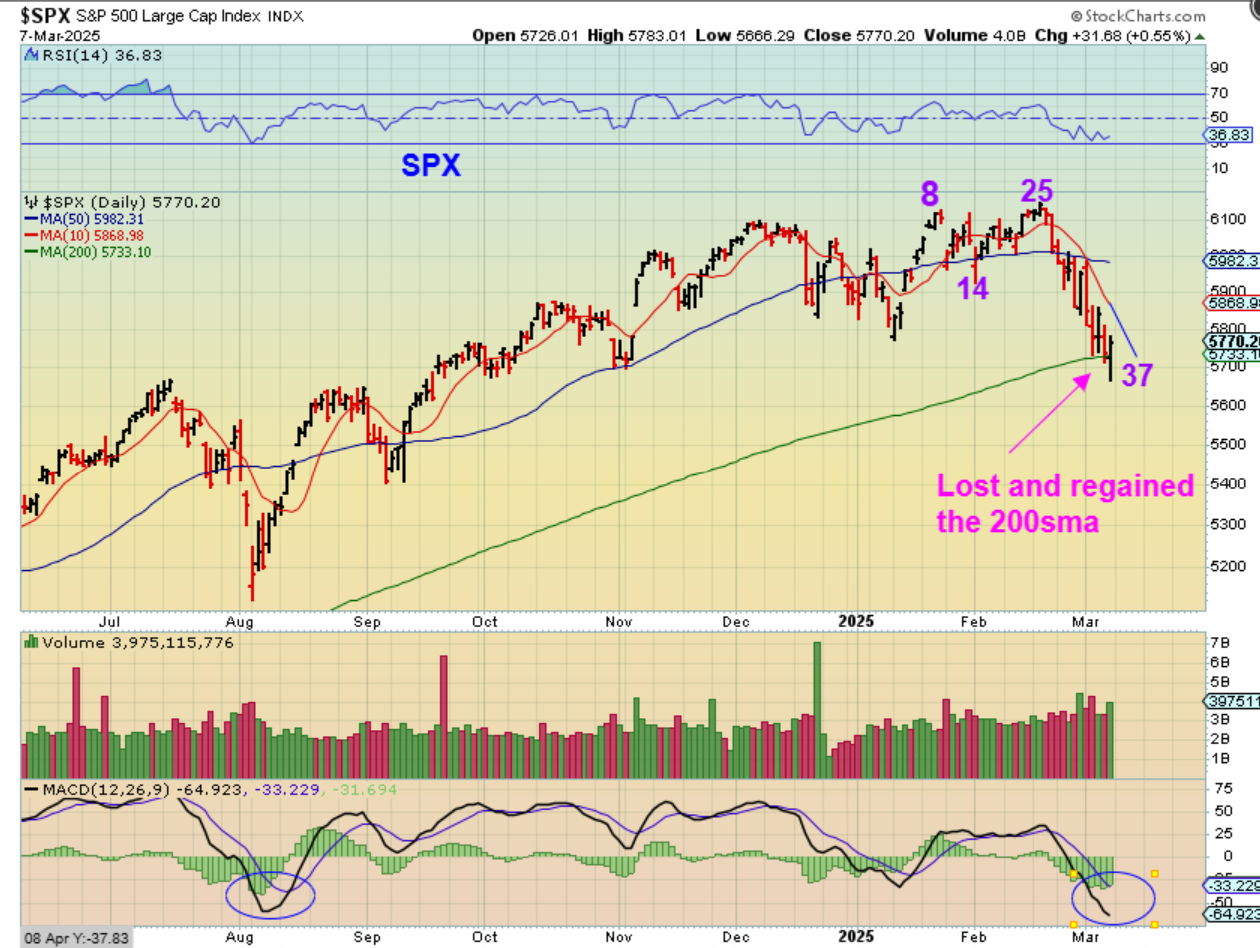
THE SPX has had 2 pretty strong looking reversals recently, but they failed to hold up. Now, however, we are on day 37 & we have a reversal that lost and regained the 200sma. The timing is pretty good that we could be seeing an ICL. This is similar to the sell off in August and the MACD is the same too.
.
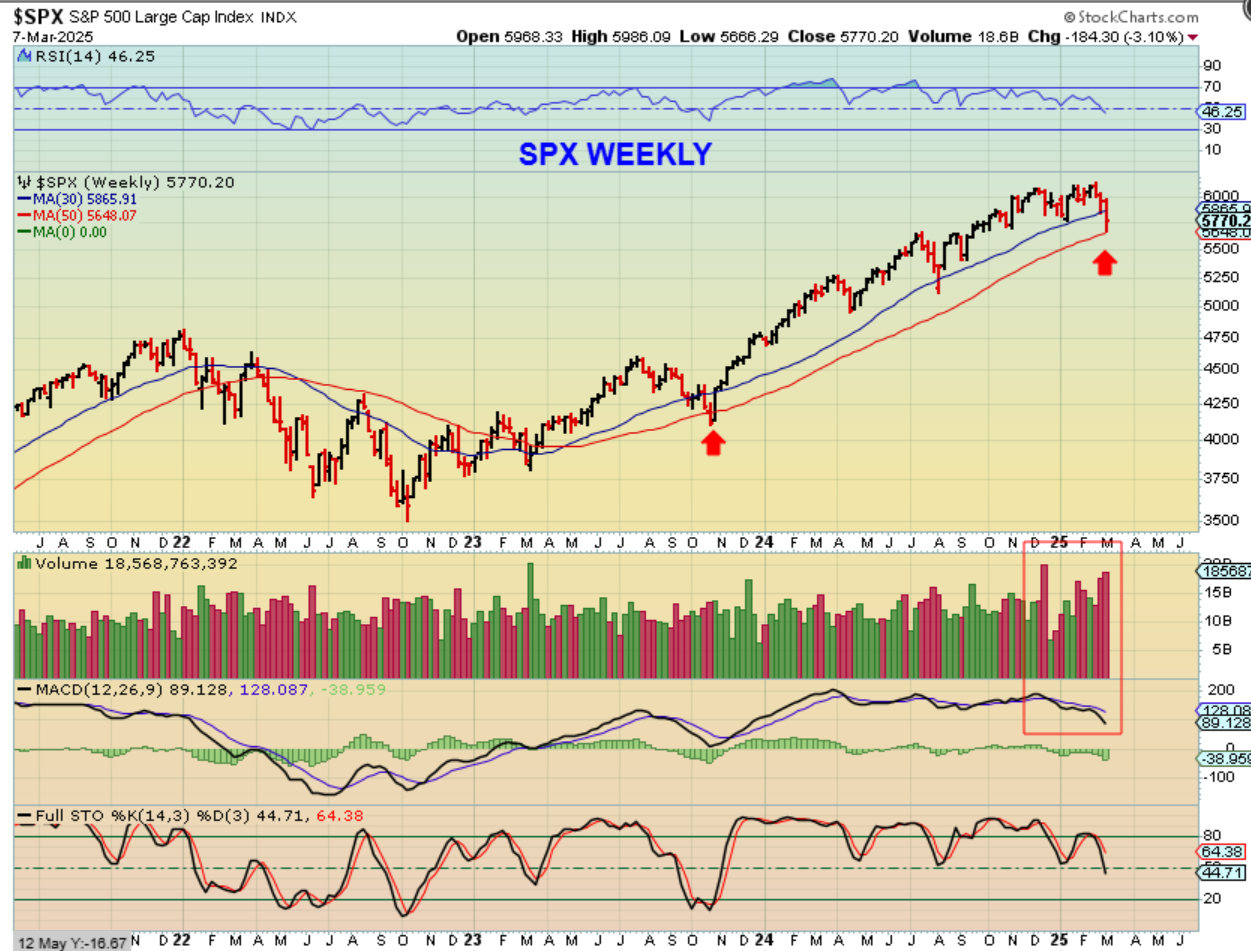
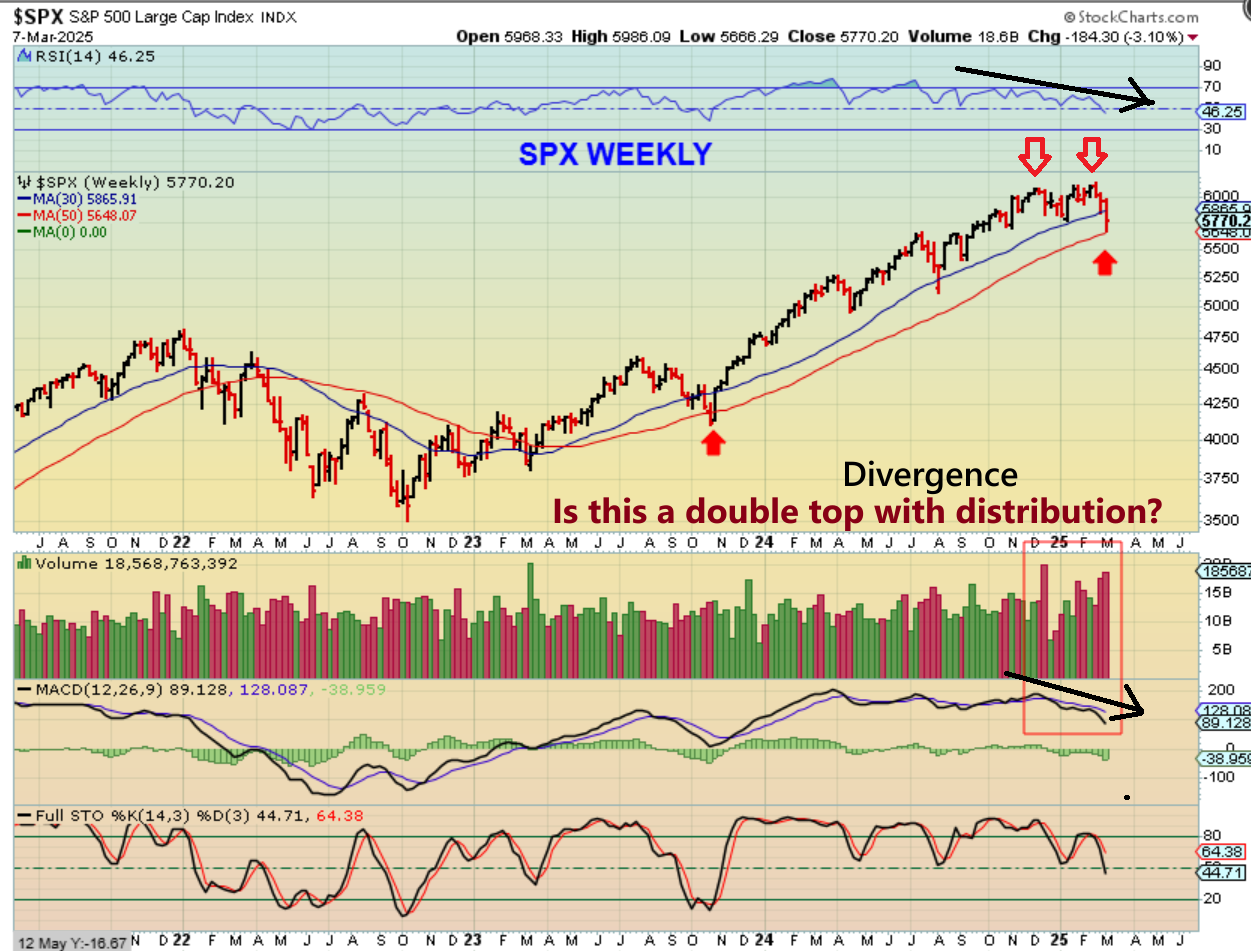
THE SPX WEEKLY also has landed on the 50 week ma and bounced. Again, this could become bullish, but the volume raises a question for me. Is that capitulation(?), or is that ‘distribution’? Distribution can happen at tops as the big boys sell their holdings off over time.
.
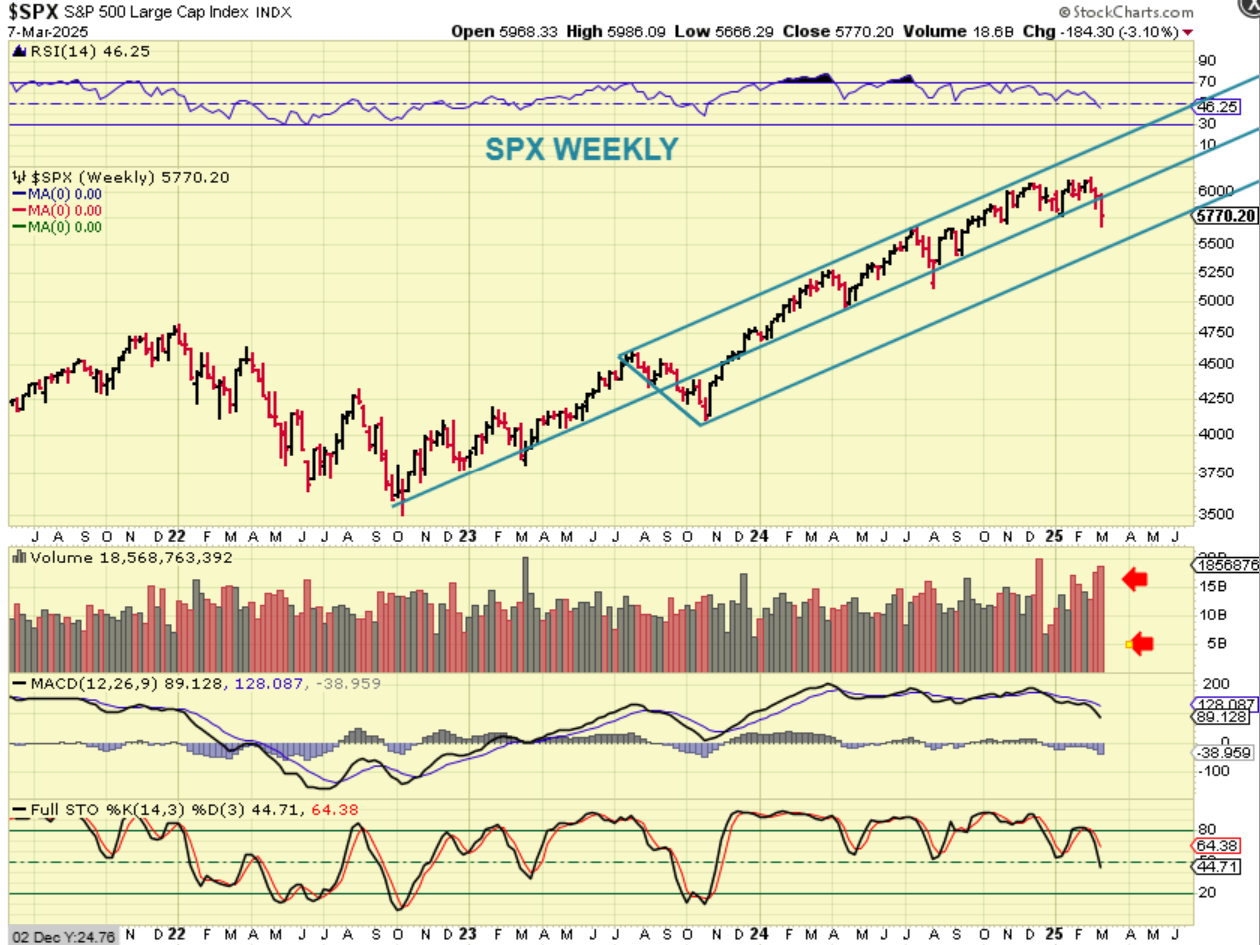
Using Andrews Pitchfork, I don’t see anything really alarming. THE SPX lost the middle level, but an ICL would regain that quickly, like we saw in August of last year. We will buy the low and raise stops along the way, that volume still catches my eye and the RSI does too.
.
THE SPX WEEKLY also is showing divergence at the last 2 peaks. If the next daily cycle is weak and ‘peaks’ early, we could see a larger correction due to the current indecisive political environment. Please read the chart.
.
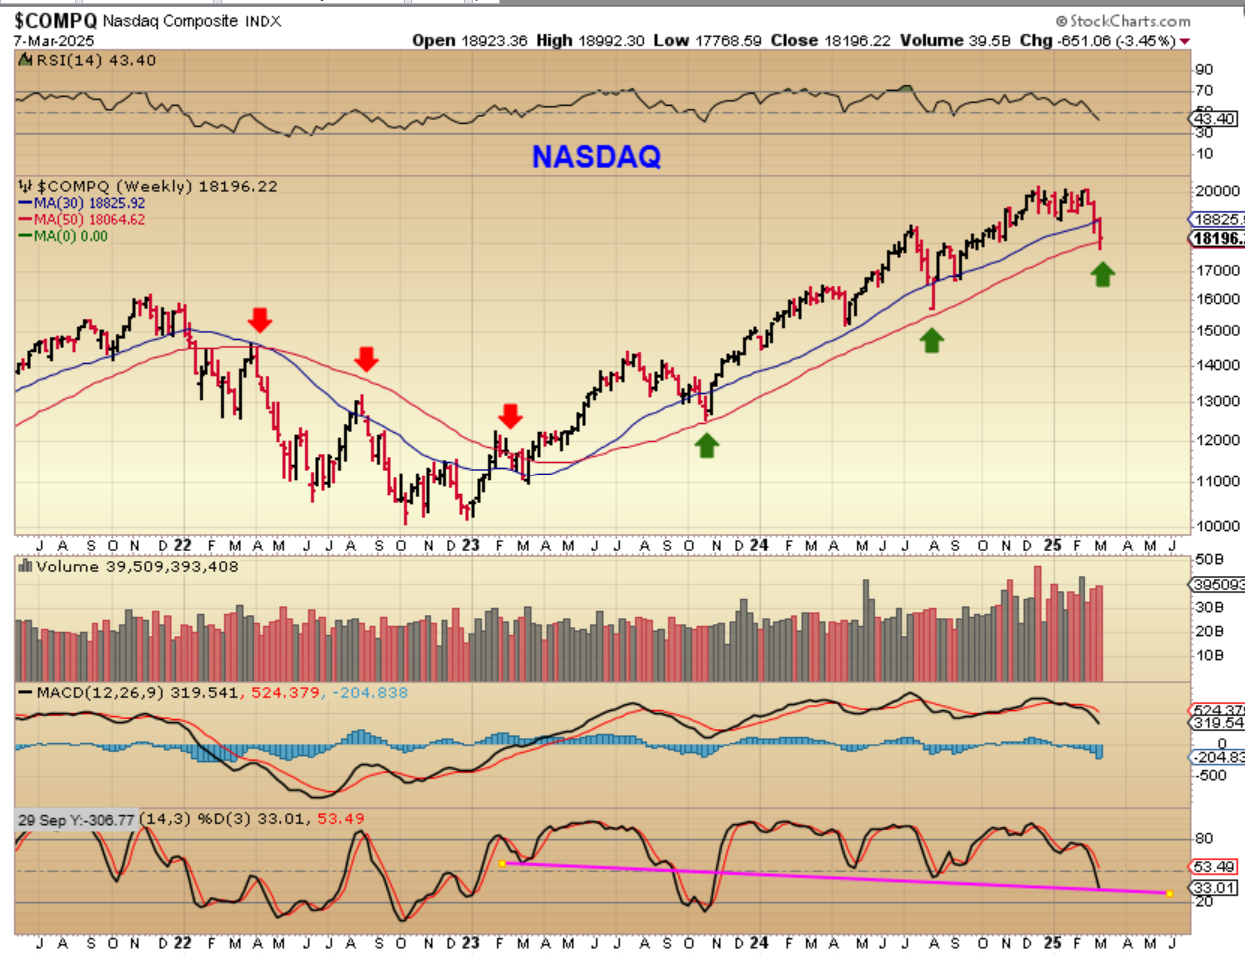
THE NASDAQ does not look bad as it seeks out an ICL. We should expect that most drops into an ICL will feel bearish, but the Nasdaq is at support. The only thing here that catches my eye is that RSI. All of the sideways chop that came with the new US administration making big changes very quickly (Tariffs, sweeping job losses and firings, etc) causes concerns and instability. Now the RSI is weak, so we’ll see if things can perk up again once a low is in place. A reversal here at the 50 week ma could be the ICL.
.
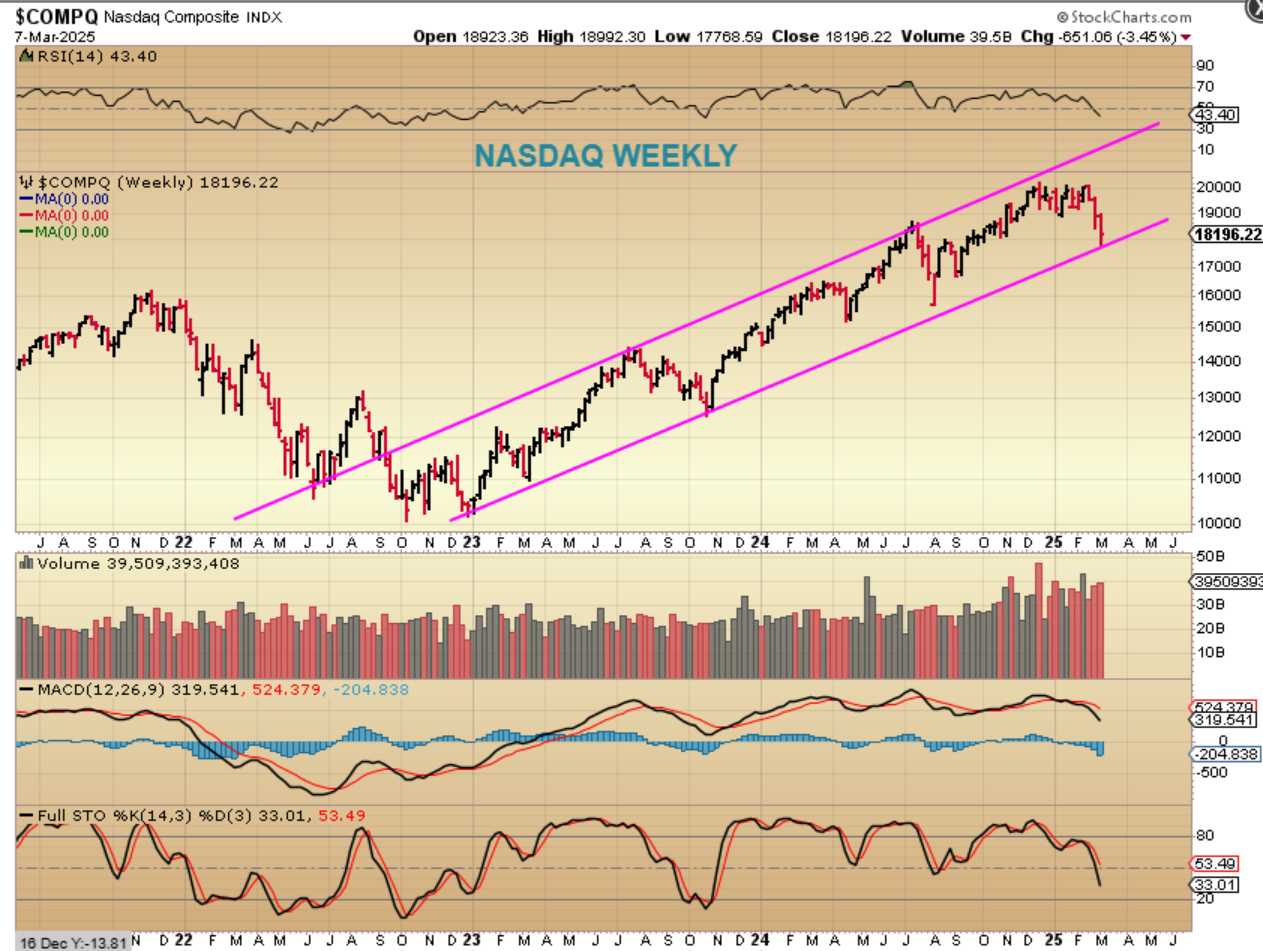
NASDAQ – I removed everything except for technical analysis, and this area is where the low should come in if this is to remain very bullish.
.
ONE POSSIBLE PROBLEM TO REMIND YOU OF, BUT THIS MAY JUST BE AN ANOMALY! I have already discussed this in the past.
.
Do you remember when The SPX daily cycle mimicked an ICL? We put in a very deep chopping low (see #1). It ran up for 8 days and broke the downtrend line, looking like an ICL. The chop & indecision in January gave us what looked like back tests of that trendline, but (here’s the point) it ran up to a new high, so day 8 was no longer the peak, day 25 was. That made this Right Translated and we viewed this as the ICL. From that point off we cascaded lower. The Nasdaq did NOT do this, it peaked on day 8 and then rolled over, so we saw this as the ICL must still be head. First daily cycles do not break the lows like that. The day 25 peak must have been a fluke, an overshoot. That said–this is not normal and may be why we are getting that double top with divergences.
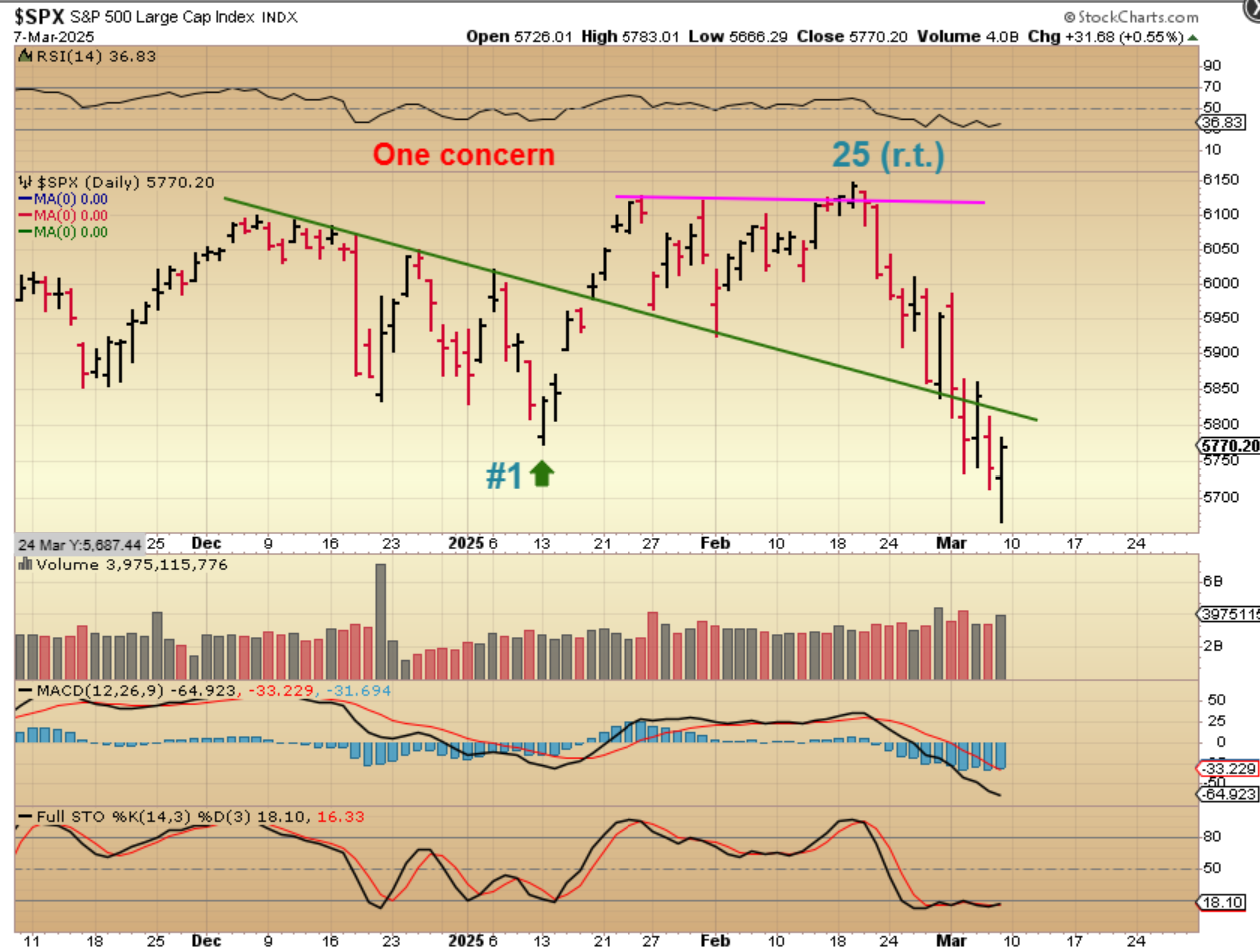
The day 25 peak must have been a fluke, an overshoot. That said–this is not normal and may be why we are getting that double top with divergences & heavy volume. So again, we’ll buy this next low as an ICL and just raise stops along the way. The bull run could easily continue if the current disruptive political environment calms down. By the way, as of Friday, Tariffs were postponed (again & again) for 4 weeks.
.
I WANT TO REVIEW THIS OIL DAILY CYCLE COUNT: To show you why it is important!
.
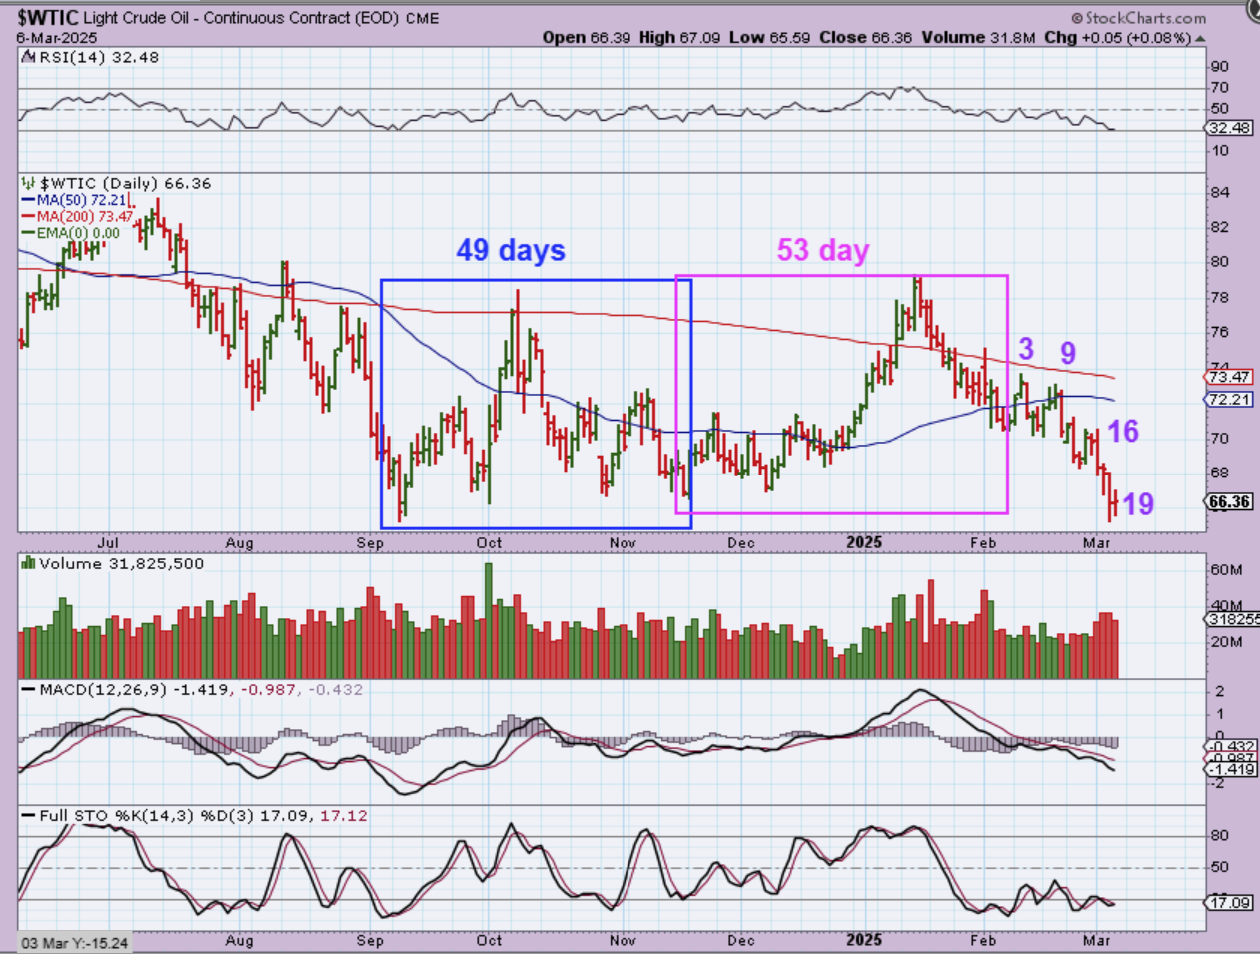
WTIC – This chart shows an ICL and the daily cycle count for Oil is often long, 45-50+ days.
1. We have 2 normal length daily cycles, but they are very choppy.
2. Oil has NOT been able to get above that day 3 peak, so it is now extremely L.T. and we also broke below the ICL on only day 18!
3. This was Thursdays chart, so on Friday we were on day 20. Day 20 of a possible 40-50 day Left Translated daily cycle that already peaked means we have weeks of downside left!
4. If this count is correct, and I don’t see how any other cycle count would fit, then we’d have 20 – 30 days left in this daily cycle to chop lower and lower. NOW what does that mean to the bigger picture?
.
We should have 20 – 30 days left in this daily cycle to chop lower and lower. NOW what does that mean to the bigger picture?
.
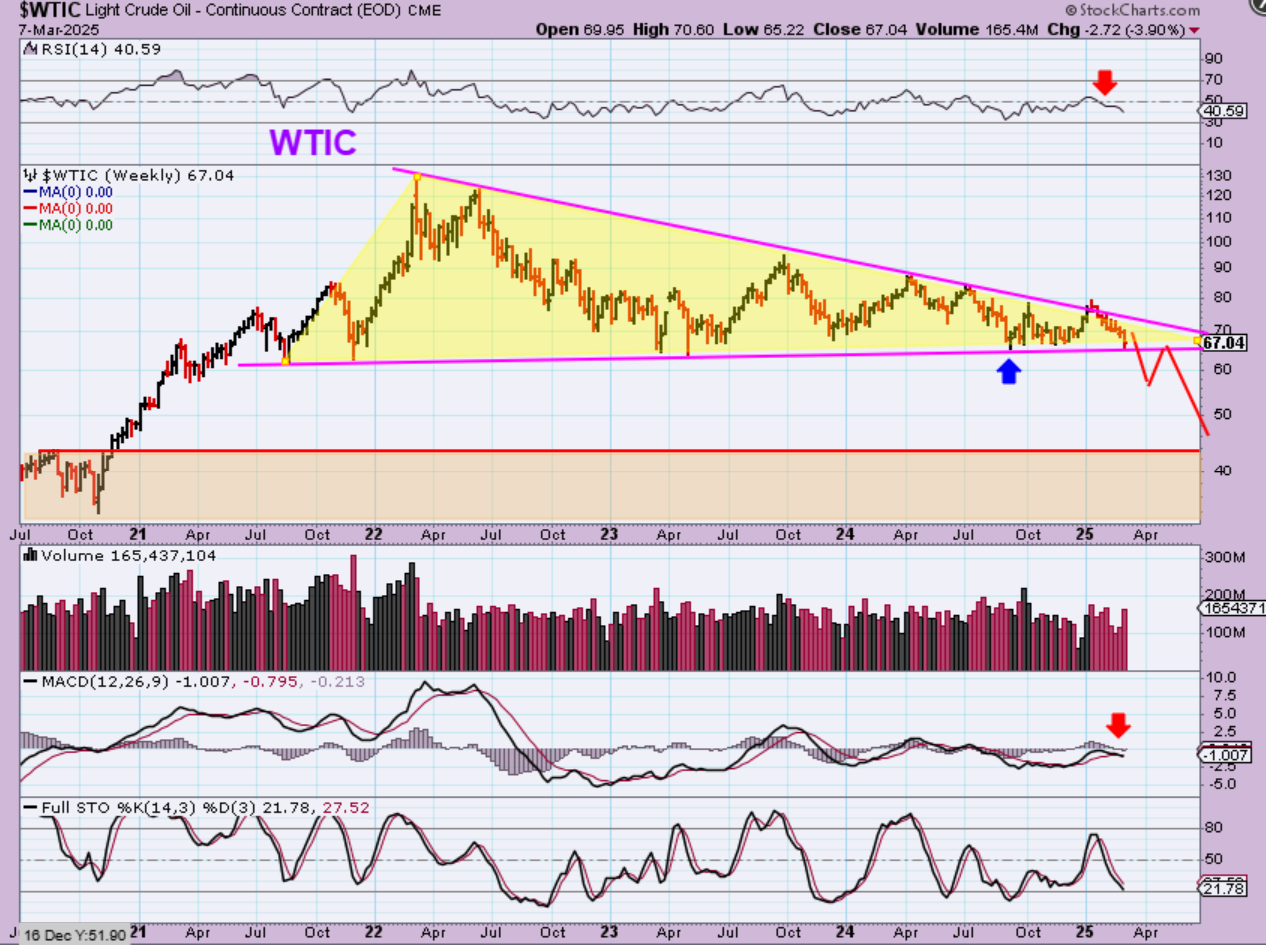
WTIC – I do not see a lot of support to the left of the chart, in between $60 & $43ish, so we could see Oil sell off further. The weekly MACD also looks to be crossing lower, and the RSI is now around 40%.
.
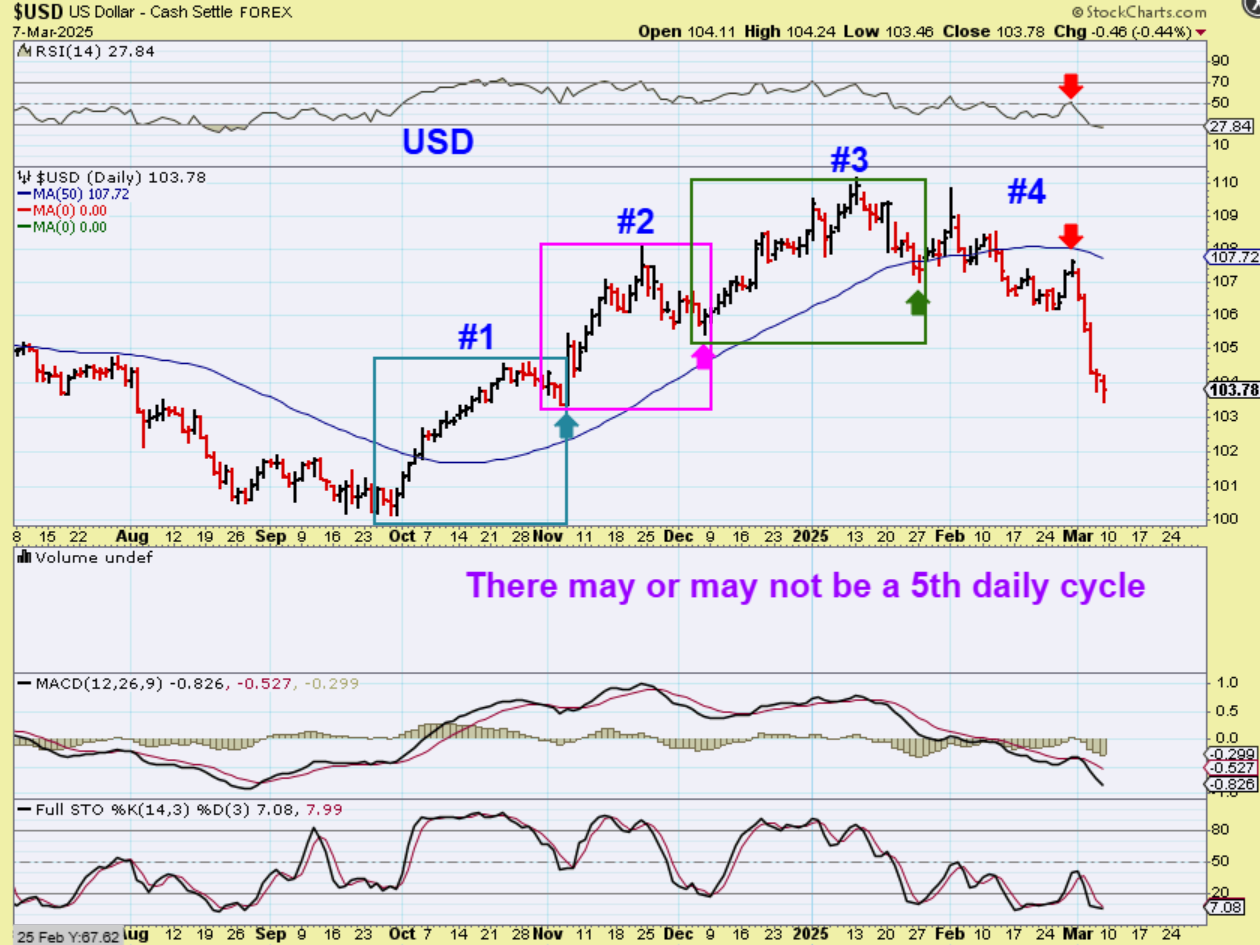
THE USD has rolled over as expected in the 4th daily cycle, and this looks like the crash phase into the next dcl. It also may have another weak 5th daily cycle, because…
.
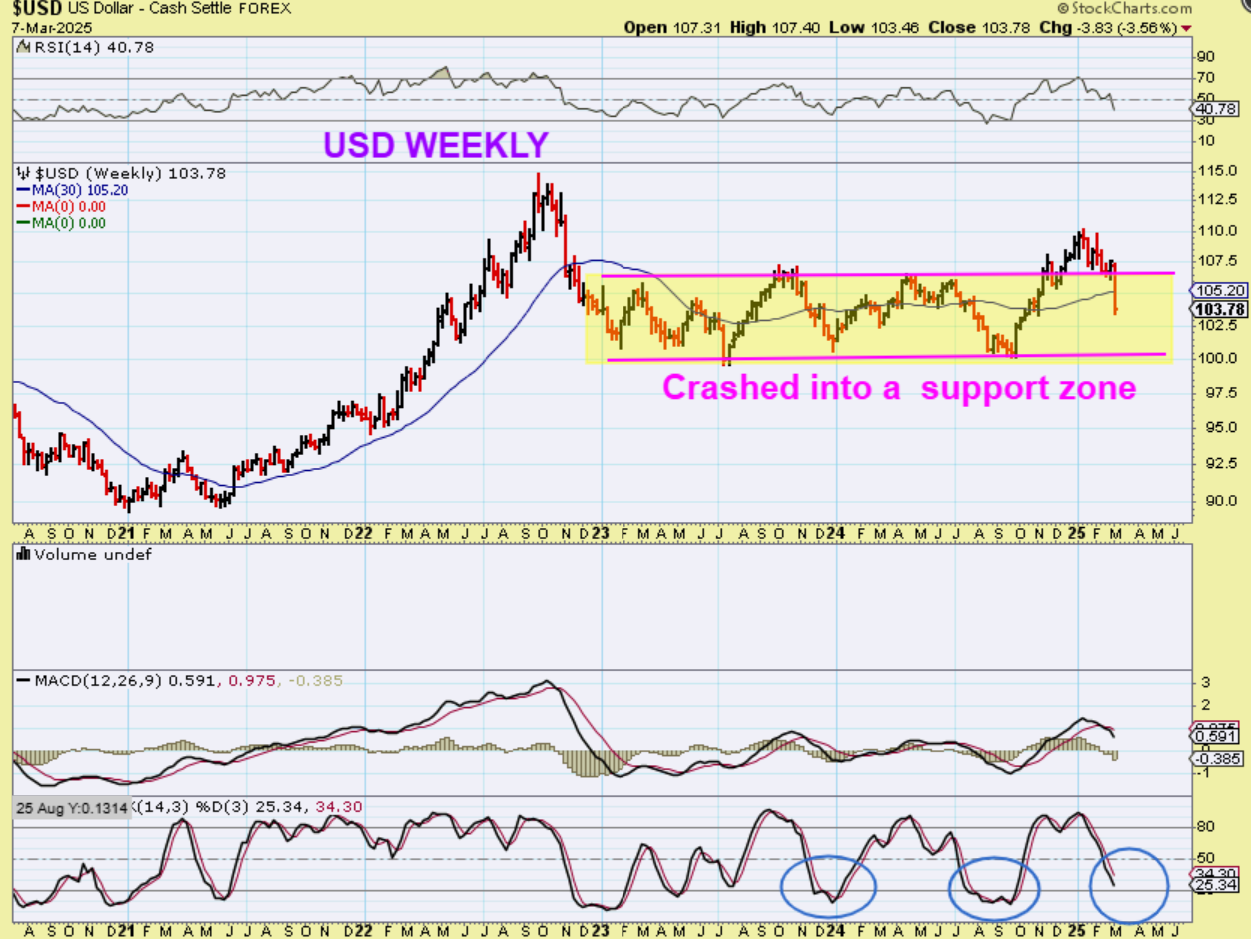
THE USD crashed through support. The weekly chart is not fully oversold yet and the MACD just crossed lower, so a 5th daily cycle may take the USD (after a bounce) to the bottom of support.
.
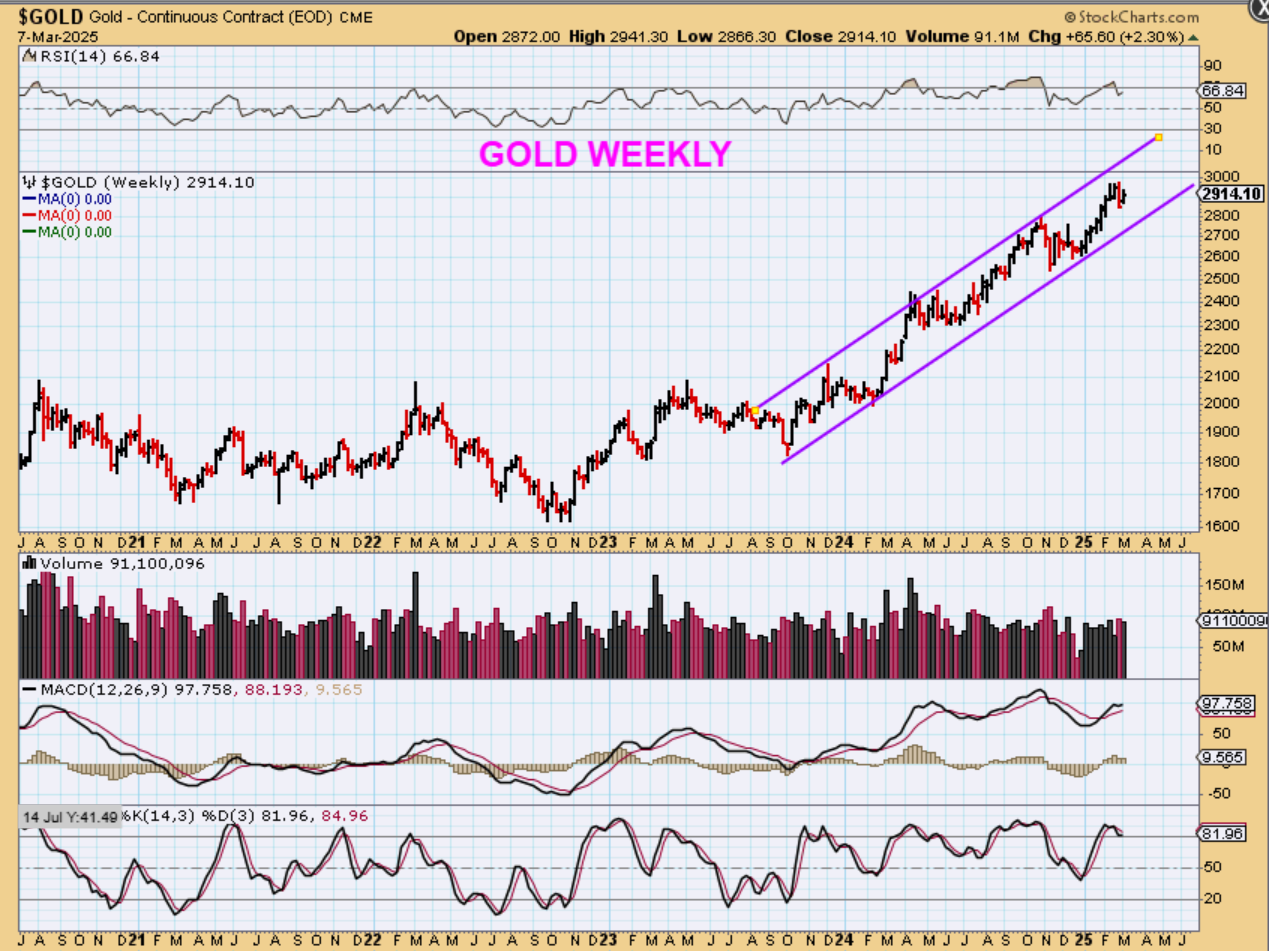
GOLD has a beautiful upward running channel from $1800 – $3000. It hasn’t reached $3000 yet, but my initial target was $3040 or more, and we just put in a dcl.
.
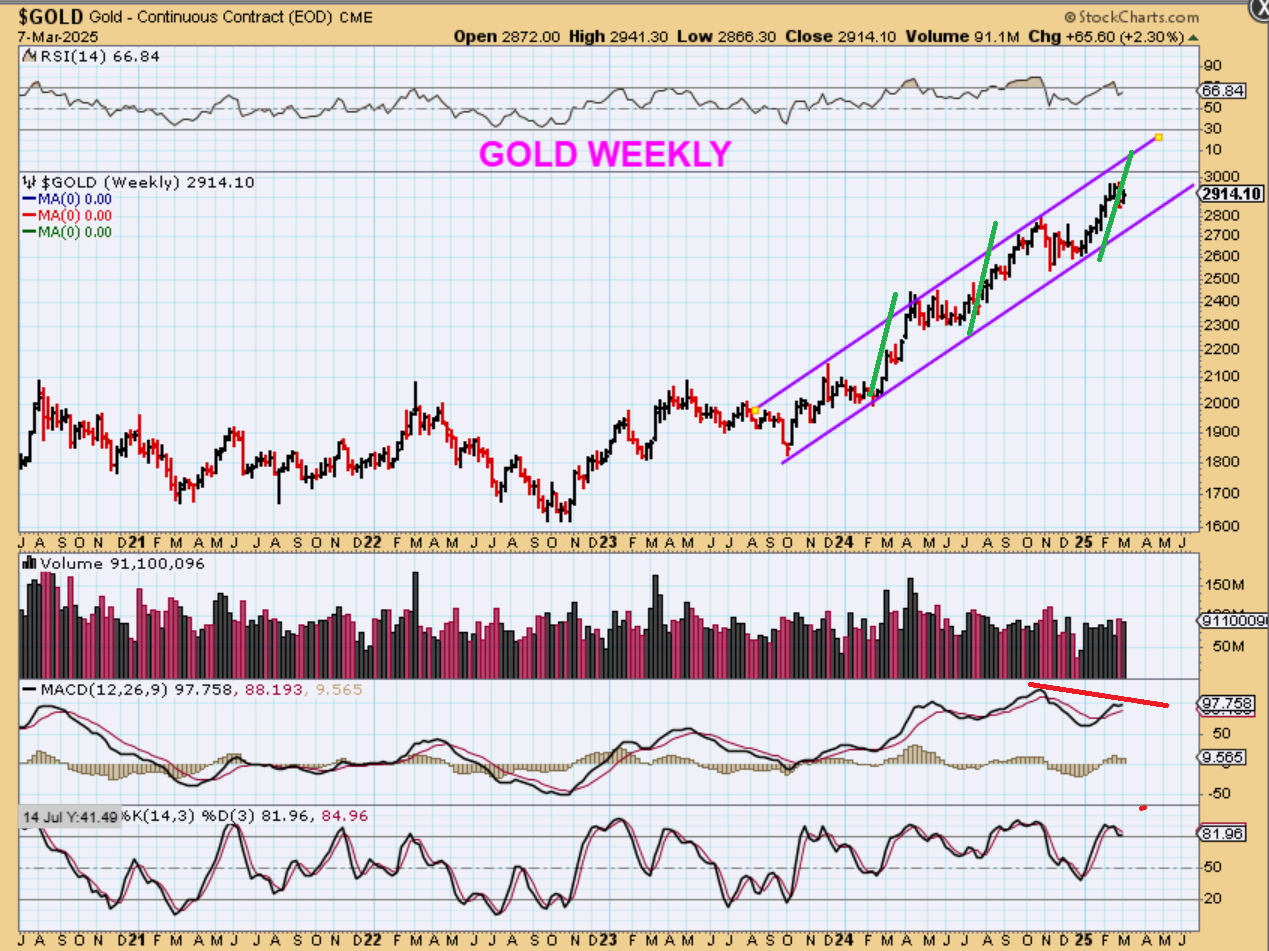
GOLD – I roughly copied the length of the 2 prior sprints higher and if we follow that pattern, we should still have more upside, hopefully despite the fact that the MACD did not confirm the current new high / peak.
.
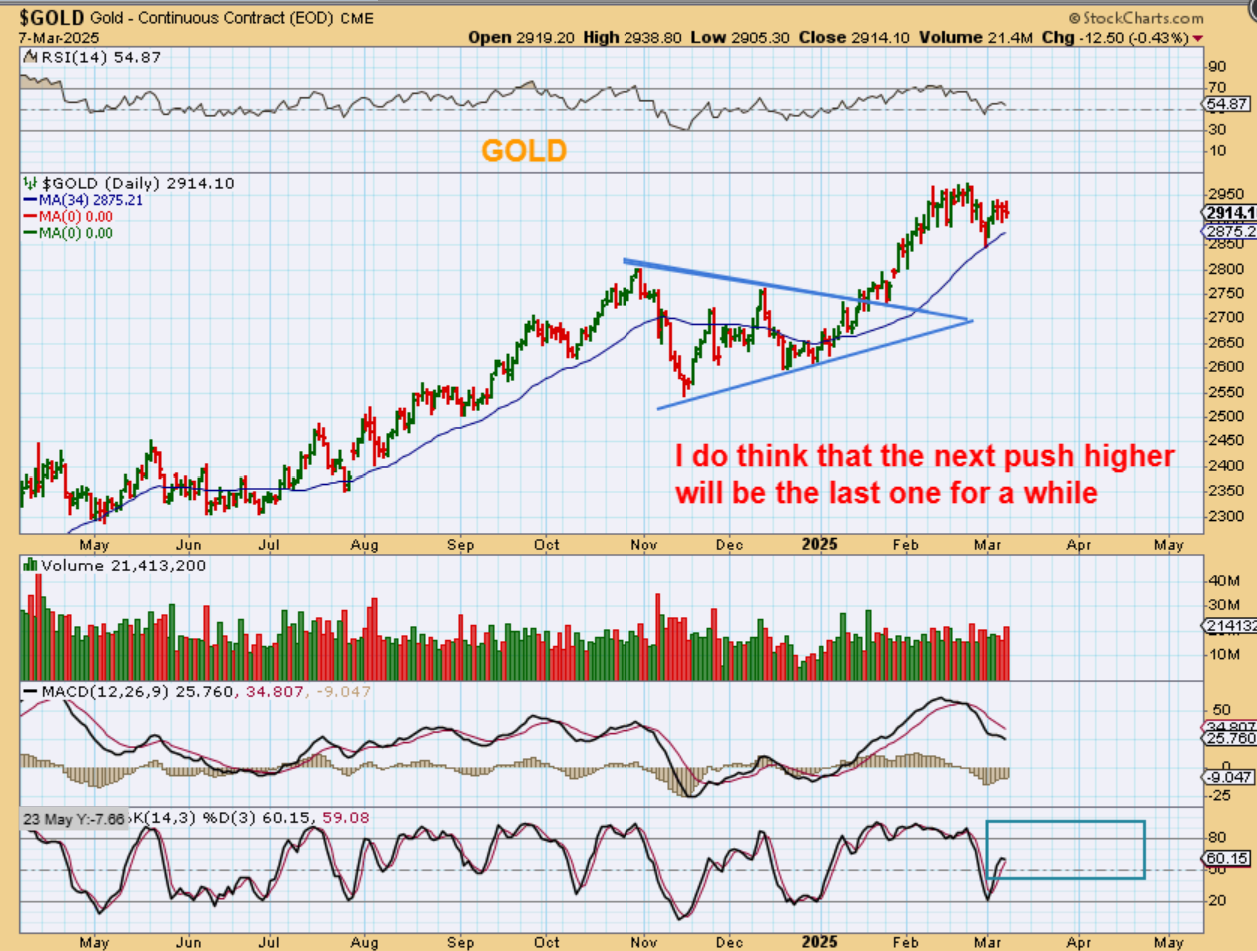
GOLD – I do think that after this next daily cycle, Gold will need to consolidate the recent run up again. It COULD go parabolic, that is not out of the question, but for now it seems to be a little heavy.
.
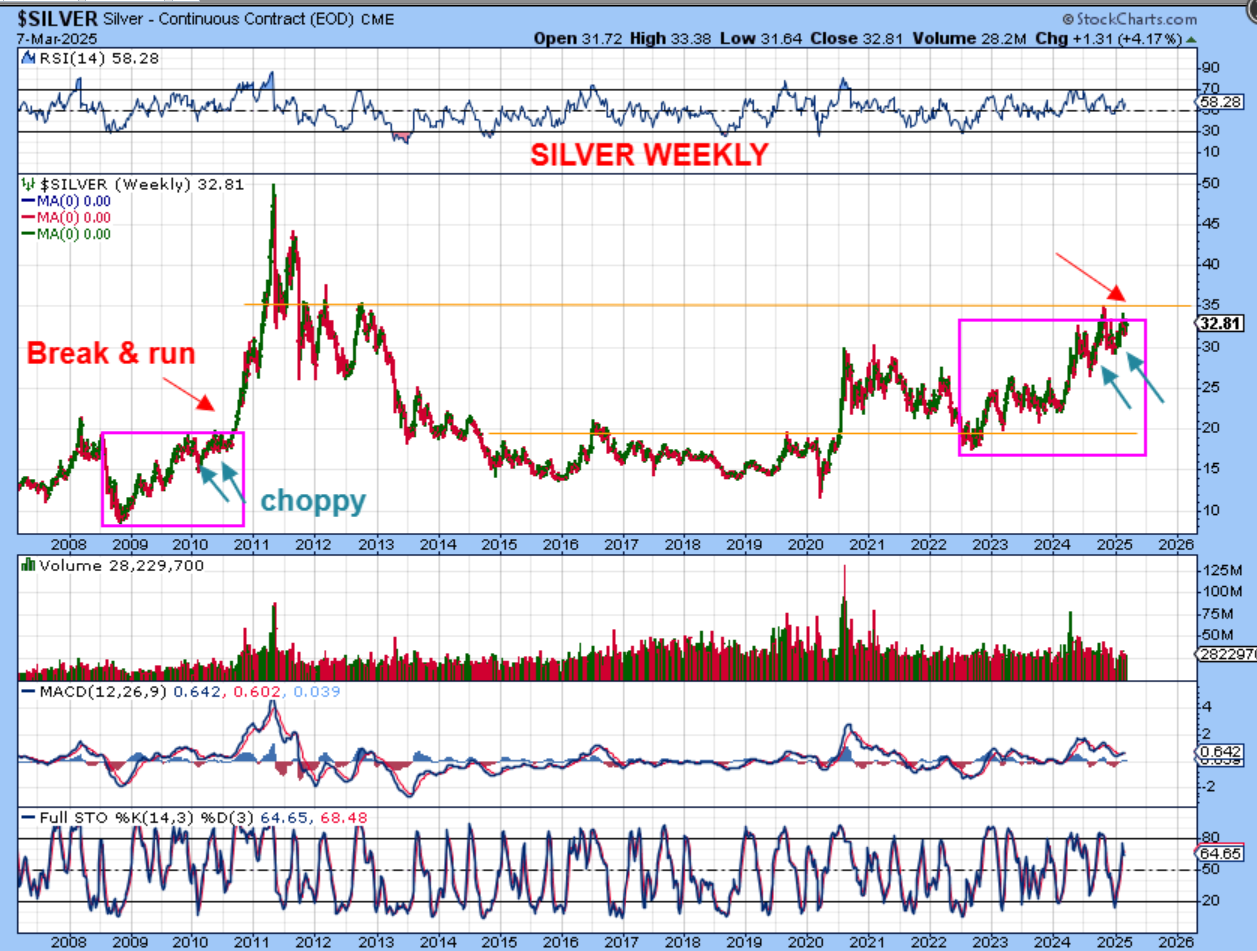
SILVER is a choppy mess, let’s just face it, and this has been while Gold was ramping up higher for the last 2 years, really. Now, looking to the left we see that Silver was a choppy mess right before it rocketed straight up in 2011. If Gold runs up over $3000, Silver may catch fire and finally give us the kind of gains that it should have already had by now.
.
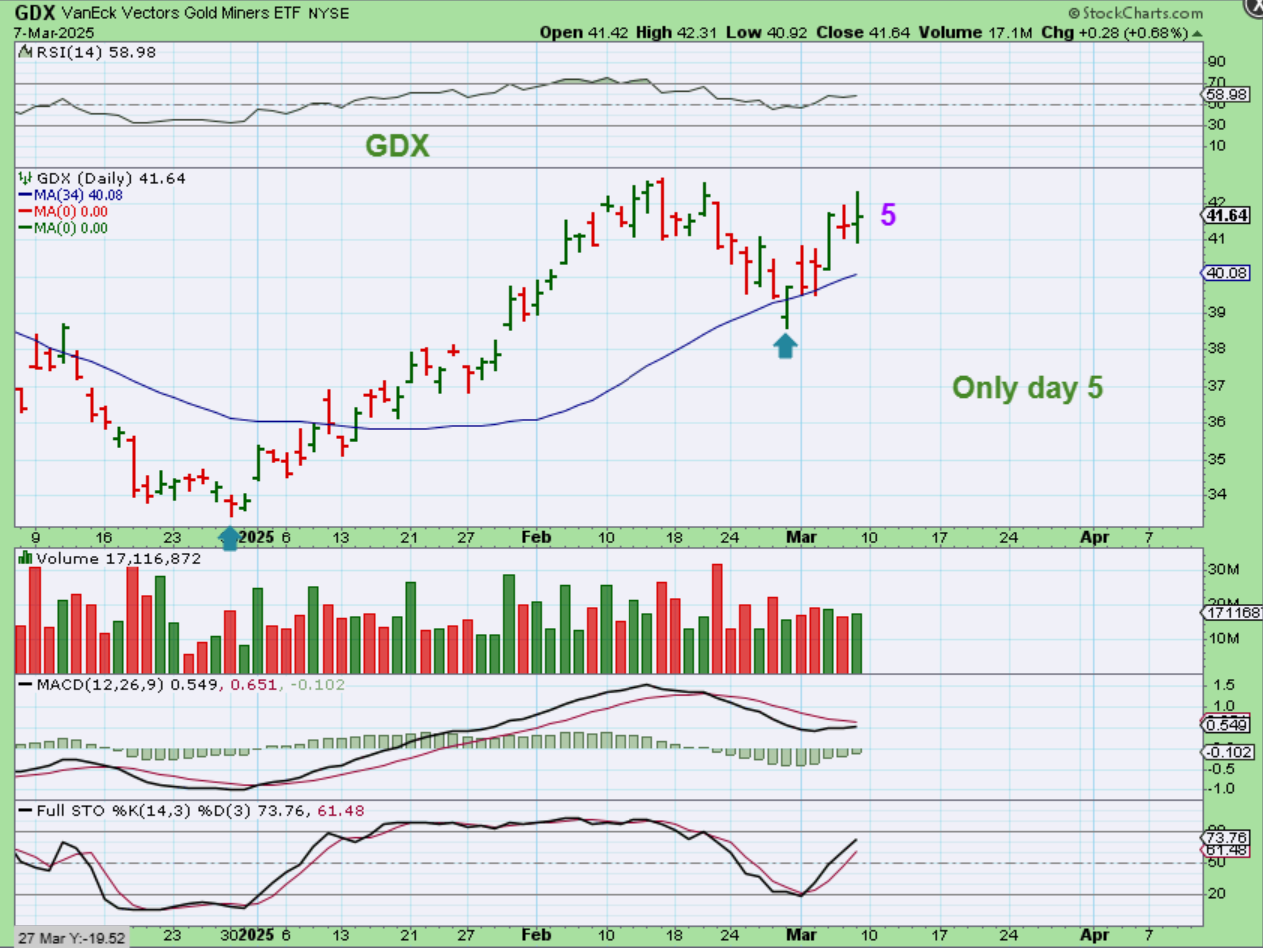
GDX is on day 5 of a new daily cycle so this should continue higher. Many of us bought the lows in December/January and if you sold along the way, you should have already re-entered positions. If you rode that basket higher in Jan -February, you could have even added for the next anticipated run higher.
.
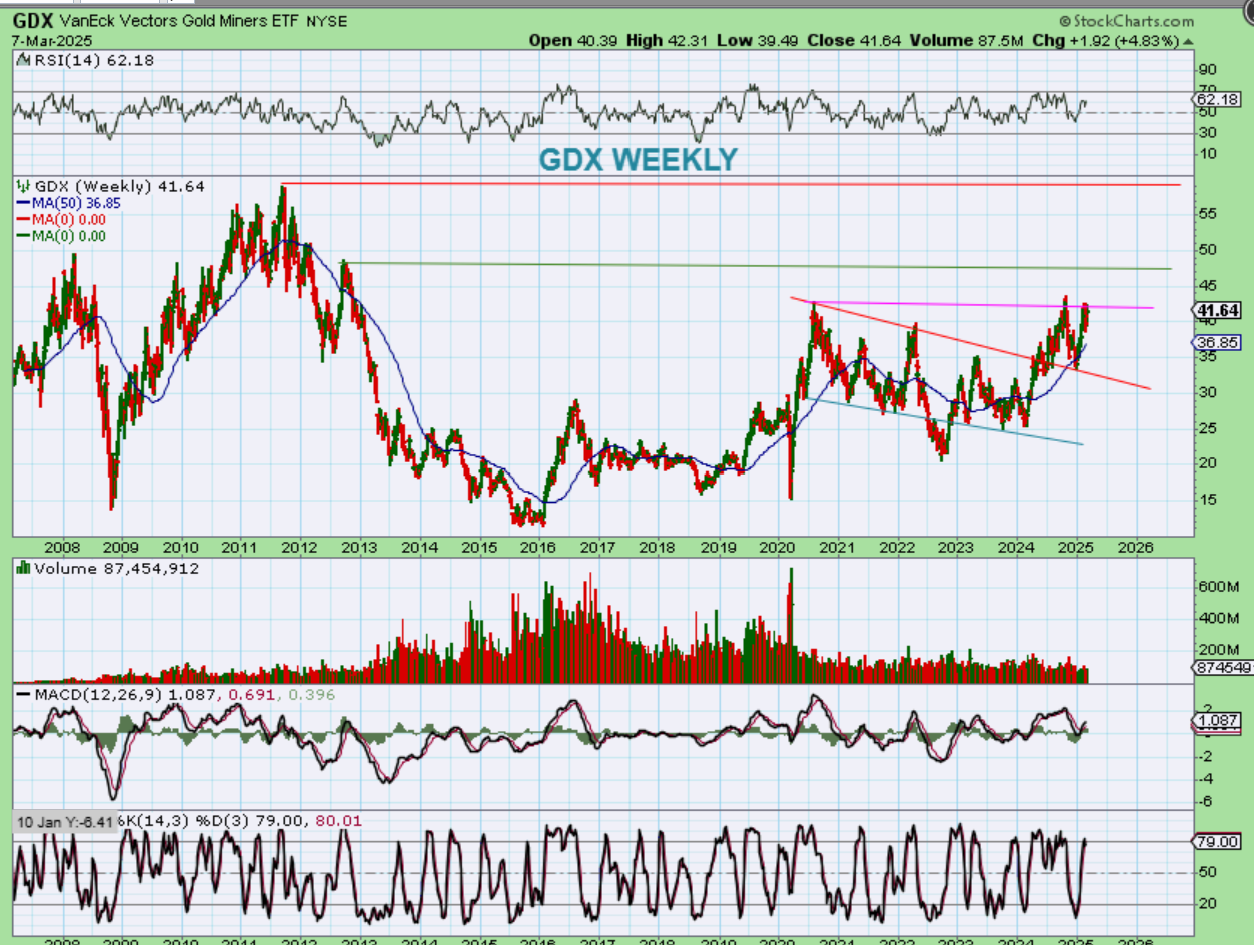
The WEEKLY GDX Chart is a choppy mess too, because Miners have had a hard time holding their gains , but if Gold & Silver run next, this could break out and head to former highs.
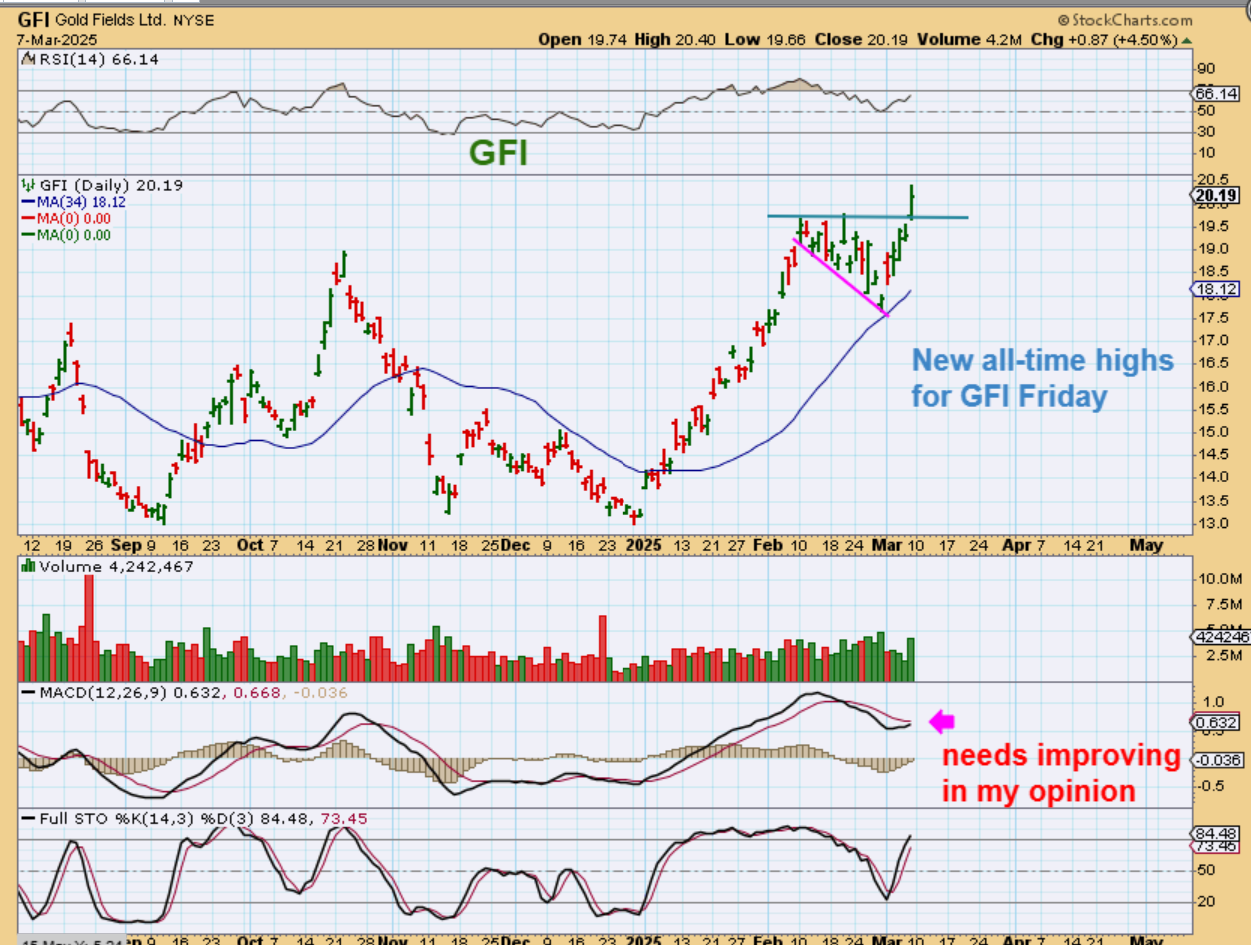
I have been showing charts in the weekday reports of GFI, HMY, AU, AEM, etc running back to the highs, so of them at all-time highs, so some Miners that were leaders have done very well, and these are the ones that I was recommending. Then I mentioned some like NGD, NG, Barrick, NEM, etc that could play catch up, so I will continue to cover them in the weekday reports, and some of the silver stocks are starting to shape up nicely too.
.
So as mentioned, I do think that Gold may have 1 more run higher, but I’m starting to see little divergences with prices at new highs on some of the Miners. I think we’ll see a bit of a rest after this next move higher.
.
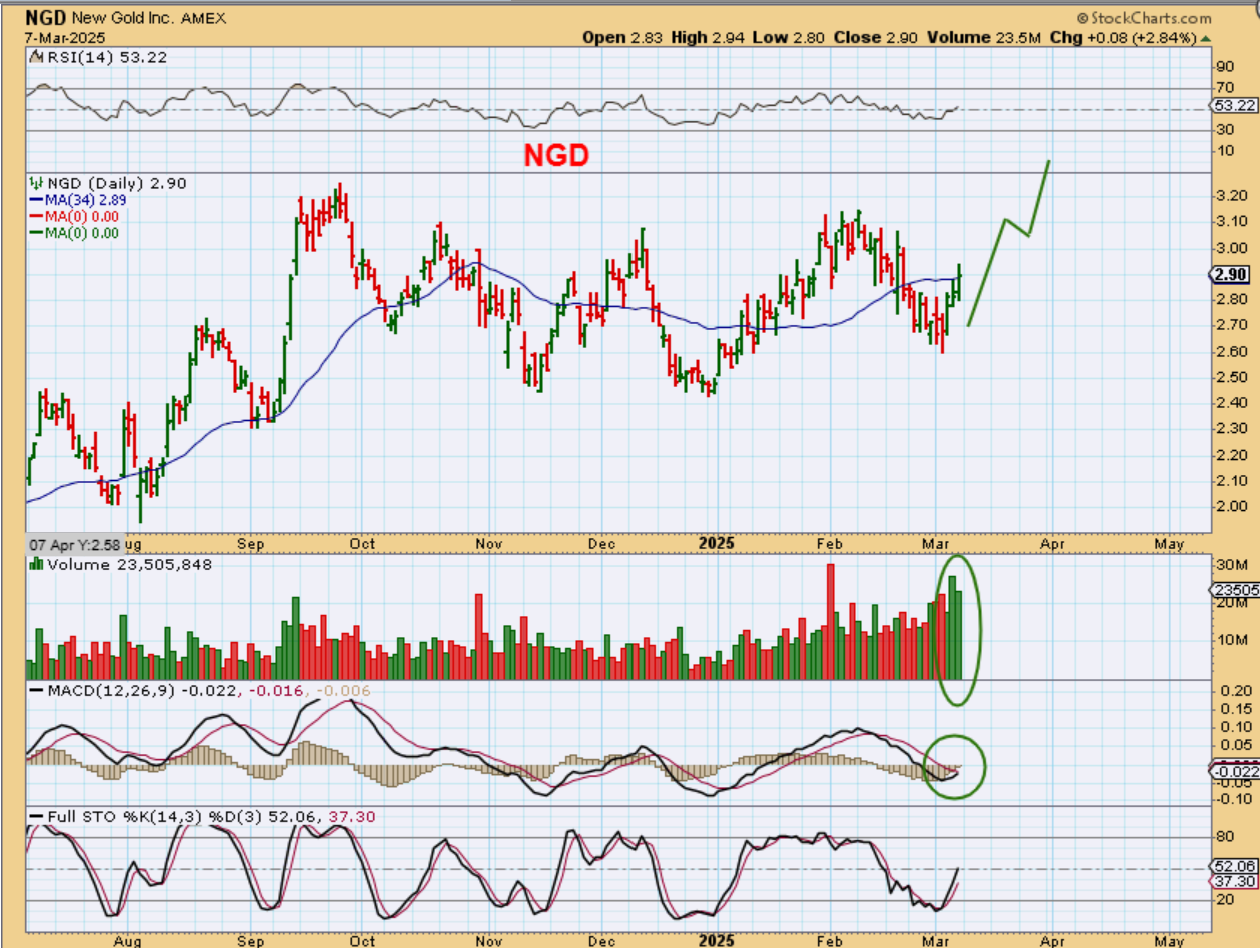
NGD is one of the laggers that I think may be ready to make a run from here. That volume, RSI, and MACD set up look bullish.
.
So Miners look ready to continue higher from here, and next week we’ll be watching to see if we get our General Markets ICL. We could veen think about shorting Oil if it bounces, using DRIP or another vehicle. For the General Markets, Some stocks have held up better than others during the selling, so I will likely have them in the weekday reports.
.
~ALEX
.
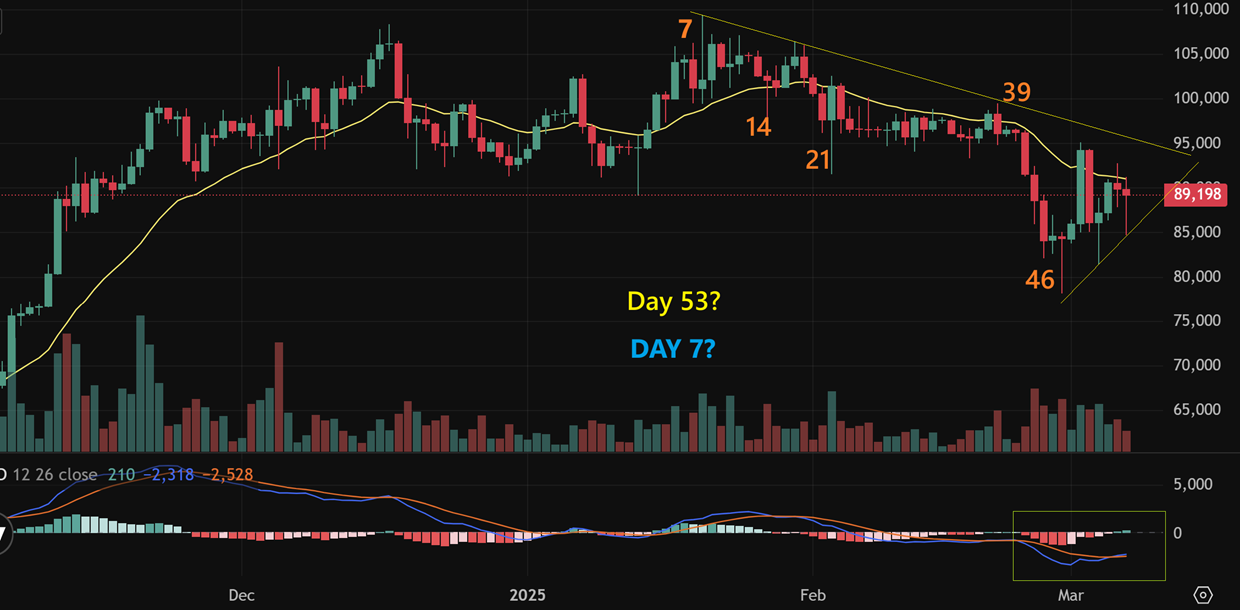
BITCOIN is climbing with a series of higher lows with 3 nice looking reversal candles, but some Crypto Stocks (like RIOT) almost made new lows again yesterday, so this is tricky. Are the Crypto Miners delaying in case Crypto has another drop? Or will Bitcoin breakout higher and get over the 20 ema and that downtrend line over the weekend, after the Whitehouse Crypto Summit?
.
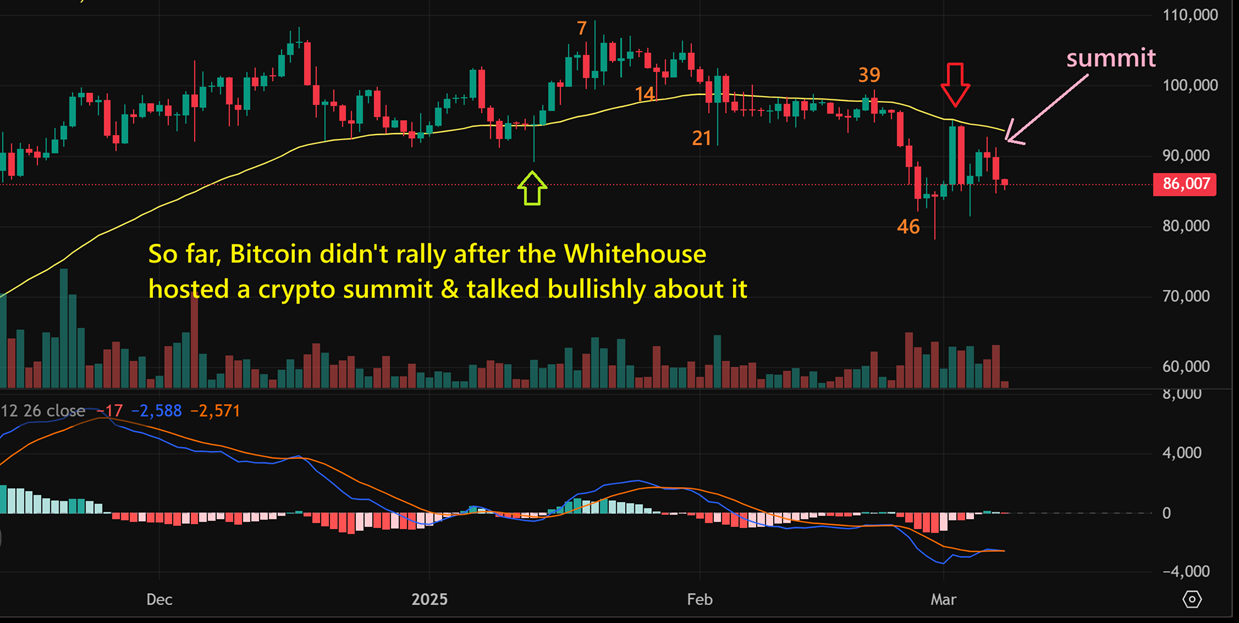
BITCOIN dropped after Trump hosted a Crypto summit at the Whitehouse and is down a little on Saturday as I write. So far, Crypto stocks have been choppy and some are right down at the lows, so being patient is fine. One thing that I do not love is…
.
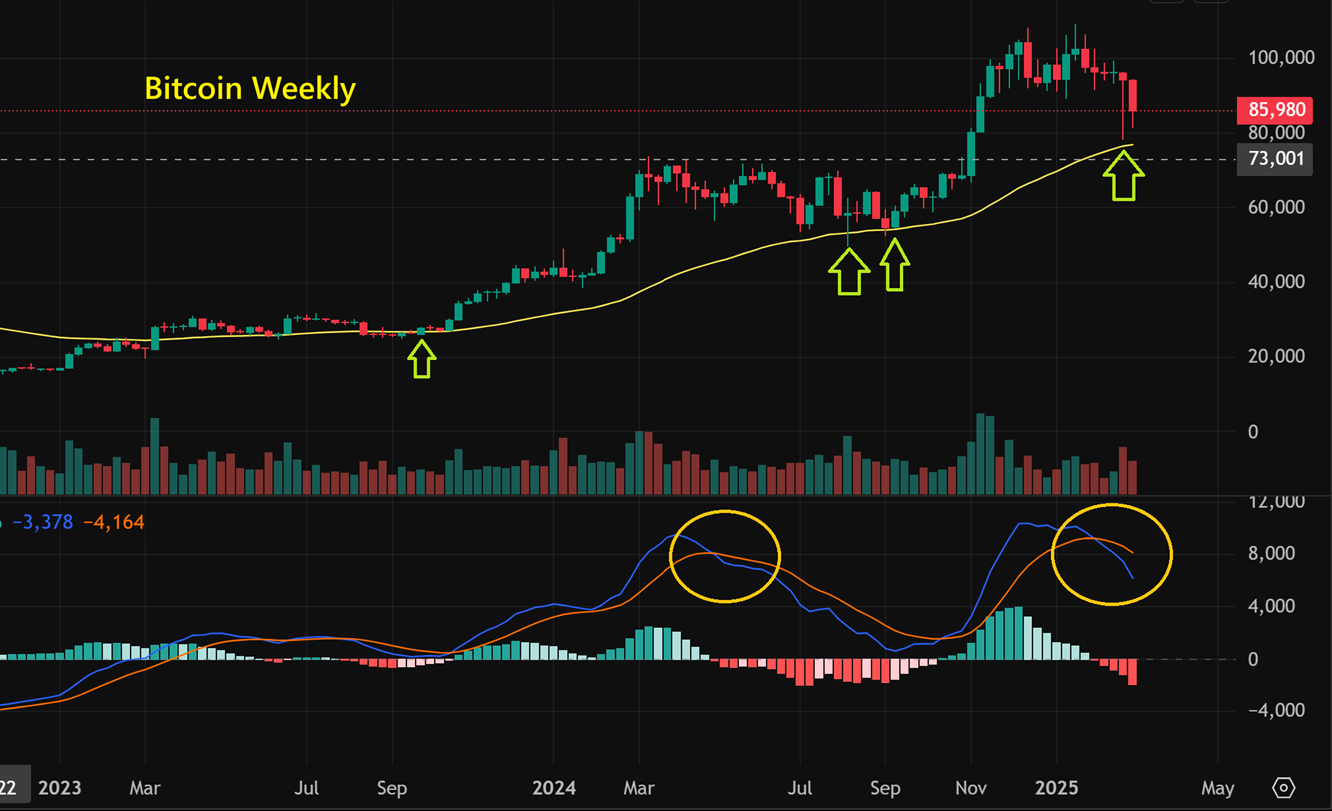
One thing that I do not love is the weekly charts MACD, because I also discussed a possible double top 2 weeks ago. That does still look possible, especially now with this MACD…
.
THE BITCOIN WEEKLY CHART is ‘O.K.’, especially with an ICL due, but that run to $120,000+ may be in jeopardy if we don’t start pushing higher soon. I actually do expect a low in here at any time due to daily cycle count, but if we see a choppy period instead of a rally straight up, it could be disappointing.