March 29th Weekend Report
The selling in the General Markets continued on Friday. I don’t want to give any ‘false hopes’, but I do see some things that could indicate that all is not bad. I want to show you the bullish and bearish possibilities that do still exist, and those are always based on things in the past that are similar and how it can play out. Let’s go to the charts…
.
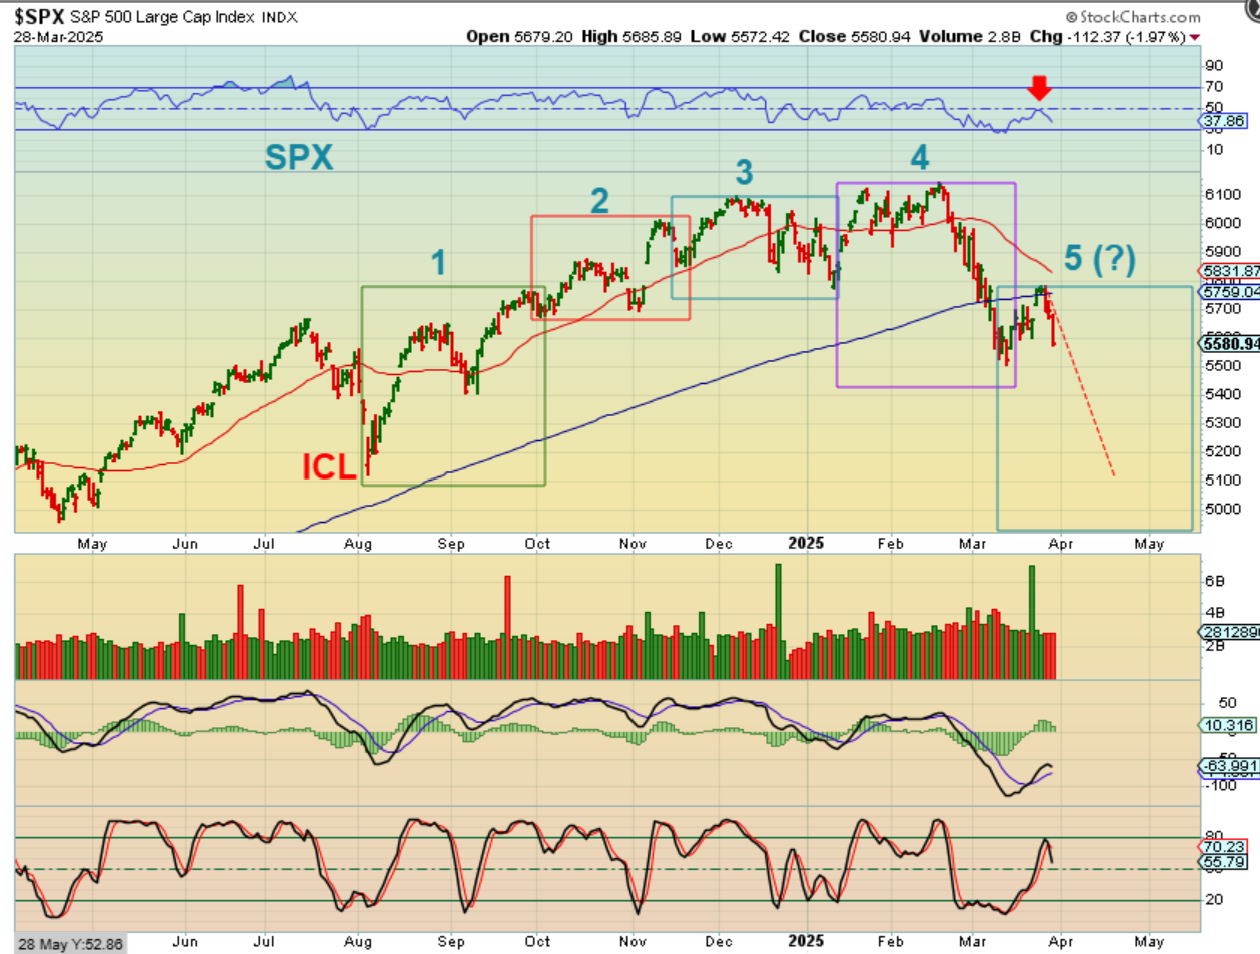
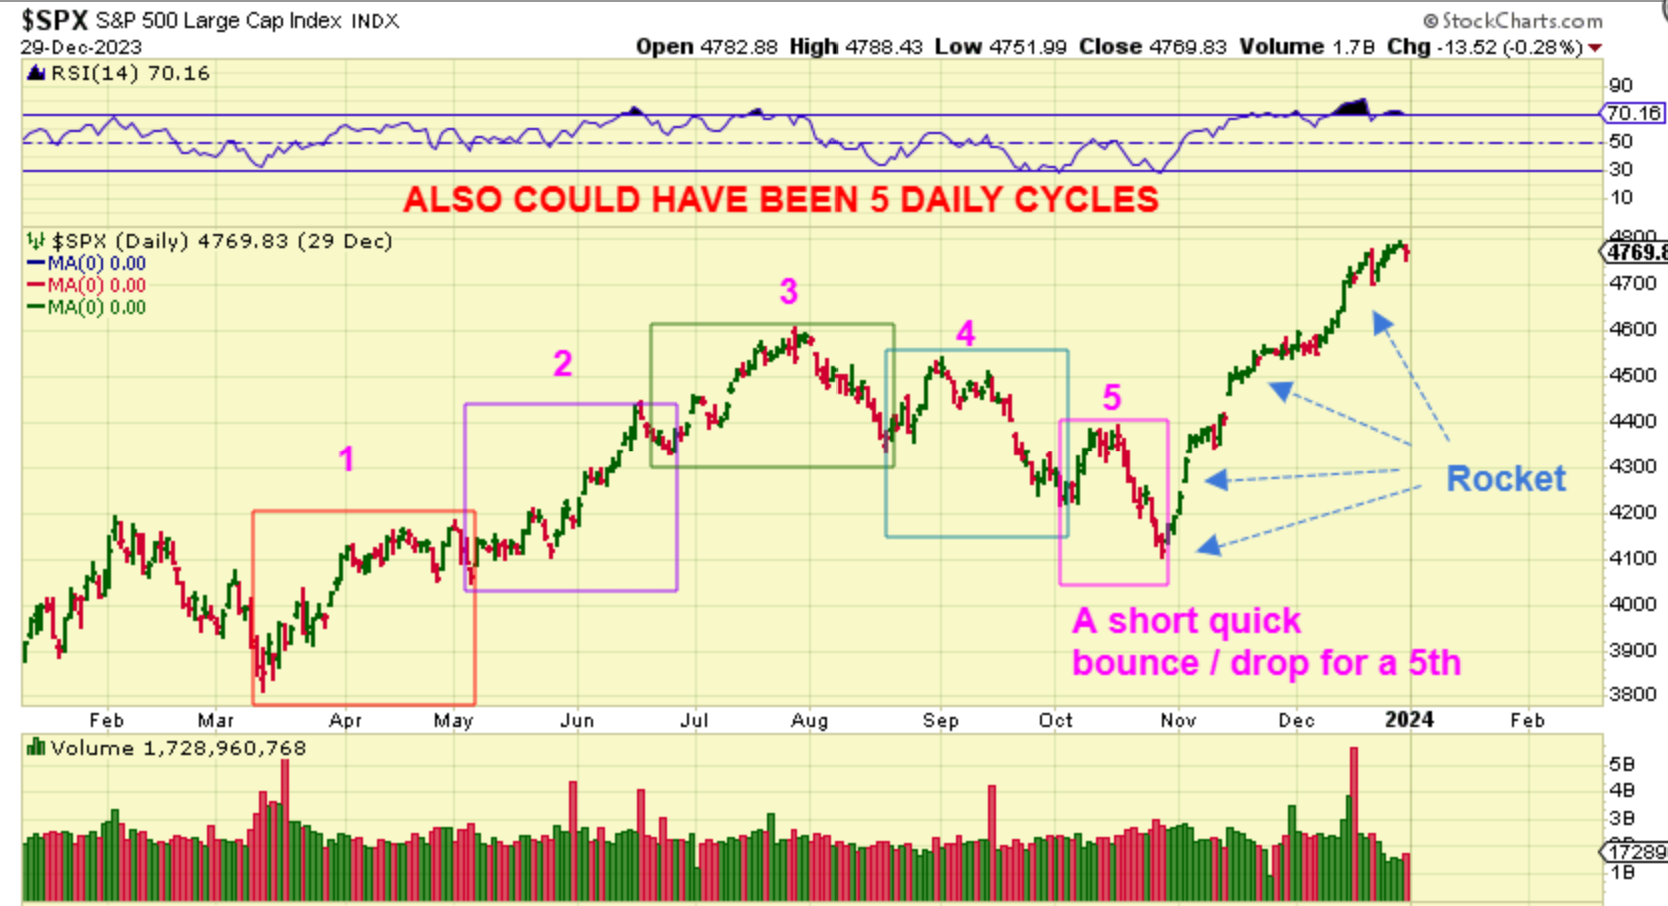
As mentioned in past reports, this is still a possibility for The SPX. I drew a 5th daily cycle as equal to the selling in the 4th daily cycle, but it can be less steep. I’ll show you that later.
.
A possible Bullish view for The SPX?
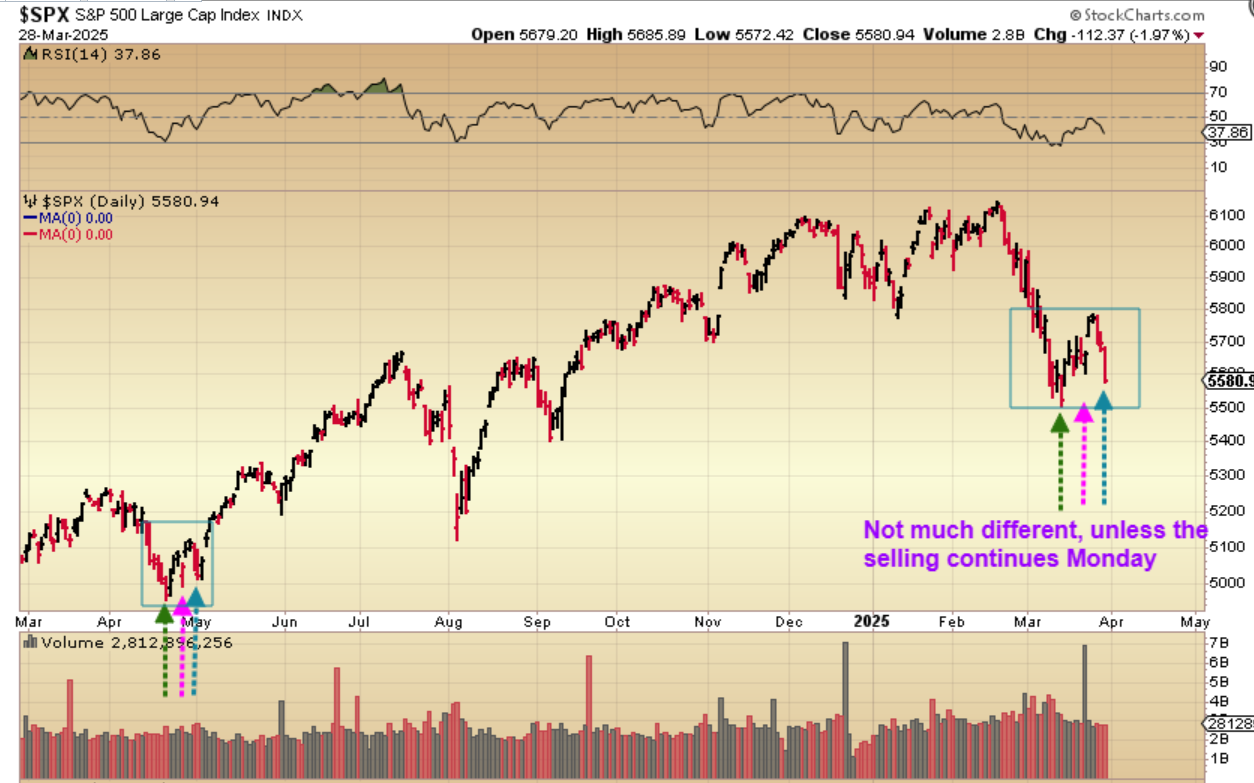
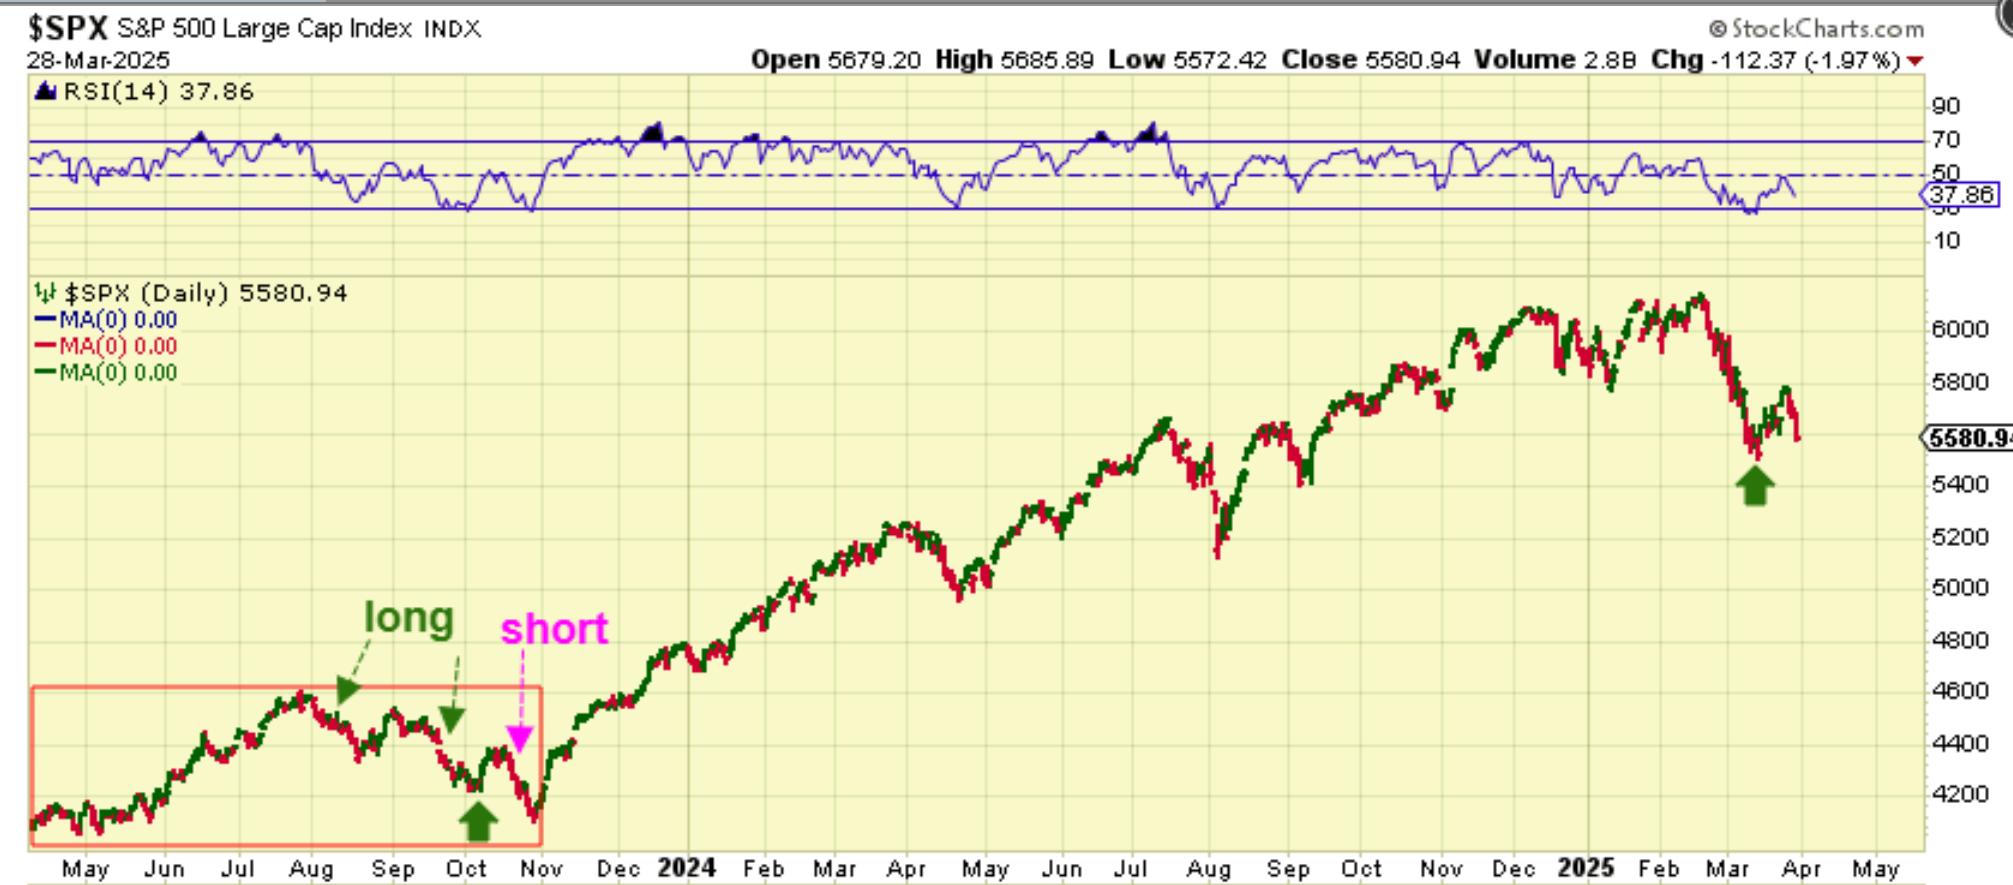
Yes. Even with Fridays big drop, this isn’t entirely different from that 2024 ICL that we were comparing it to. It still looks rather similar. In April-May 2024 sellers finally all got out and then the markets rallied. What if the selling continues on Monday though? Then it starts to become uglier than the 2024 bottoming process.
.
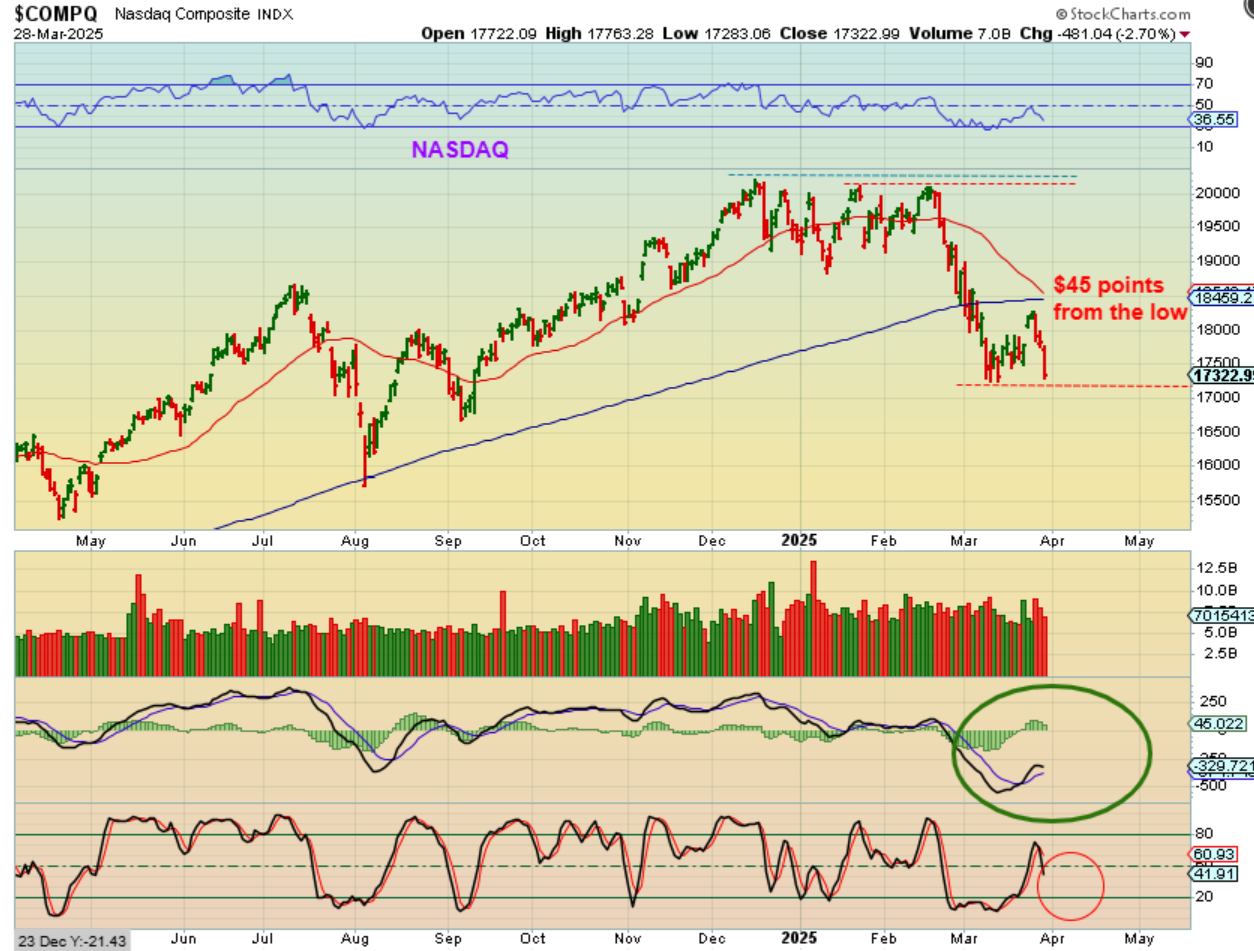
THE NASDAQ is only $45 points from the recent lows, so a reversal higher on Monday is important. The Nasdaq now looks worse than the May 2024 lows. This looks more bearish.
.
Now I want to focus on something else that I noticed, and it was when the SPX had a longer drop into an ICL.
.
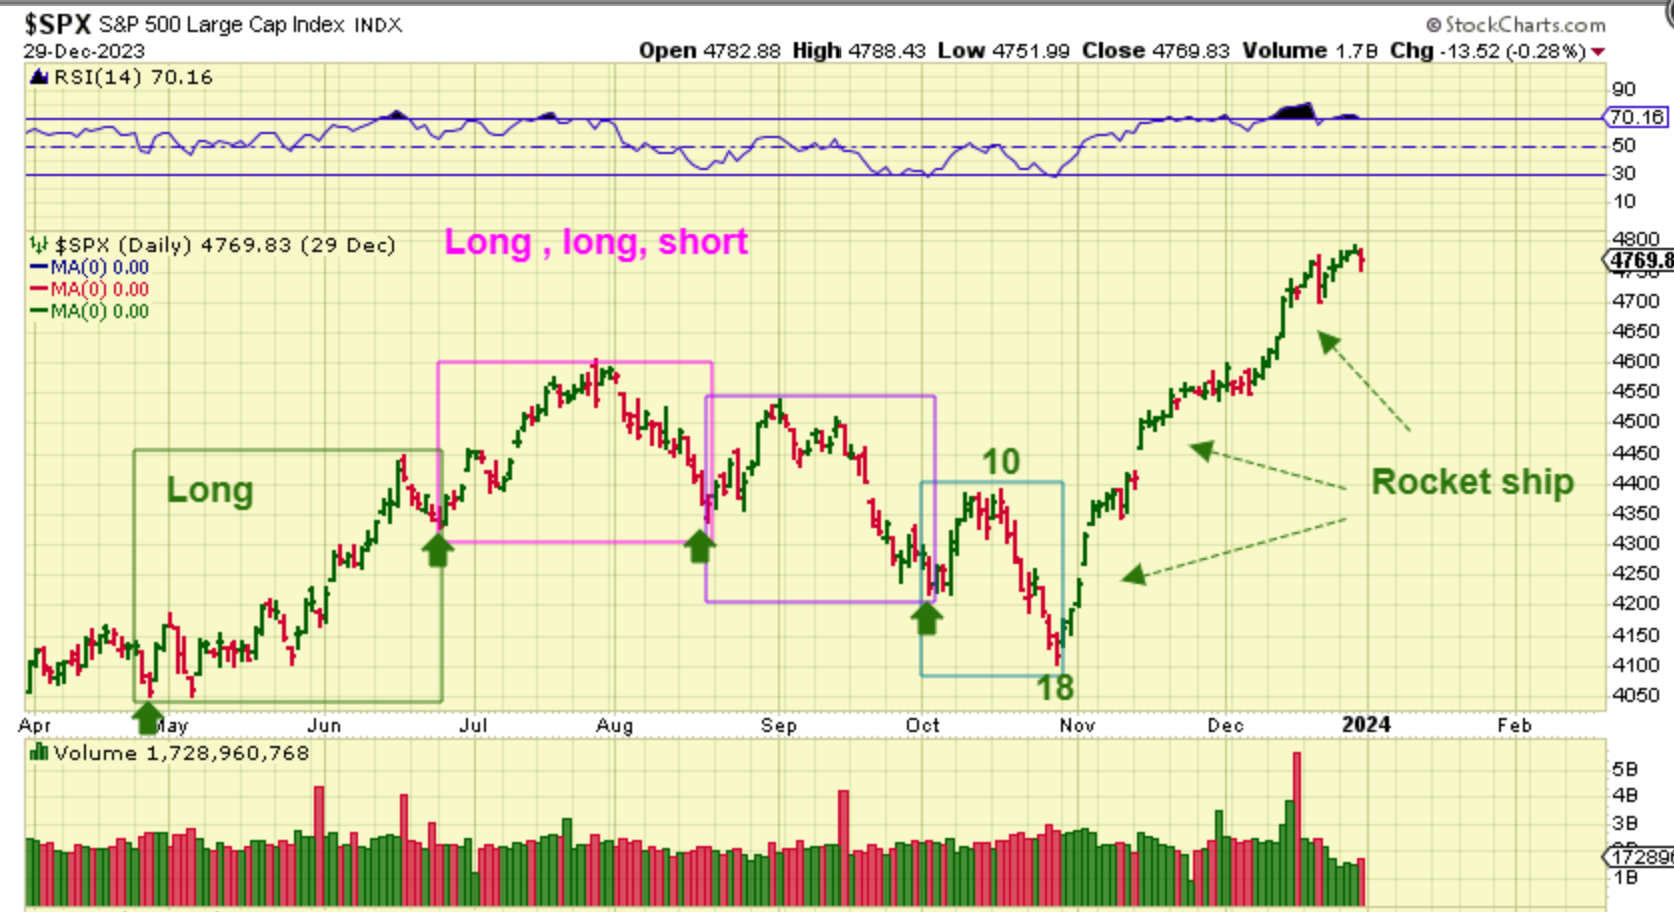
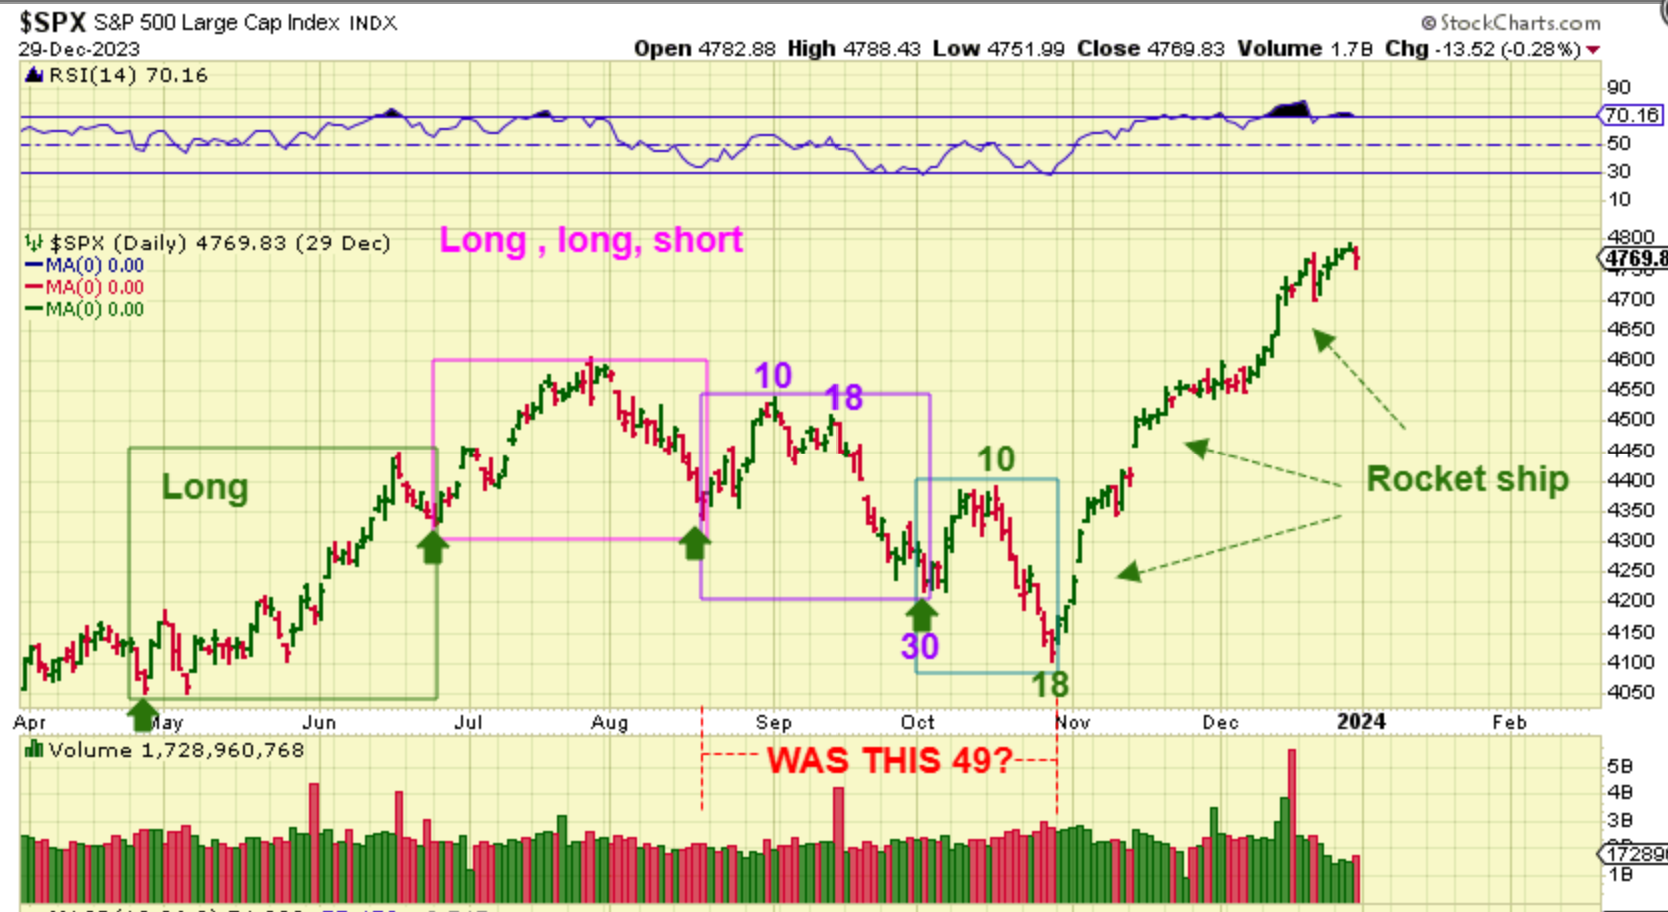
Take a look at the Intermediate cycle that was 32 weeks long in 2023. It dropped, bounced, dropped, bounced, and then dropped again into that ICL.
Here it is on a daily chart. I noticed that these were not equal length daily cycle, but the last one ( a 5th daily cycle) looked very short. That was interesting to me, because we should be on the last (5th) daily cycle now. So let’s zoom in…
.
You can see when we zoom in the 2nd, 3rd, 4th, and 5th daily cycles, that 5th daily cycle is shorter. It was steep, but suddenly the sellers dried up and then what happened? It rocketed higher with that V-Bottom that you have heard me discuss in recent reports…
.
So The SPX 4th daily cycle was 30 days long, and that is normal. The 5th one was really only about half as long, with a short 18 day cycle.
.
Now take a look at the 5 daily cycles from ICL to ICL. I see 4 long daily cycles, and sharp drop in the 5th that would scare anyone away from wanting to buy it, and suddenly that short covering & buying rally that you have heard me talk about. Not many down days in 2 entire months!
.
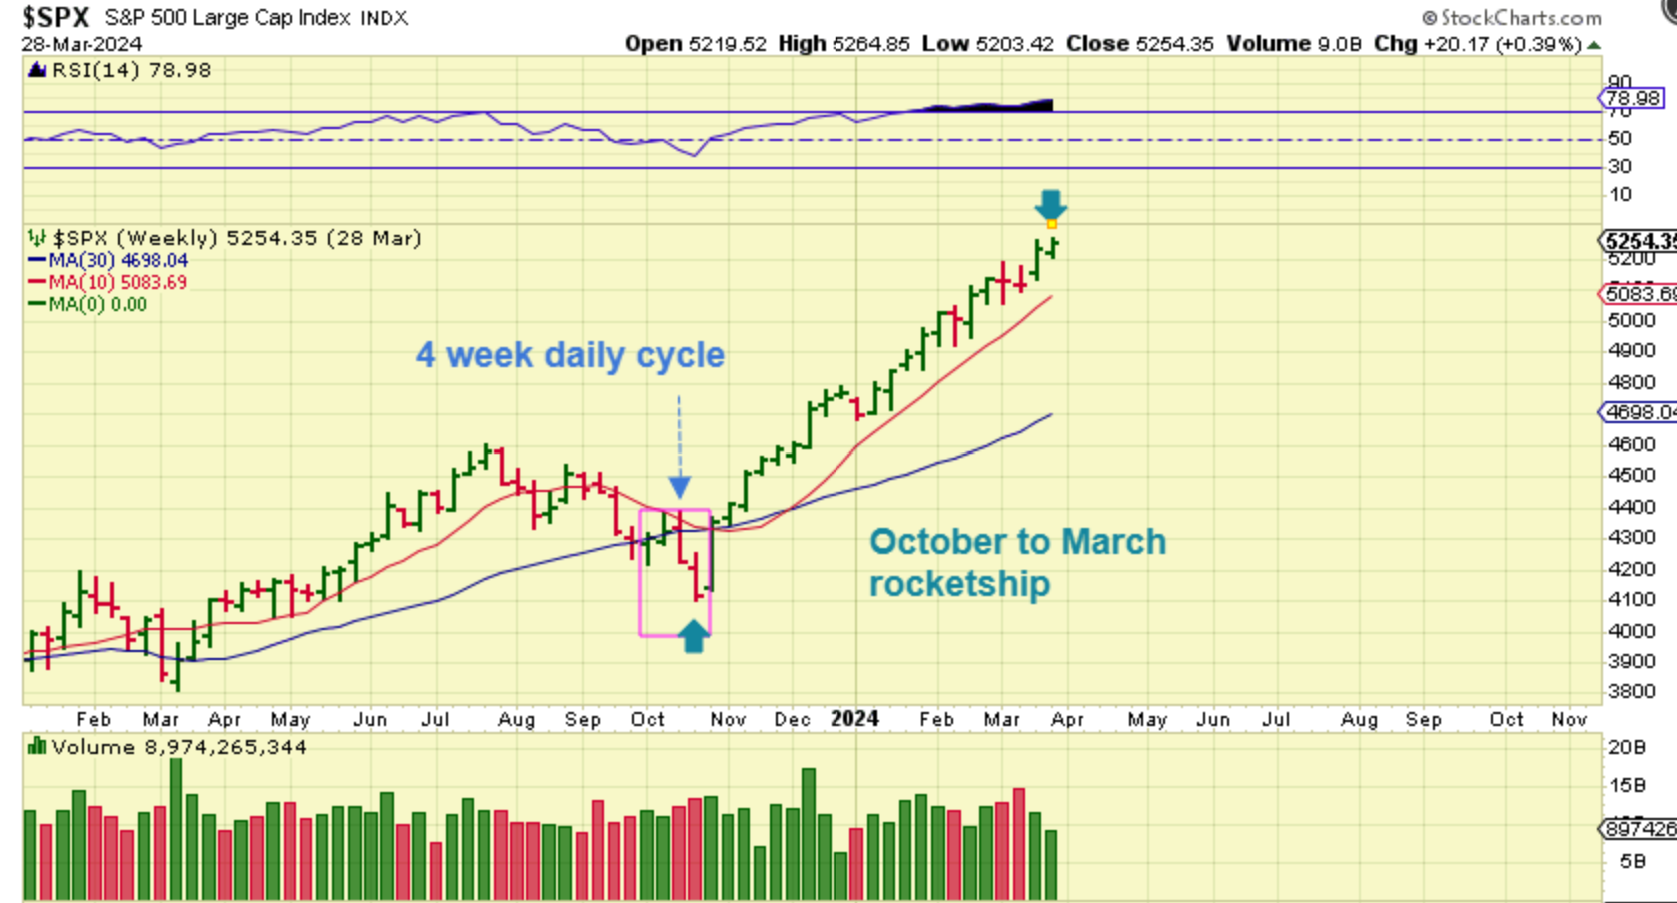
Now we go back to The Weekly SPX. That final daily cycle was only 4 weeks long. That Rocketship higher ran for higher for 5 months!
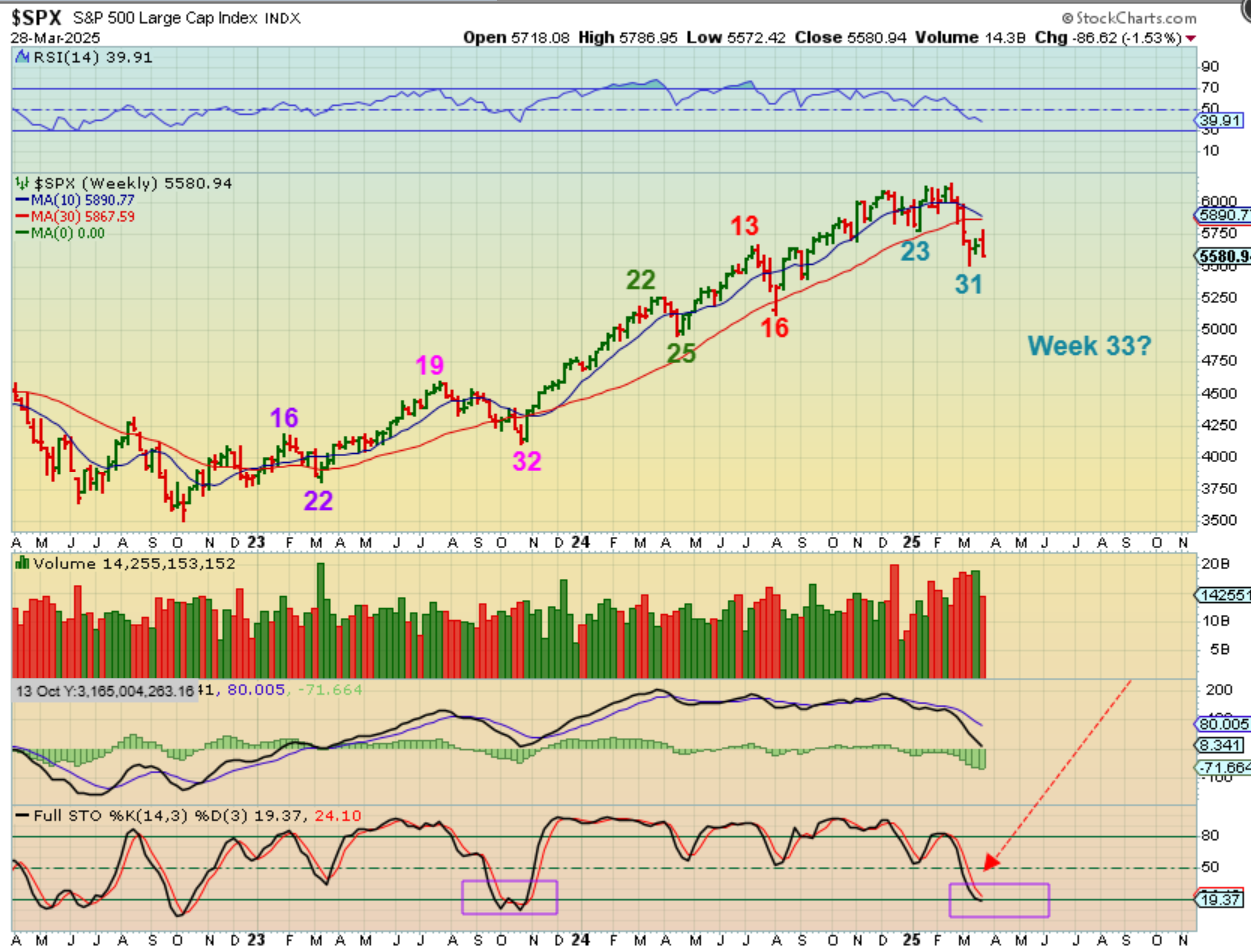
.
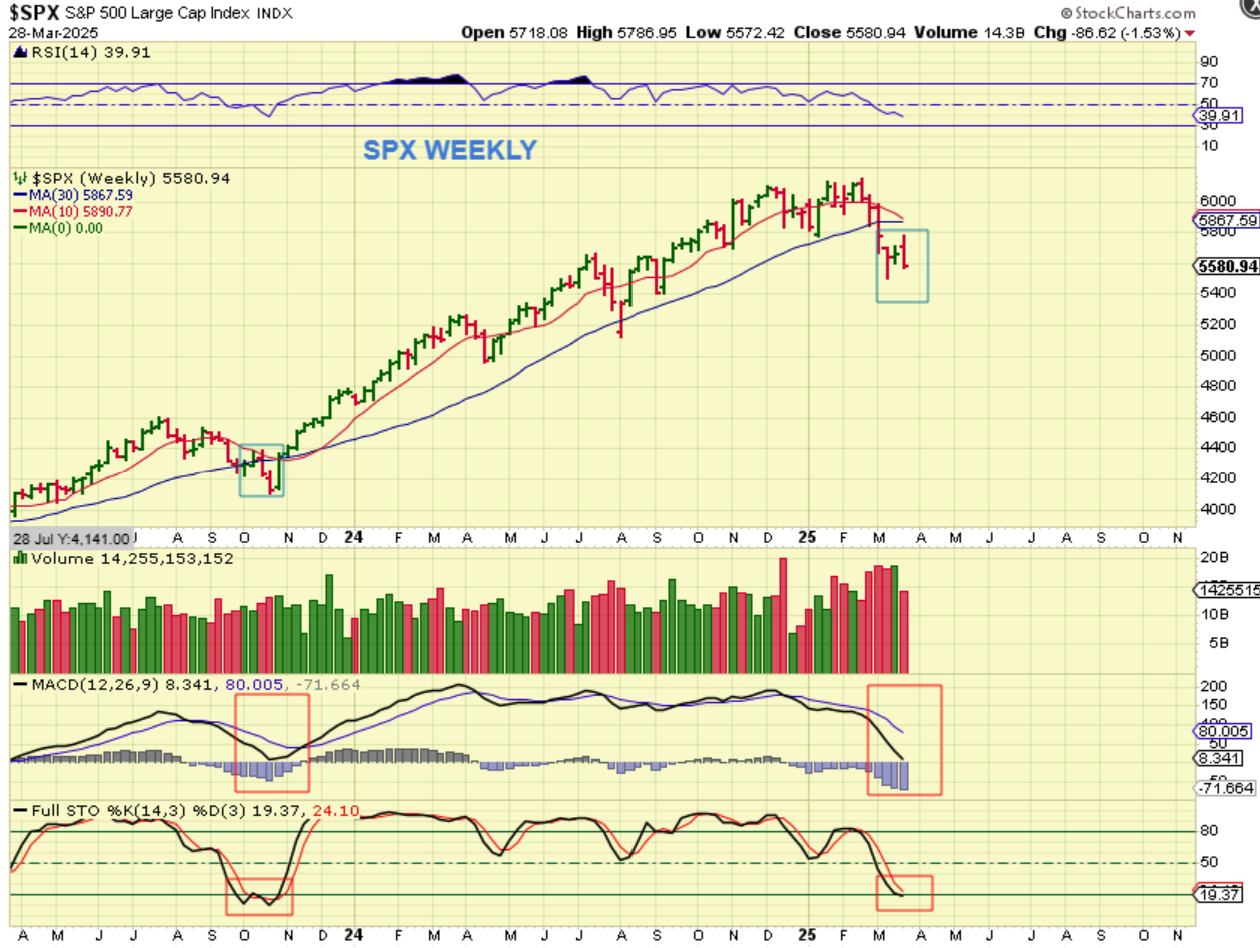
SPX WEEKLY – In 2023, that final square had 4 weekly candles in it before a strong reversal candle. The current one has 3, so could we just see one more slam down, even to new lows, and have the selling dry up? It seems unlikely but it did happen in 2023.
.
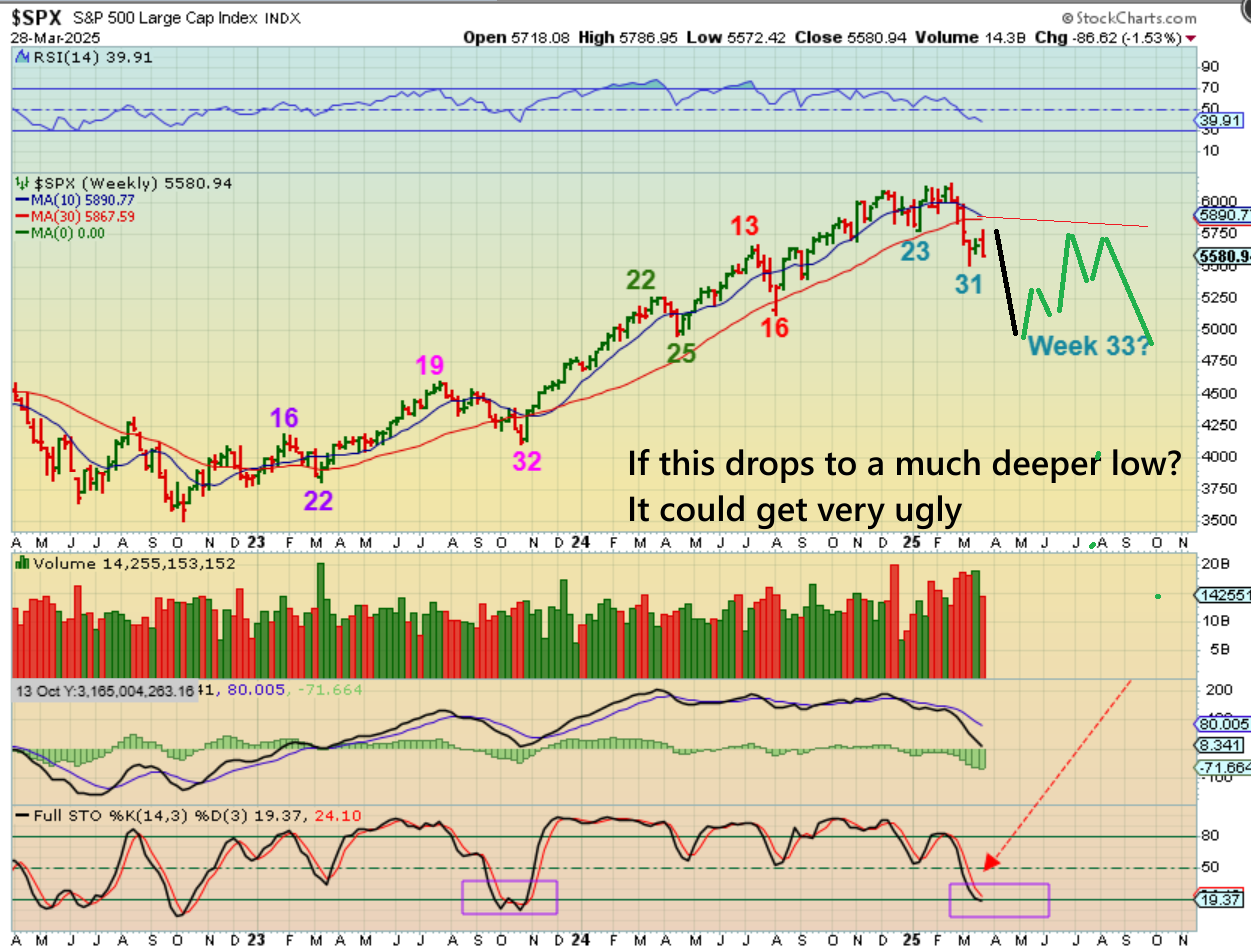
This is the Weekly Intermediate Cycle for The SPX again.
Now what if the selling doesn’t dry up quickly? The stochastics is oversold, but it can go deeper, so let’s just look at that idea…
.
The SPX could crash down similar to the last (4th) daily cycle, so we need to understand that too. That changes the whole bigger picture too.
.
.
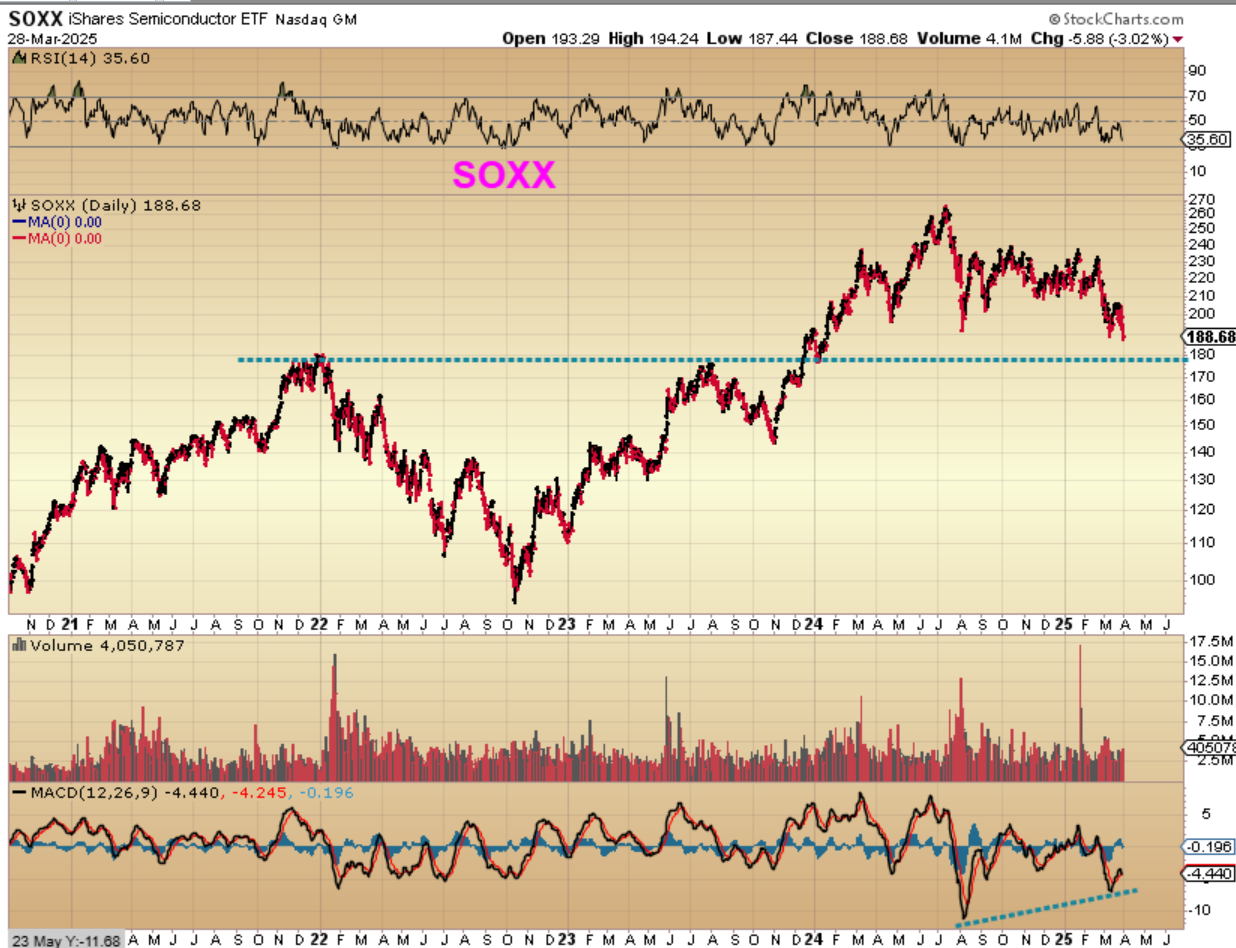
The SOXX could be leading the way. It DID break the prior dcl, so it may drop to the blue support line or even lower.
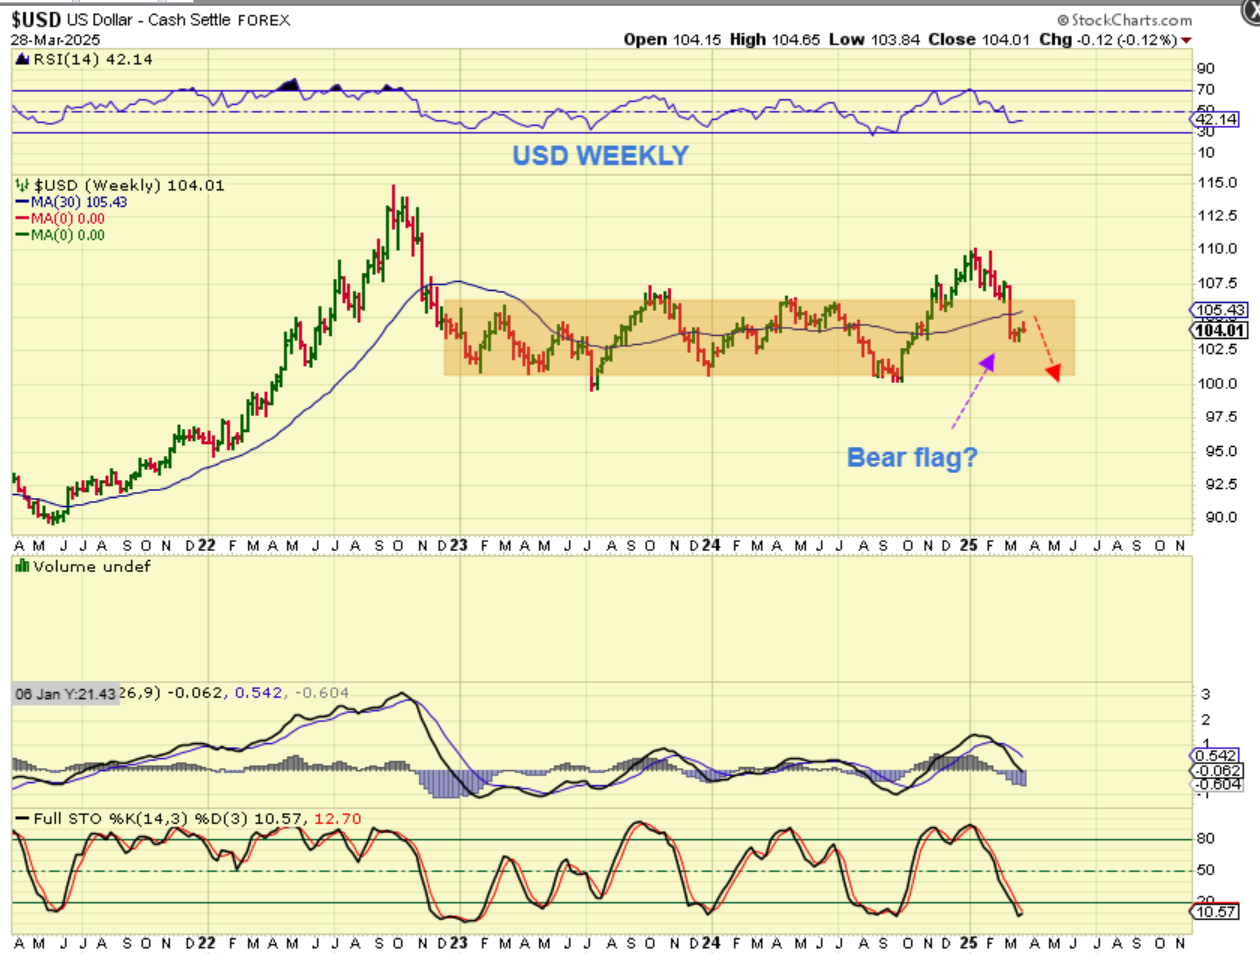
THE USD has been acting as expected for a long time now. I am expecting this to roll over and land back at the lows of the long consolidation.
.
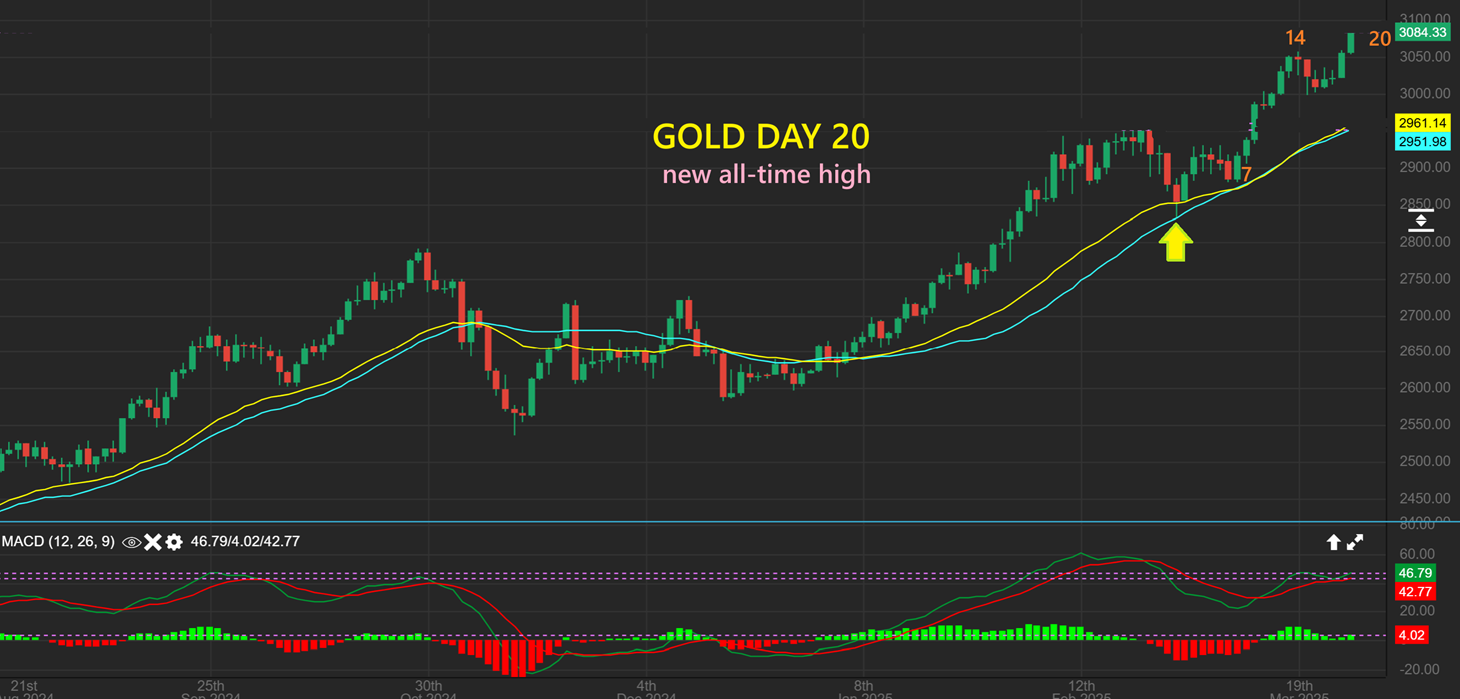
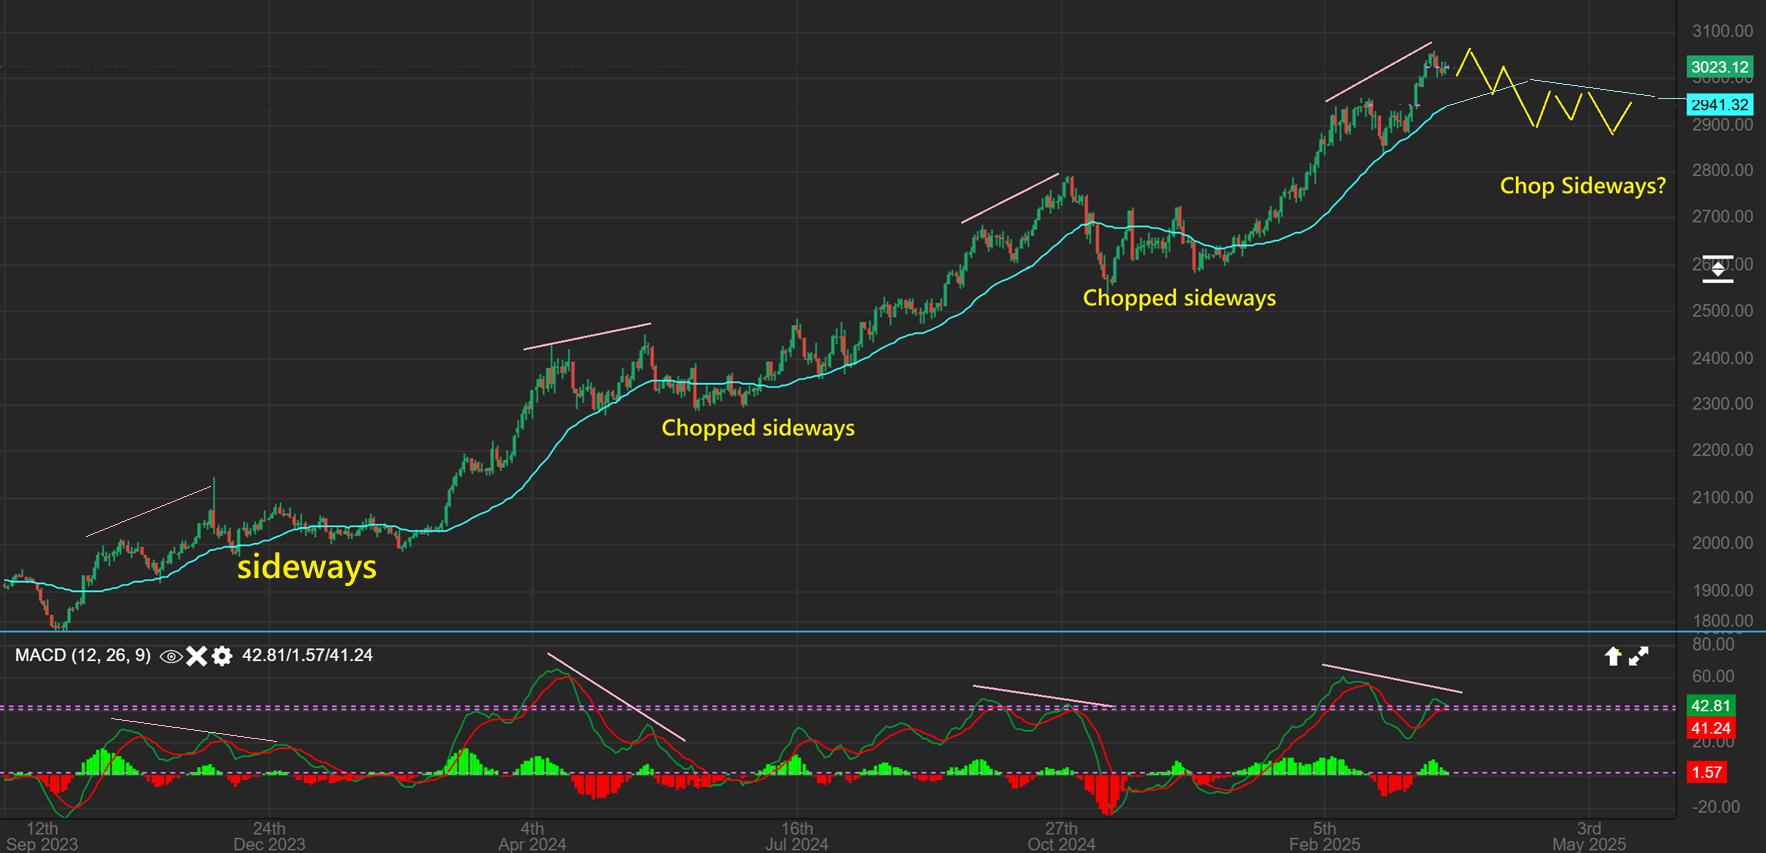
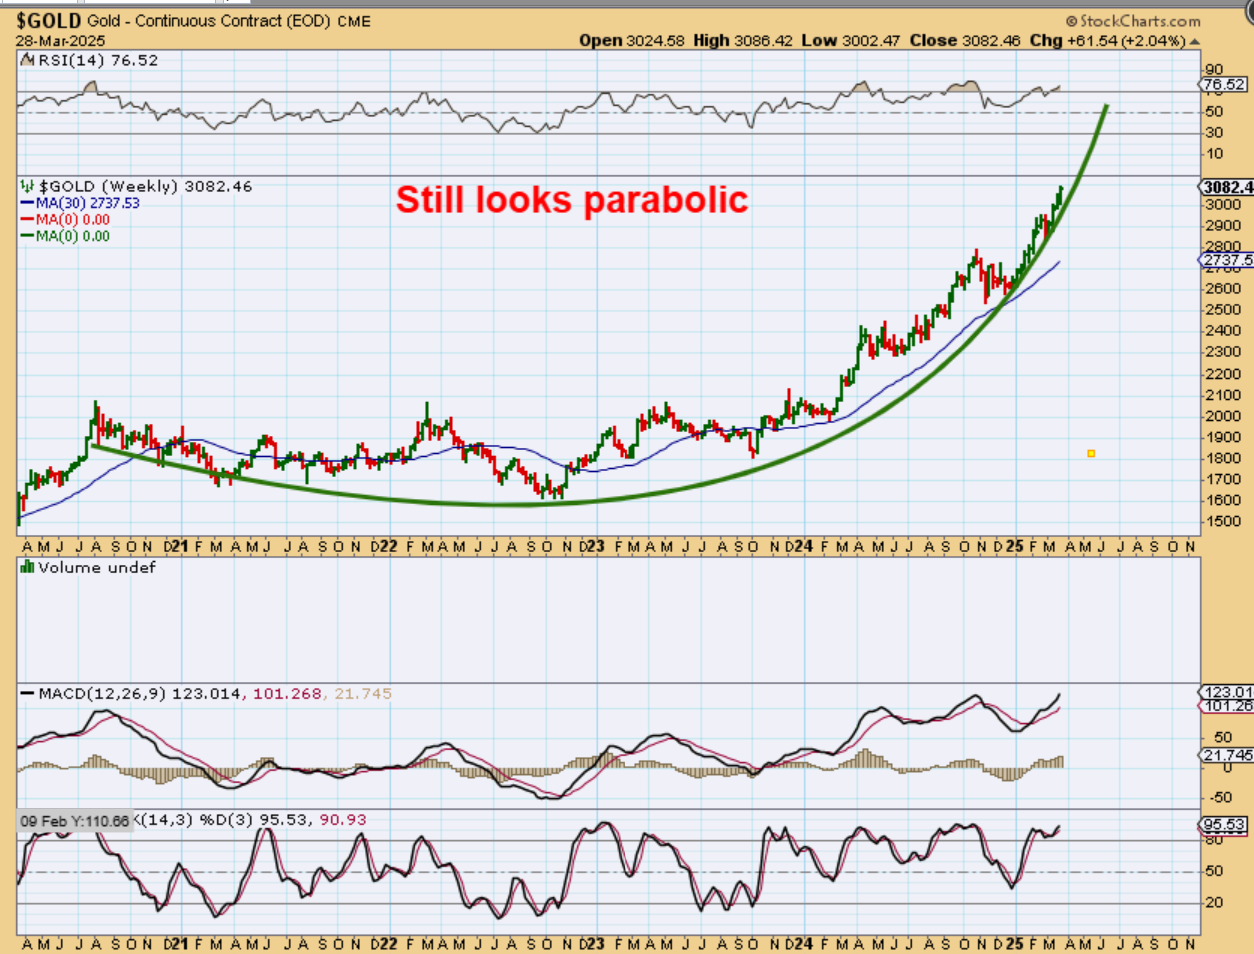
GOLD made another new high on Friday, it has been bullish surprises to the upside for a while now. Last week I pointed out divergences at the new highs, but I said that we could make another new high and then it could be the ‘peak’. I used the following chart to show that…
I used the following chart to show that MACD divergence at new highs. You can see that I drew one more push higher in yellow and then a peak, similar to what we saw at the last peak. Even though this seems likely, I want to mention 1 other thing…
.
Even though this ‘peak’ seems likely, I want to mention 1 other thing. Raise stops and continue to let it ride, because surprises come to the upside in Bull markets and Gold could go parabolic. The MINERS aren’t quite as bullish, but Gold has been strong.
GOLD – The recent run is fairly vertical. If you are in the GLD, you can just raise stops. Parabolic runs defy the normal rules or guidelines.
.
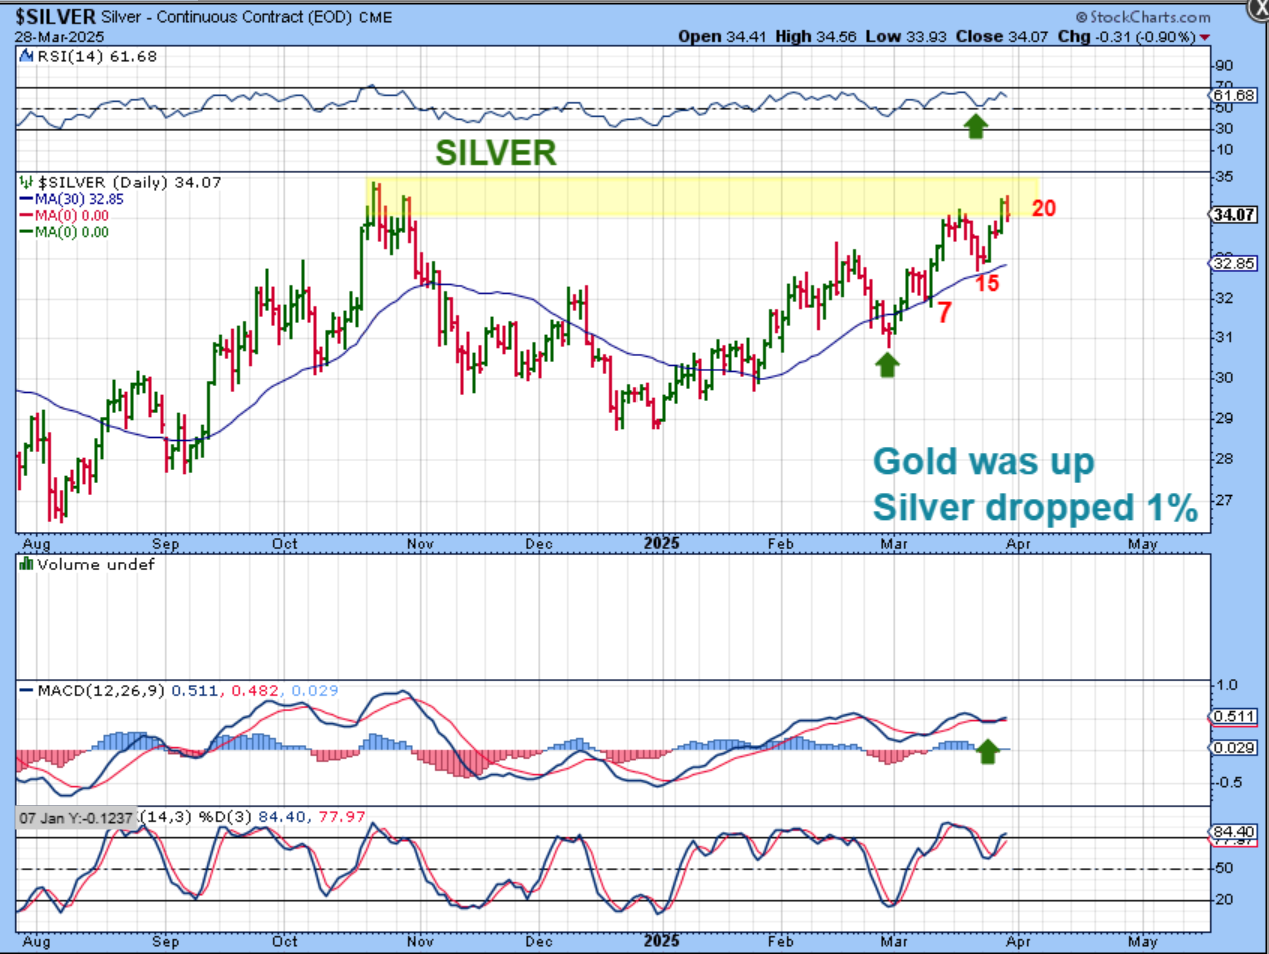
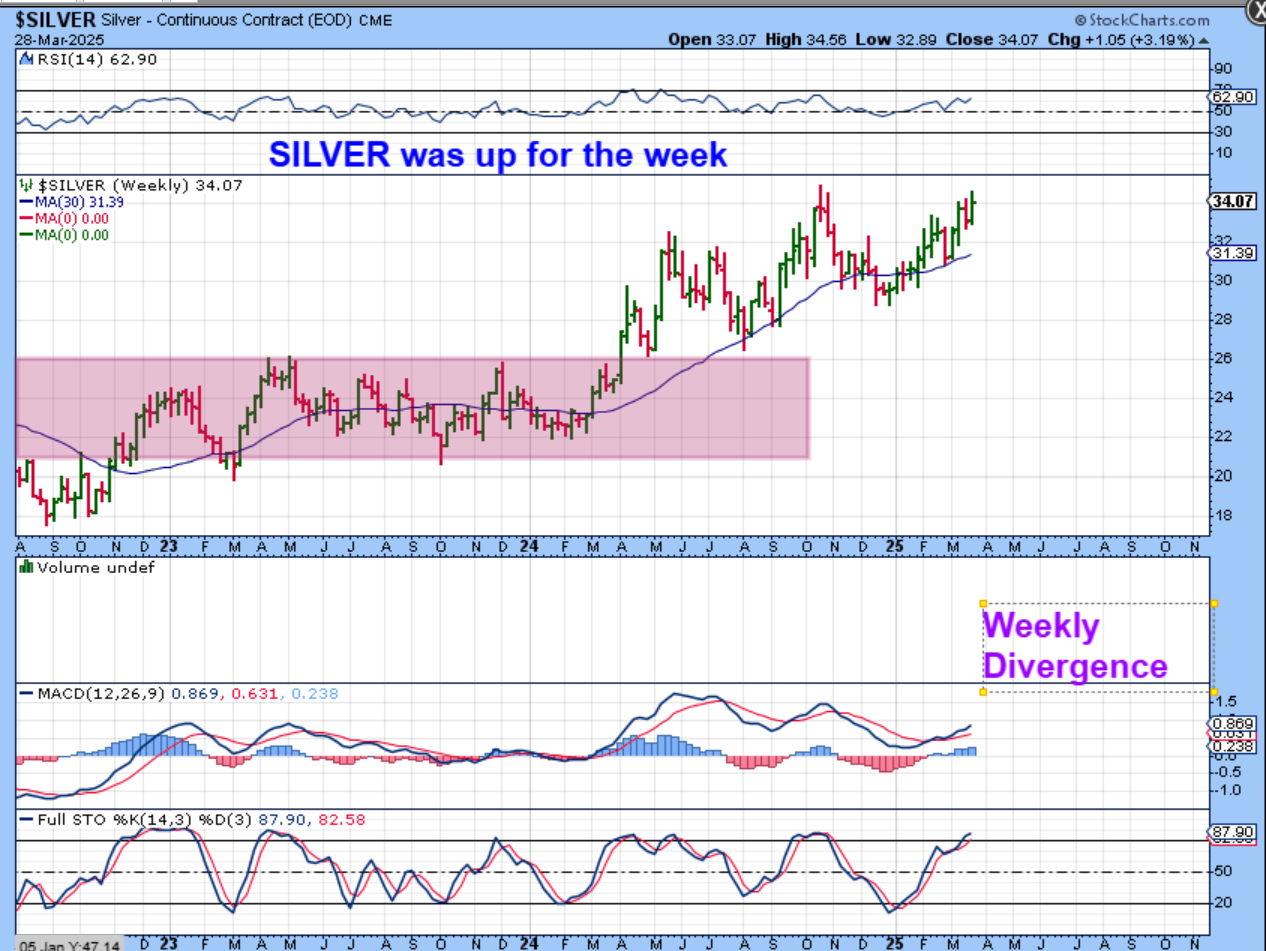
SILVER is definitely not following what Gold has done, but there is the chance that if this intermediate cycle continues to just chop higher and then drop into an ICL in May, then the next intermediate cycle could see Silver outperform Gold. AT this point, it is day 20 and Silver CAN run higher.
.
SILVER was still up 3.19% for the week, even though it didn’t hold the highs like Gold did.
.
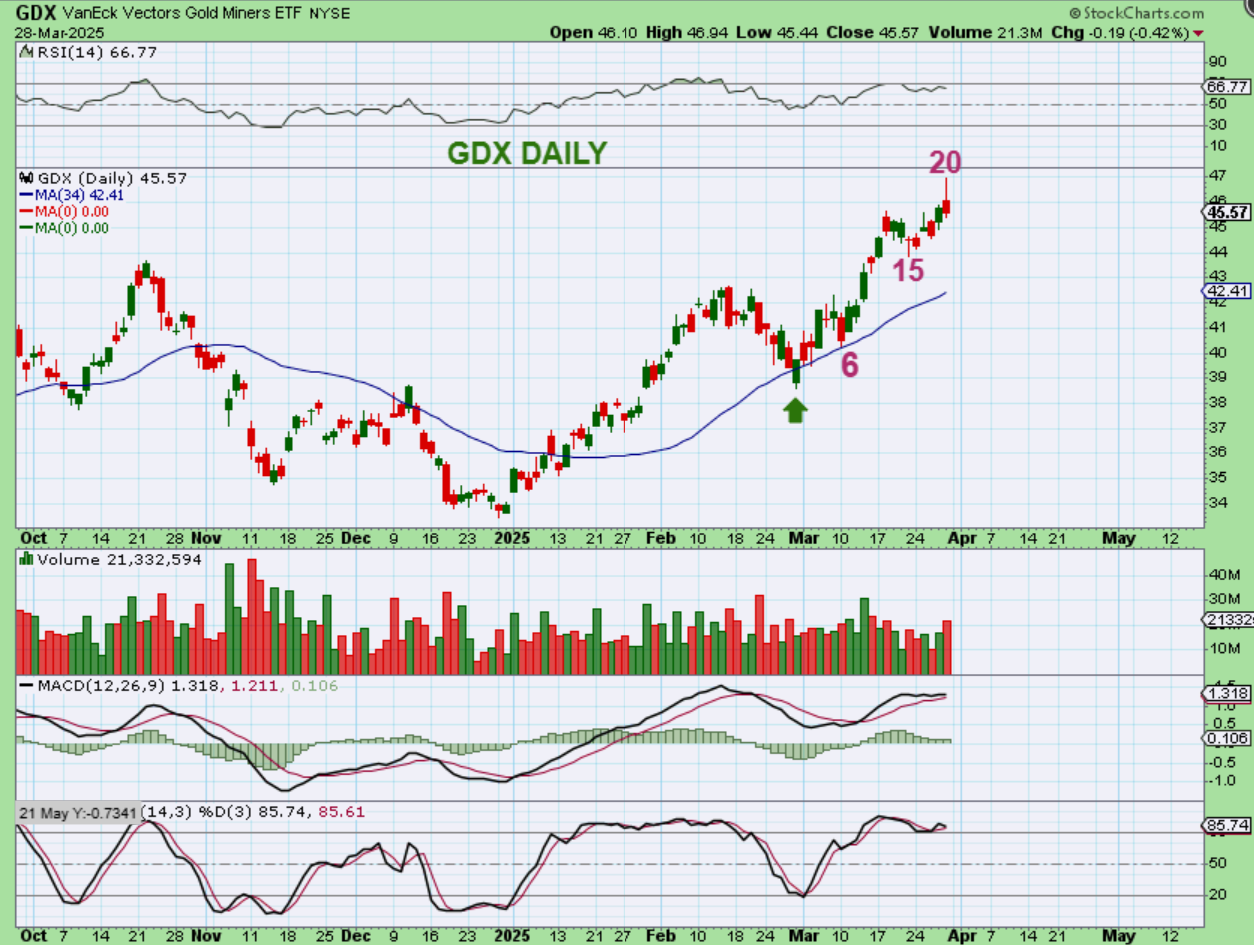
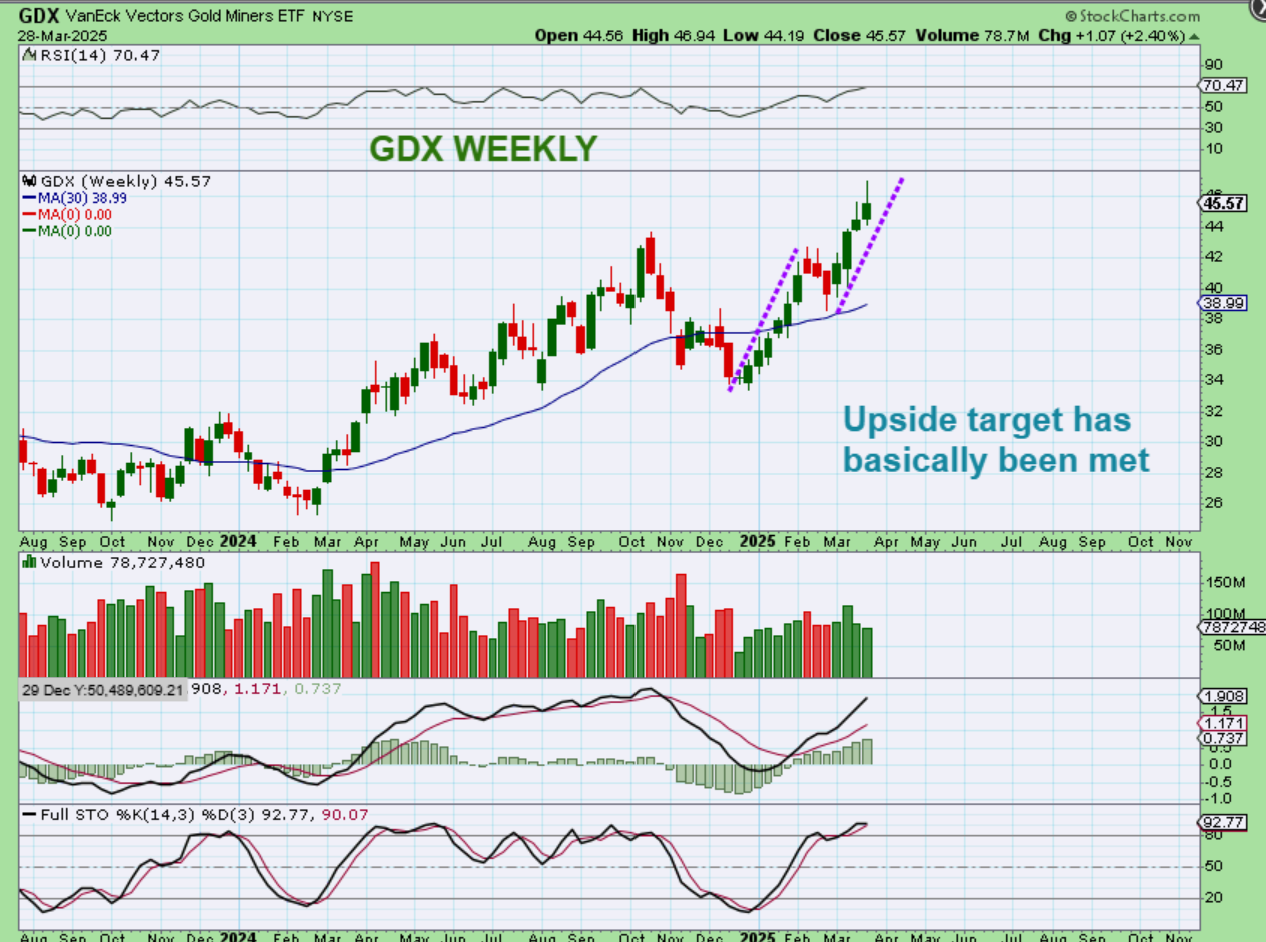
GDX popped on day 20, but it also couldn’t hold on to the highs. Let’s take note that Miners are NOT following the general markets. If they were, they’d be breaking down to new lows. Miners have peaked on day 20 so far, and is back at the 2020 prices…
.
In fact, the upside target for GDX has pretty much been met. It might be just slightly shy of that target, but this also can continue higher.
.
So the selling Friday was quite sharp and Fridays inflation data is taking the blame. The lows are not taken out yet for the SPX & NASDAQ, but the SOXX did break its prior lows. Is it telling us that the markets will drop further? It could be. For now, this can still go either way, but I also reviewed with you the 5 daily cycle drop in 2023. I pointed out that the final selling was steep, sharp, but short lived and was followed by a v-bottom rocket higher. We’ll just have to see how this plays out. I don’t want to give us a false hope, we could be heading into a very long correction, but if this is a 5th daily cycle and the weekly stochastics is oversold, we should see a rally out of an ICL soon. The precious metals sector remains bullish and at the highs. If the markets go into a prolonged correction, the precious metals could continue a prolonged bull run to $4,000 or $5000 after the next ICL. That ICL is a strong buy, and hopefully Silver takes off and takes the lead by then. .
.
Even when the markets sell off into ICLs or go into a correction, that usually offers the patient ones a nice low price for the stronger companies that should rally later. GOOG, SOFI, LMND, RKLB, MSFT, AMD, NVDA, NFLX, and others could really go on sale before the next bull run kicks in.
Enjoy your weekend!
.
~ALEX
.
Let’s just keep this simple:
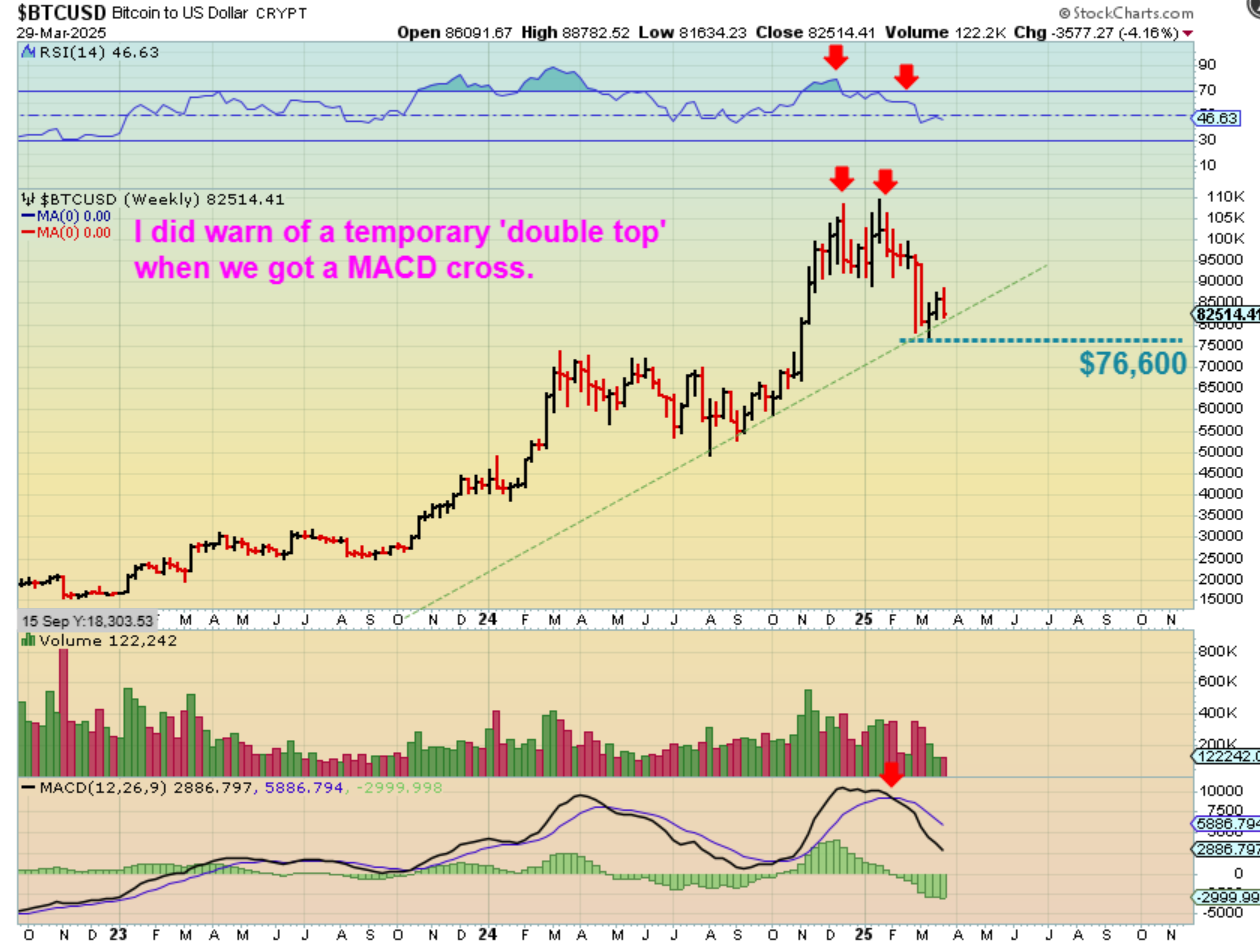
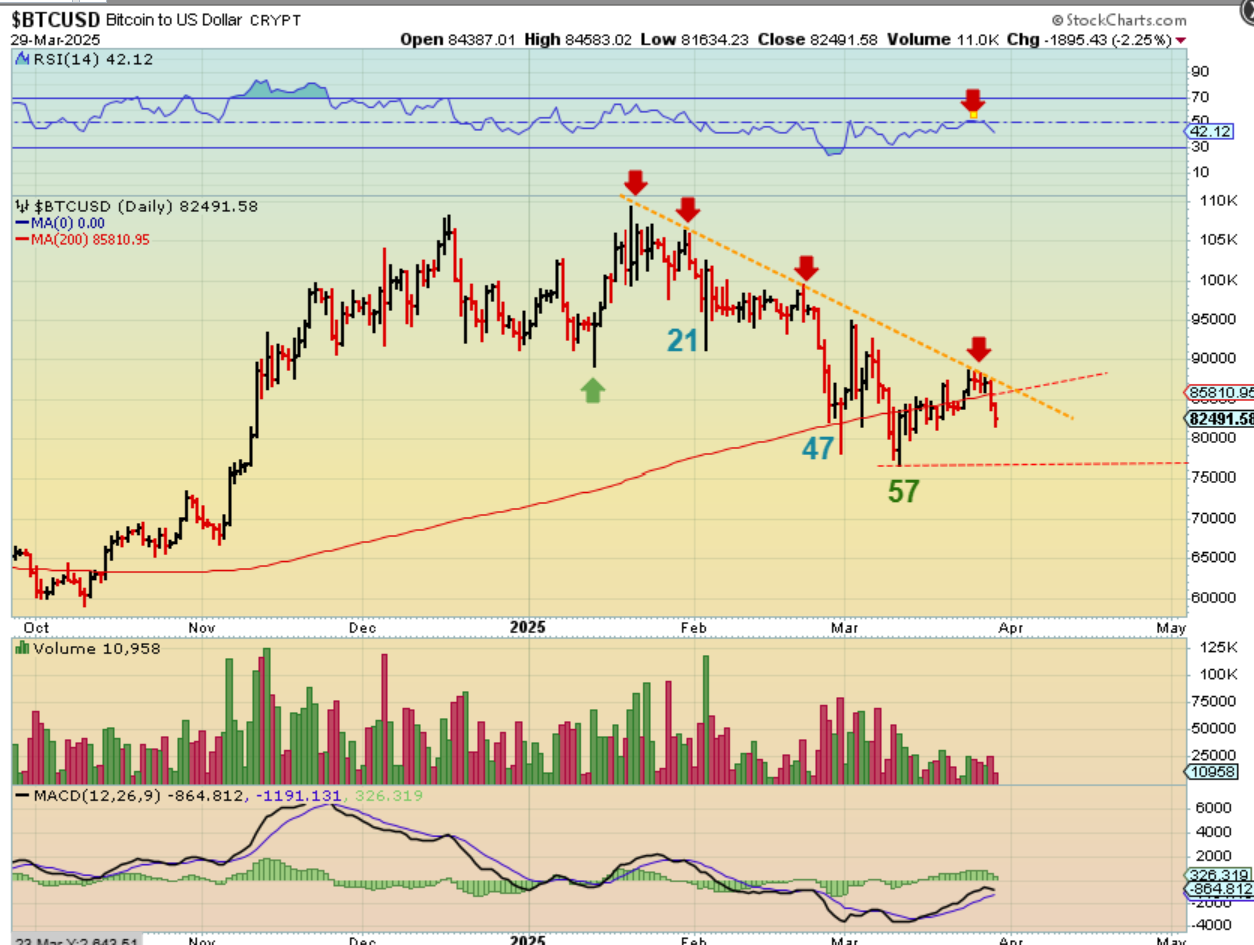
1. BITCOIN is now in a downtrend.
2 It bottomed on day 57 and that is almost perfect, but it has been choppy out of those lows.
3. Bitcoin gained the 200sma and 20 ema, that was good, but now it lost both and we need to be very careful with this selling. A break of day 57 is an early failure and we’d have a lot of time for this to sell off.
.
Bitcoin Weekly:
I warned of that double top early in 2024, but after bottoming on day 57, we then had the hope of rallying strongly to new all-time highs. This move is not really different from any of the other moves out of the ICL, so we just need more time, but we do NOT want to see that $76.600 taken out. That would be a failure and could lead to a serios sell off. We all know how serious the selling can get with Bitcoin, so hopefully this just continues to move higher. We do have plenty of time for that.