March 1st Weekend Report – Early Reversals?
The SPX and The Nasdaq are looking quite different as of Friday, but they do both look as though they may have capitulated and put in a low, so let’s take a look.
.
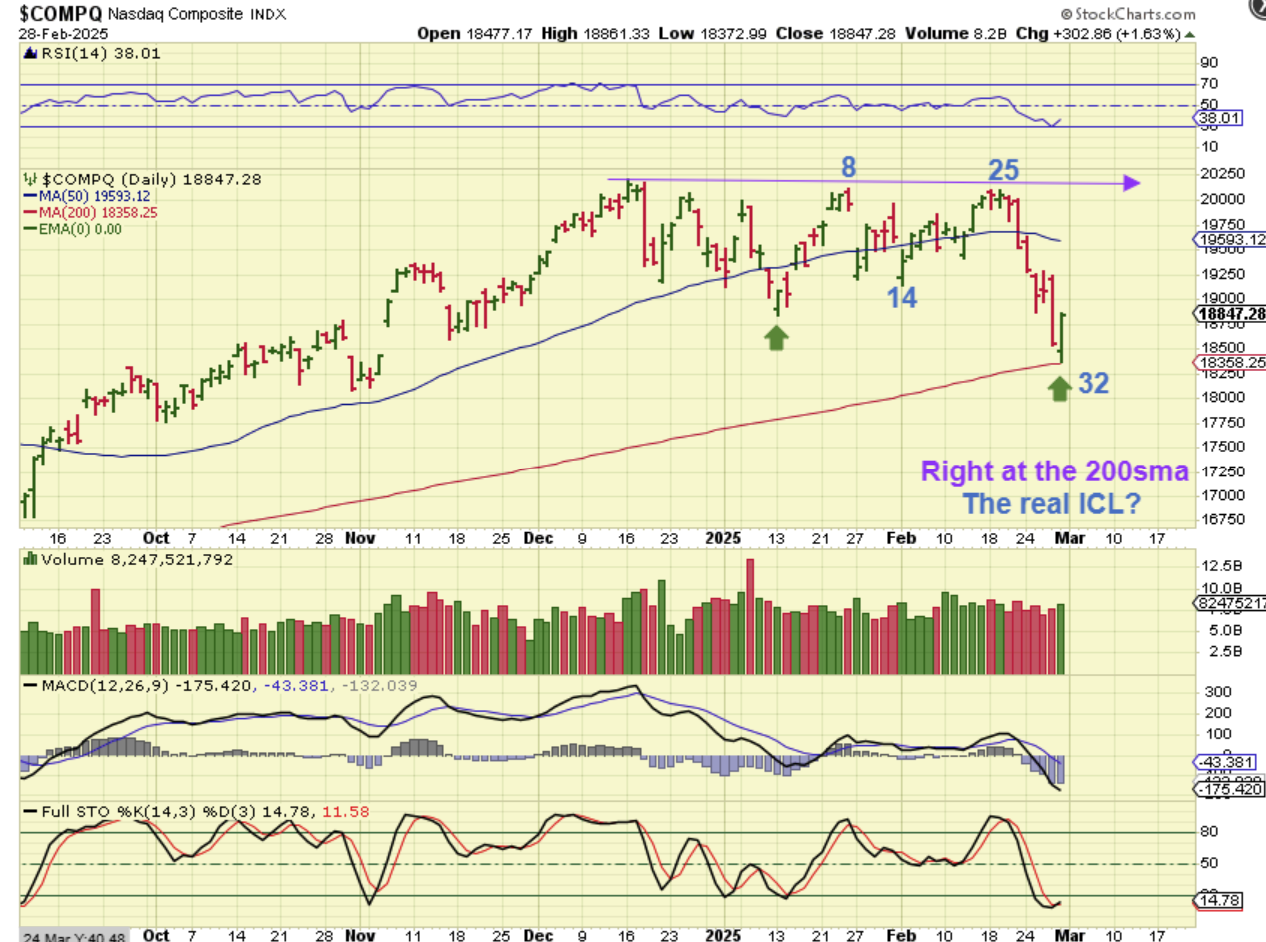
Notice that The NASDAQ broke below the last dcl (green arrow), indicating that this would be the ICL. Price reversed right at the 200sma, and that is within the timing for a dcl at day 32. So for the NASDAQ, this looks like an ICL if it runs higher.
.
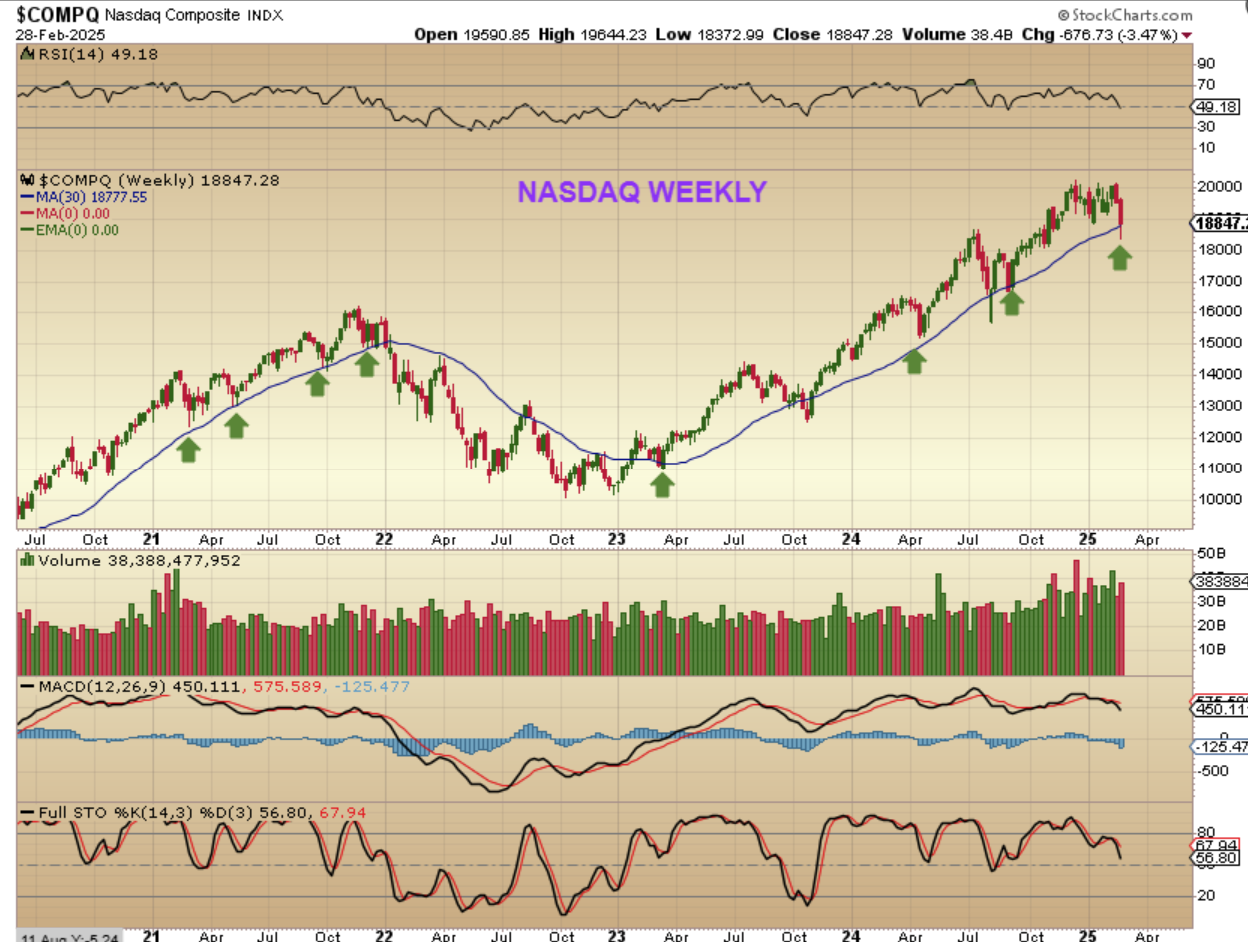
The NASDAQ WEEKLY dropped and reversed at the 30 week ma, which is normal price action in a Bull Market.
.
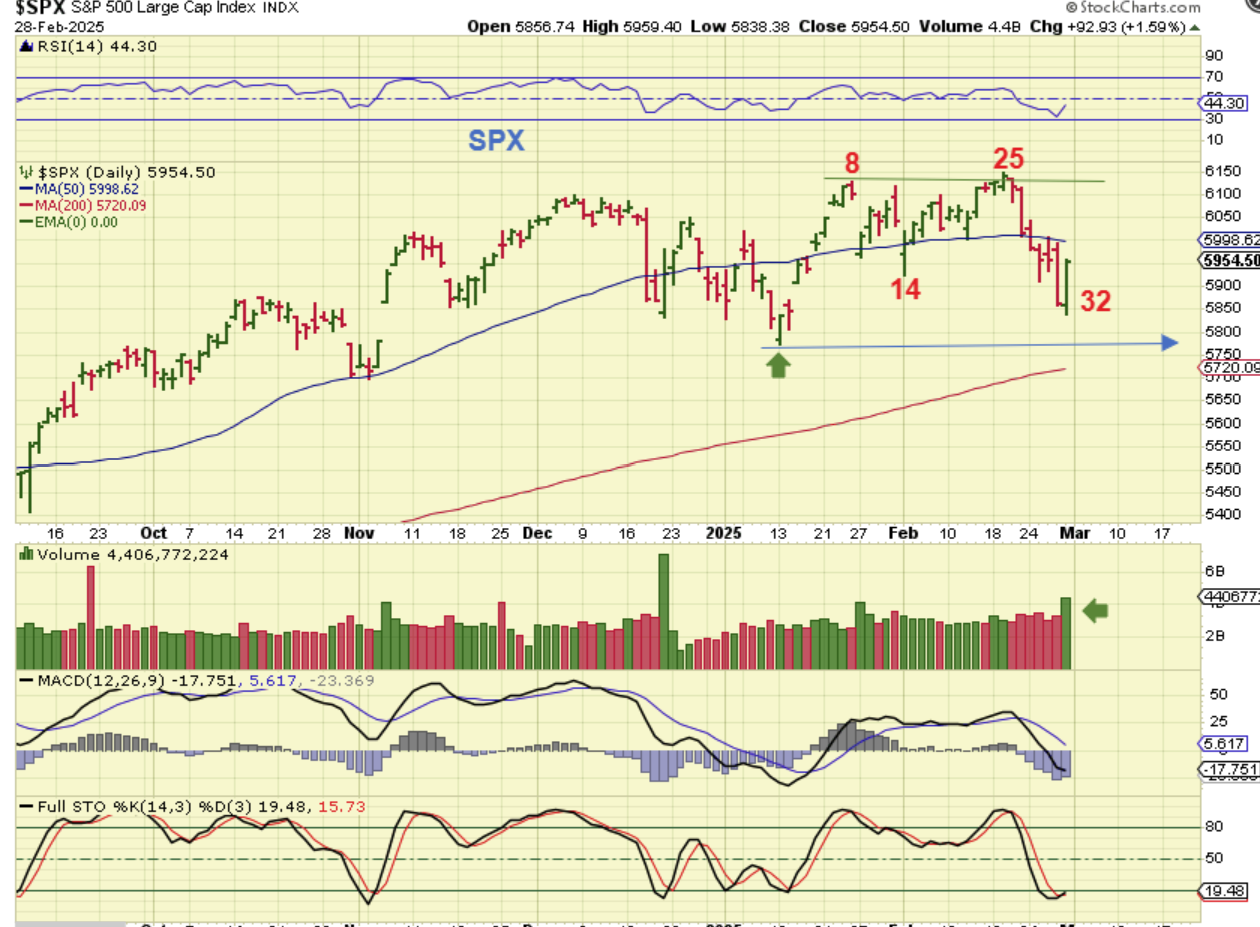
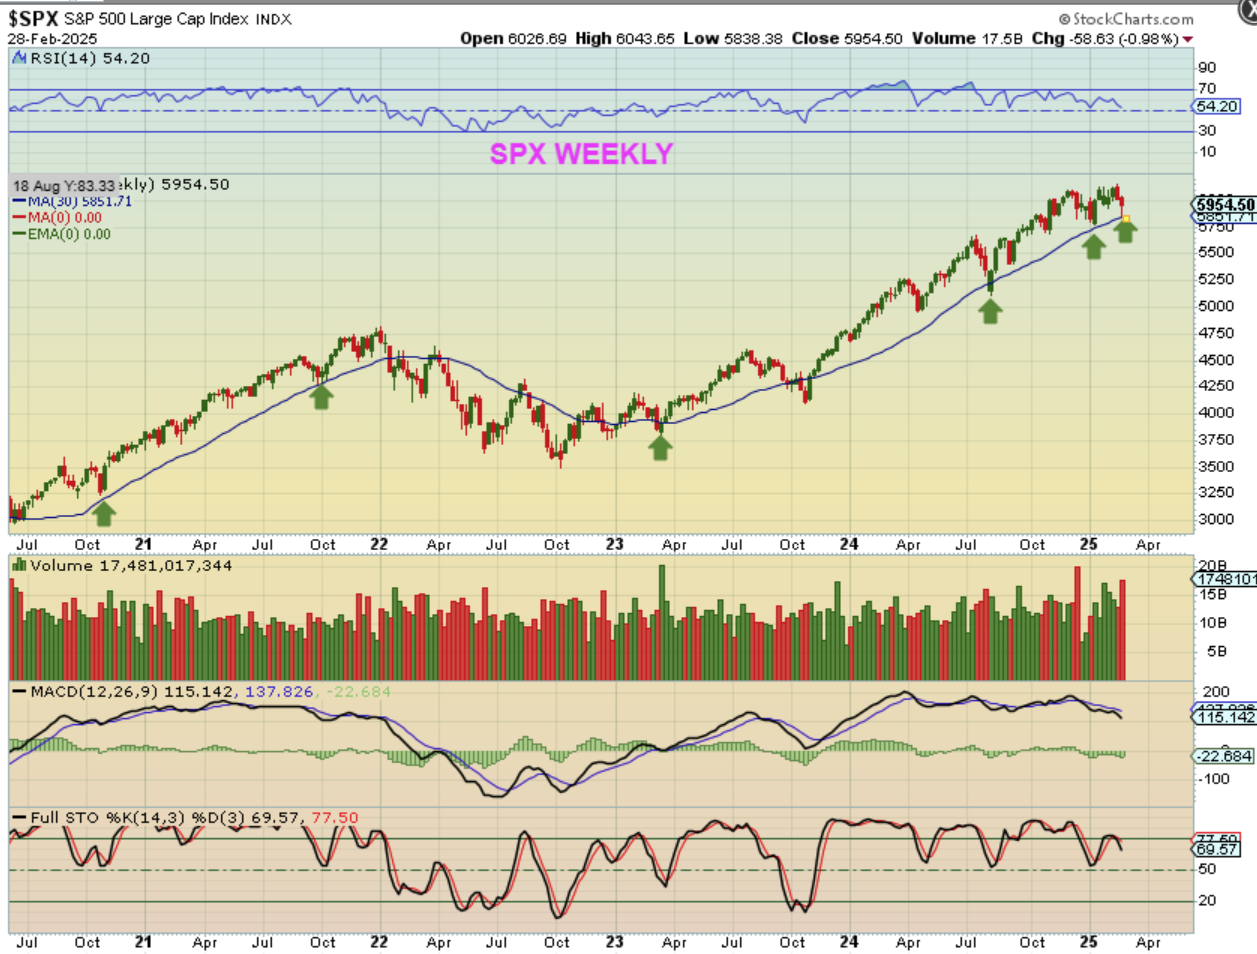
But now look at The SPX: It is quite different than the Nasdaq.
.
The SPX actually did NOT break the prior lows, but it did also put in a strong reversal at day 32 too. If we get follow through higher, this would be implying that the ICL is still where it was marked in early January, when it went on to make a new high on day 25. Strange! We would probably go by the SPX and assume that the NASDAQ overshot the lows, but we’ll need to see if we get 1 more dip to sync these up or see if they just play out as is.
.
The SPX WEEKLY also bounced right off of the 30 week ma, which is normal bullish price action. The MACD and the RSI are weakening as price was rising. With all of the chop, uncertainty, and indecision, that is a bit concerning and we’ll keep an eye on that. It can change if things strengthen up.
.
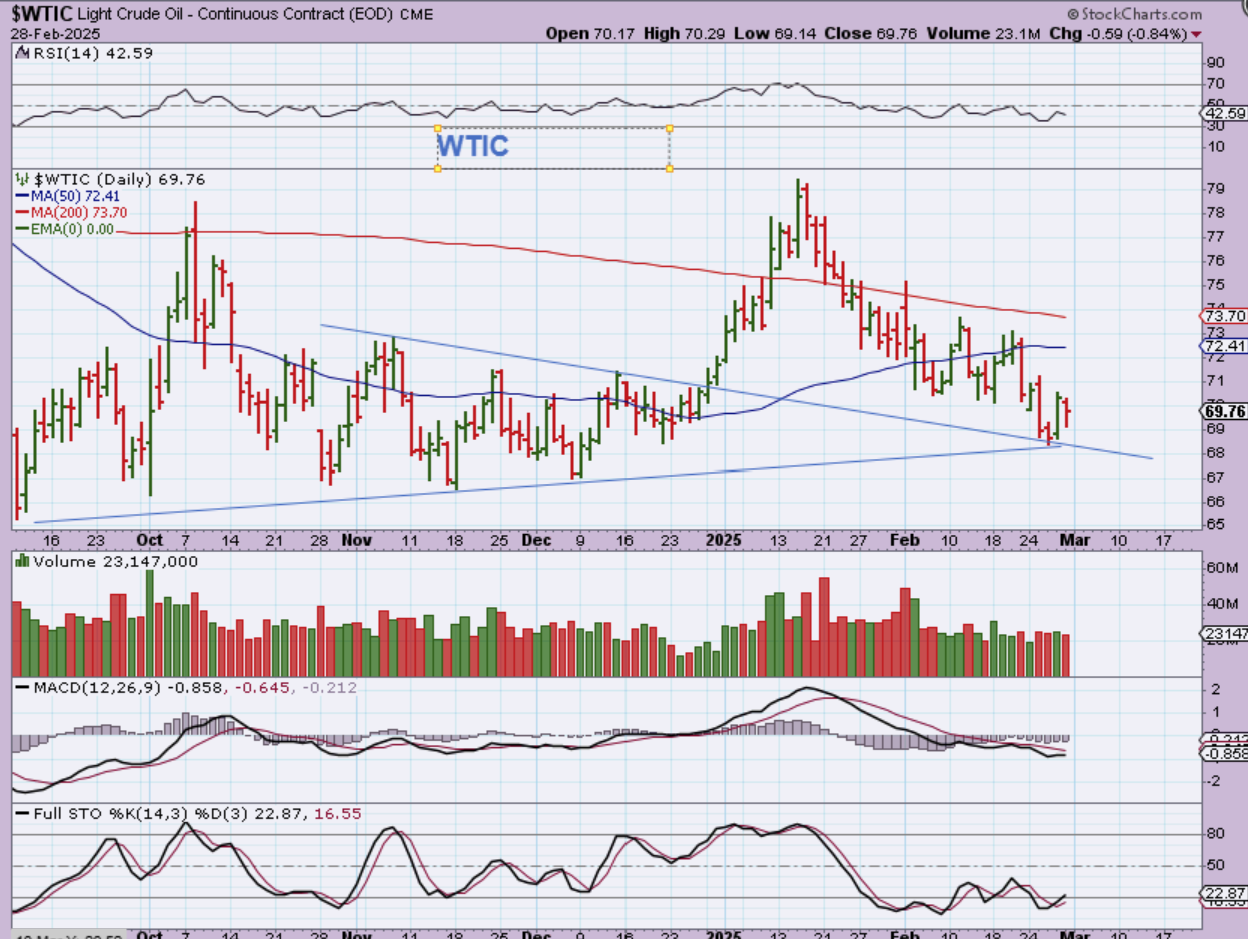
WTIC – Oil remains choppy and there really is no change from what I have been discussing in past reports.
.
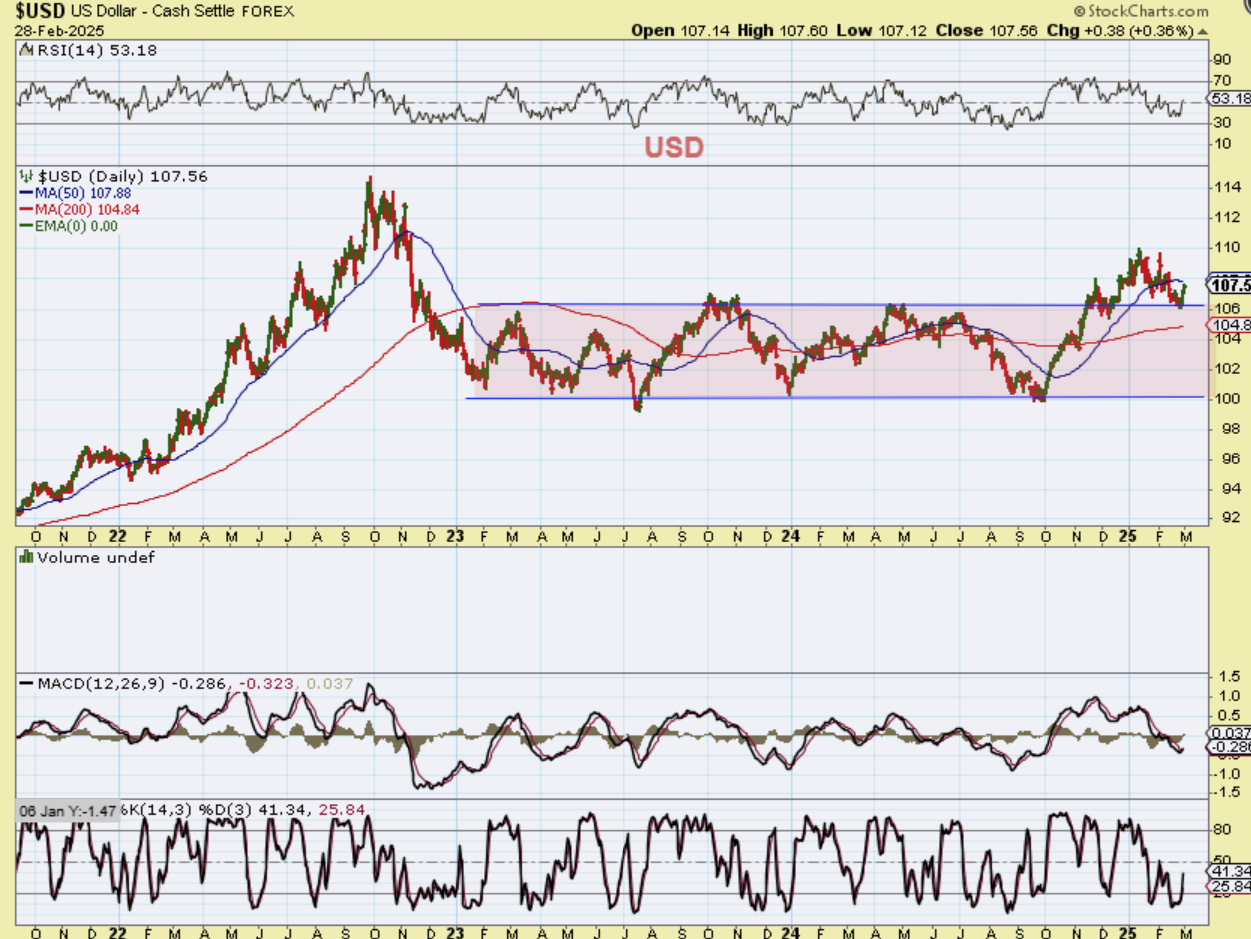
The USD had 3 strong daily cycles out of the lows and now the 4th weaker one rolled over and landed on support. I still think that the USD can have another drop after this bounce, which could take it down to the 200sma.
.
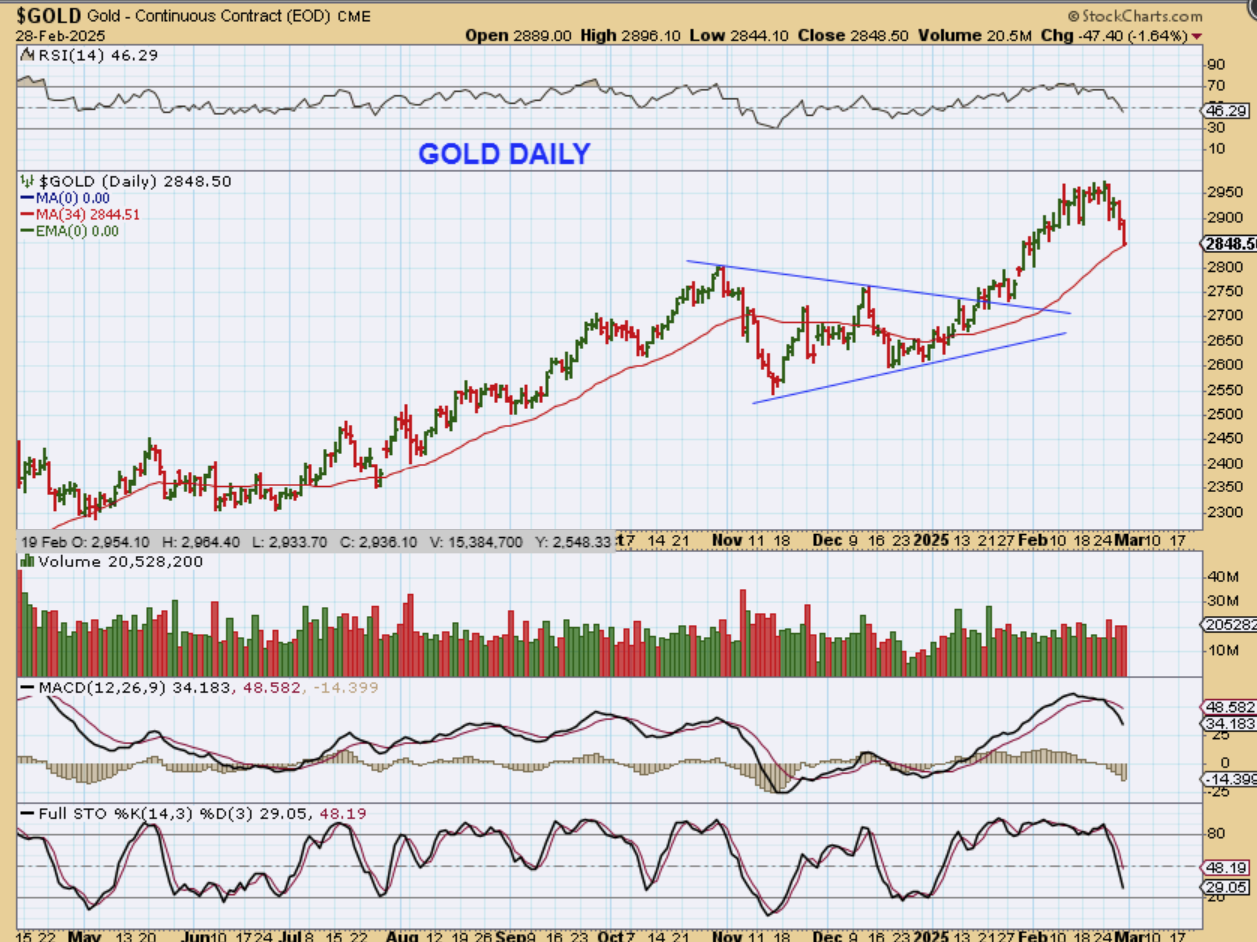
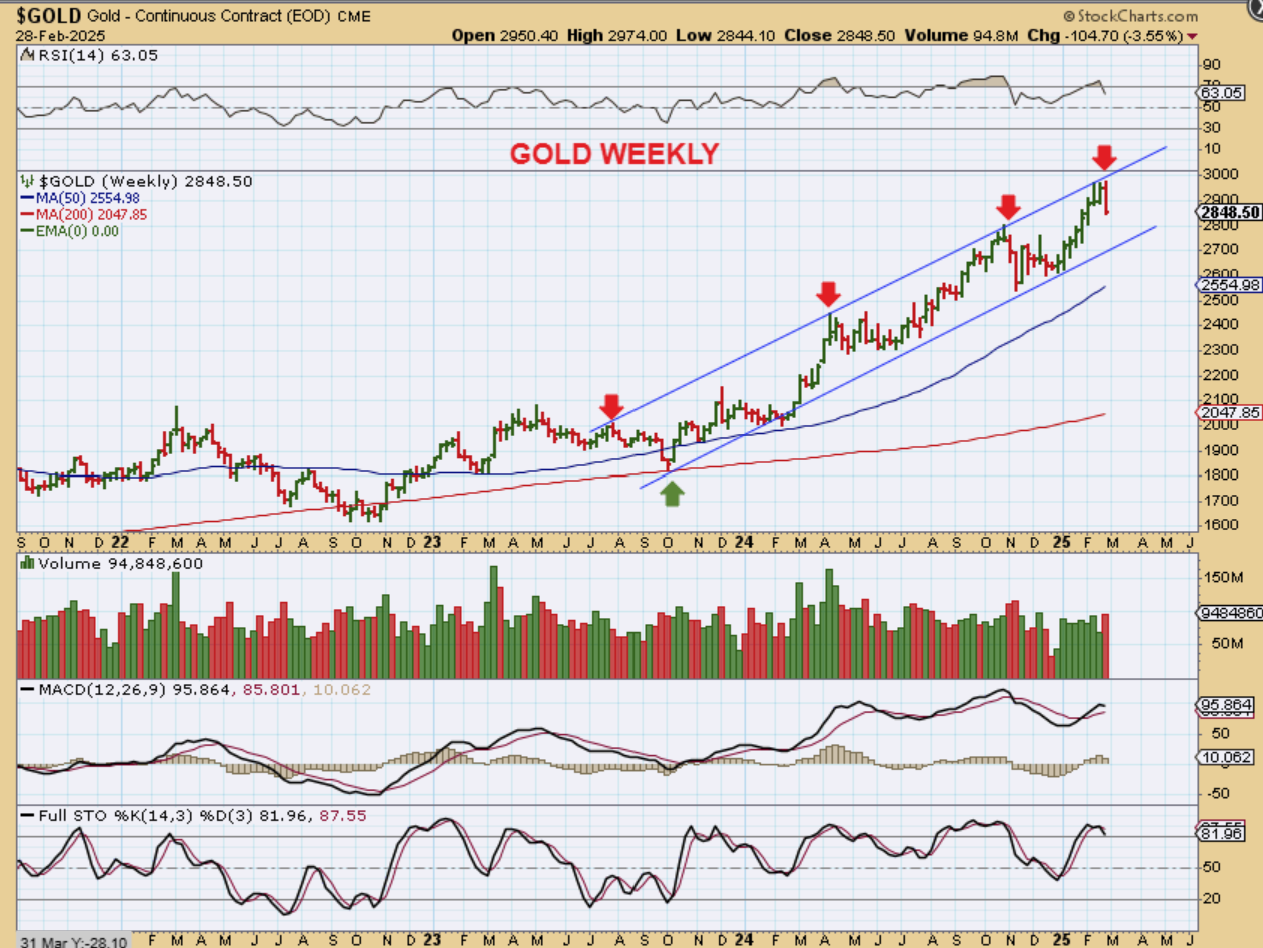
GOLD landed on the 34 sma Friday, and it has been many days out of the lows. We are now due or even overdue for a bounce / dcl.
.
GOLD WEEKLY– I know that this looks a little concerning with the upper trendline. I was concerned too. It seems that Gold tagged the upper channel trendline and found it to be resistance again. The bullish scenario would be that we can still bounce out of a dcl and tag the upper trendline again, at an even higher point. Let me show you that…
.
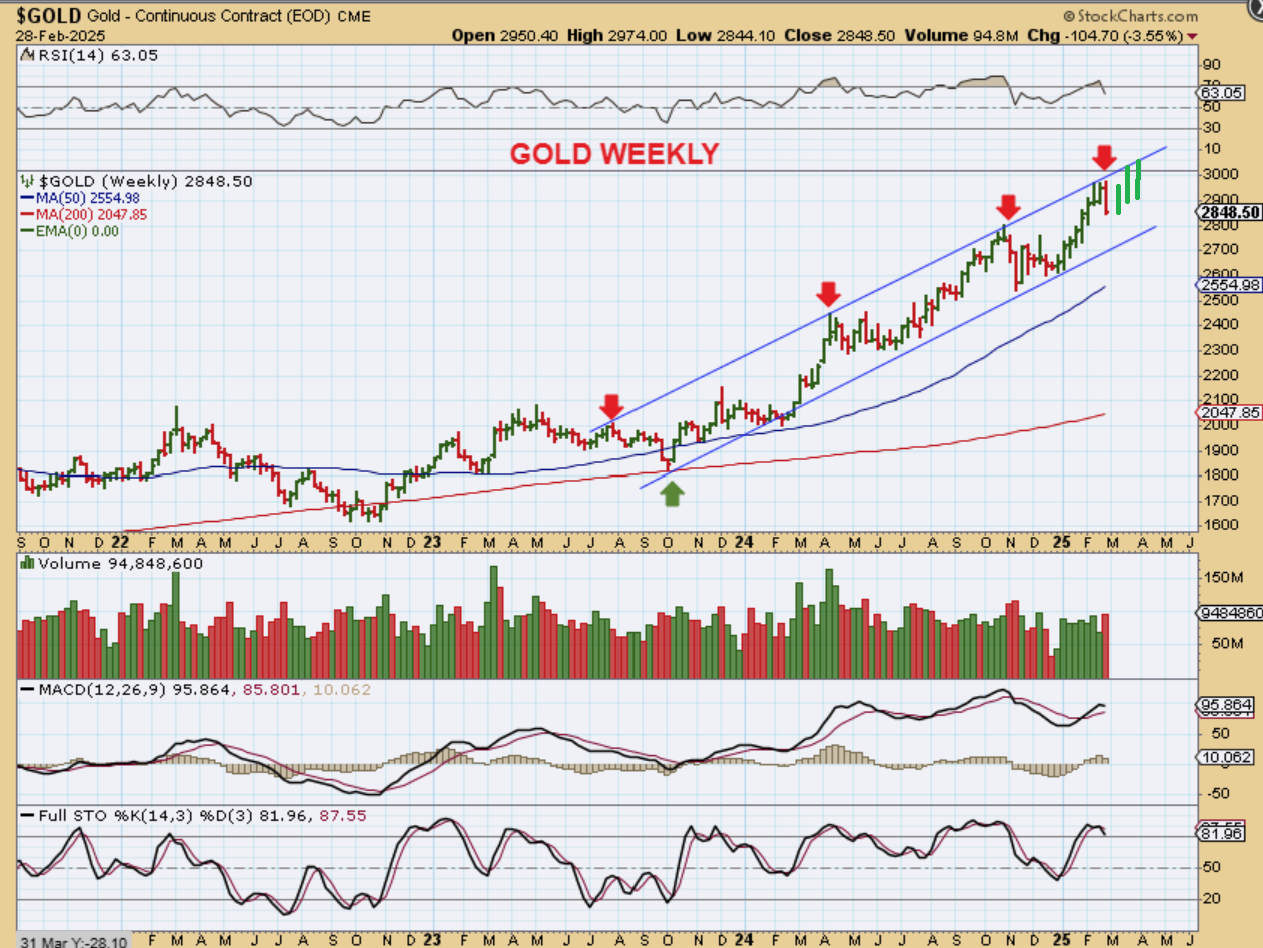
The bullish scenario would be that we can still bounce out of a dcl and still tag the upper trendline again, at an even higher point. This is an example of how that might work.
.
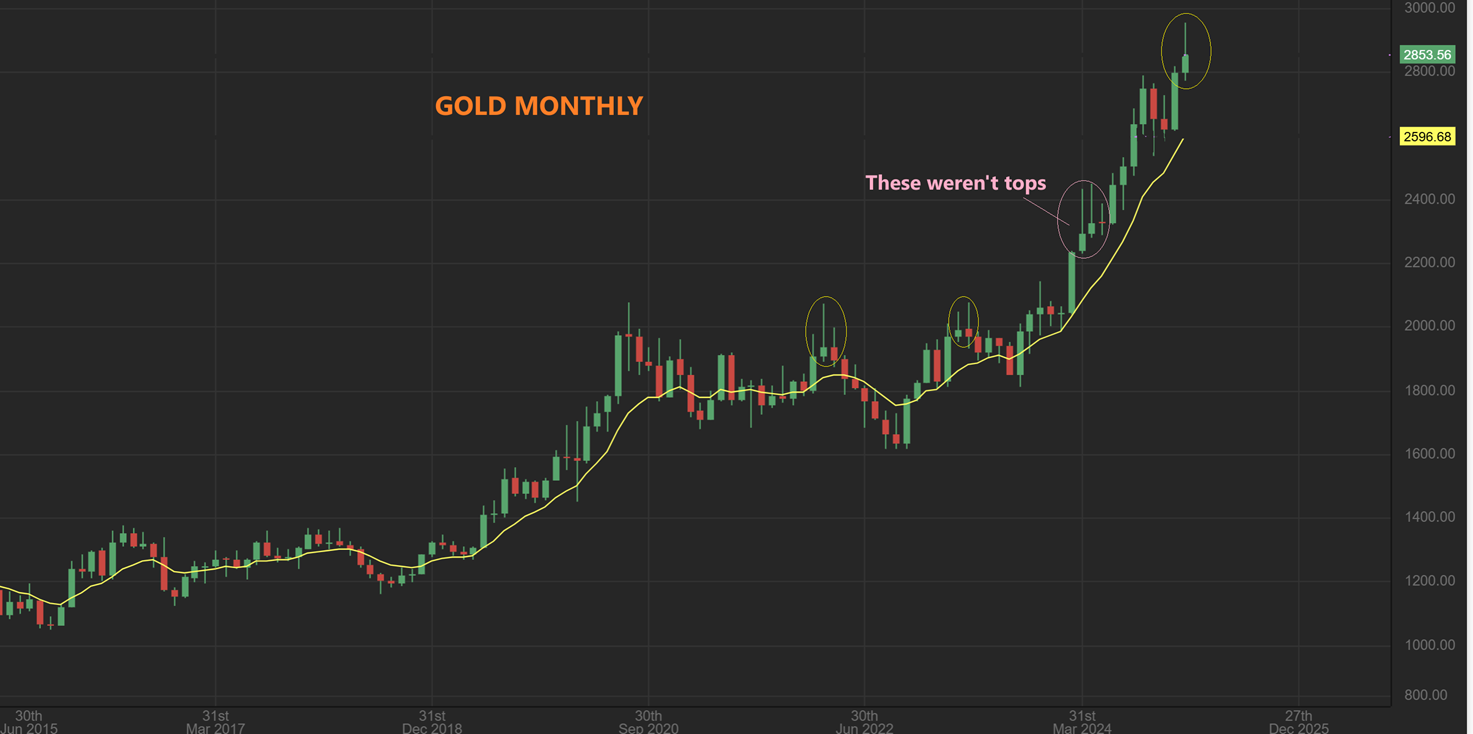
I will admit that GOLDs WEEKLY CHART looks like a February topping candle (& it could be). I did point out another topping candle where price kept moving higher, so this can still move higher. See the pink writing.
.
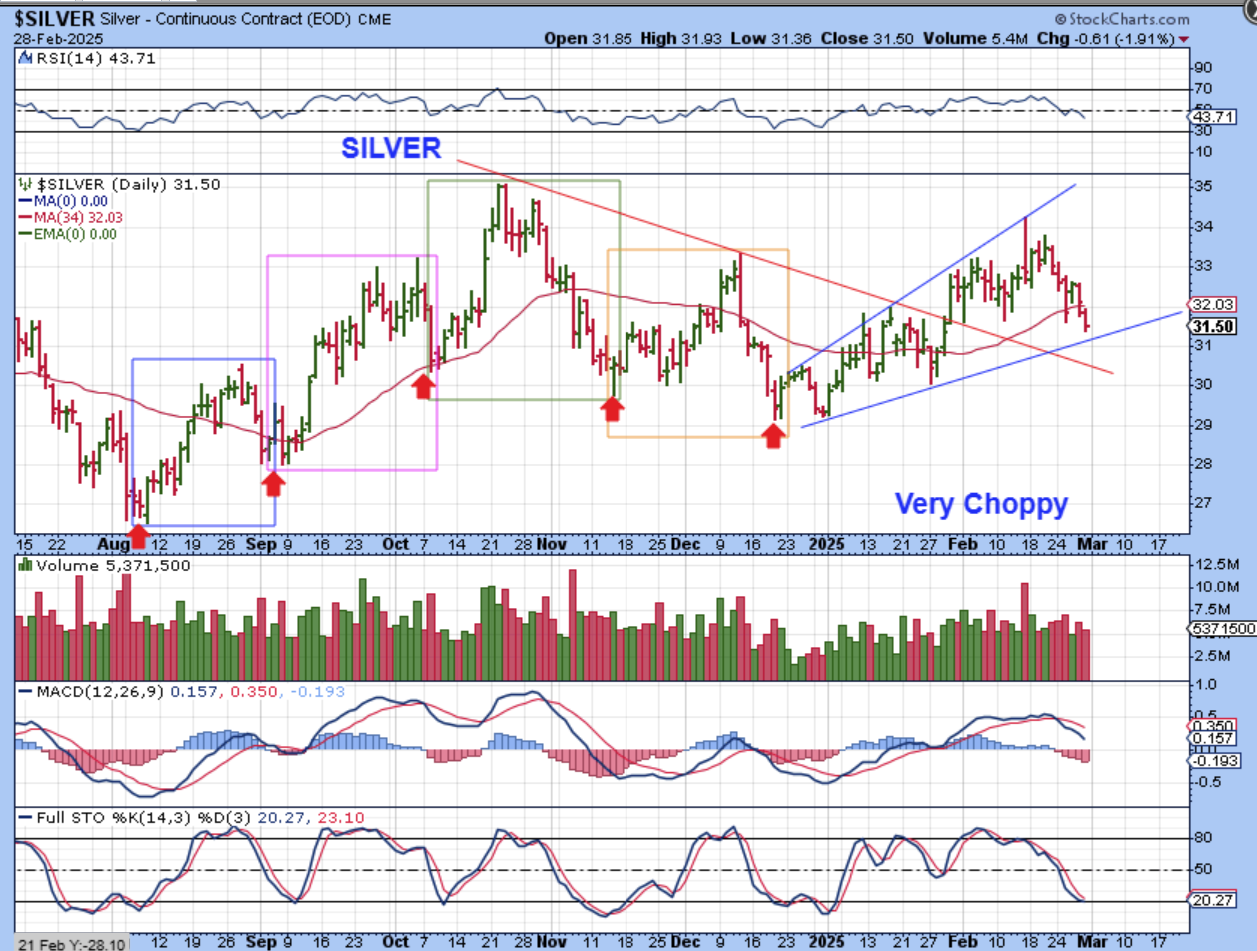
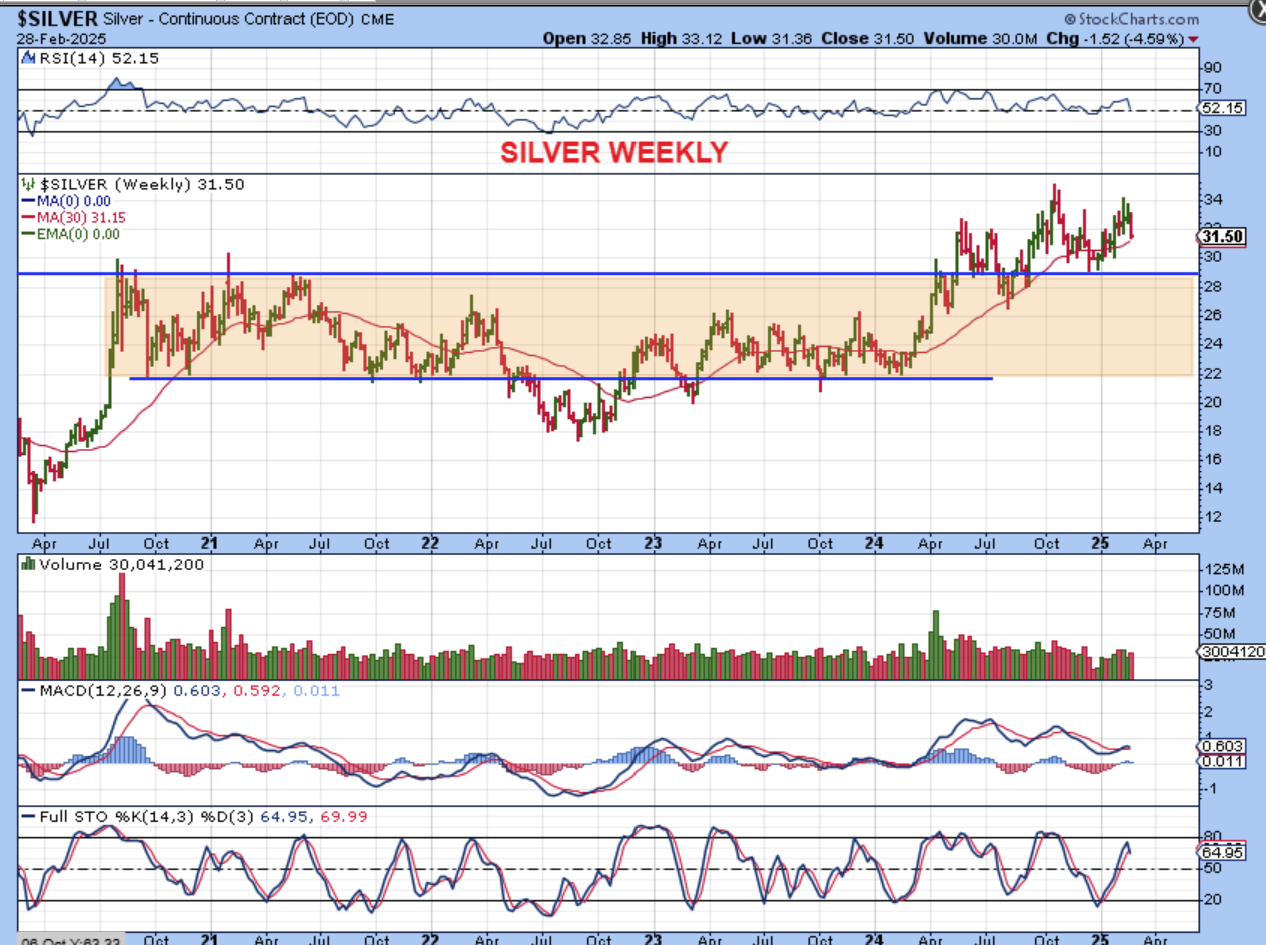
SILVER is just sloppy and choppy. It is due for a bounce and is finally getting oversold.
.
SILVER WEEKLY – Silver dropped almost 5% last week and approached the 30 week ma. This is another example of a choppy set up where the RSI & MACD dropped as price climbed last year. It can repair itself, but the charts say to us that it hasn’t been very strong.
.
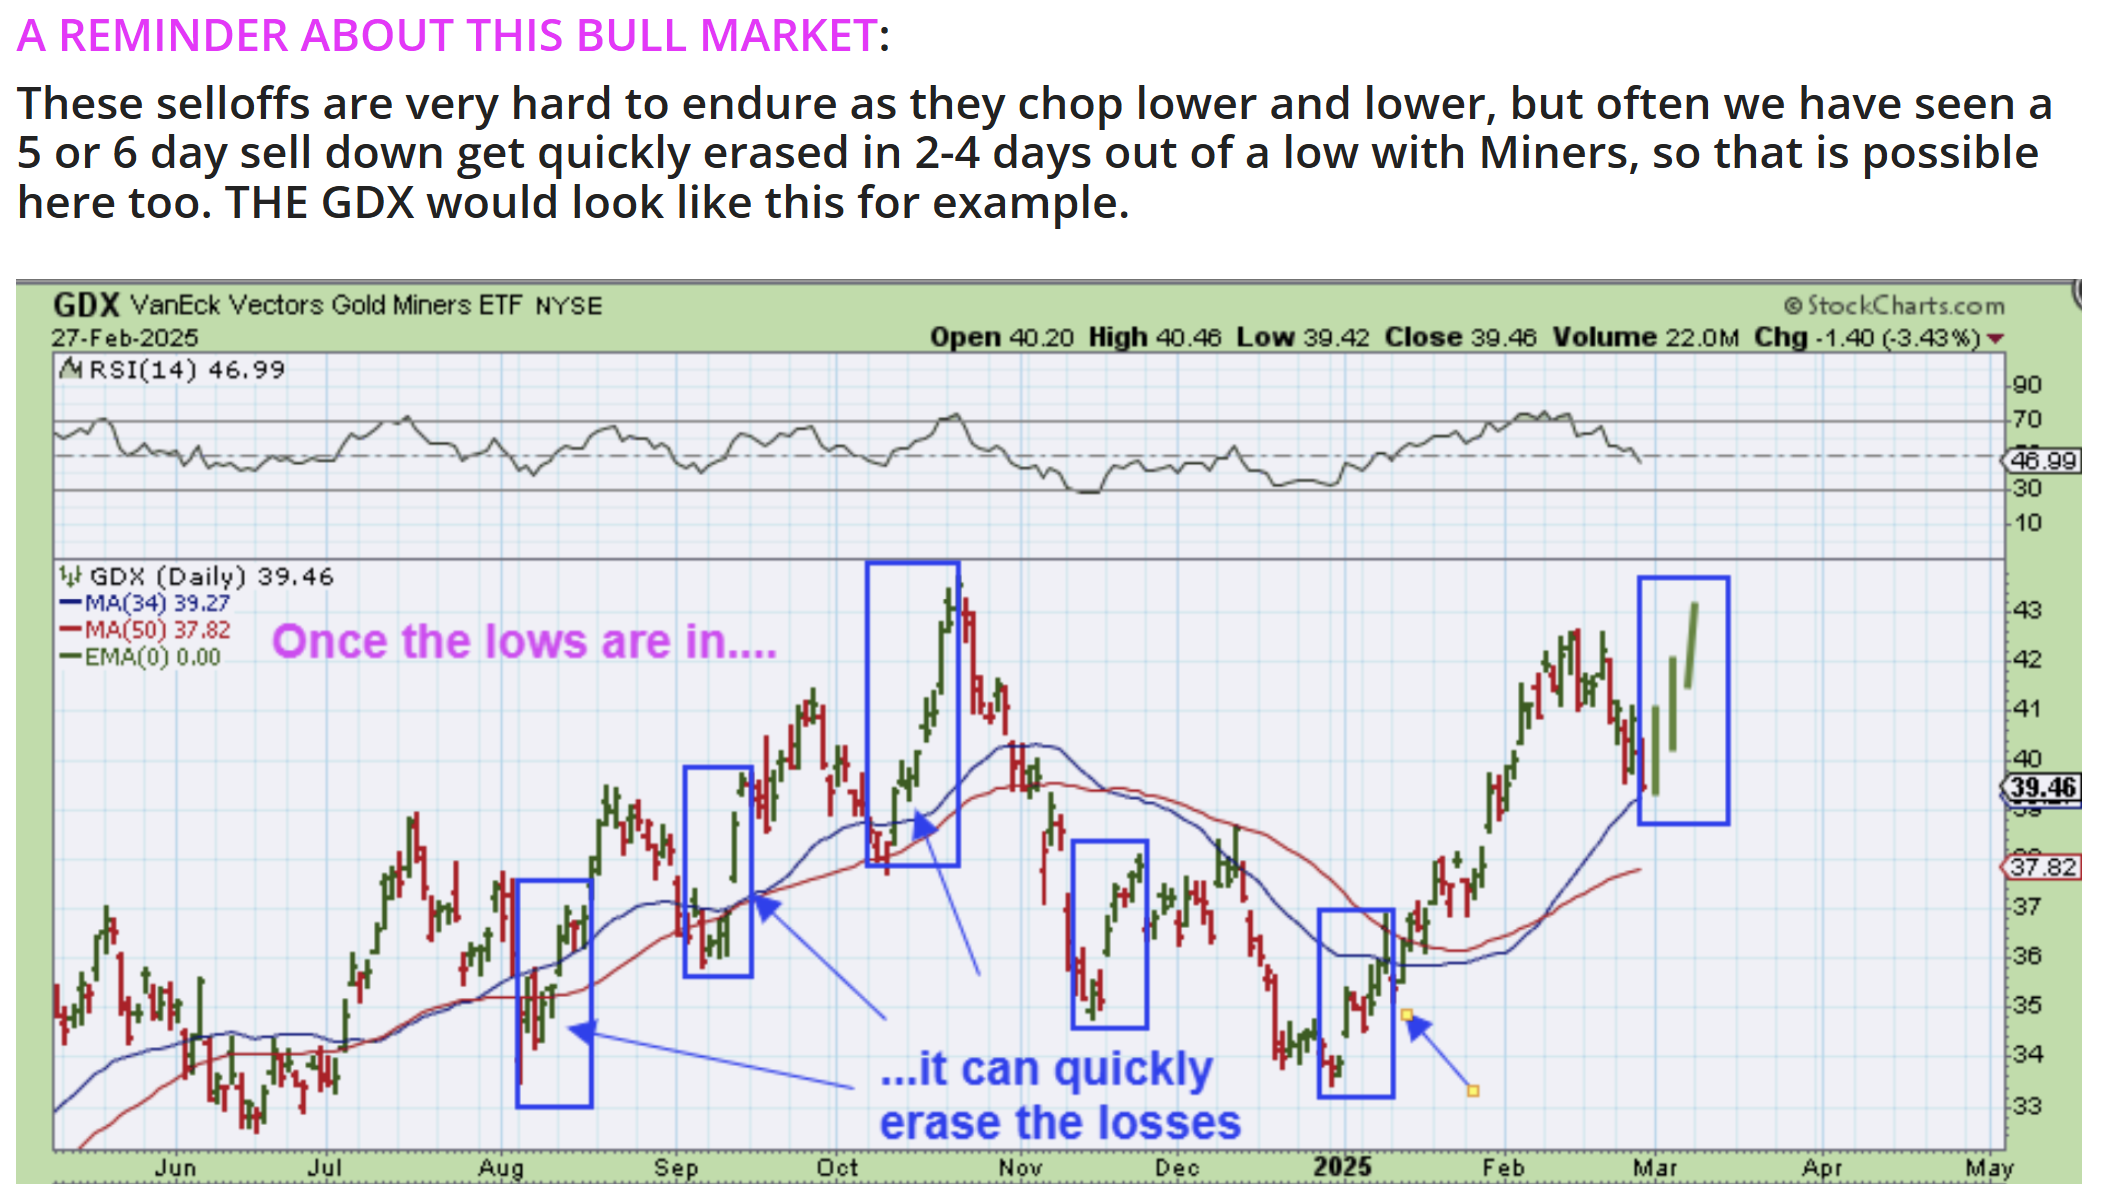
I have always said that a reversal candle can be bought with a stop at the lows…
.
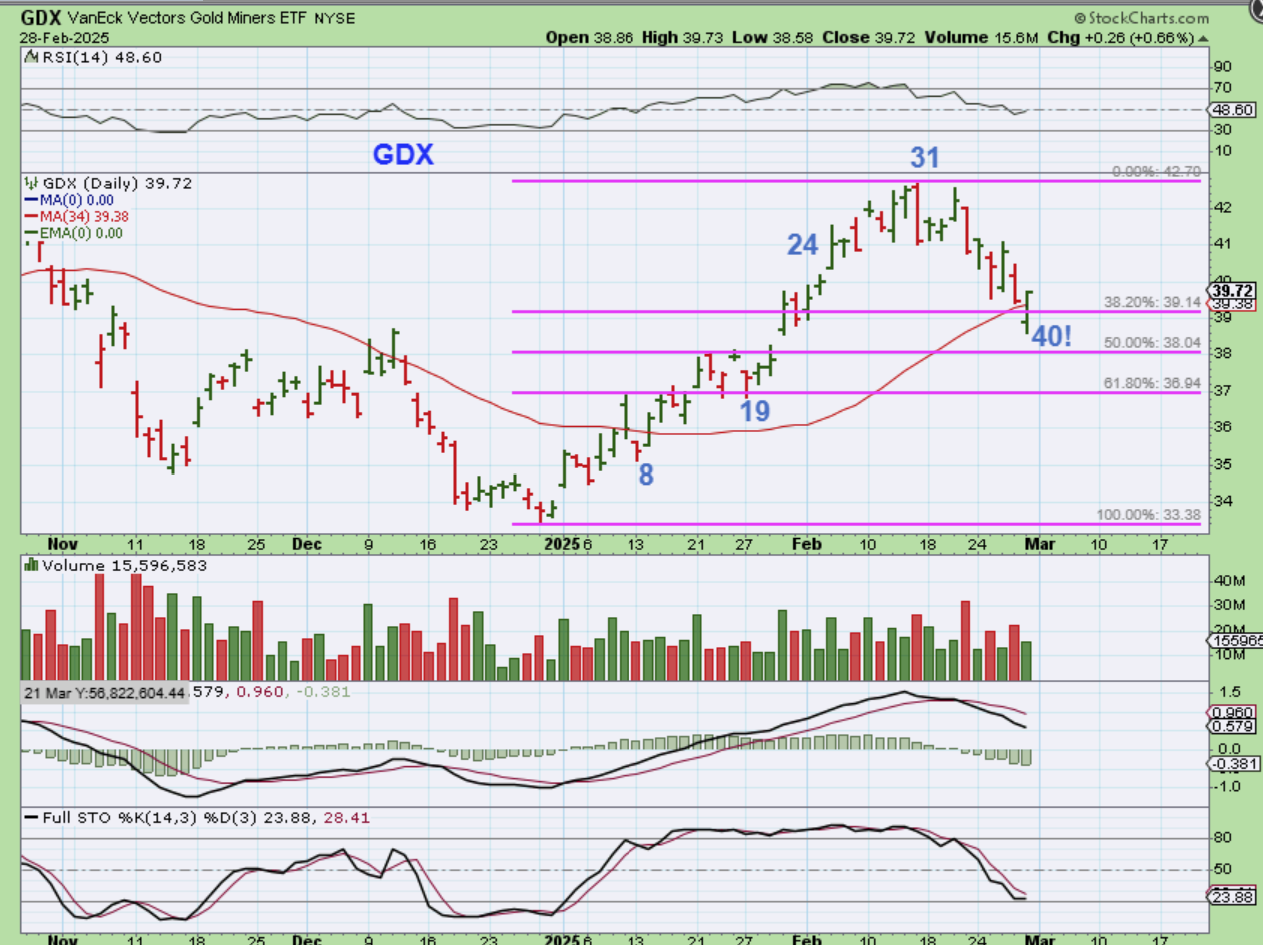
The GDX DAILY chart has a very very long daily cycle. This is now 40 days out of the lows, and thankfully we have a strong reversal and a recovery of the 34 sma. The low is quite overdue, but it is finally oversold, so lets see if this reversal has some follow through.
.
GDX DAILY from Fridays report:
.
.
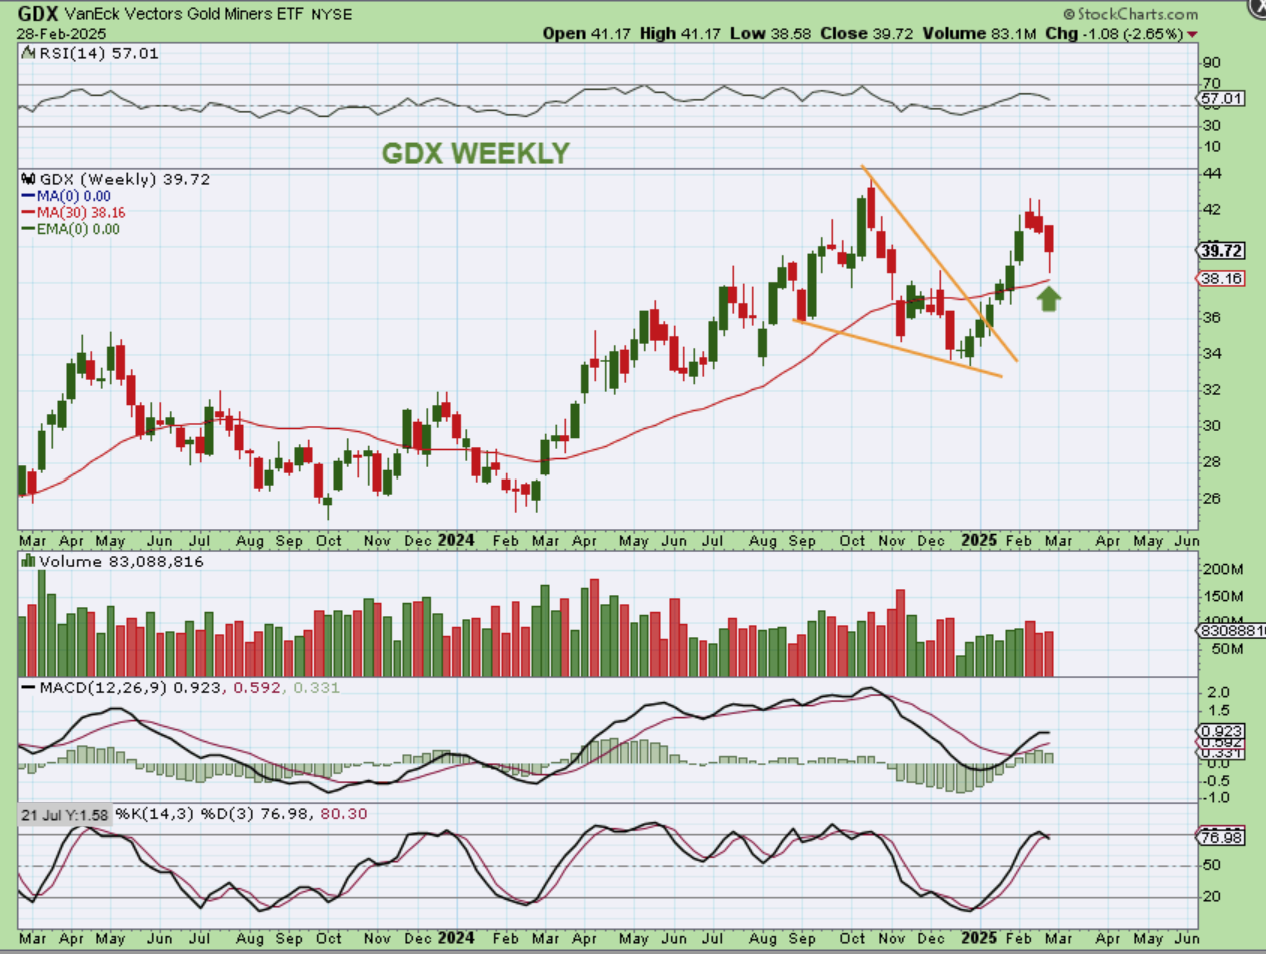
GDX WEEKLY– The GDX dropped and that reversal candle on the daily gas given us a reversal on the weekly too, just above the 30 week ma. This may be the dcl and Miners do look ready to move higher.
.
We saw several reversal candles after a choppy difficult sell off. Are the Bulls capable of re-gaining control and are buyers going to push things higher? It does look that way, but next week should give is the answer. Bitcoin also put in a reversal, so it may be on its way higher too. I’ll cover that below. Enjoy your weekend and thanks for being here at Chartfreak!
,
~ALEX
.
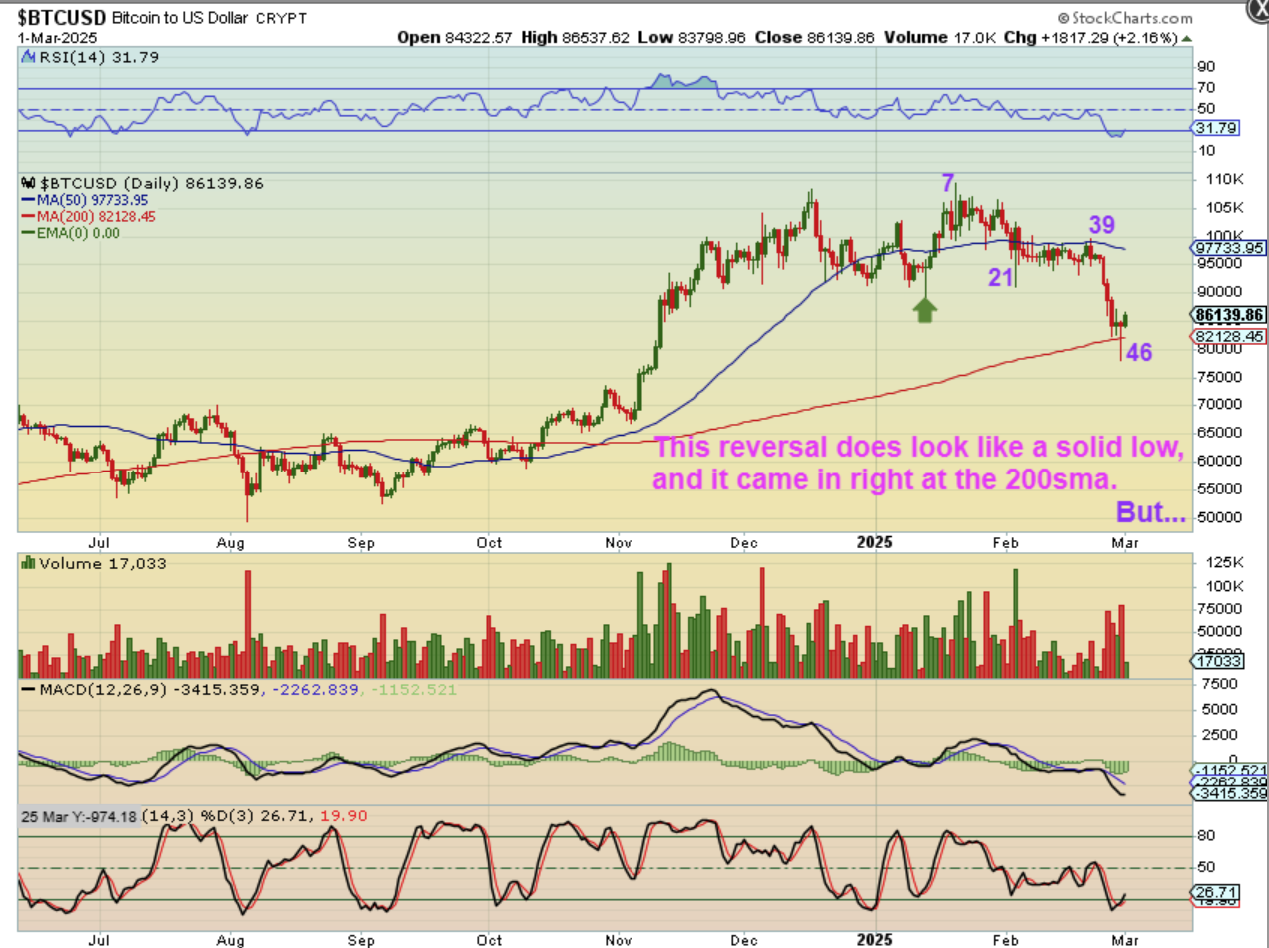
BITCOIN has a day 46 low, but that is a solid reversal candle, and it came in right at the 200sma. Please read the chart. What could go wrong with a reversal at the 200sma?..
.
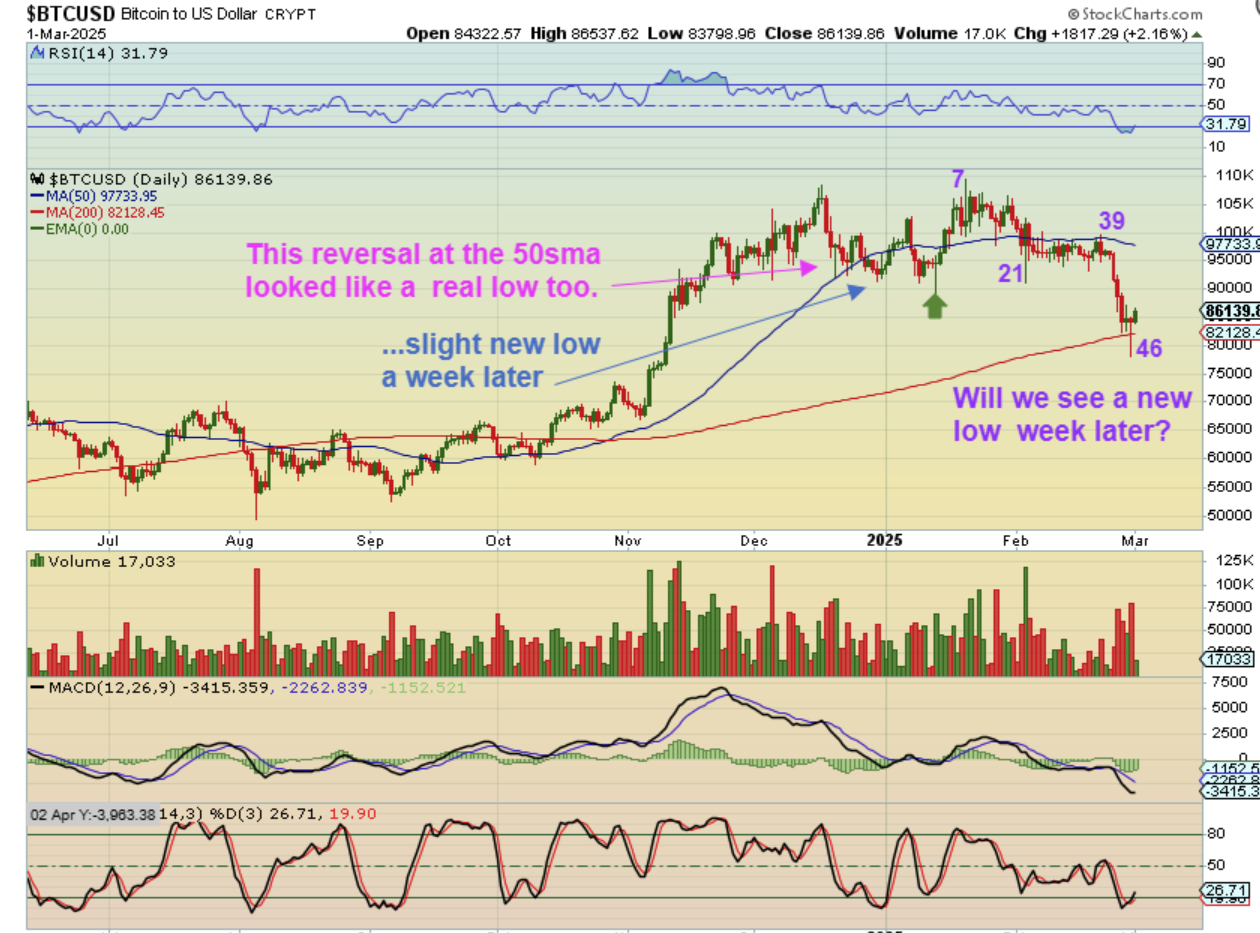
Well, at day 46, we are a tad early for a dcl. Now take a look at the reversal candle at the 50sma. Bitcoin still dropped to a new low and it was even a shakeout below that 50sma. That pop and drop took about 10 days, and if we saw that at the 200sma, we’d be at day 56. Things that make me say ‘Hmmm?”. Please see the chart. You can buy the reversal and ride it, but just know that we MIGHT come back to the lows, but it should be fairly quick. And…
.
From Friday:
.
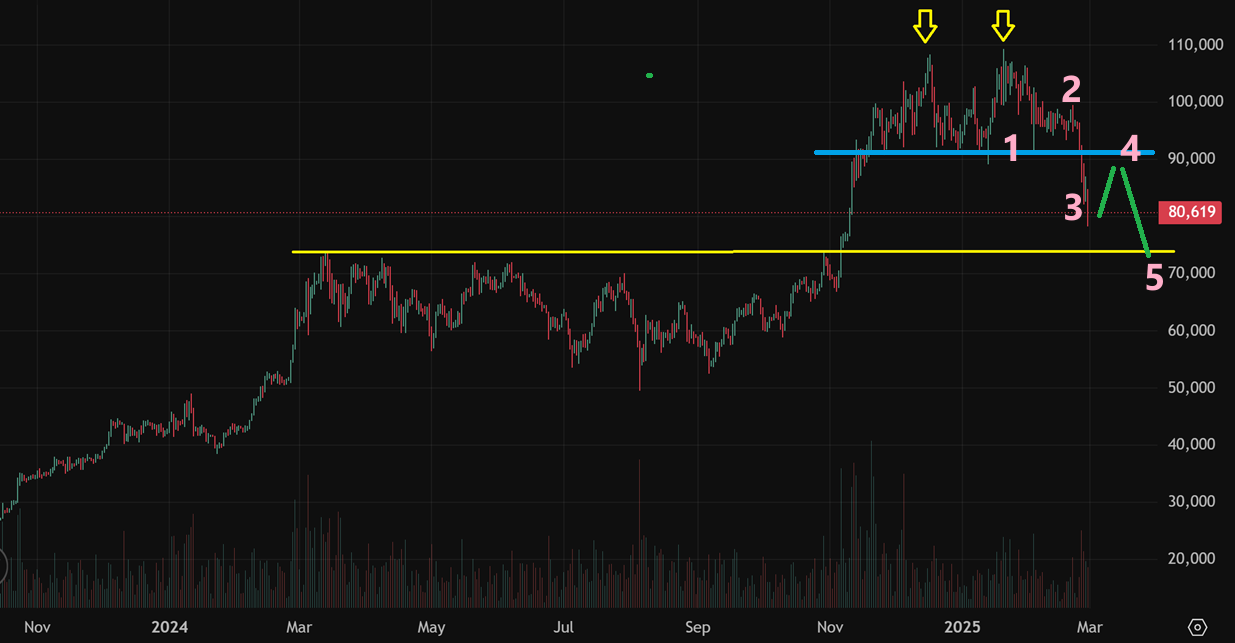
BITCOIN could be at the wave 3 lows. It could now bounce next week with that reversal candle, and then drop again to the lows. It doesn’t have to, but there is time for that. If it drops again, it should not last for very long. You could ride it out or buy the reversal and raise stops as it rallies.
.
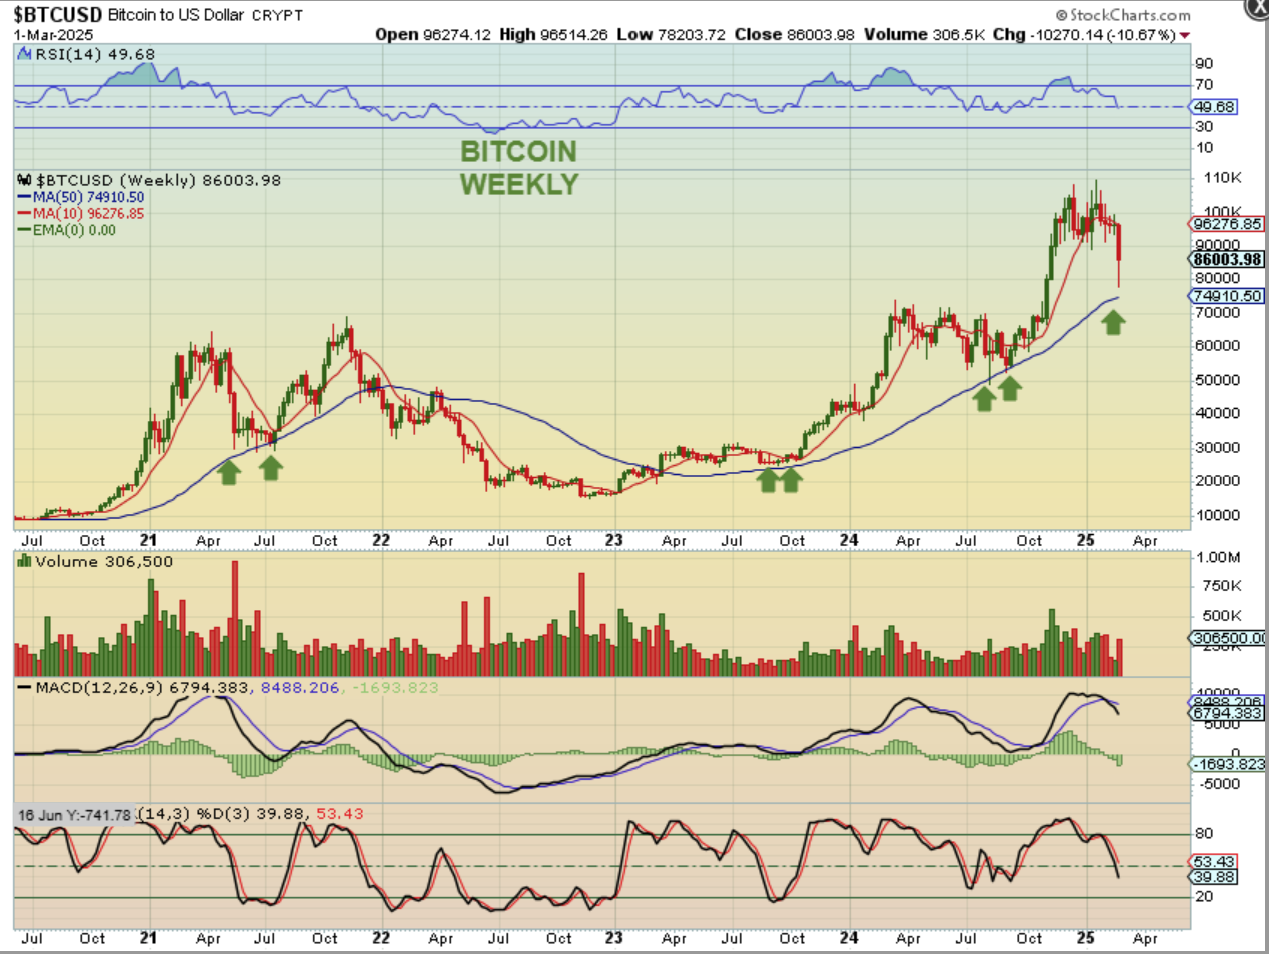
THE WEEKLY BITCOIN CHART shows us a reversal just above the 50 week ma. My eyes are drawn toward the 2021 year, but I just want to see how this plays out going forward.
.
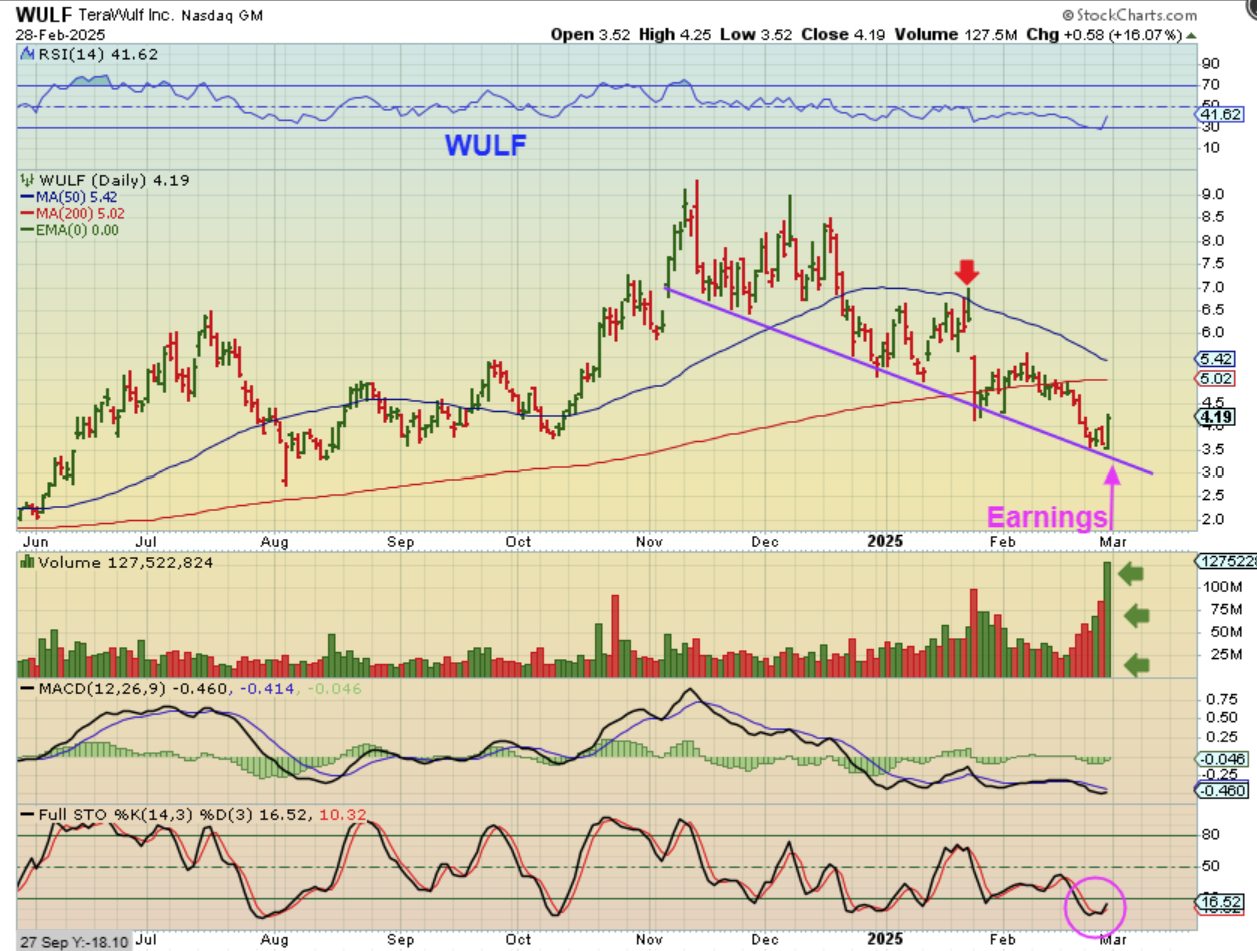
WULF, BTDR, and MARA released earnings and had a nice reaction higher, so that may be a sign that a bottom will come in sooner than later. The bottom may be in on some of these Crypto stocks.