Friday February 28th
.
Using this chart on Feb 21, I discussed that The SPX sold off sharply a bit early on day 27. Being only on day 27, there was the danger of the selling continuing for a while. A dcl was not really due yet, so I drew this drop lower into day 37, with bounces on the way…
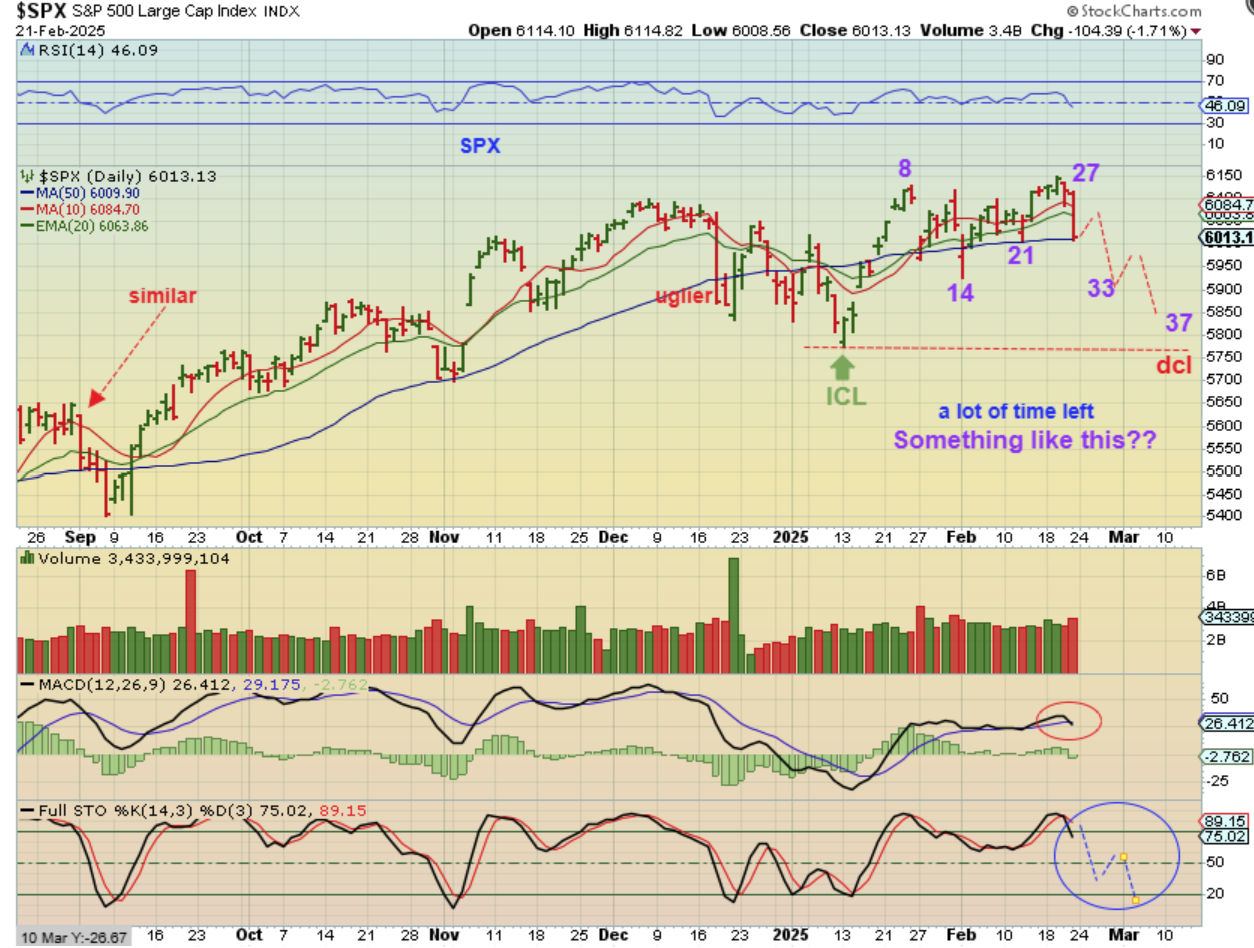
.
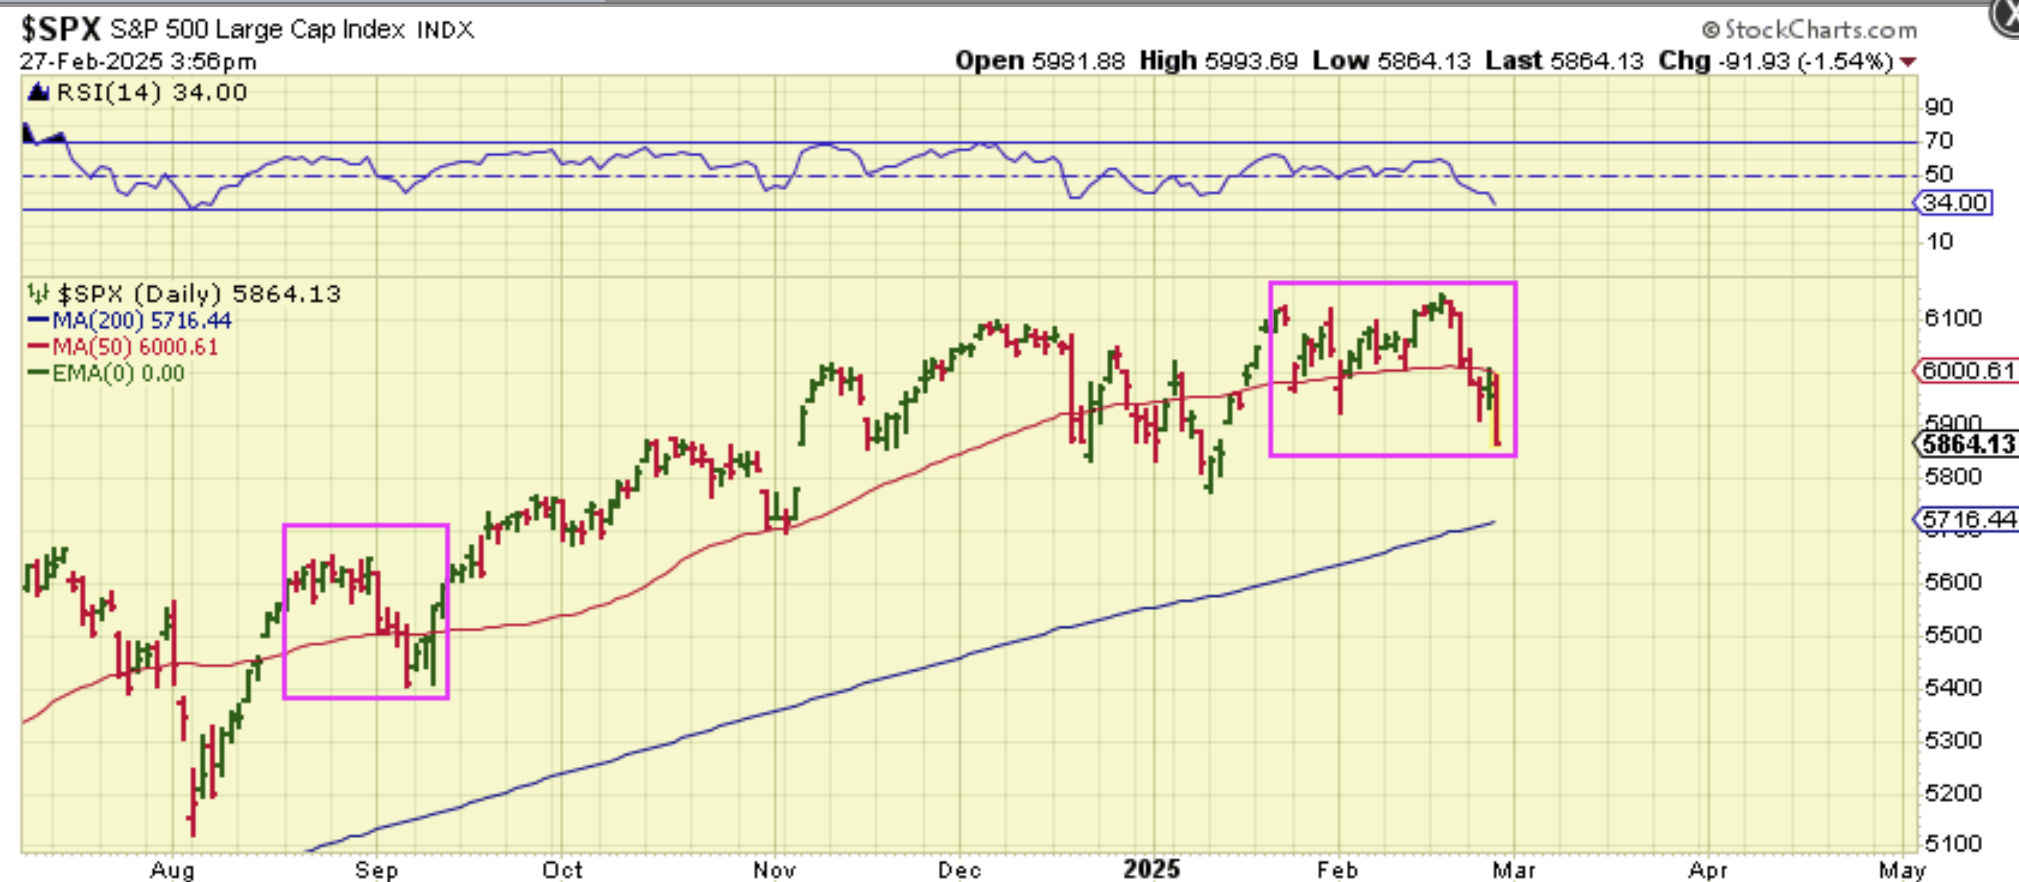
The SPX is on day 31 and it has hardly bounced yet. It lost the 50sma and the selling looks sharp. It is ugly, but take a look at the red box on the left. That sell off also had some quick sharp selling, but then it rallied. The NASDAQ is now giving us a different look, and it makes me wonder if the SPX will drop to the 200sma. Let’s take a look…
.
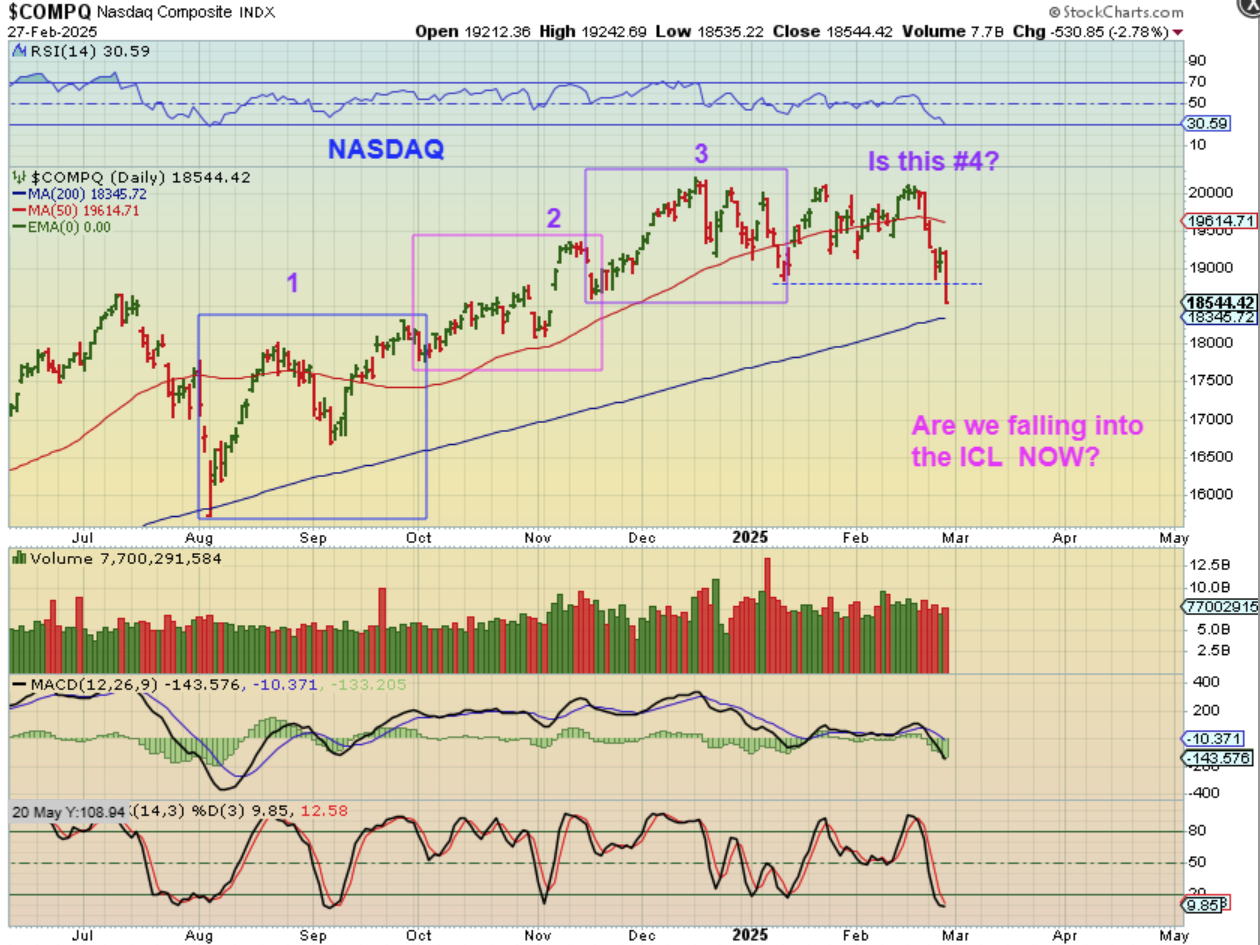
THE NASDAQ set up is actually different for several reasons.
The Nasdaq did not break to a new high above daily cycle #3, and it is actually also L.T. since the high of this daily cycle was on day 8, Jan 24. And now it broke down? Is this telling us that the ICL is actually ahead? For the Nasdaq,
1. This looks like the 4th daily cycle with slightly lower highs,
2. It is L.T. peaking on day 8, and
3. NASDAQ broke below the last dcl. Interesting. This looks like a 4th daily cycle heading into an ICL.
.
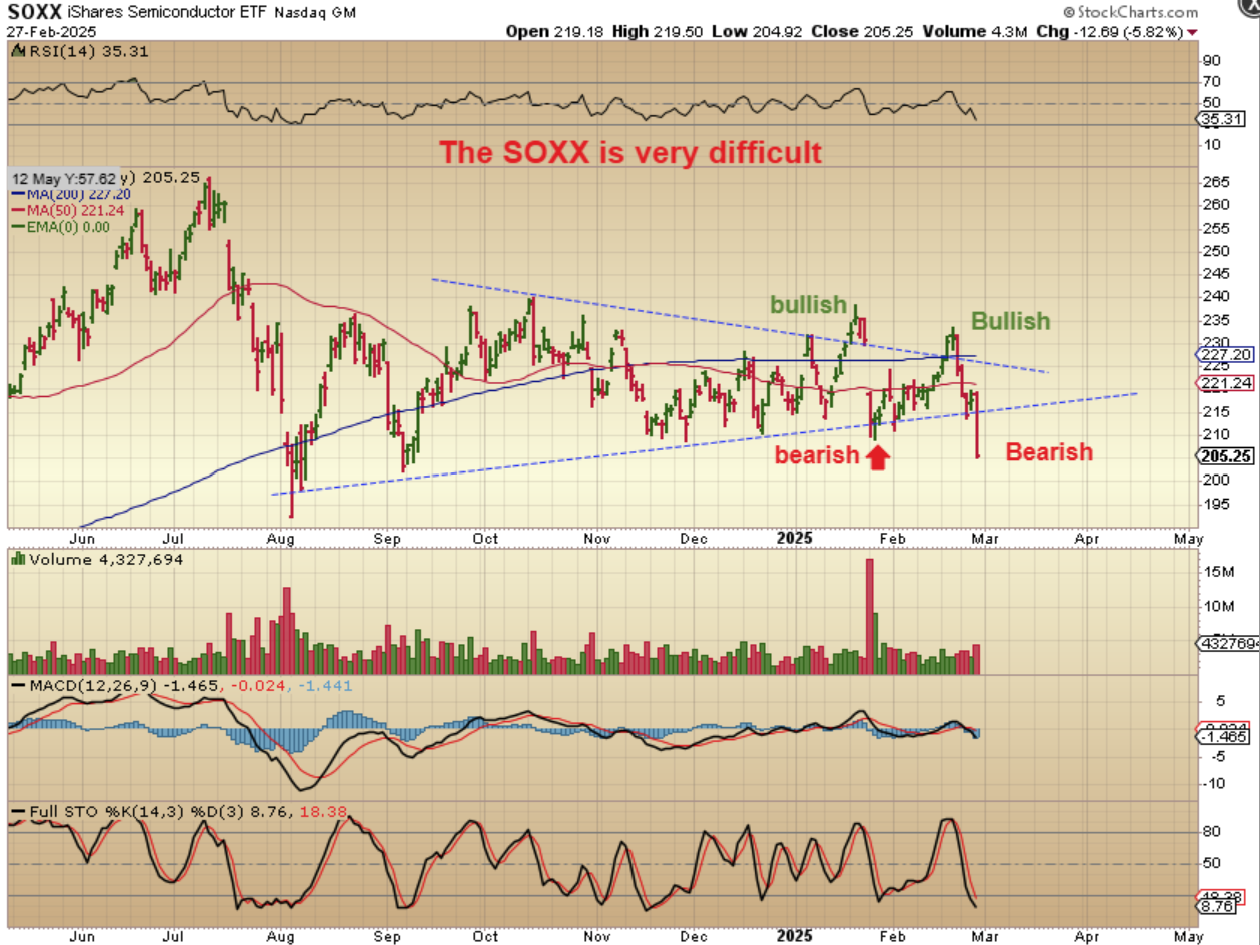
And then you have The SOXX. UGLY, CHOPPY, indecisive.
.
It has had a triangular consolidation, but notice that
1. It bullishly broke out,
2. Then it quickly bearishly broke down,
3. Then it bullishly broke out, looking like an ICL,
4. Yet now it is again is bearishly selling off again and broke down. This choppy uncertainty has been very frustrating, but I would expect it to ‘settle down’ when the uncertainty of the economy, tariffs, inflation, etc begins to stabilize or settles down.
.
READ THIS TO TRY TO UNDERSTAND THE GENERAL MARKETS:
I have mentioned before that ‘The markets do not like uncertainty‘. Well we have seen MANY rapid changes in the U.S. that can affect the markets since the US elections, and even though I do believe that this choppiness and uncertainty will eventually level off after an ICL, right now the market has been filled with short term false moves in both directions.
So currently the Nasdaq and The Soxx look like we are actually putting in the ICL with this selling. The slight break to new highs of the SPX appears to be a slight ‘false breakout’, because the Nasdaq did not break to new highs and is L.T. This week The Nasdaq has broken down to new lows. It is day 31 and an ICL drop can capitulate and become shortened, bottoming at any time, and sentiment is horrible right now (that is actually bullish). An ICL can come on day 31, 35, or 38, we just don’t know until it happens. So until it bottoms the shakiness may continue.
.
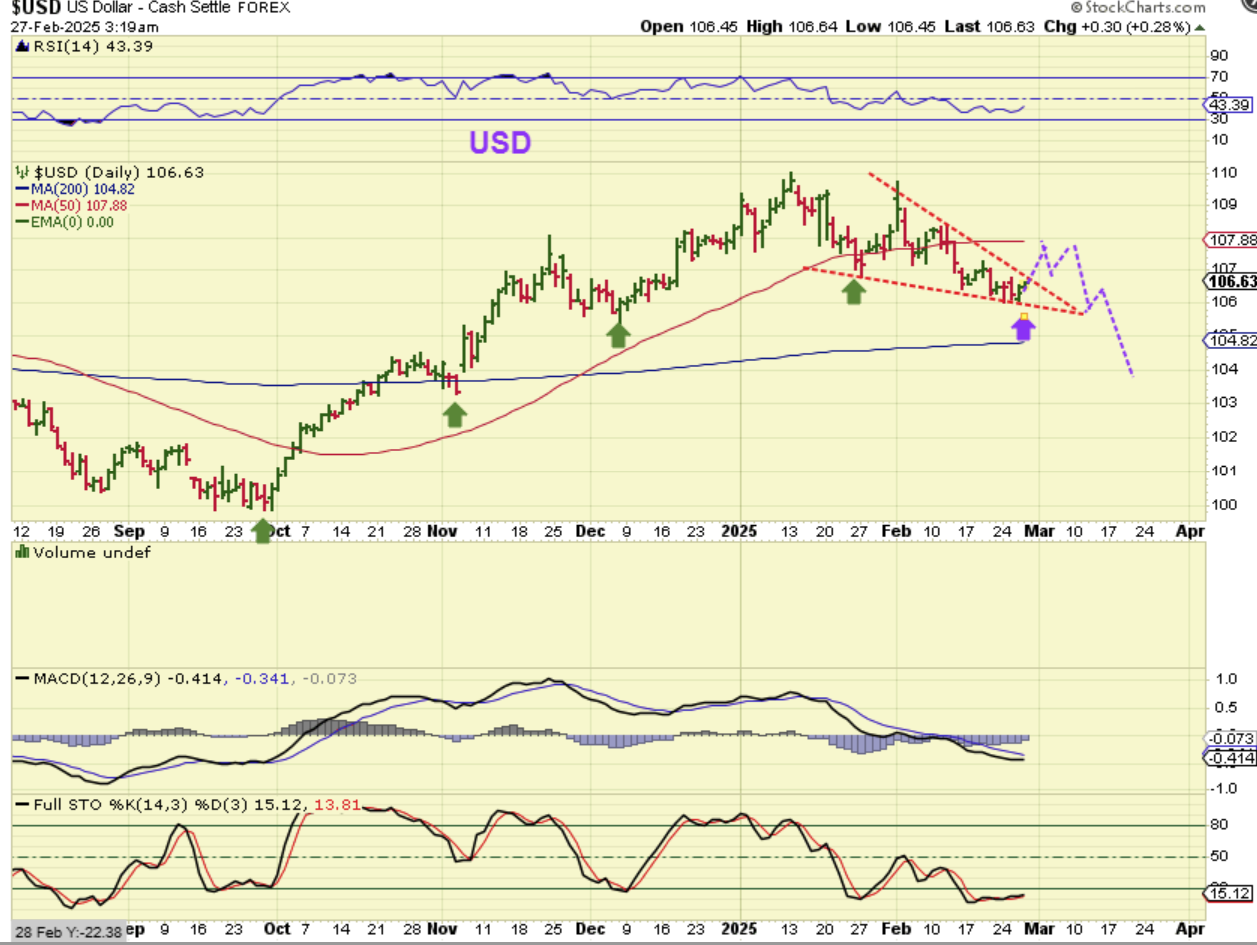
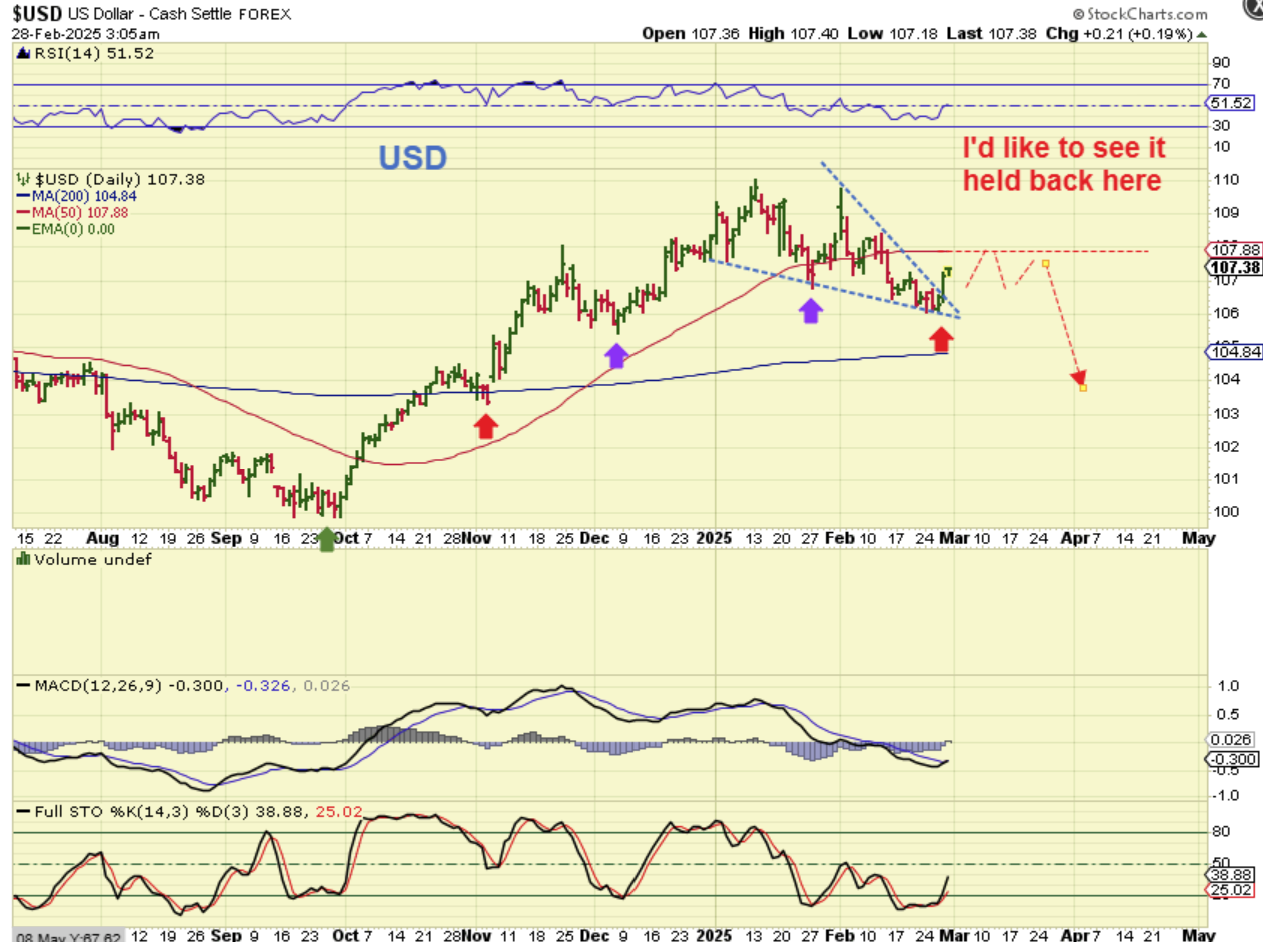
USD – I have been saying that I expected a USD mini-rally and then 1 more daily cycle lower, so a bounce could be capped at the 50sma as a back test.
.
So the USD did break out. Not unexpected. I expect it to run to the 50sma, and I’m hoping that it gets capped there as a L.T. Daily Cycle.
.
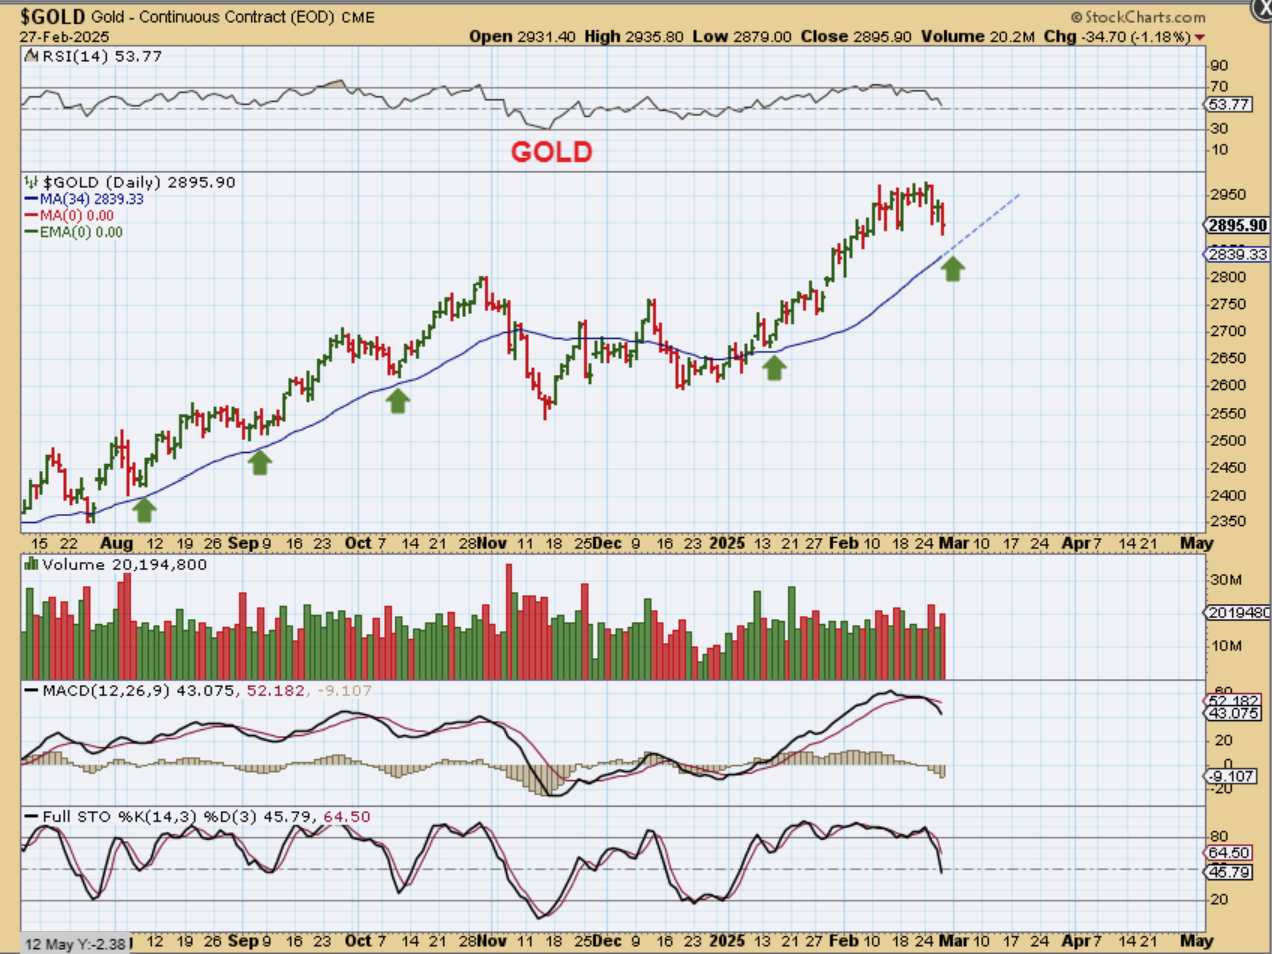
GOLD – From Mid-December to Mid-February it looked like Gold could not pull back, but it was overdue for a dip into a dcl. Guess what? Gold can and is pulling back. Maybe the 34 sma is support?
.
SILVER dropped to its 34 sma again and broke a bit below it. A few days ago, I had pointed out that the lower trend line was not tagged yet, and Silver could still be heading there. Silver is not exactly fully oversold yet.
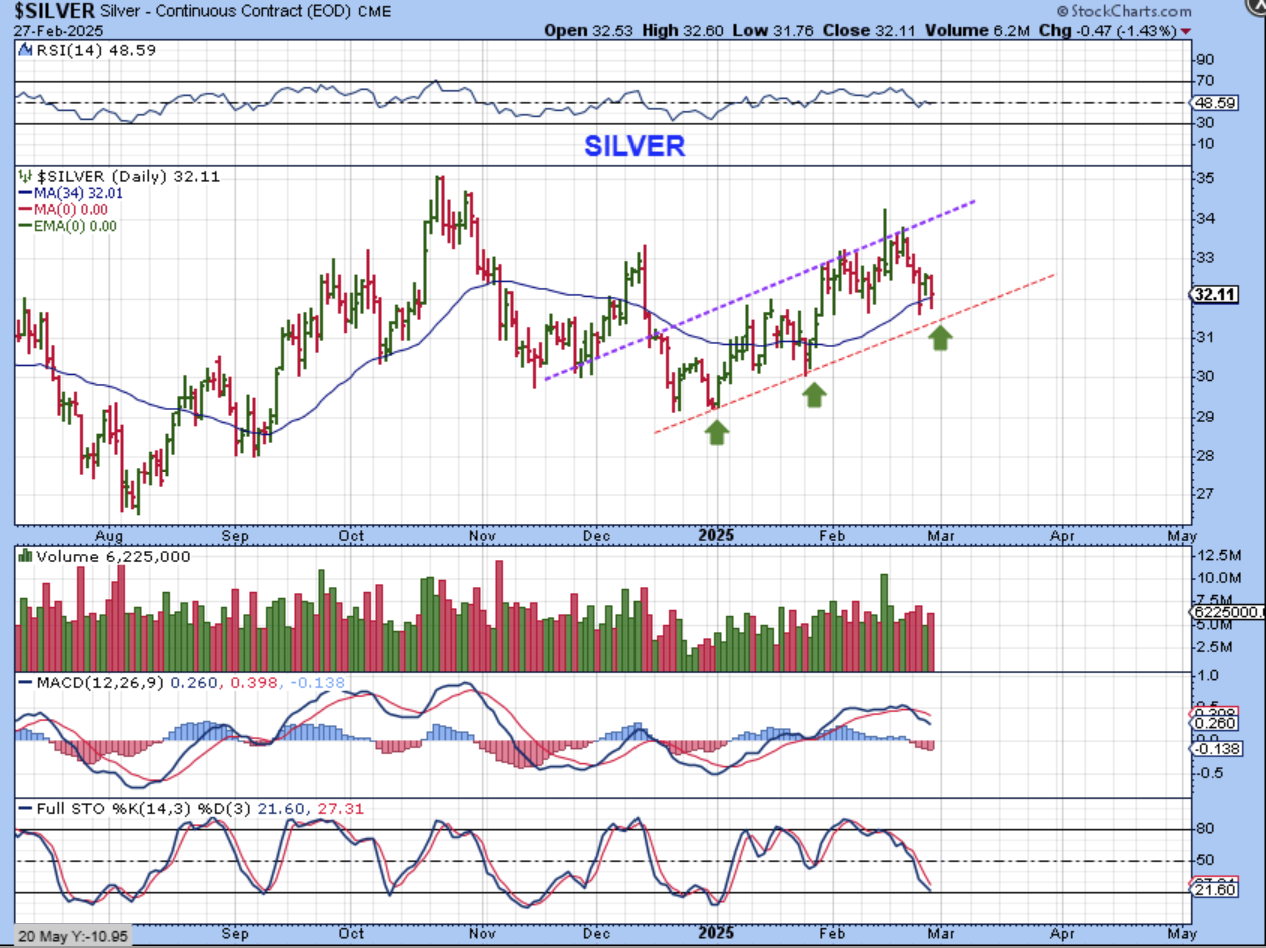
.
This is what I said Thursday about the lower support level:
.
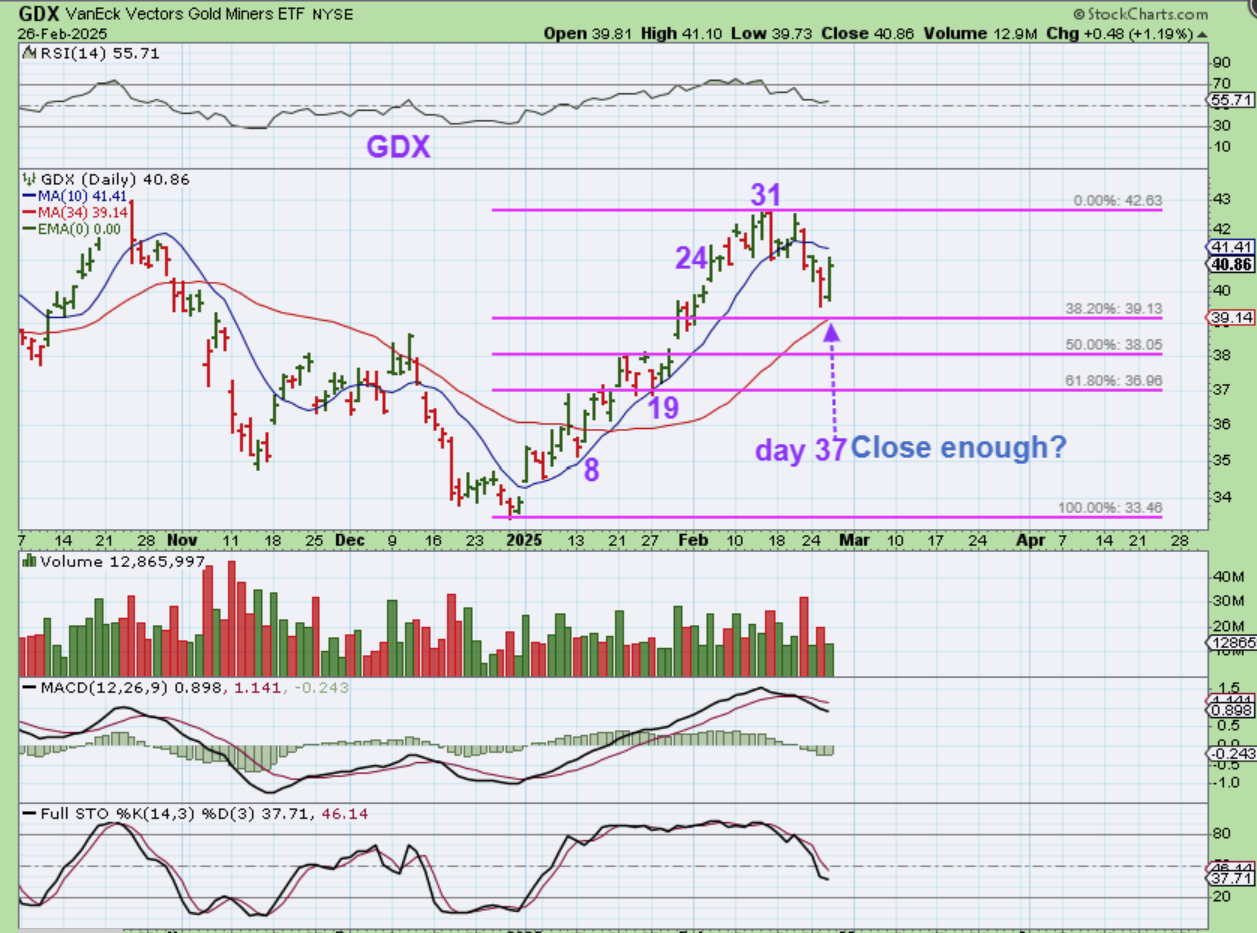
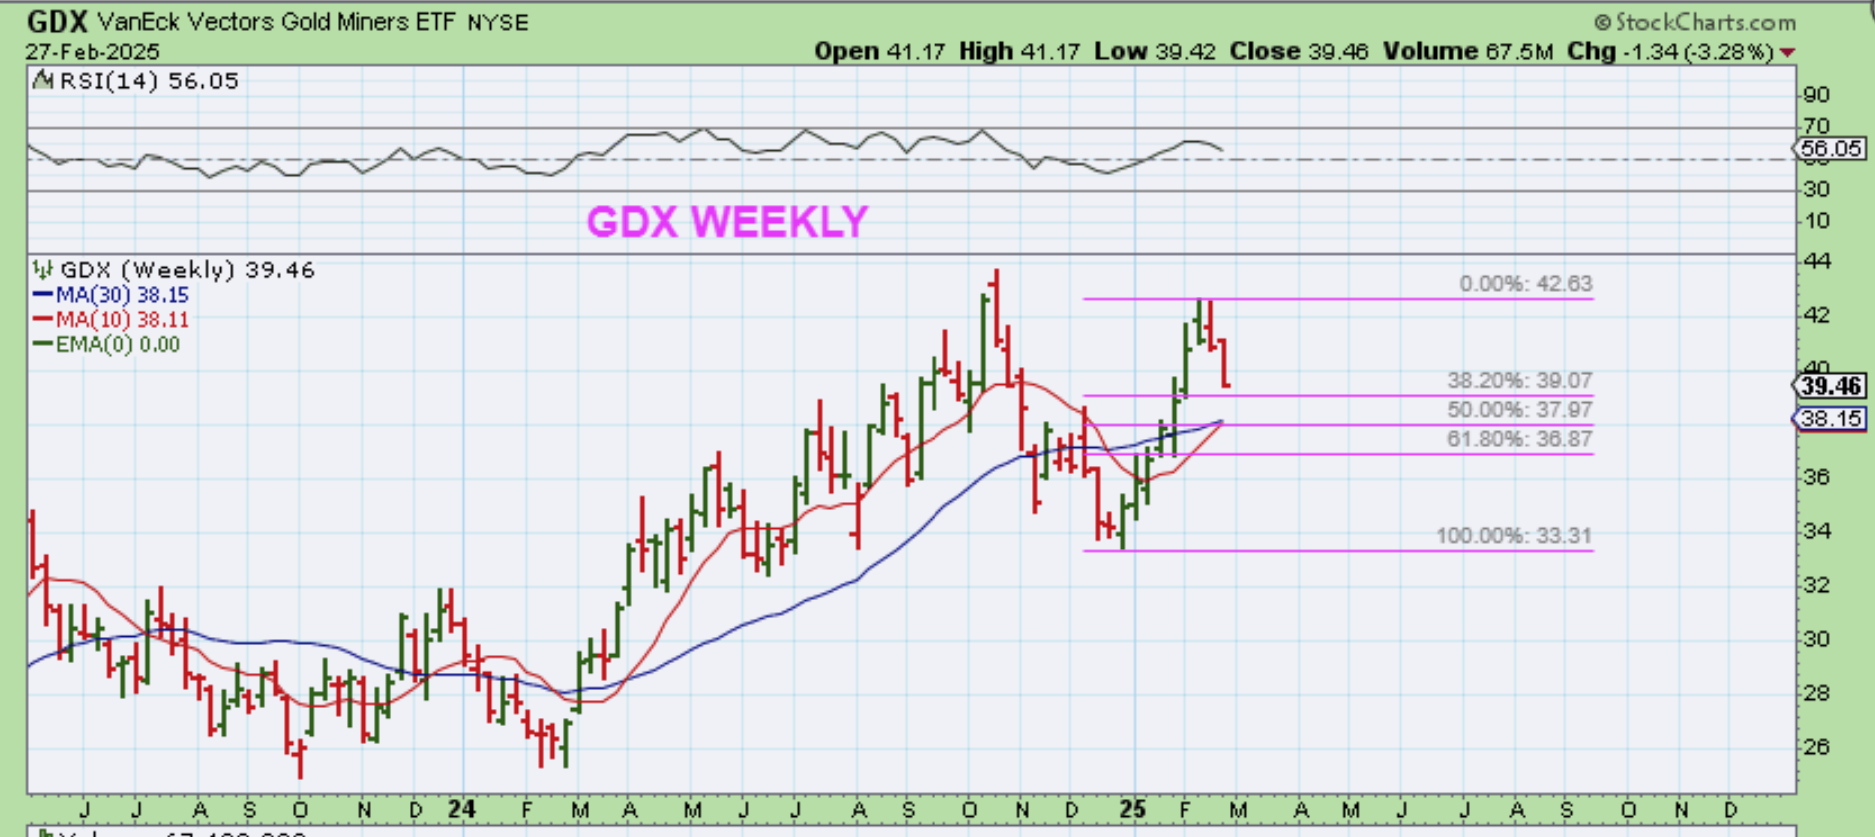
GDX is just shy of the 34 sma and the 38% Fib retrace, so we’ll see if this can just continue higher with a dcl at day 37. I liked what GDX, GDXJ, SILJ, & the Miners did today despite the general market sell off.
.
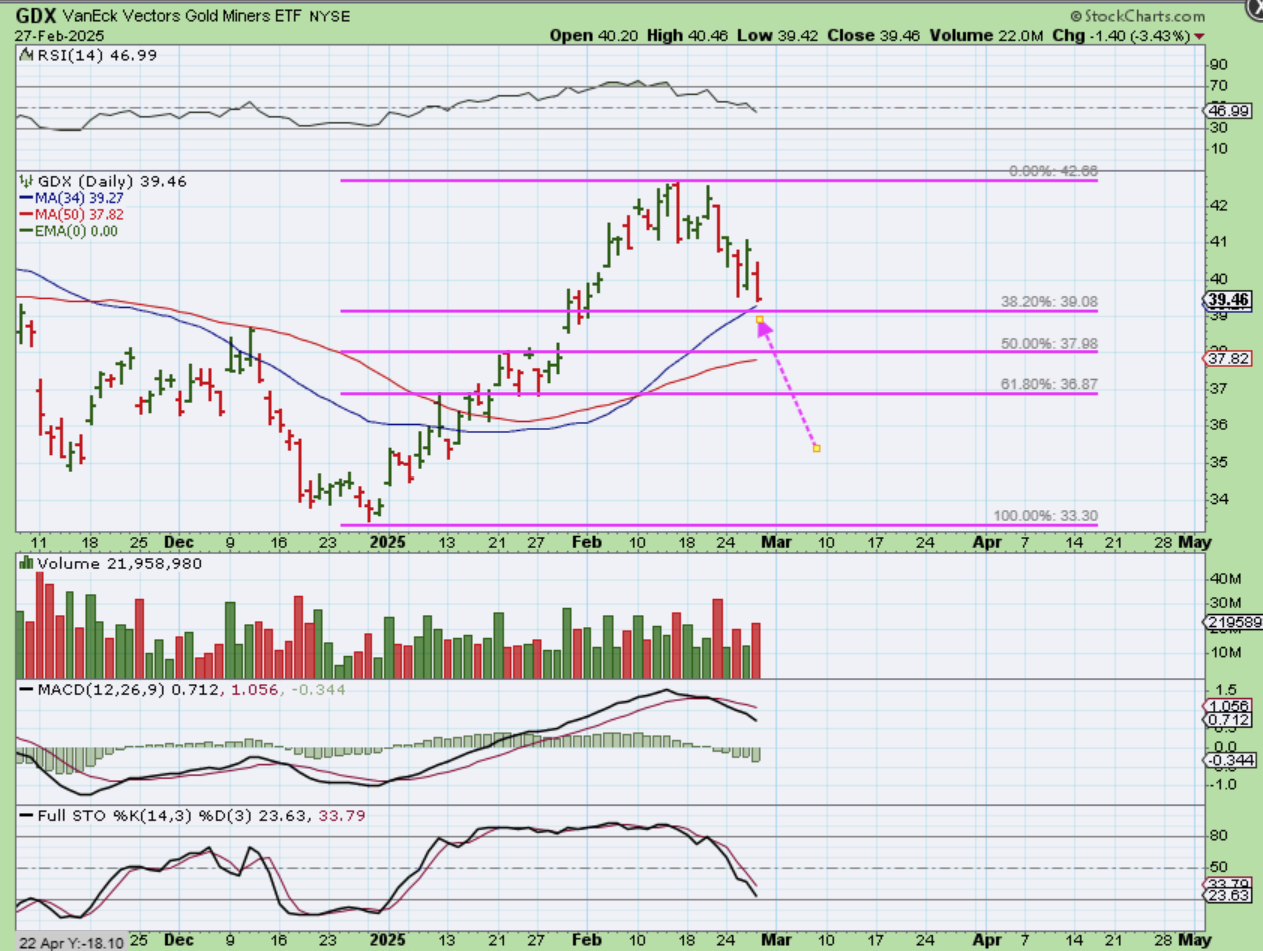
Well, GDX had that nice surge higher on Wednesday but then gave it up on Thursday. It is now actually right at the 34 sma and the 38.2% Fib level. Fridays have not been great for the Precious Metals, so we’ll have to see if that changes or do we possibly even drop to the 50sma / 50% Fib level? The GDX is not fully oversold yet either.
.
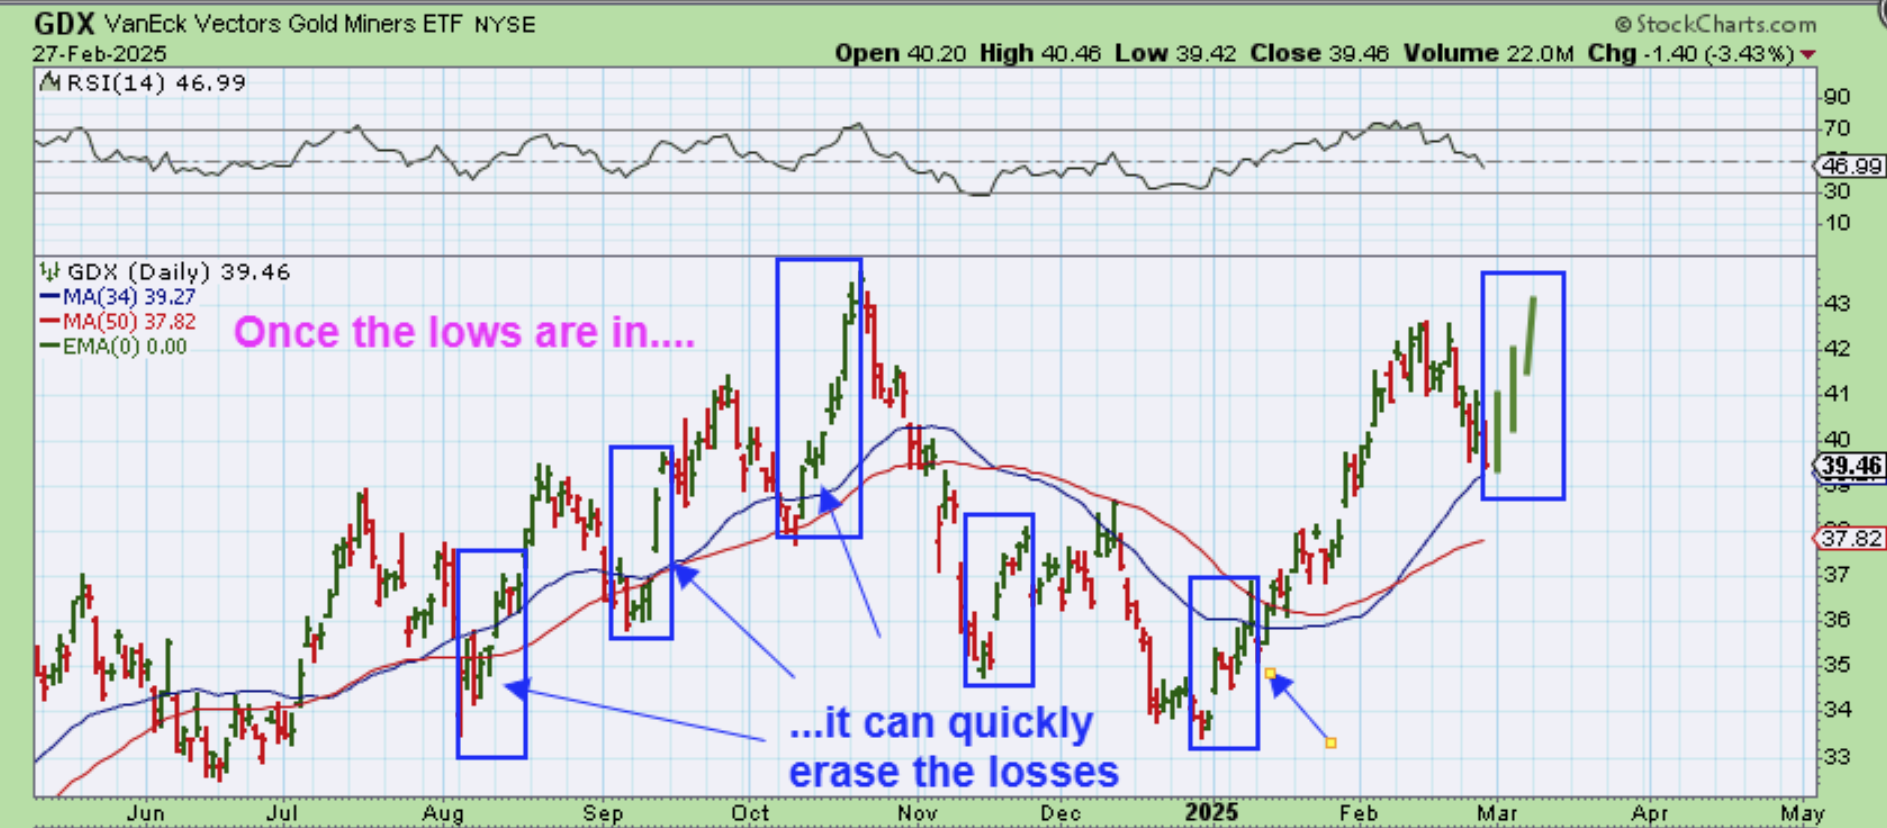
A REMINDER ABOUT THIS BULL MARKET:
These selloffs are very hard to endure as they chop lower and lower, but often we have seen a 5 or 6 day sell down get quickly erased in 2-4 days out of a low with Miners, so that is possible here too. THE GDX would look like this for example.
.
We are at the end of the week and the end of the month, so the weekend report will take a look at those charts for the General Markets and Miners, but right now?…
I just want to say that the Miners do NOT look bad at all on a weekly chart. Normal bull markets often drop to the 10 & 30 week ma, and we are not even there now. This chart remains bullish!
.
Personally speaking, this has been a rough week in the General Markets, Bitcoin, and even the Miners. The SPX made a slight high, so it looked like the ICL was in place and the first daily cycle should only be choppy but not extremely weak. Well, this week the markets became extremely weak, and the Nasdaq and the Soxx actually sold off and broke down with hardly a bounce. The ICL drop appears to be in play now and the SPX broke to a new high prematurely. Gold and The Miners have had a very nice rally, but now we see a pull back into a dcl. This pullback looks normal so far and Miners often will recover the sell off within a couple of days, but it is still difficult to see the selling if you are holding a basket. If you bought at the lows, you are losing your gains. If you bought later in ‘the rally that seemed like it would never end’, it hurts, because you are losing invested money. Hopefully, we see a bottom soon and a quick rally that will erase the recent selling. If memory serves me correctly though, Fridays have been weak lately, but that can always change. We’ll see, enjoy your Friday and weekend!
.
~ALEX
FROM THURSDAYS REPORT:
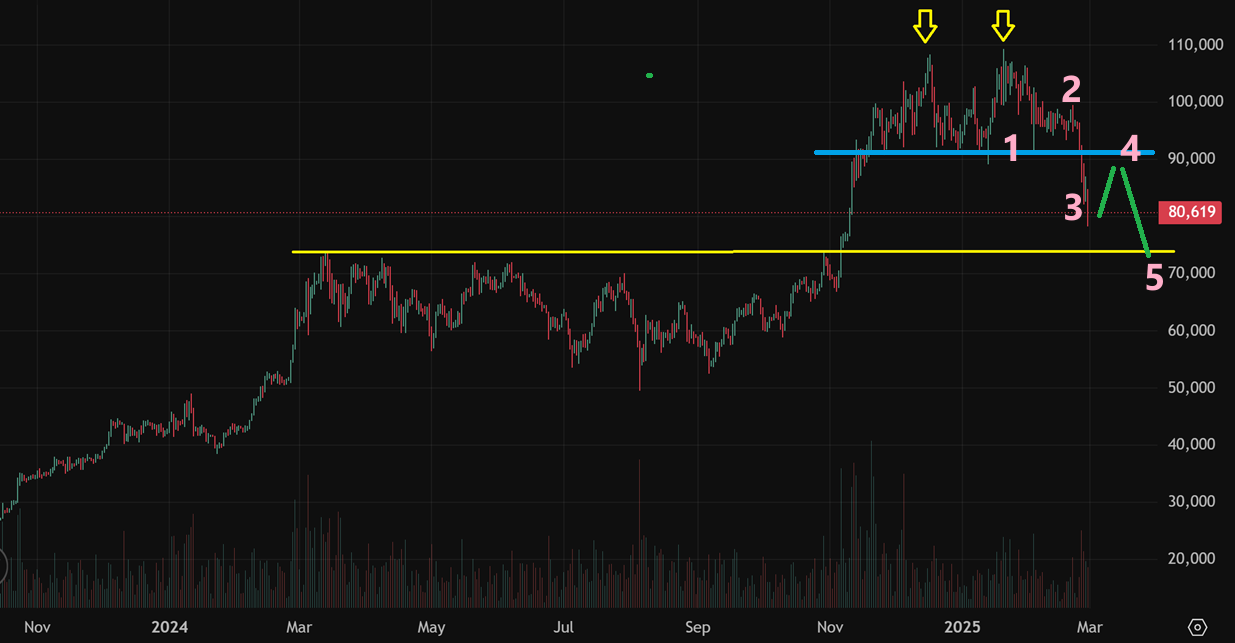
BITCOIN is breaking down with plenty of time left to bounce and then sell off again. Day 44 also dipped lower. Please read the chart, I think that it is just too early for a meaningful low, but a bounce & drop is possible.
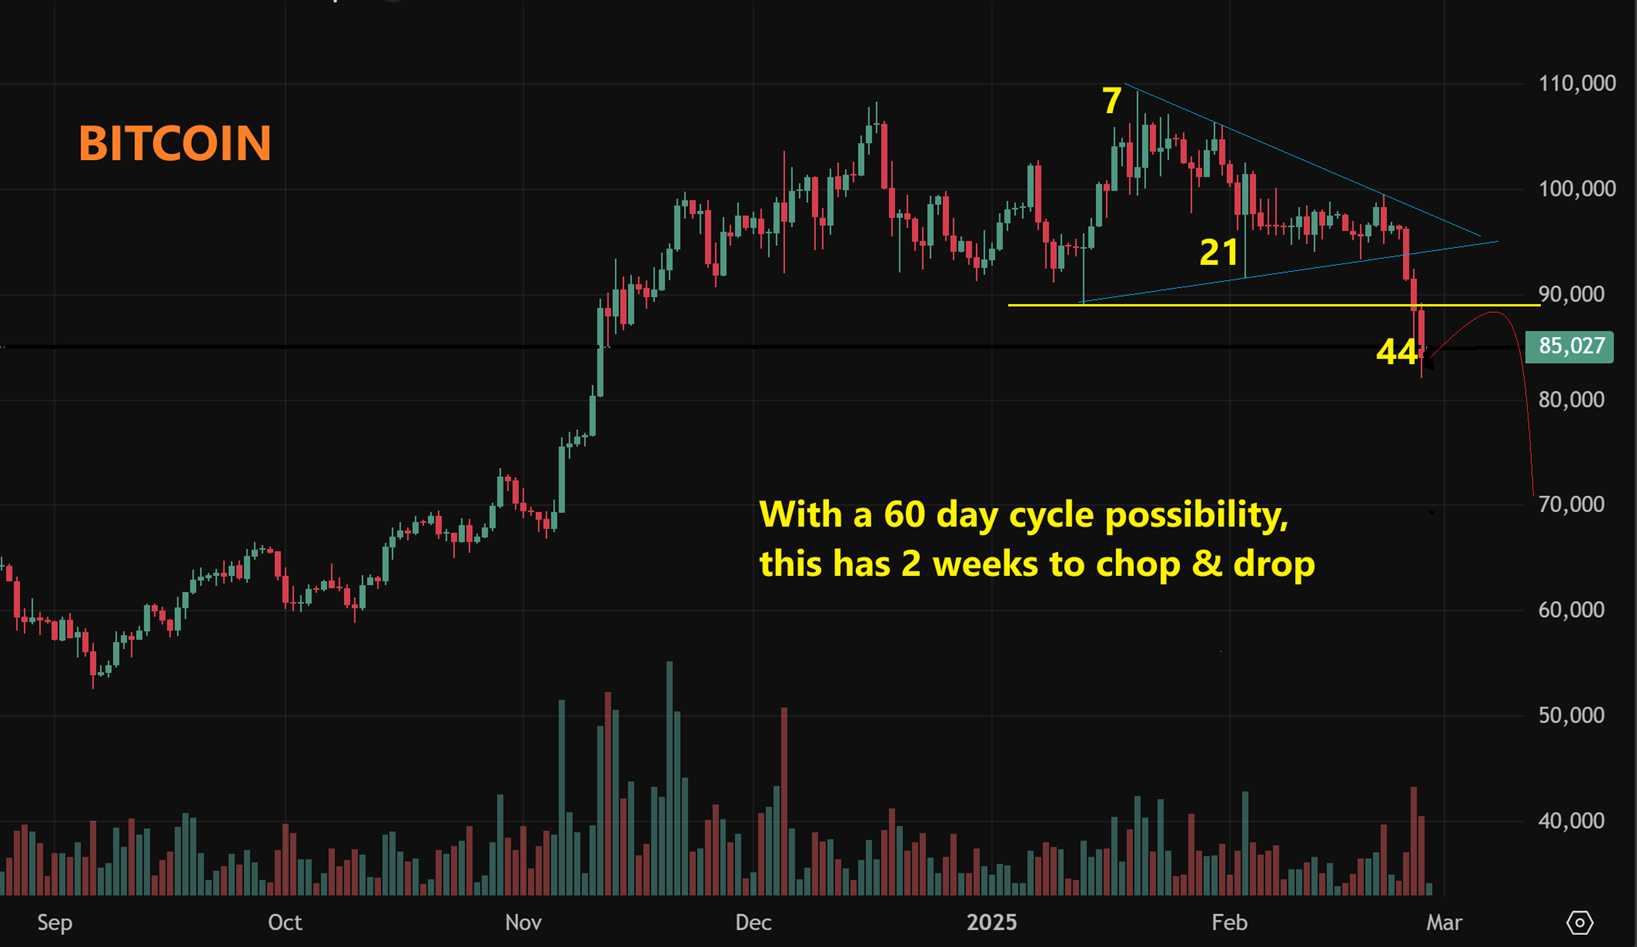
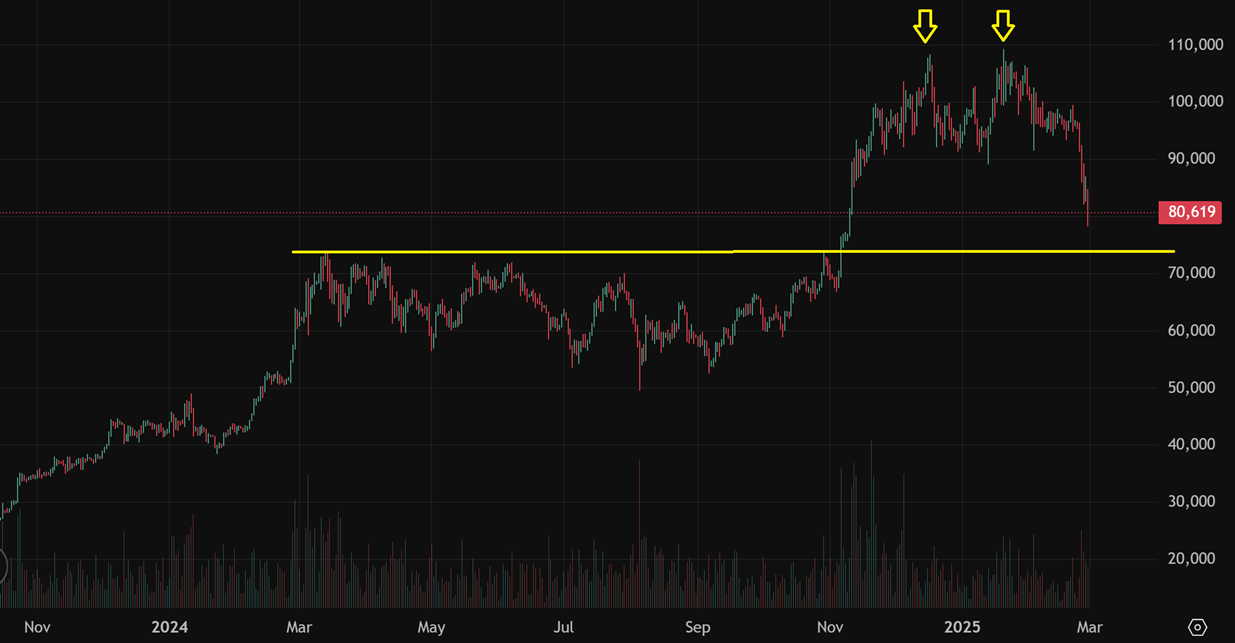
BITCOIN: Before Bitcoin really broke down, I warned that I thought I was seeing a possible double top forming, and the MACD seemed to confirm that. A break below the recent lows was bearish. This week we saw Bitcoin break those lows and the sell off pretty much straight down. Support might be in the $70,000- $75,000 area.
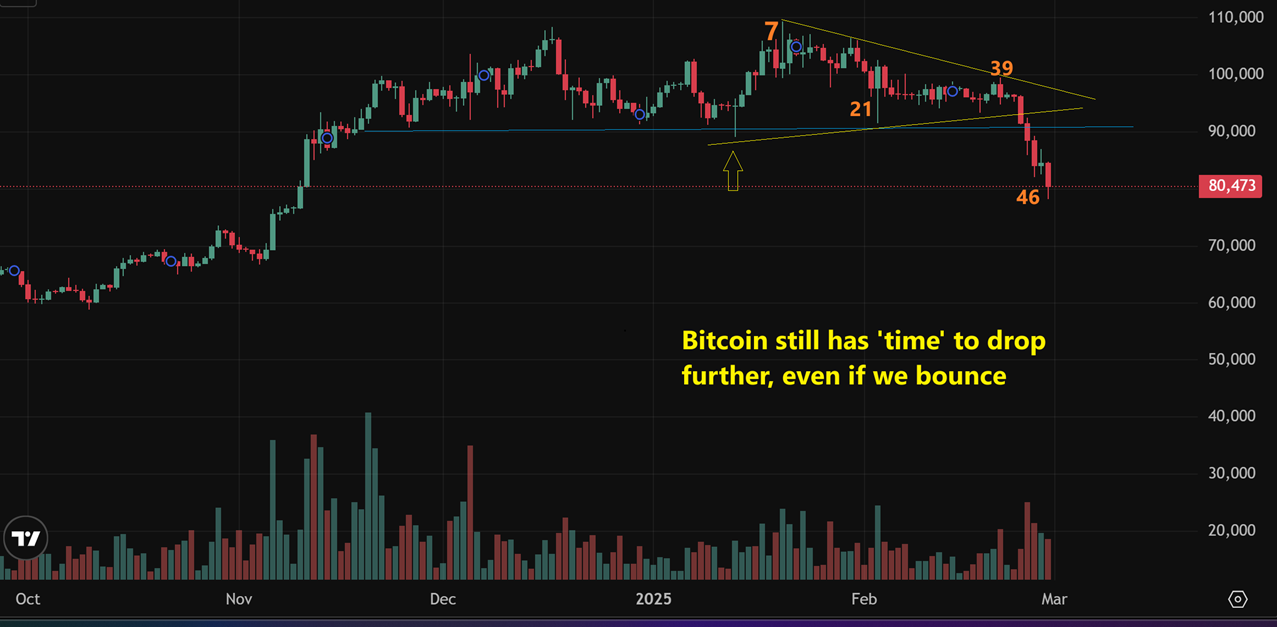
BITCOIN is only on day 46 of a possible 60 day cycle from that recent low though. That means that a bounce could then drop and double bottom or break to new lows again. So as a guess: Bitcoin could bounce to $90,000 and still fall to $70,000.
.
So as a guess: With the ‘time’ left in this daily cycle
Bitcoin could bounce to $90,000 and still fall to $70,000 in a 5 wave drop. That is just a good possibility.