February 23 Weekend Review – Normal Dips?
Note: I want to release this Sunday morning and I won’t have time to proofread it, so please ignore typos and feel free to ask me questions below if something isn’t clear. Thanks!
.
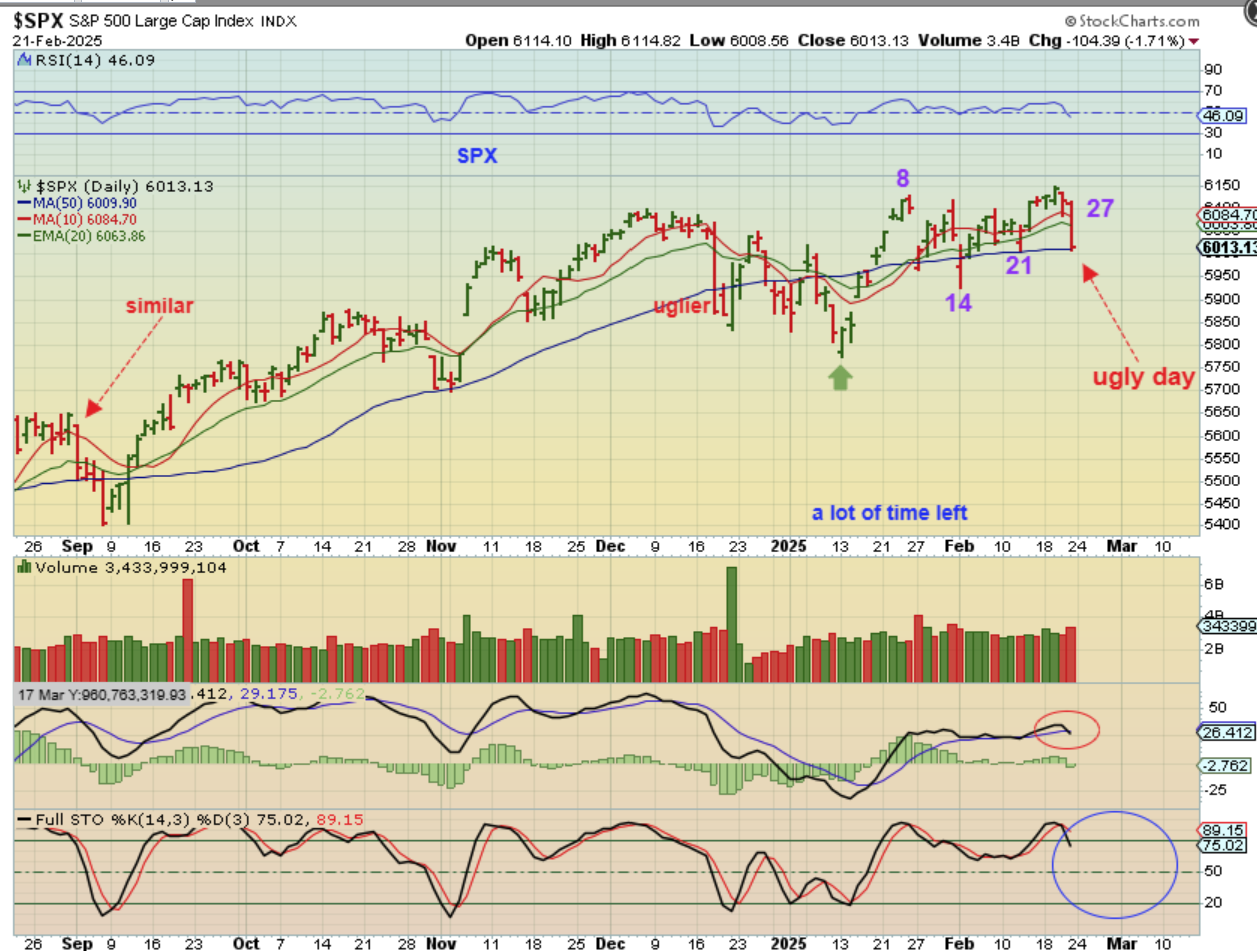
THE SPX was finally getting some traction and made a new high above day 8, but Friday saw it sell off all day long. IT closed at the 50sma. So…
.
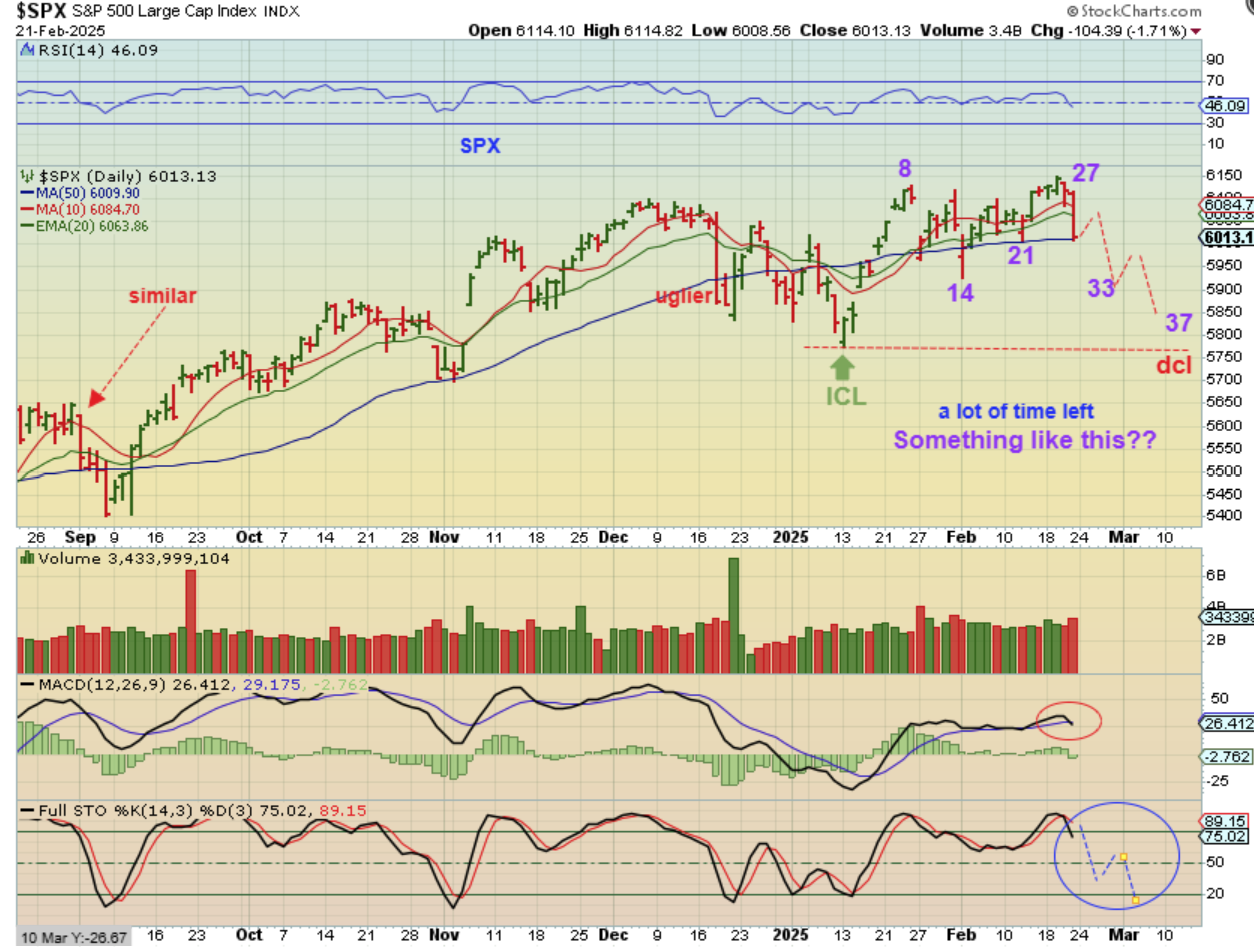
We could now be seeing a dip into the first daily cycle, but that can take over 35 days, so I have drawn a bit of a choppy sell off. The SPX landed on the 50sma and it may bounce and still chop lower, we just can’t tell exactly how it will play out, but we do know that if we have an ICL, THAT LOW should not be broken. Is this bearish? Not necessarily. Now take a look at this…
.
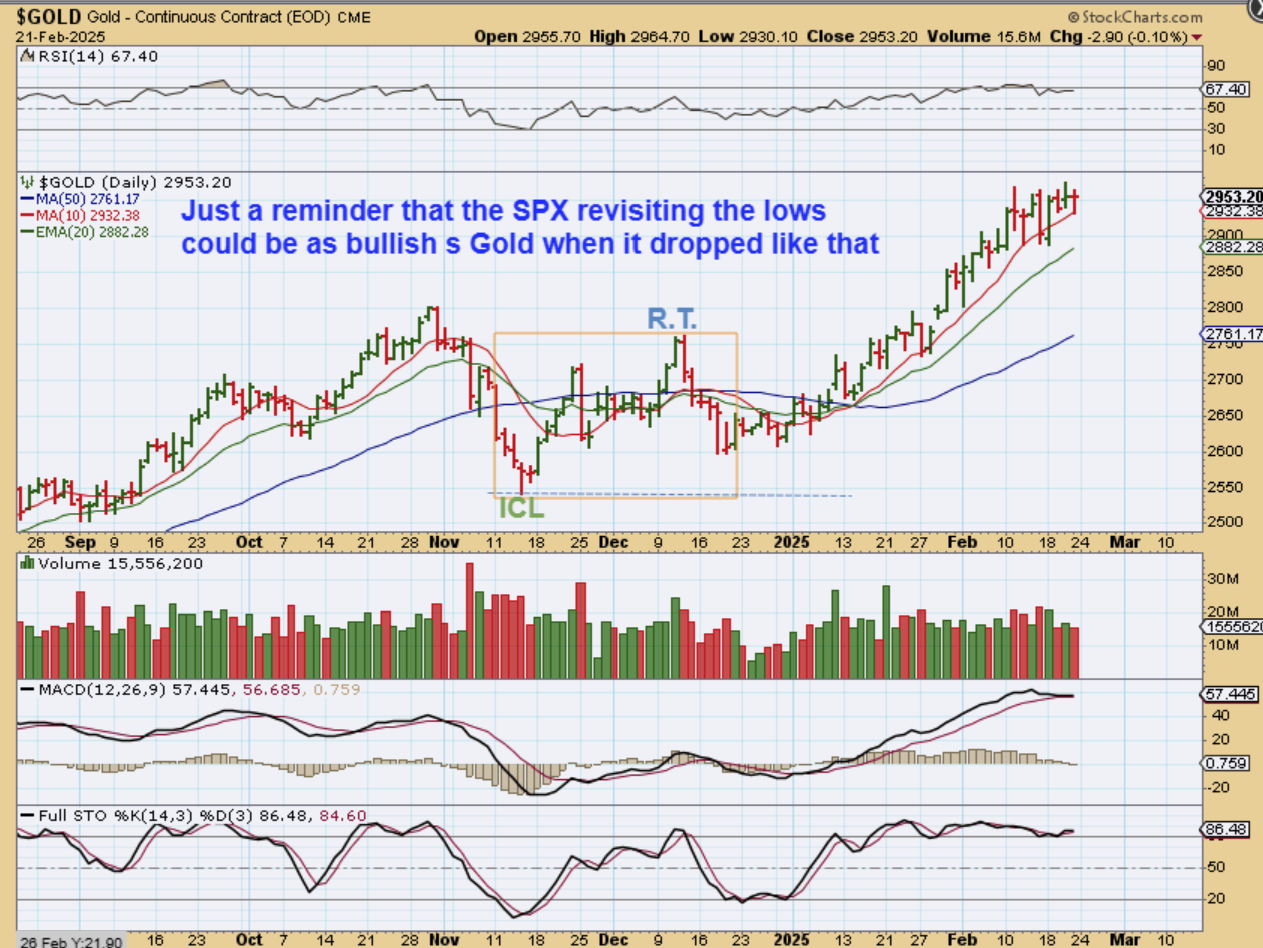
Is it bearish when price drops back to an ICL? Well take a look at Gold recently…
.
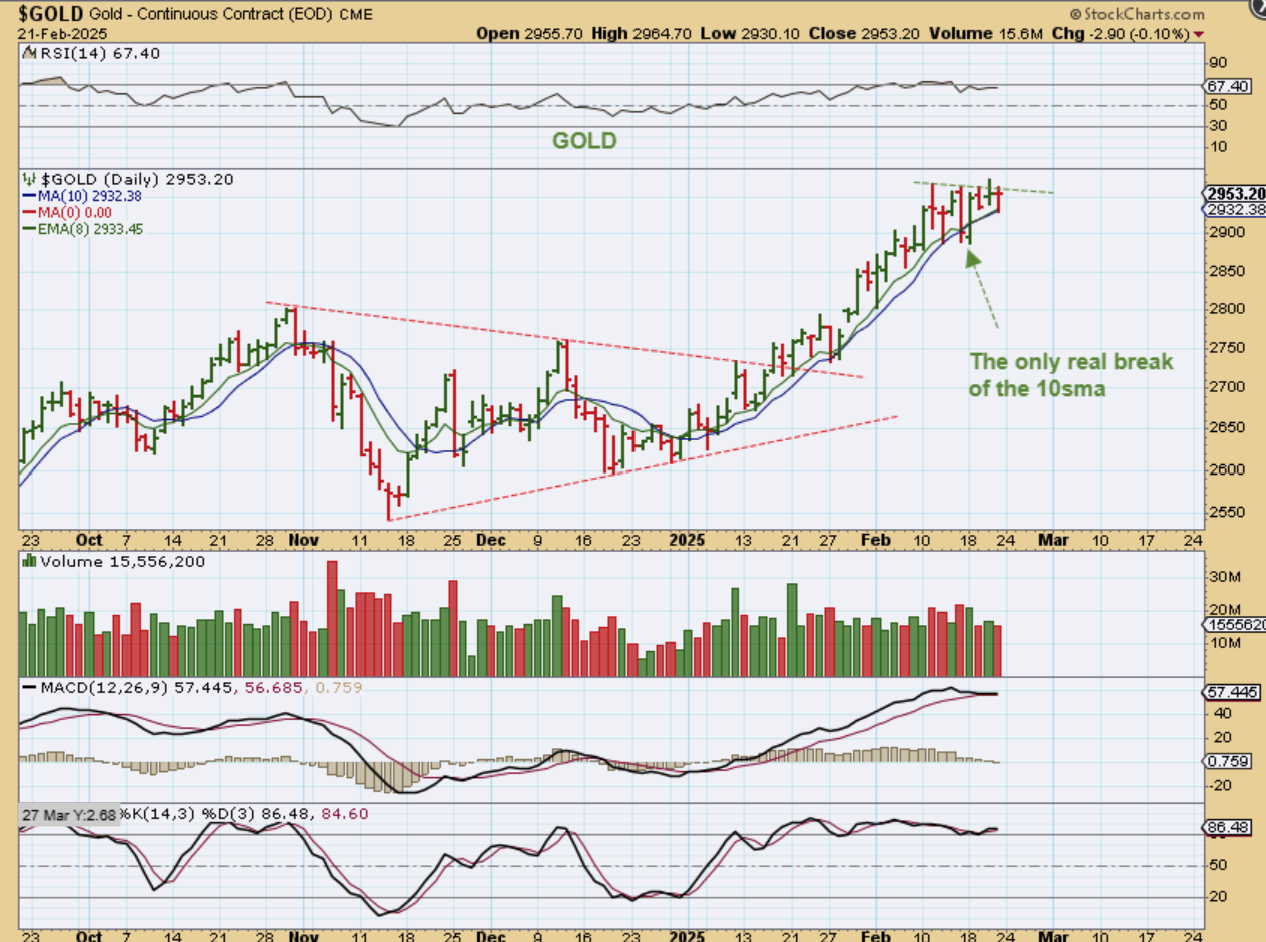
TAKE A LOOK AT GOLDS day 7 plunge and then the day 19 -day 24 sell off. That brought price back toward the lows and GOLD looked weak, but what happened after that? It chopped higher out of that low and then never broke below the 10sma, so this is my reminder: The markets have been choppy, but they can stabilize out of the next low.
.
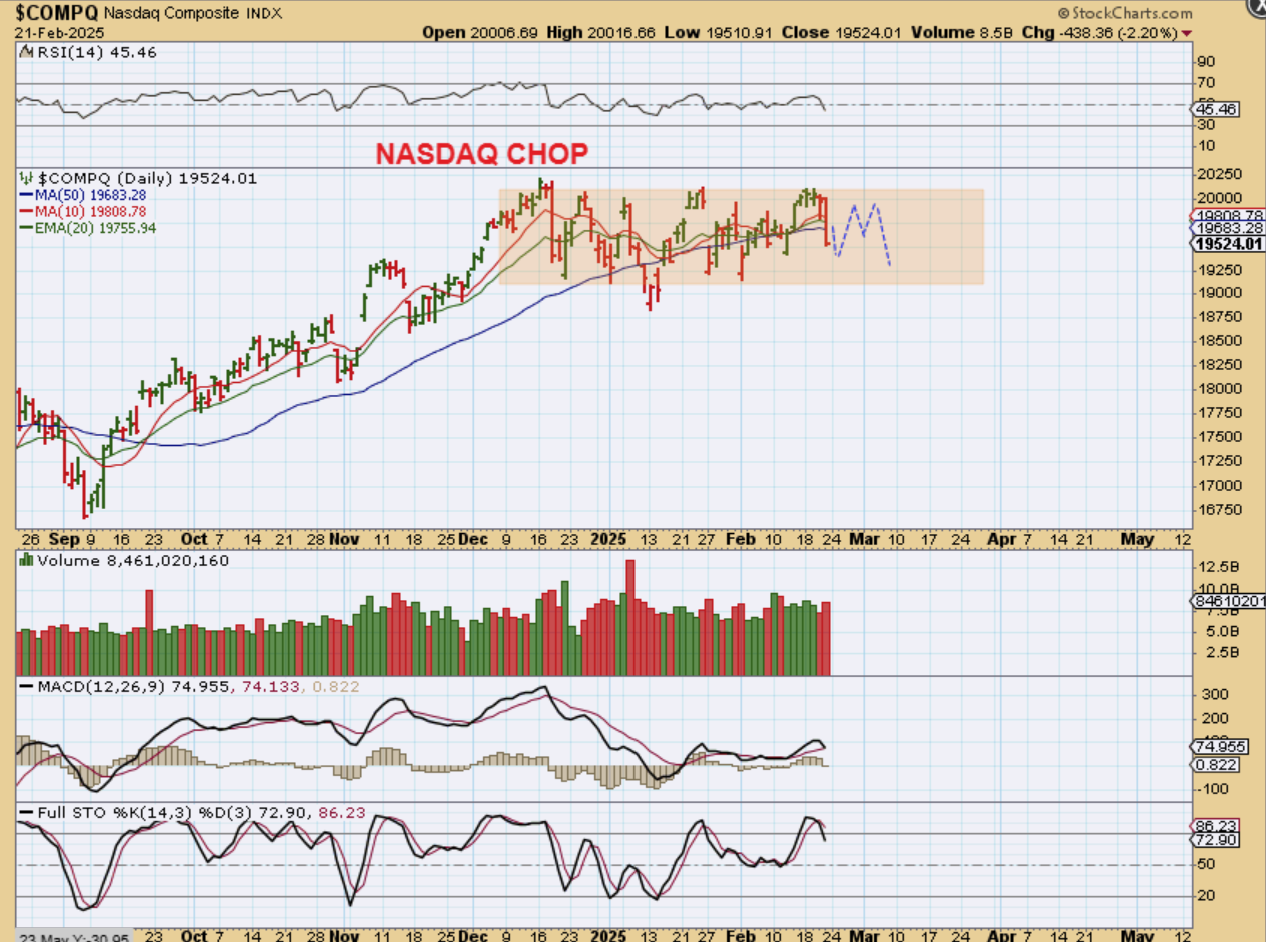
THE NASDAQ dropped 2.2% on Friday too. It lost the 50sma, but Gold lost the 50sma in the ABOVE chart too, so right now we have to let this VERY CHOPPY first daily cycle play out and then see what we get over time.
.
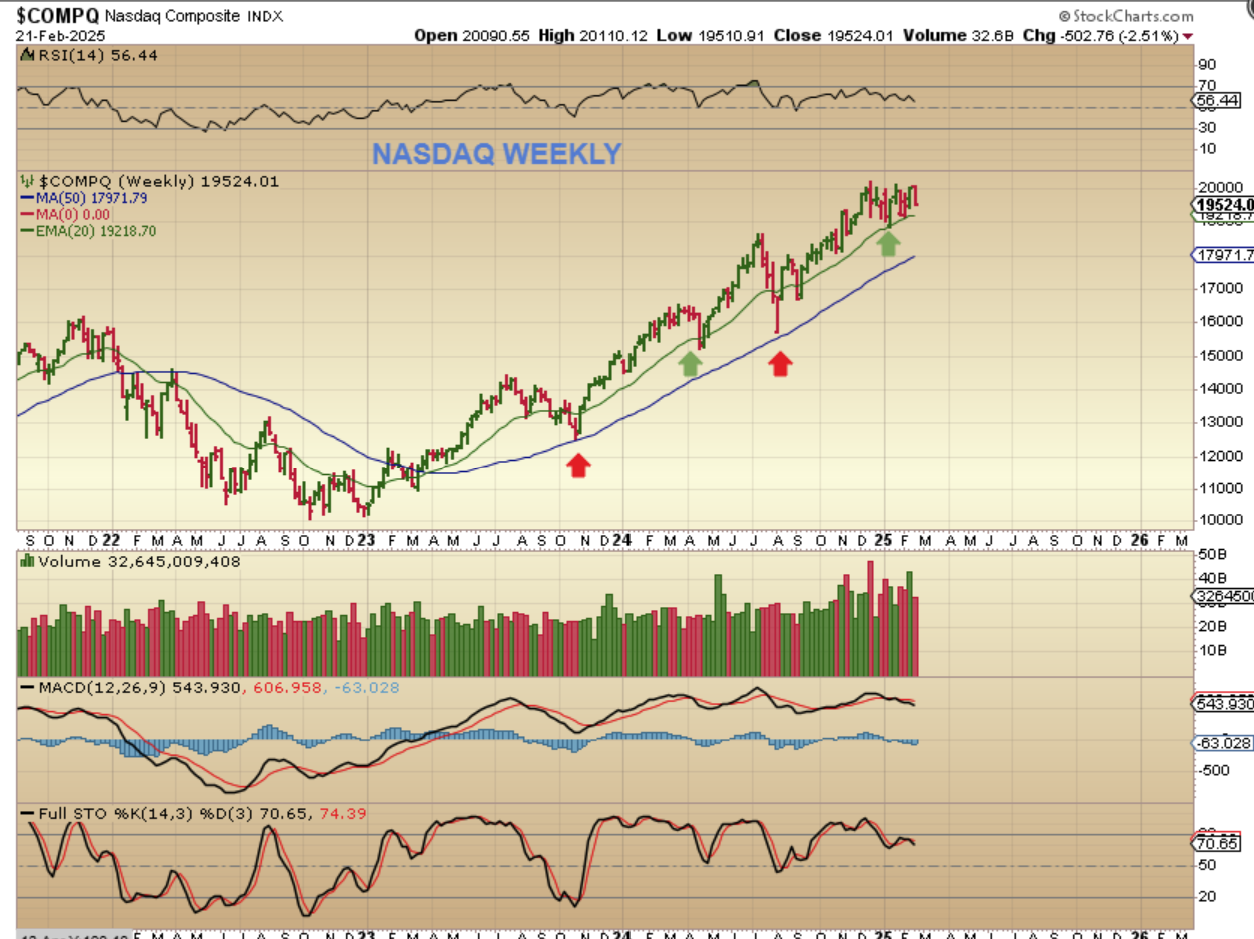
THE WEEKLY NASDAQ CHART has price still above the 20 ema. Prior ICLs dropped to the Green 20 ema or the deeper sell off to the blue 50 sma. All of this sideways chop has been a bit frustrating, but it hasn’t ‘broken ‘ the set up.
.
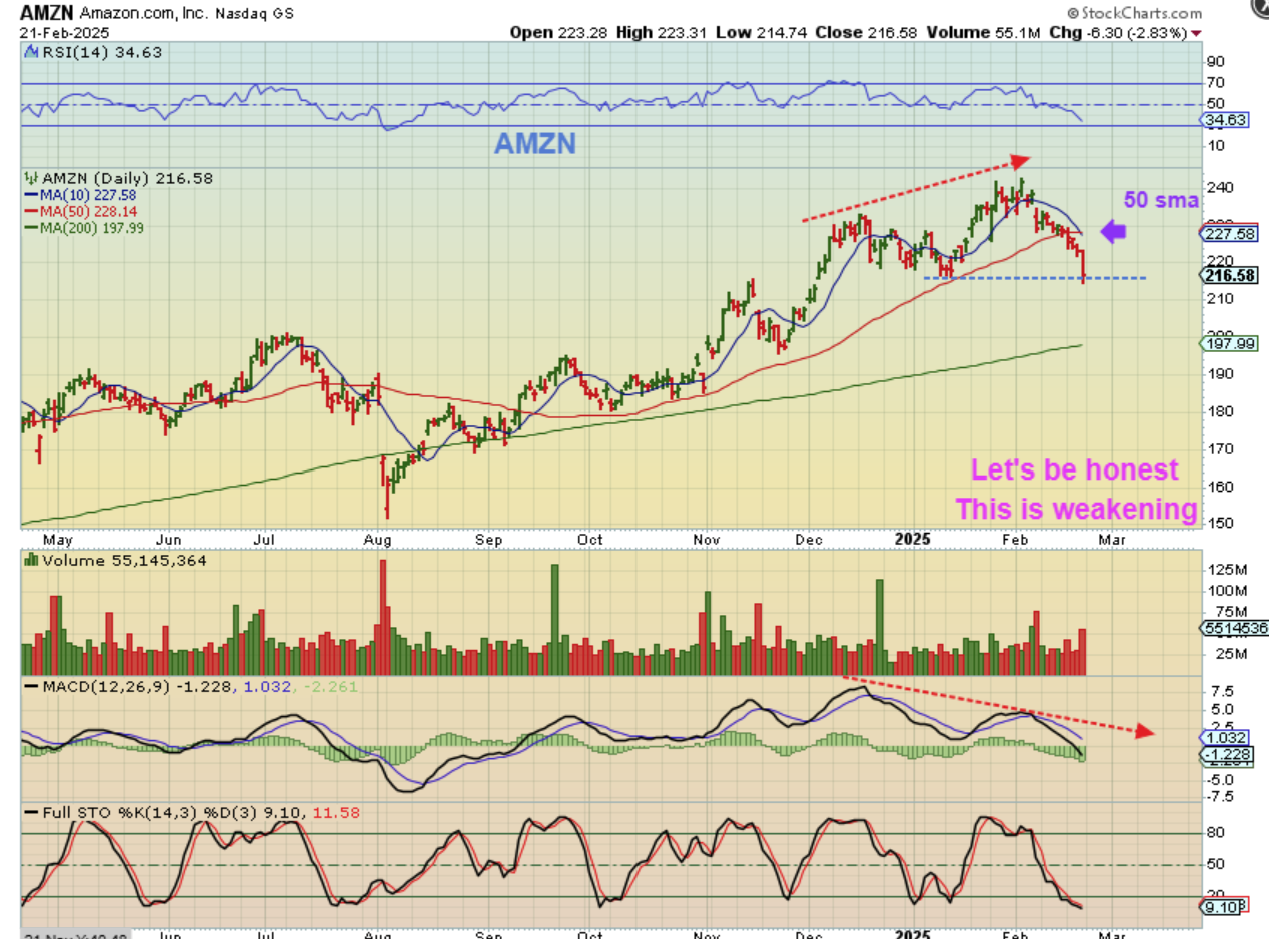
I will say this: All of this sideways chop has been a bit frustrating, but it hasn’t ‘broken ‘ the set up. That said, some of the former runners aren’t pushing higher, they are lagging too.
Some now look a bit bearish actually. AMZN, GOOG, TSLA, and others look weak, while PLTR, GRRR, UPST and several others look bullish. I’m going to continually watch my watch list and see if weaker ones get stronger, or do the stronger ones weaken?
.
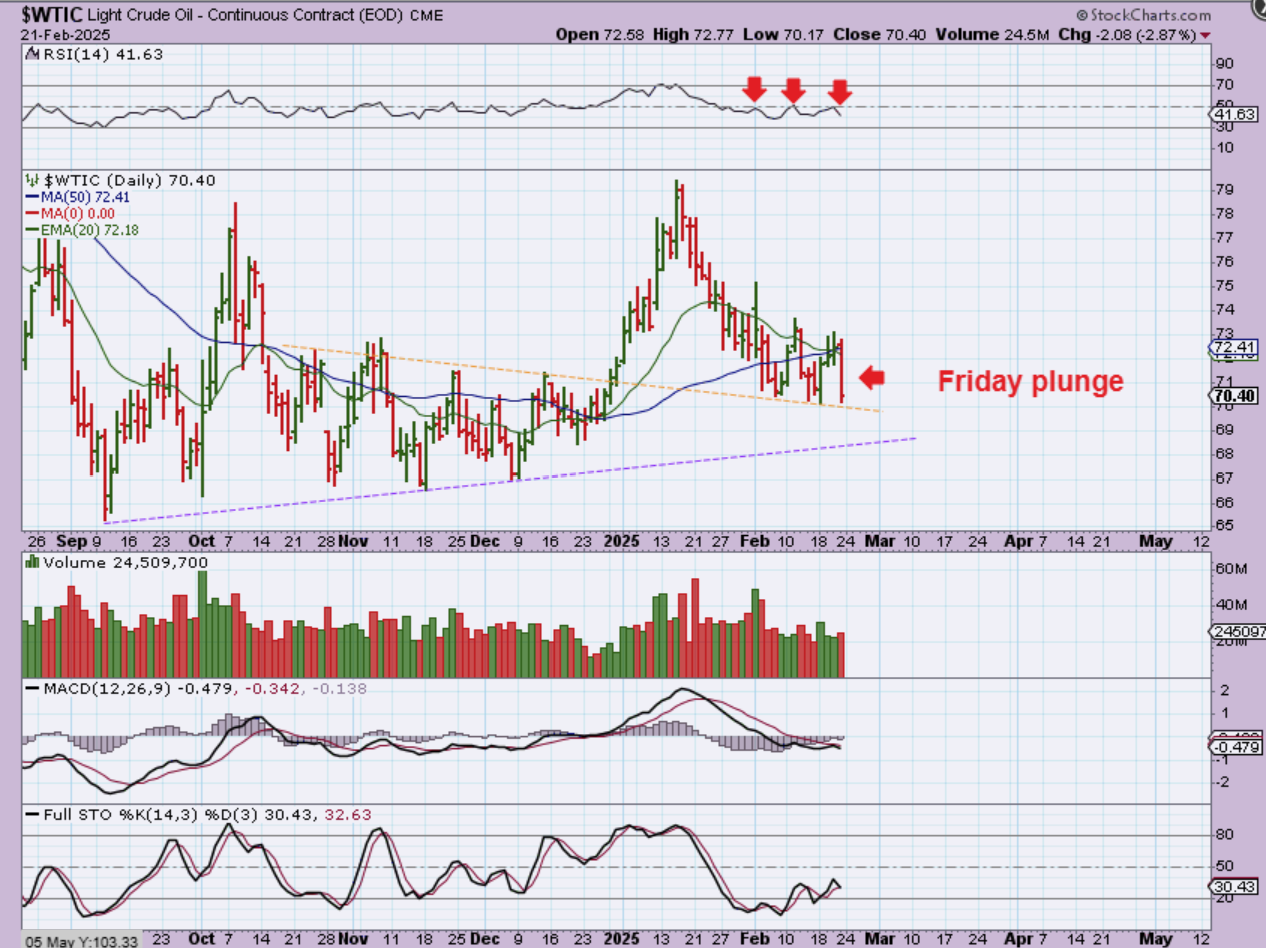
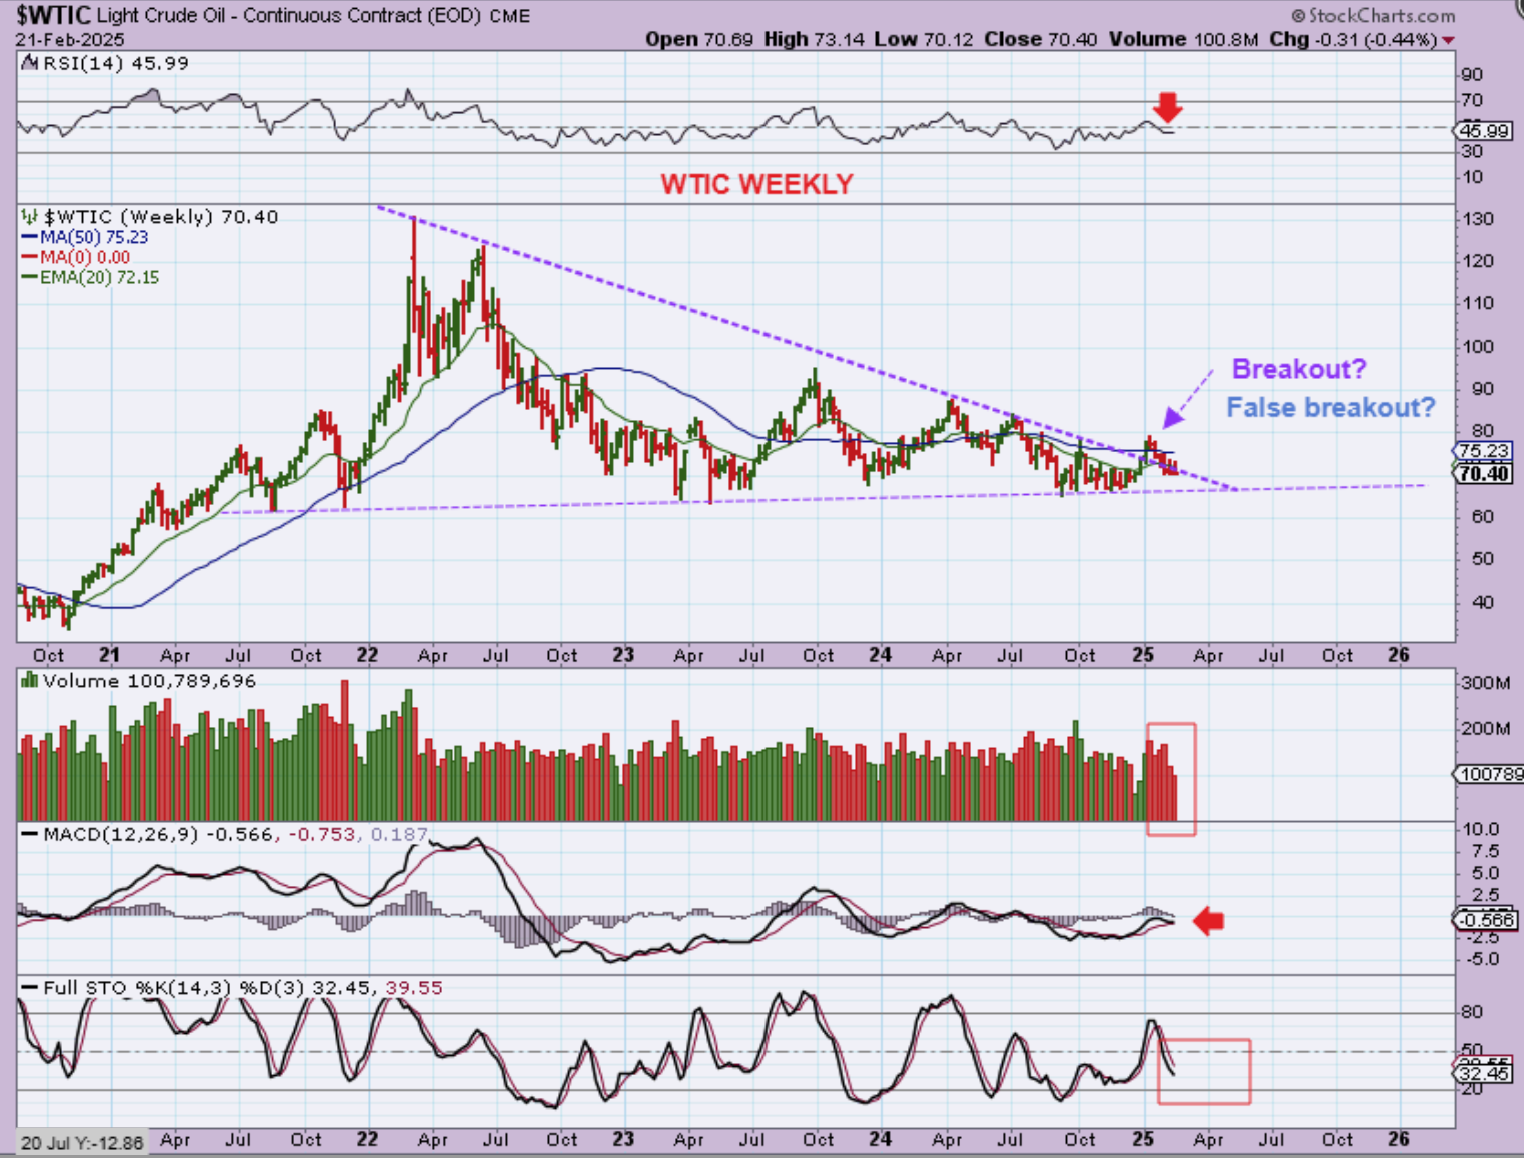
WTIC – Oil joined in on the sell off and is threatening to break down. The question here is still: Did we get a dcl that peaked already or are we now overdue for a dcl? I mentioned 2 weeks ago that we possibly had a dcl and it peaked on day 3. This would now be about day 52, but that IS still ok for a dcl in Oil, so we’ll see if this selling dries up or not. Oil has been extremely choppy.
.
WTIC WEEKLY– This now looks like a breakout and a back test(?), or a false break out that will now break down. There is more room for selling in the Stochastics, so we could see a failed daily cycle and a breakdown. We just need more time, so I wouldn’t be long or short here yet.
.
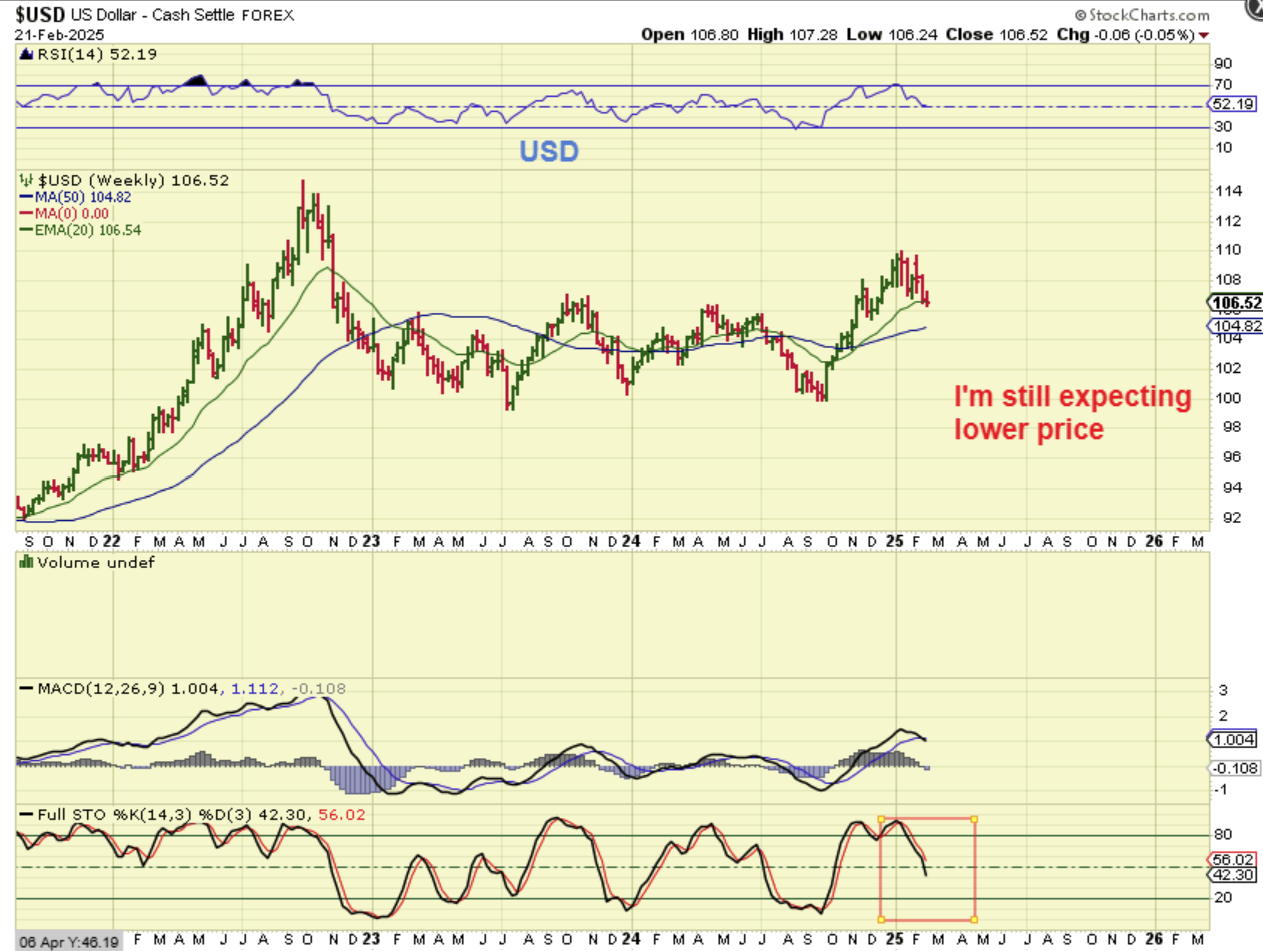
THE USD WEEKLY – I am still expecting price to continue lower here.
.
GOLD dropped and bounced back and remains strong. Not much more can be said about a chart where price barely breaks the 8 ema / 10 sma. It is very strong, but that recent dip below the 10sma could be sort of a low that has now formed in a pennant. Gold remains bullish until we see a real change.
.
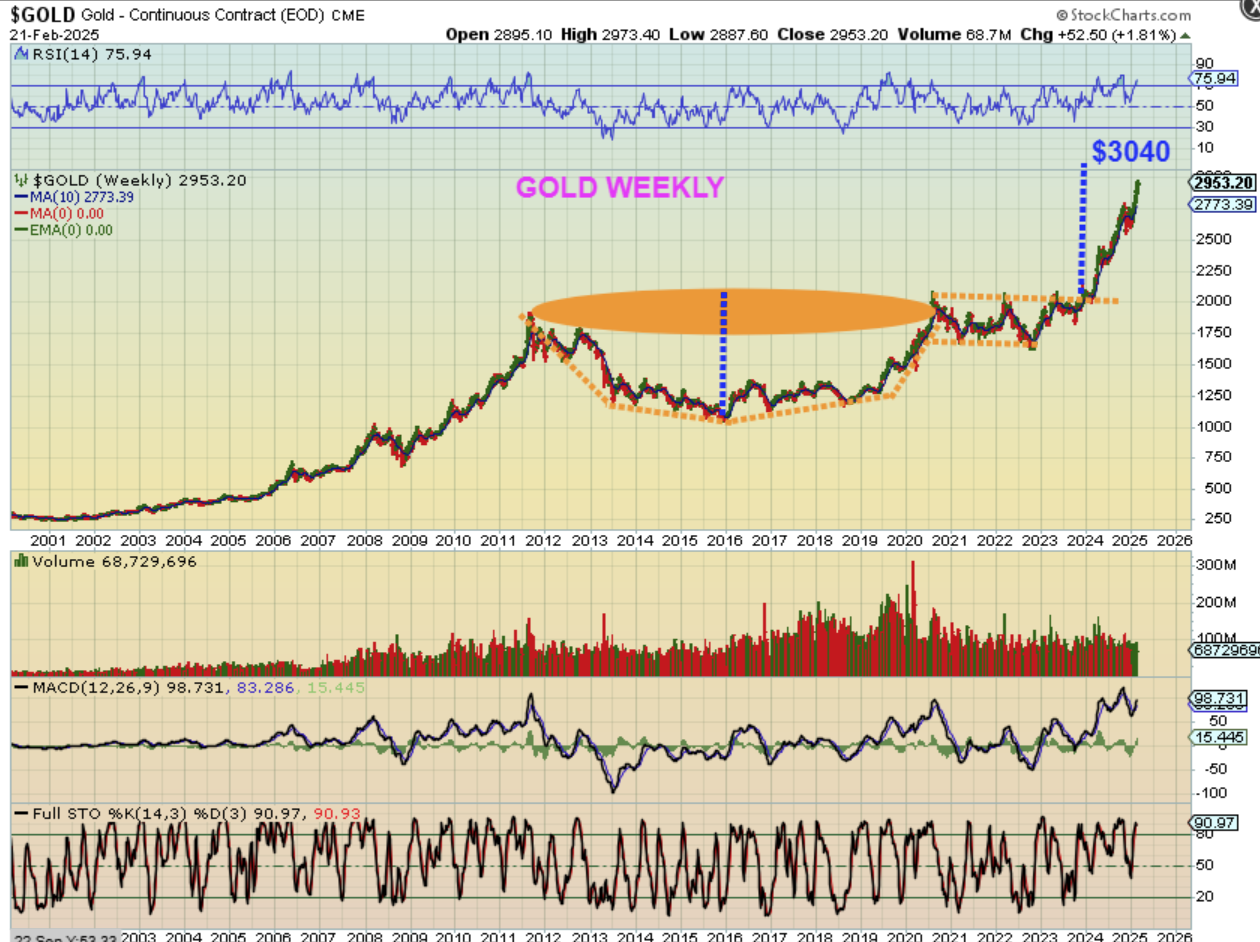
GOLD WEEKLY – I’ve mentioned that I had a target of $3040 originally for the Cup & handle upside target. That still has not been met, yet. The problem in my mind is that if Gold peaks at $3040 in the next daily cycle, what happens to Silver? I thought that it would be in a strong rally by now.
.
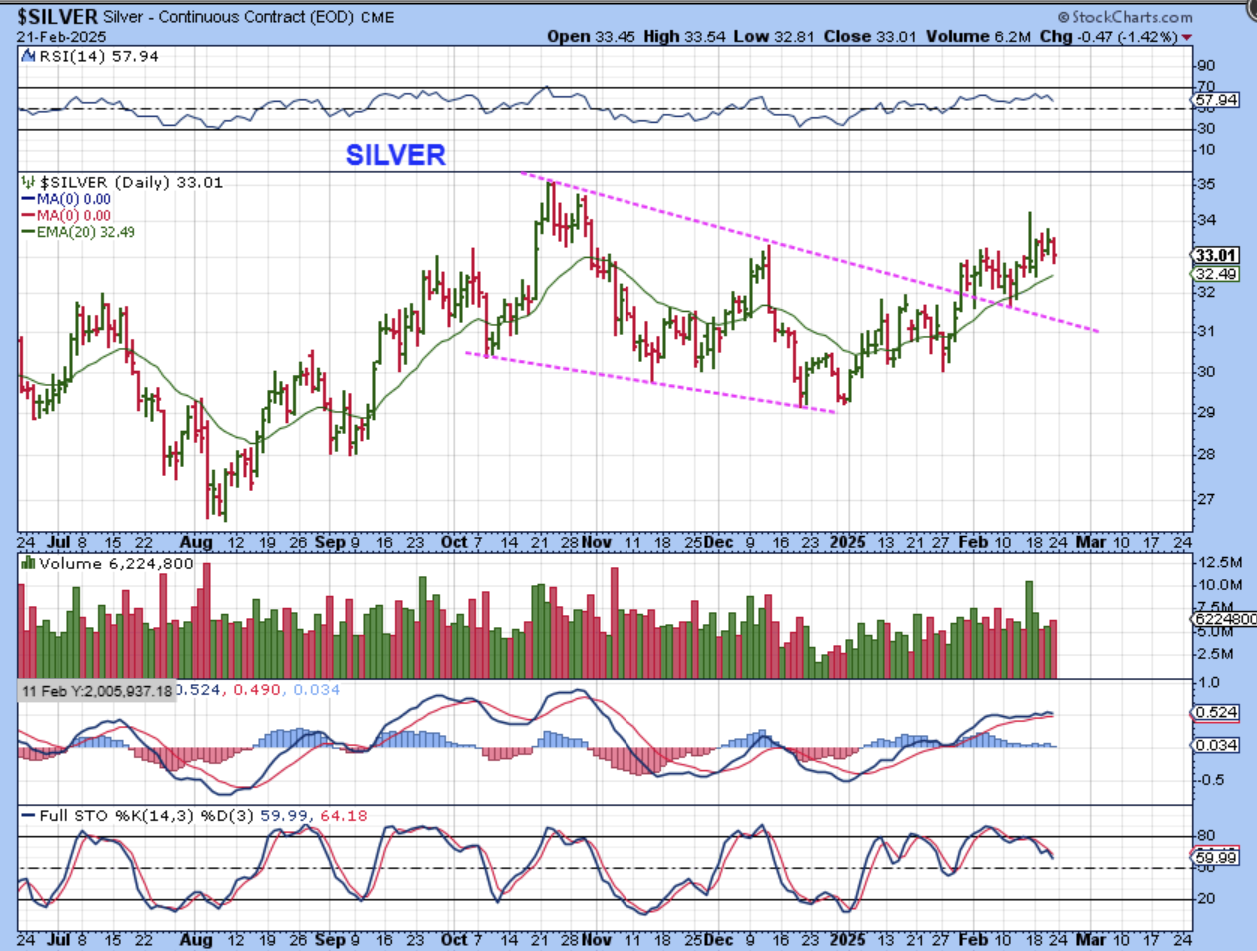
SILVER has not been in a strong rally, even after leaving behind an ICL. Silver remains choppy and difficult, so lets take another view of it.
.
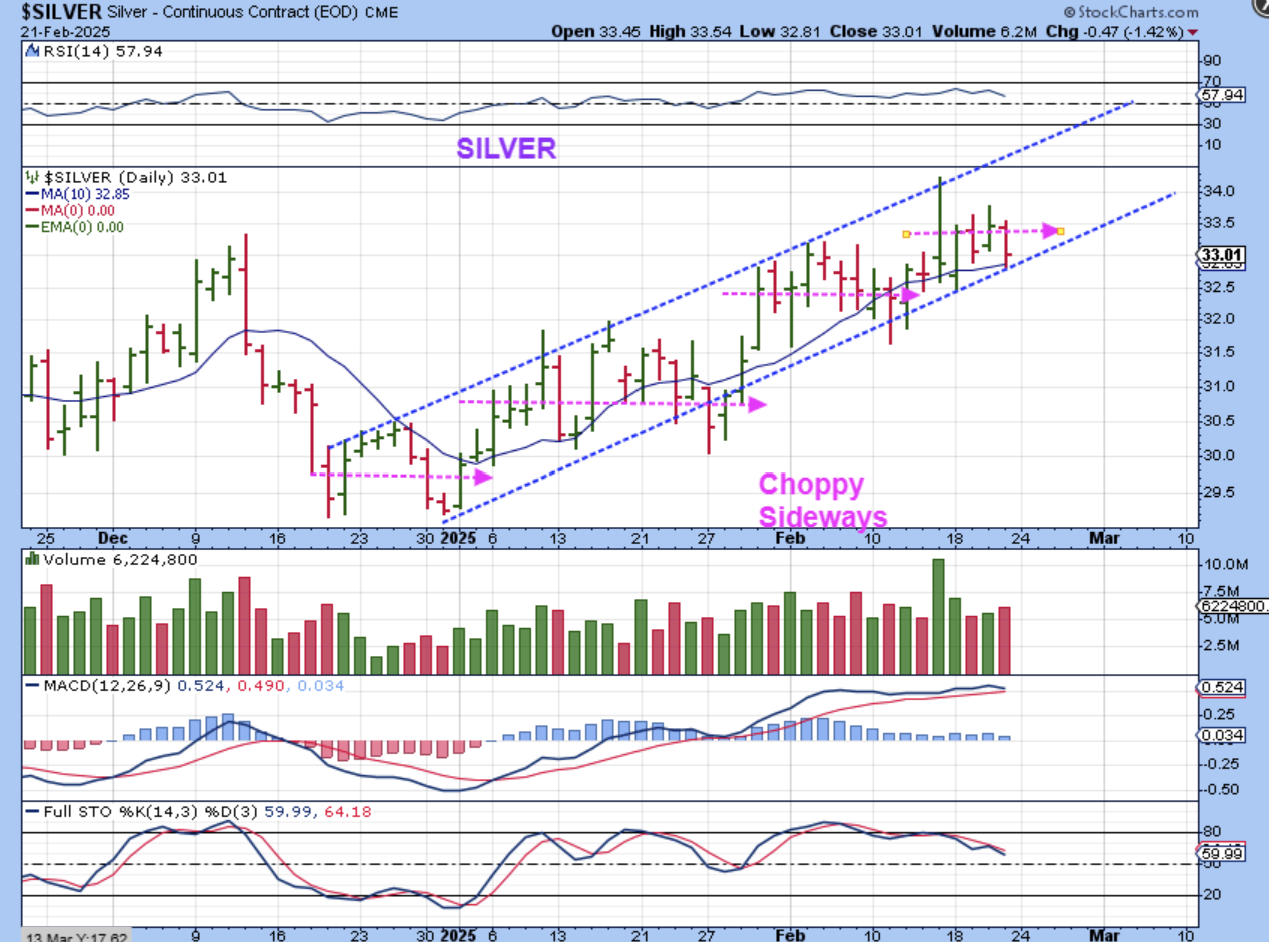
Looking at SILVER this way in an upward channel, I am still just seeing moves to higher highs, but again, it is mostly a sideways chop that we see week after week. This is very frustrating and I have been chopped about in my silver stocks too. They are off of the lows, but can’t hold on to the gains.
.
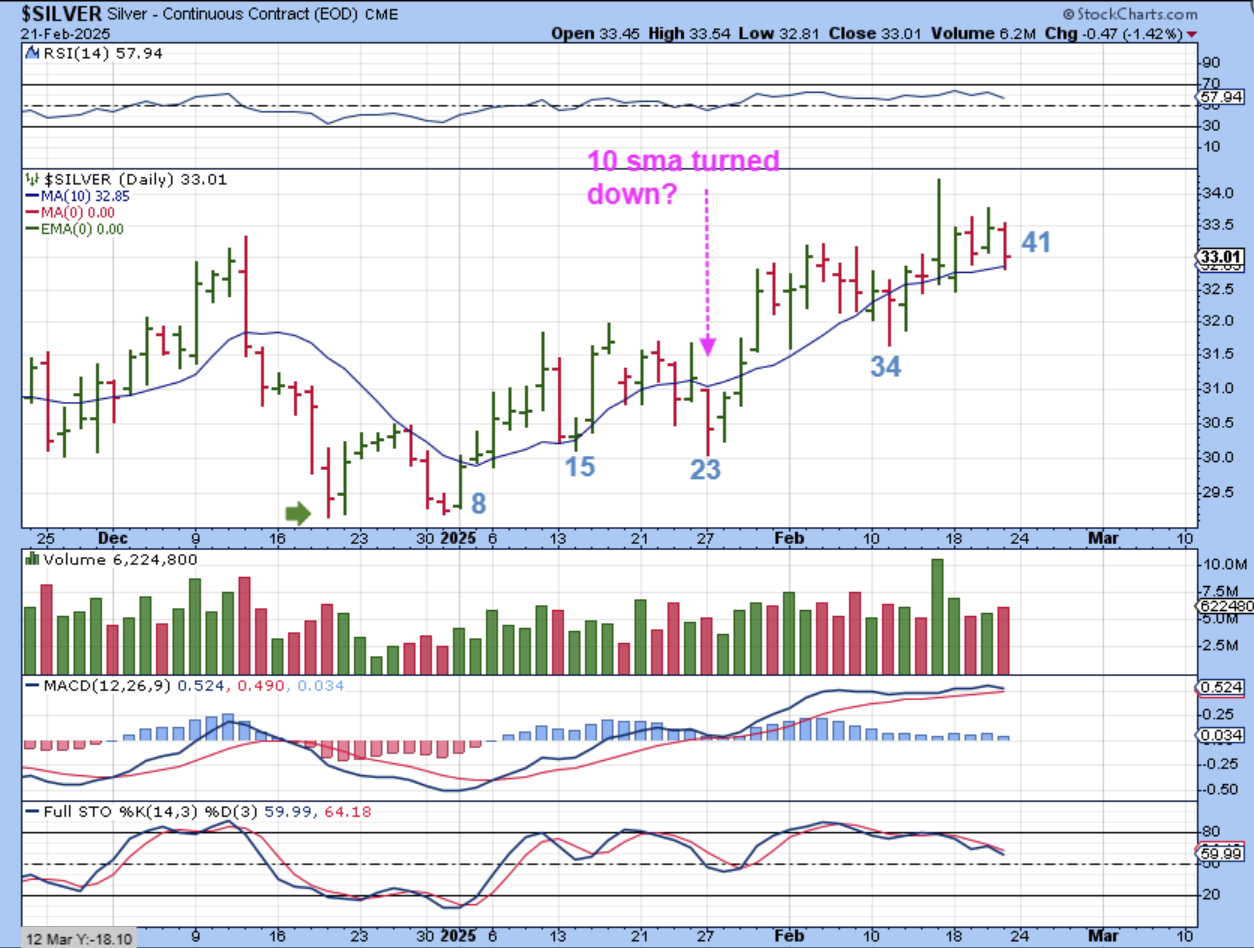
When I look at SILVER to find a dcl, it is too choppy to know for sure, so here I am simply going to count “How many days do we have out of the lows?“, knowing that roughly 30 days would be a dcl.
So we now have 41 days out of the very low. Was day 23 a half cycle low and day 34 was a dcl? That could be, if I look at it this way, but things really are not clear in the wicked chop that we see.
.
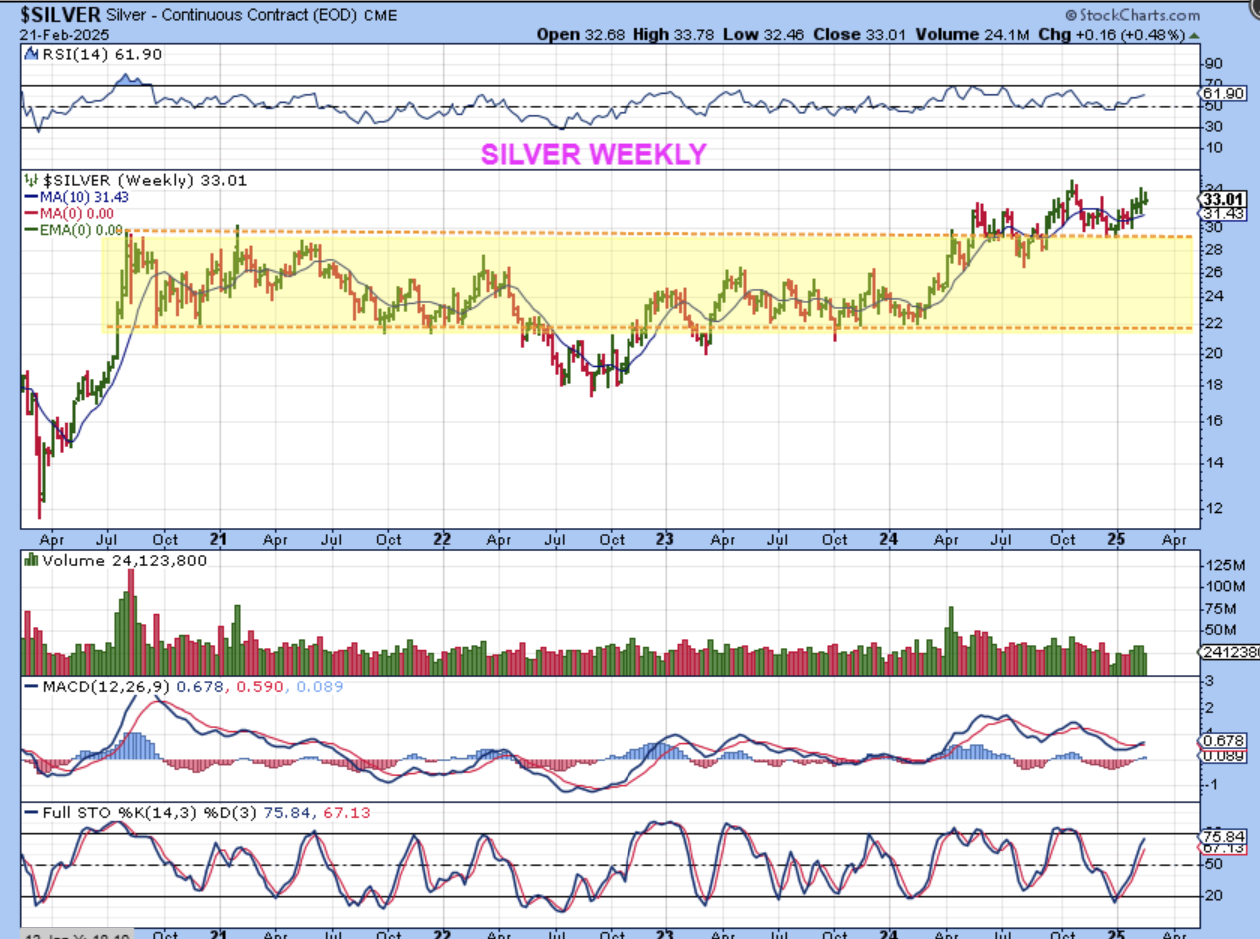
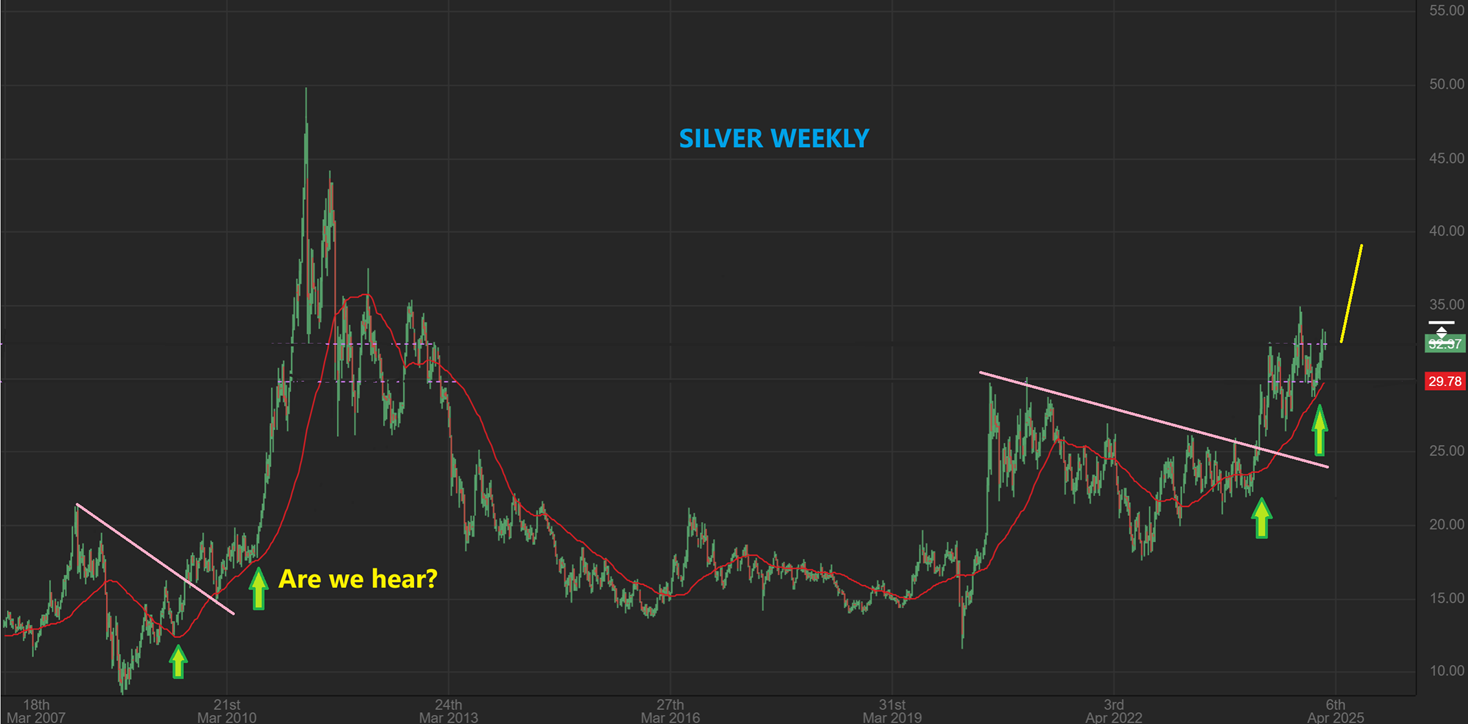
SILVER WEEKLY- I cannot believe how long Silver has been just chopping sideways. We did get a breakout, but then it churned sideways again. Very frustrating, but let me show you one real ‘possibility’ that I will call my ‘Wishful thinking‘ chart.
.
My SILVER WEEKLY ‘Wishful thinking’ chart– The current set up does have similarities to the point where Silver LAUNCHED up to over $50 after chopping for weeks and months in the past.
1. Silver chopped along the red 50 week ma and then took off higher to $50.
2. This IS possible, since Gold has already launched and Silver is chopping to the 50 week sma now, so there is still hope for a great rally. Time will tell.
.
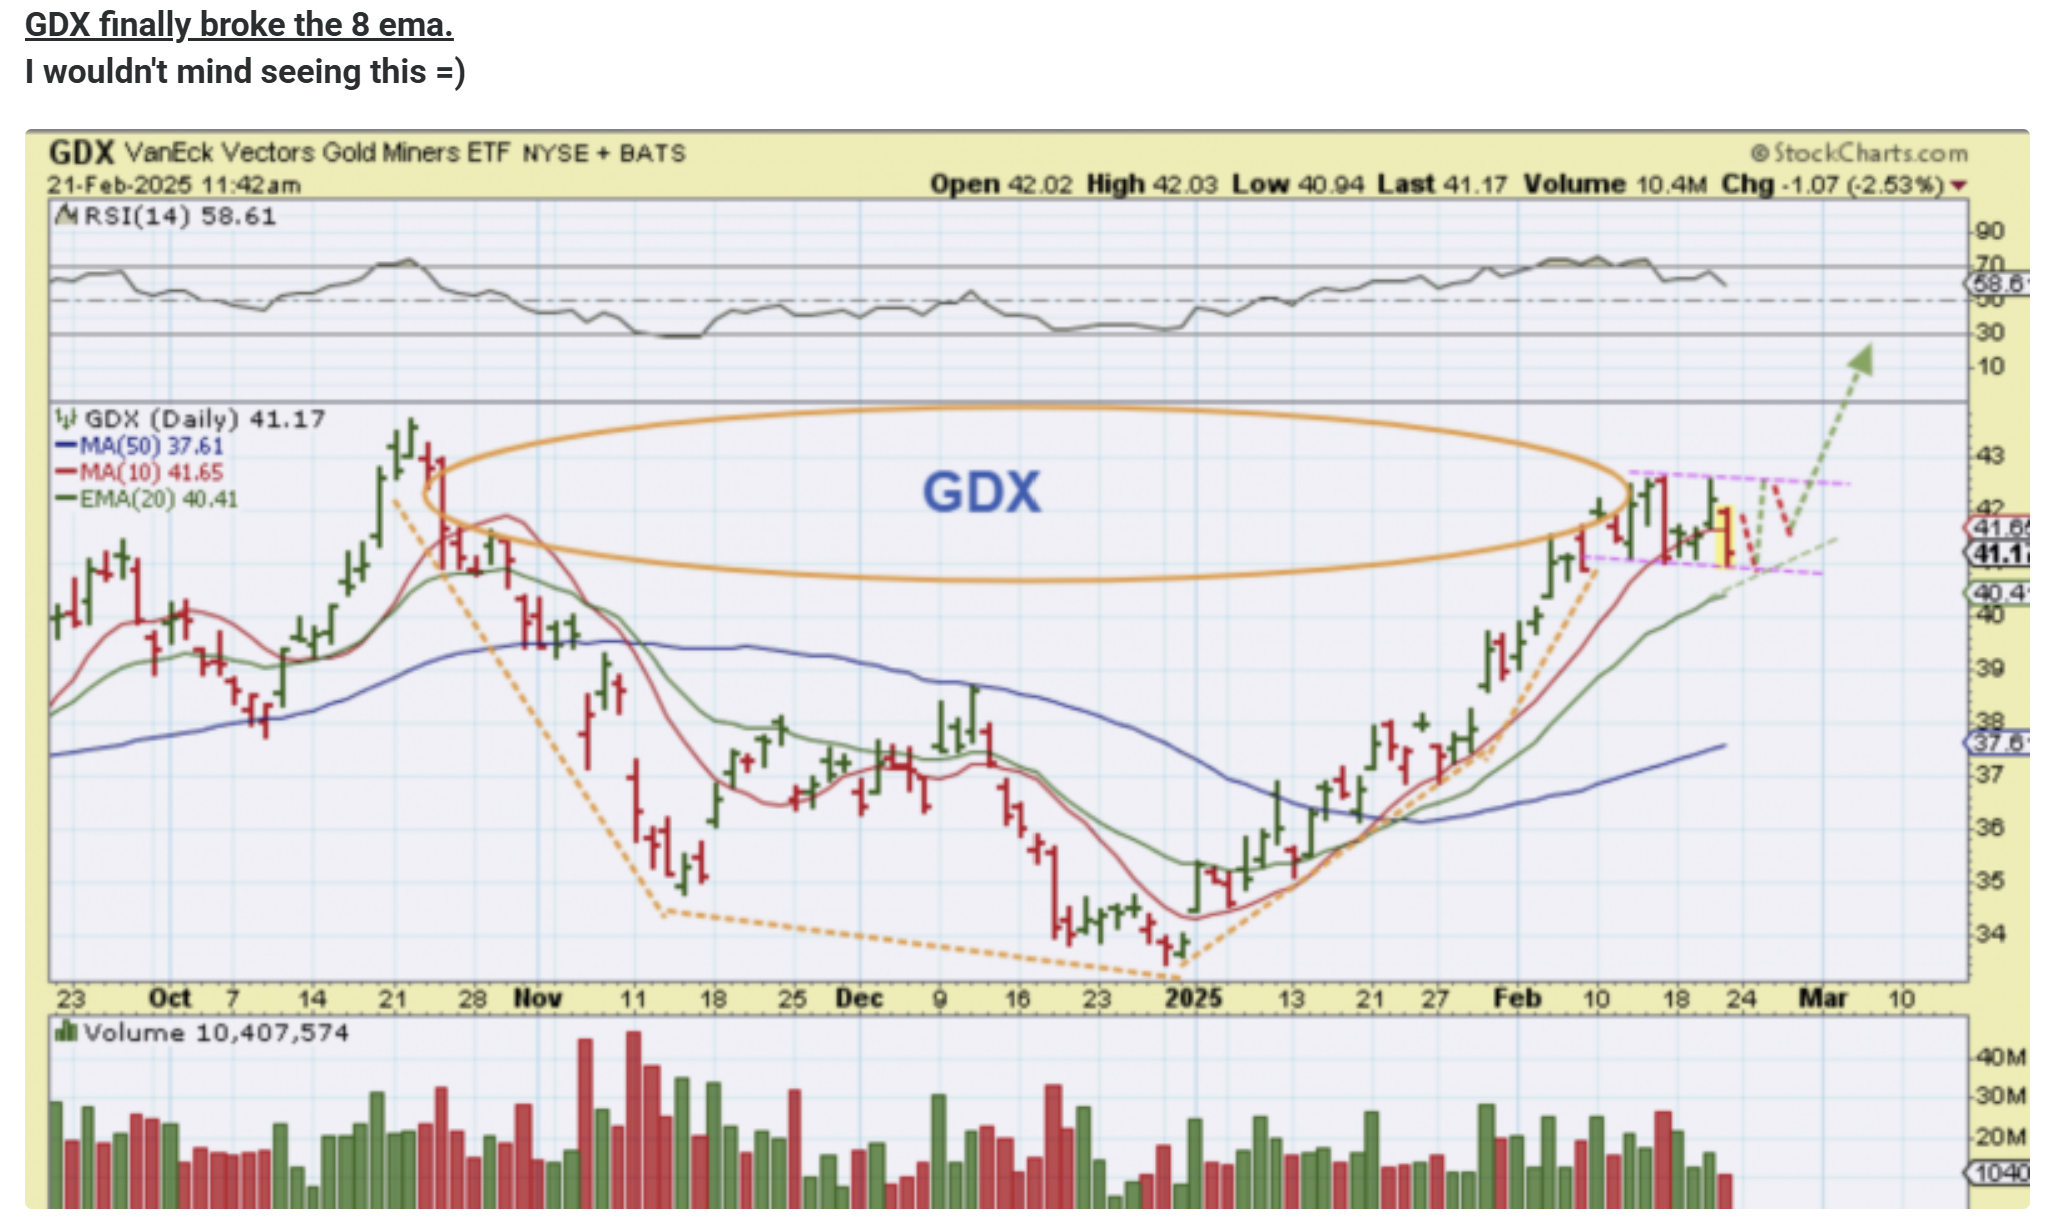
Friday morning when the market was open I mentioned this about the GDX when it was at $41.17. The 20 ema green line was at $40.41. It could drop there and it did sell off further as the day went on. DID IT BREAK $40.41?…
.
.
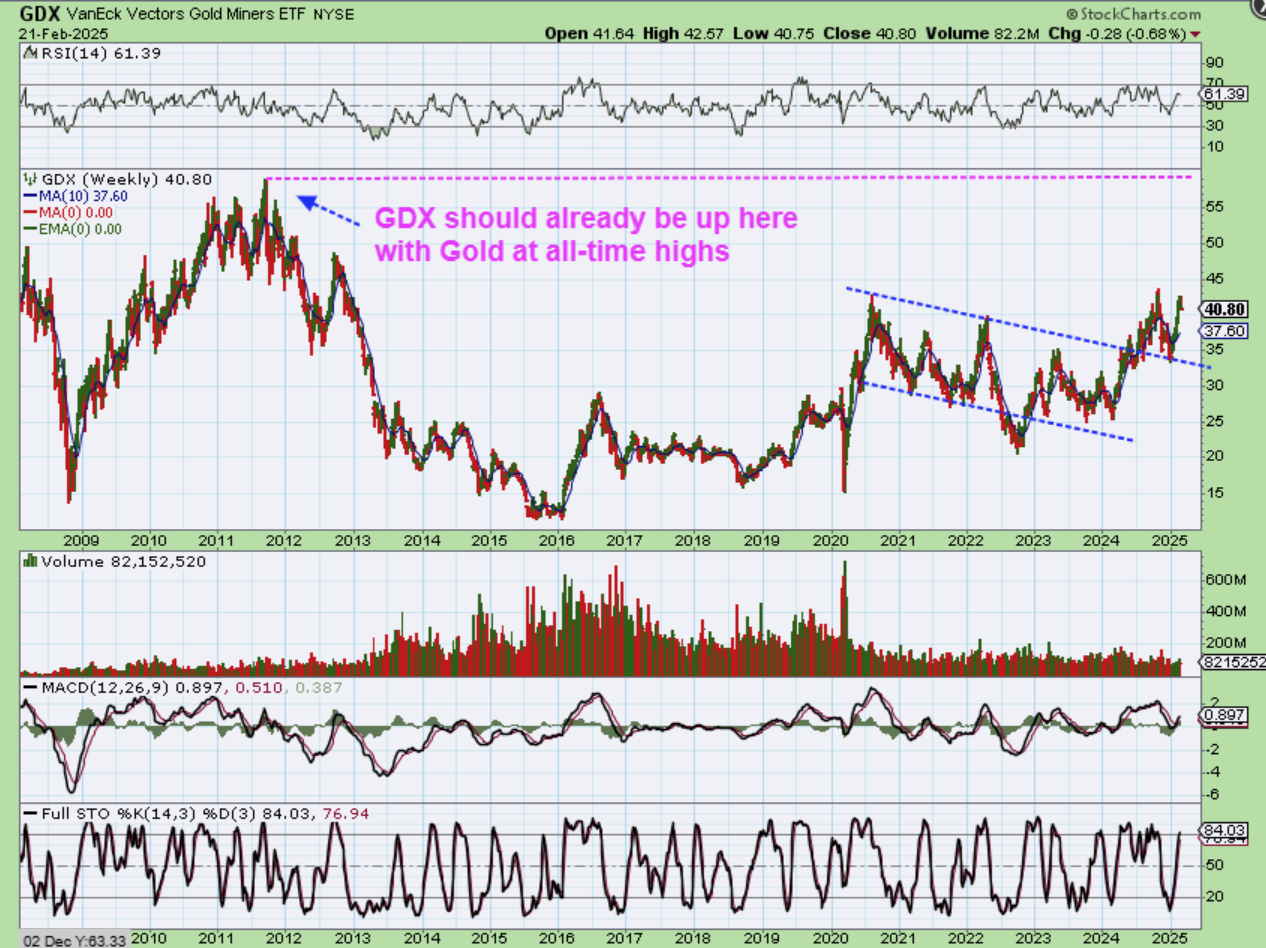
GDX did not break $40.41, so it is still above the 20 ema. Honestly, GDX is lagging gold by a lot, since it is not back at the highs yet, but this recent rally has done well out of the back test of the break out. I am still hoping for acceleration to the upside over the next daily cycle or 2.
.
Usually it is here that I say, “Well, the Bulls are still in control.”, but at this point with all of the choppiness becoming a little continuous in the general markets, I’d have to say that the Bulls are in control, but they are running like they’re stuck in the mud. Gold did that out of the ICL and then ran straight up, so I wanted to point that out, but at the same time, AMZN, GOOG, etc lost the 50sma so we need to monitor weakness and strengths. Oil is choppy, the USD should drop further, and I’d expect Gold, Silver, and the Miners to continue higher in the big picture. The bulls do remain in control, but Bitcoin is struggling. I’ll touch on that below, enjoy your Sunday!
.
~ALEX
.
.
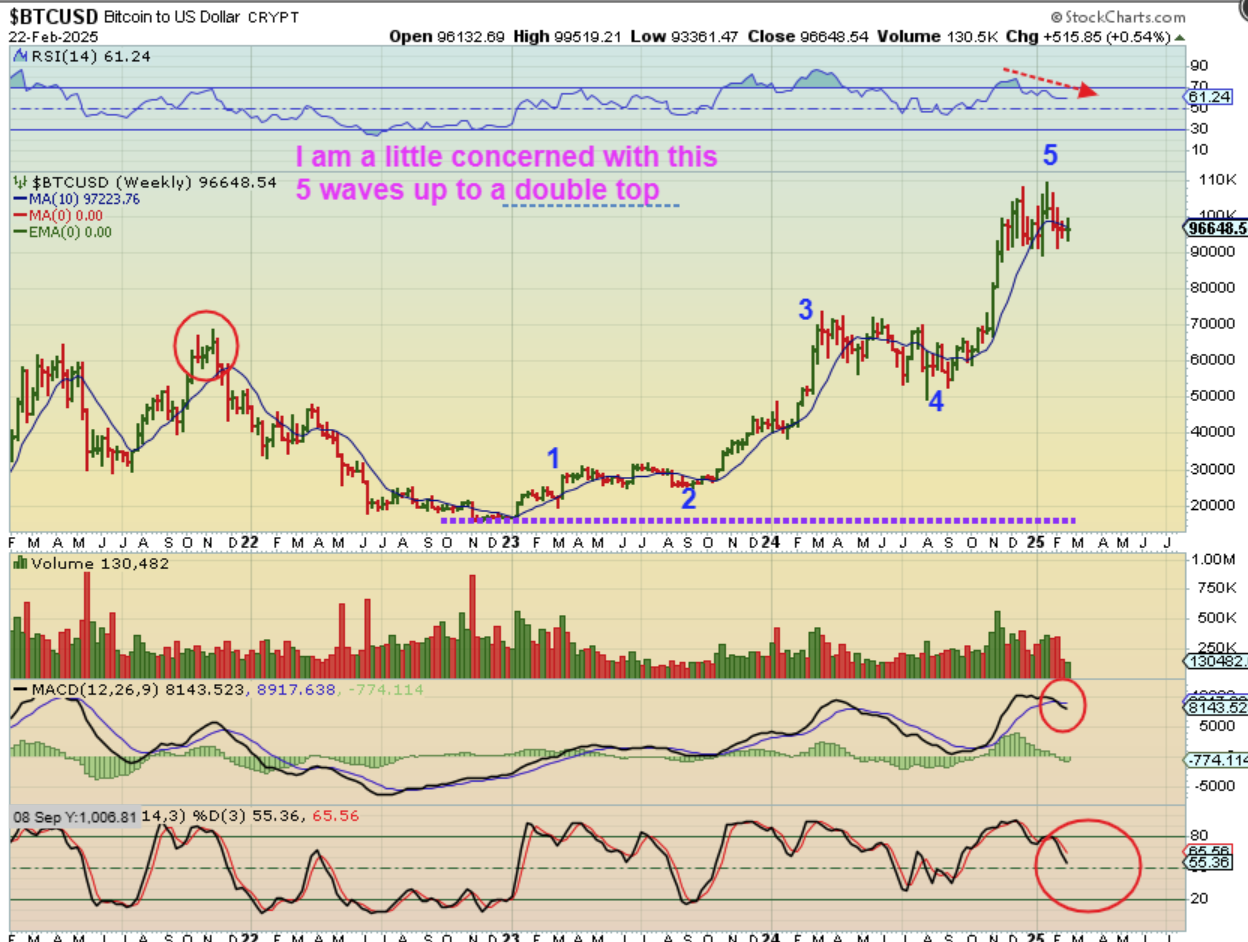
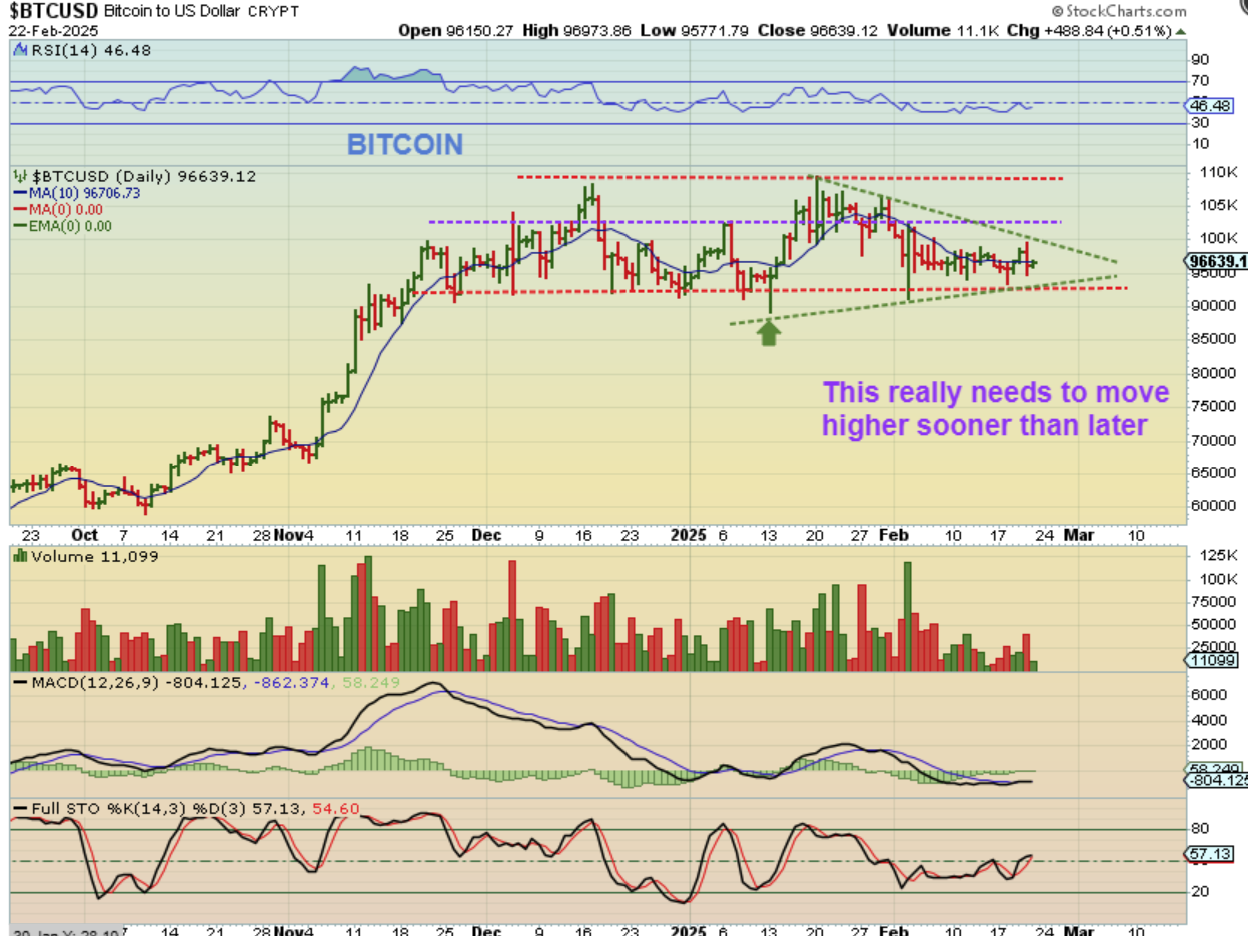
BITCOIN has a bullish triangle or possible pennant, but as time goes on, it is getting late. We need an upside break out sooner than later and the weekly chart highlights why I feel that way. Here is a clue: This is starting to resemble a double top (see the MACD), even though we should have ‘time’ for another rally. I would like to see a break higher soon..
.
BITCOIN WEEKLY also has a perfect 5 wave run higher. I’m not a huge E.W. guy, but I obviously watch for A-B-C moves, 5 wave moves, etc and when I see 5 waves looking complete, I have to respect that. So can this run higher? Yes, it has ‘time’ to do so in the big picture, even in a 4 year phase, but the 5 waves shown and lack of strength lately will have me cautious. A break of the lows is obviously bearish.