February 16th Weekend Report – Rest Up
Let’s take a look at the Big Picture…
.
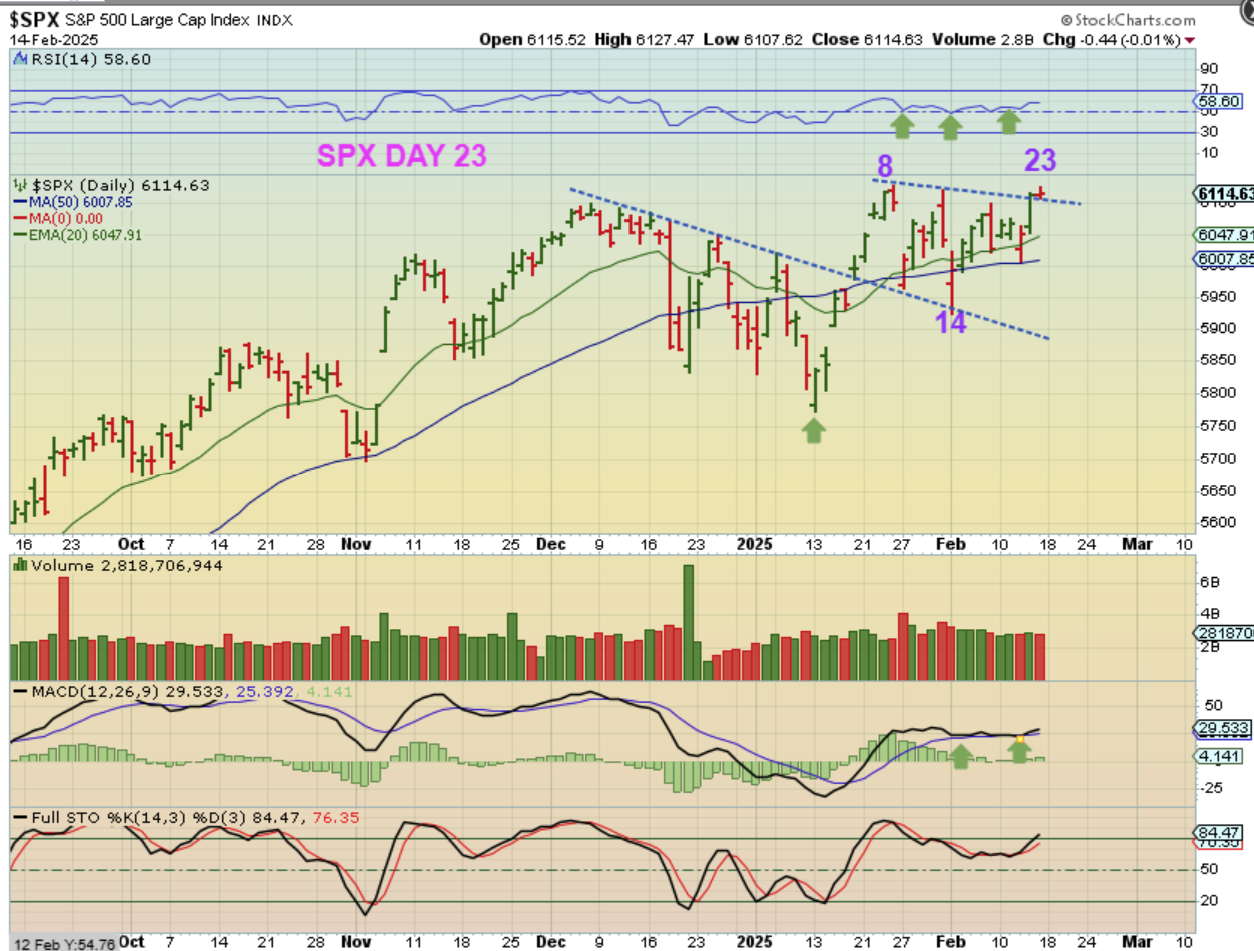
SPX DAILY – We have a day 8 peak, and then things got really choppy with all of the uncertainty and indecision that came about when Trump took office and announced Tariffs and other changes quickly going into effect. Markets do not like uncertainty, however, we are coming out of an ICL, so I have said that I have to expect a new high to make it R.T.
.
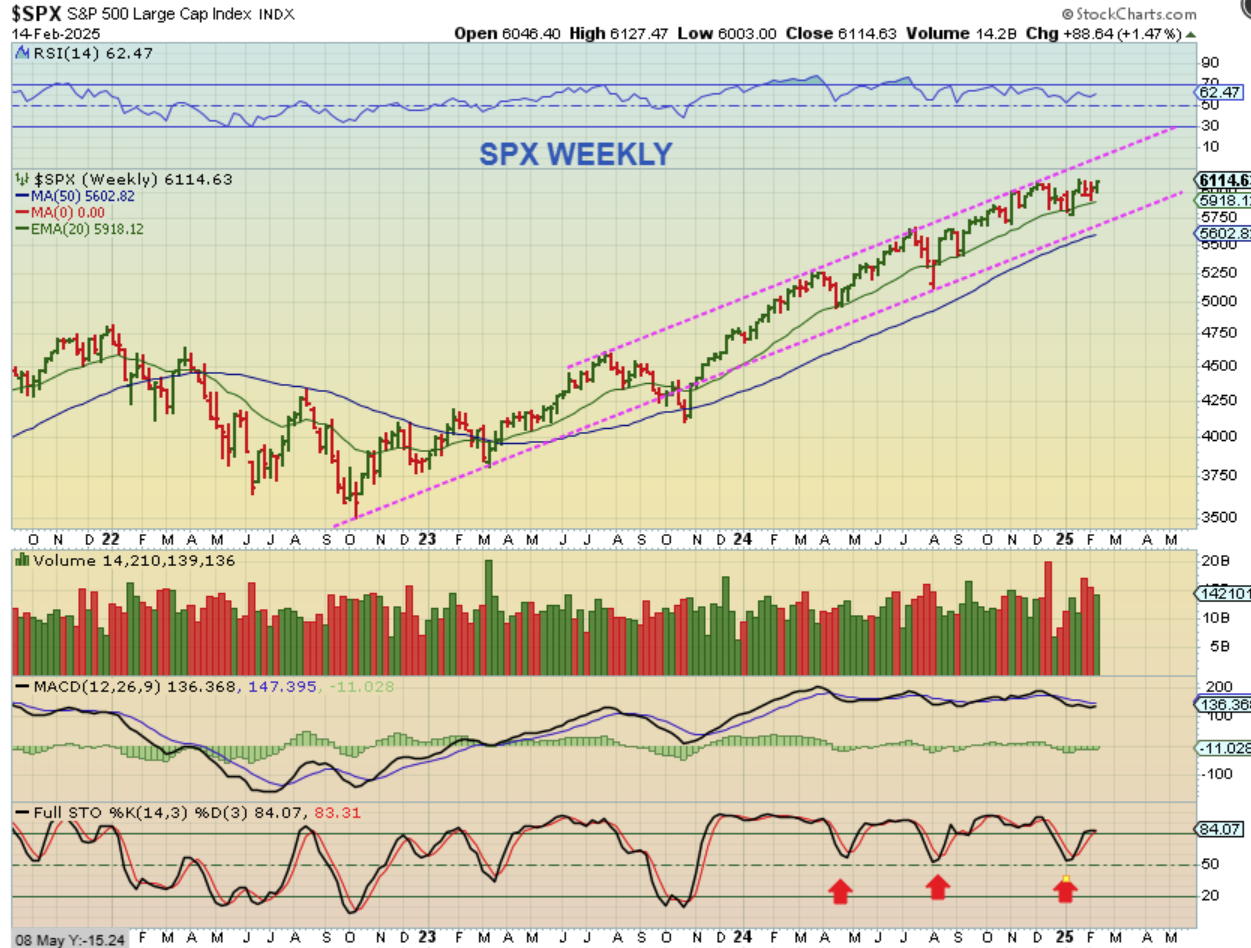
So, we go over to the SPX WEEKLY CHART and we see that the bull run held up well on the ICL dip. Price landed on the 20 ema support (Green line) and now we’ve chopped sideways for 4 weeks, but I expect higher price and the channel does have upside space in it.
.
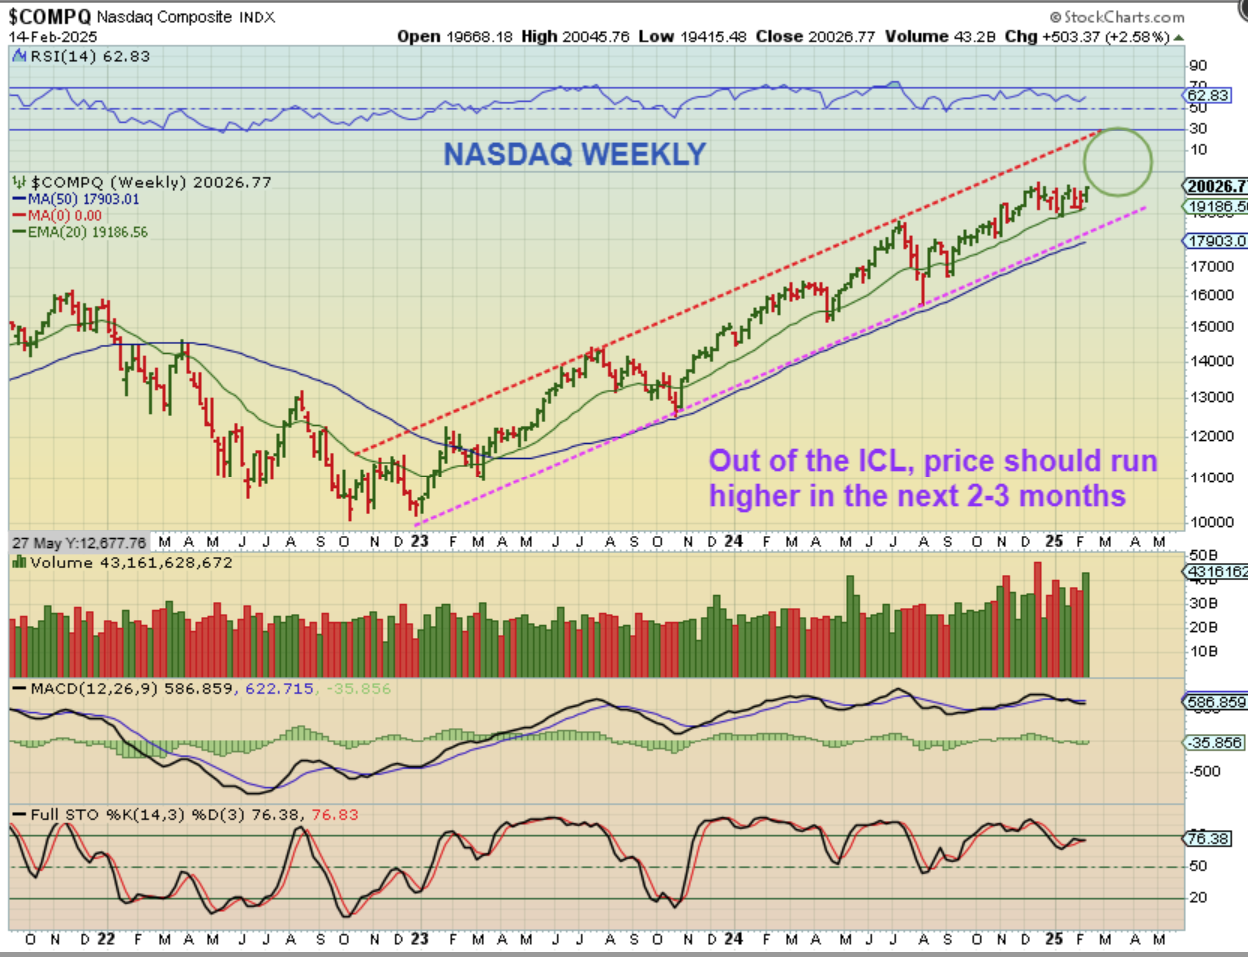
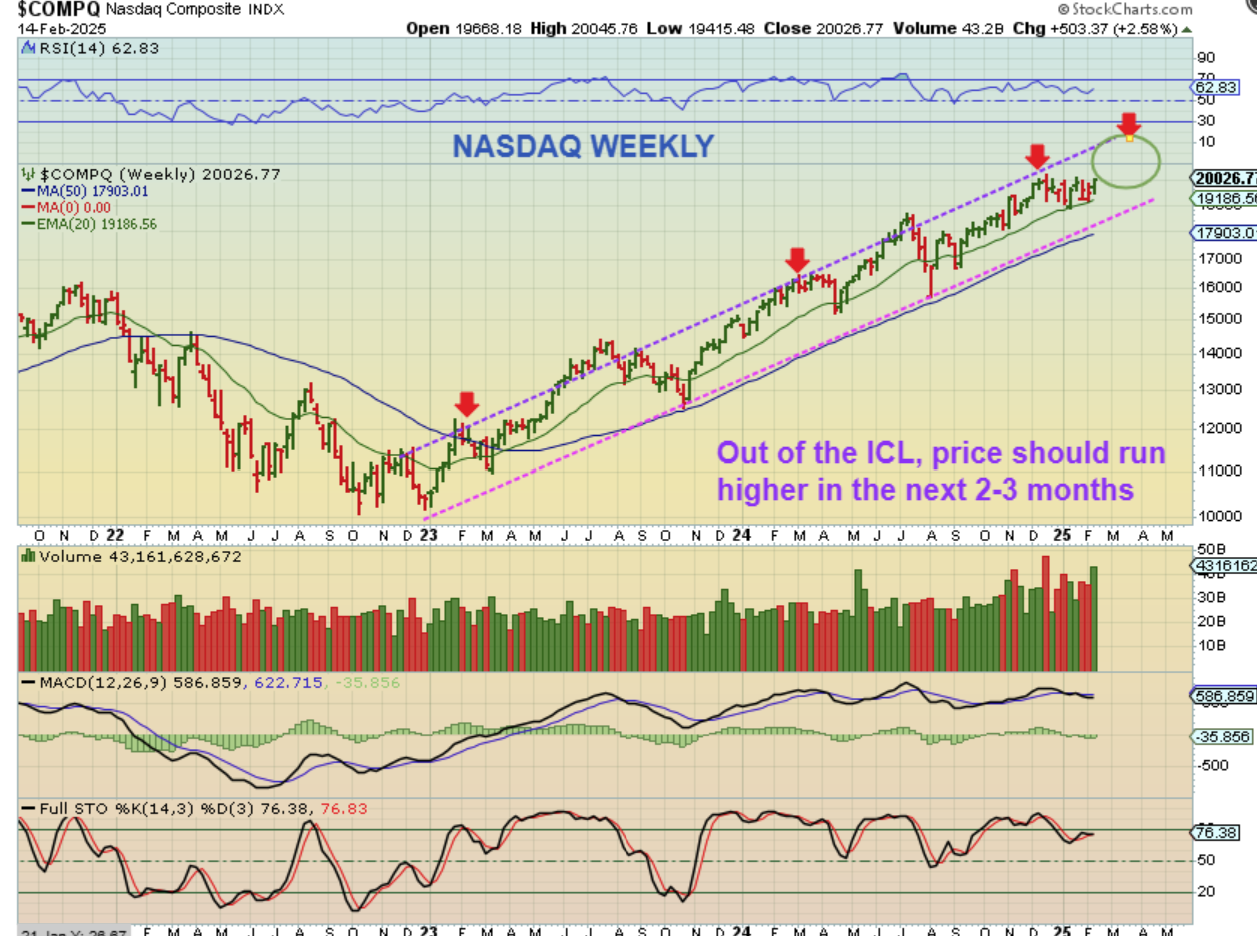
NASDAQ WEEKLY – The Nasdaq has been Very choppy and sideways with Tech Earnings, competitive ‘AI’ talk, the new administration politically, etc. I do still expect the Nasdaq to move higher too. On this chart I am connecting the 2 highest points for the top of my channel. That would be my expectation for the next peak.
.
NASDAQ WEEKLY – The red arrows here are connecting the lower ‘peaks’ and that would still give us some nice upside.
.
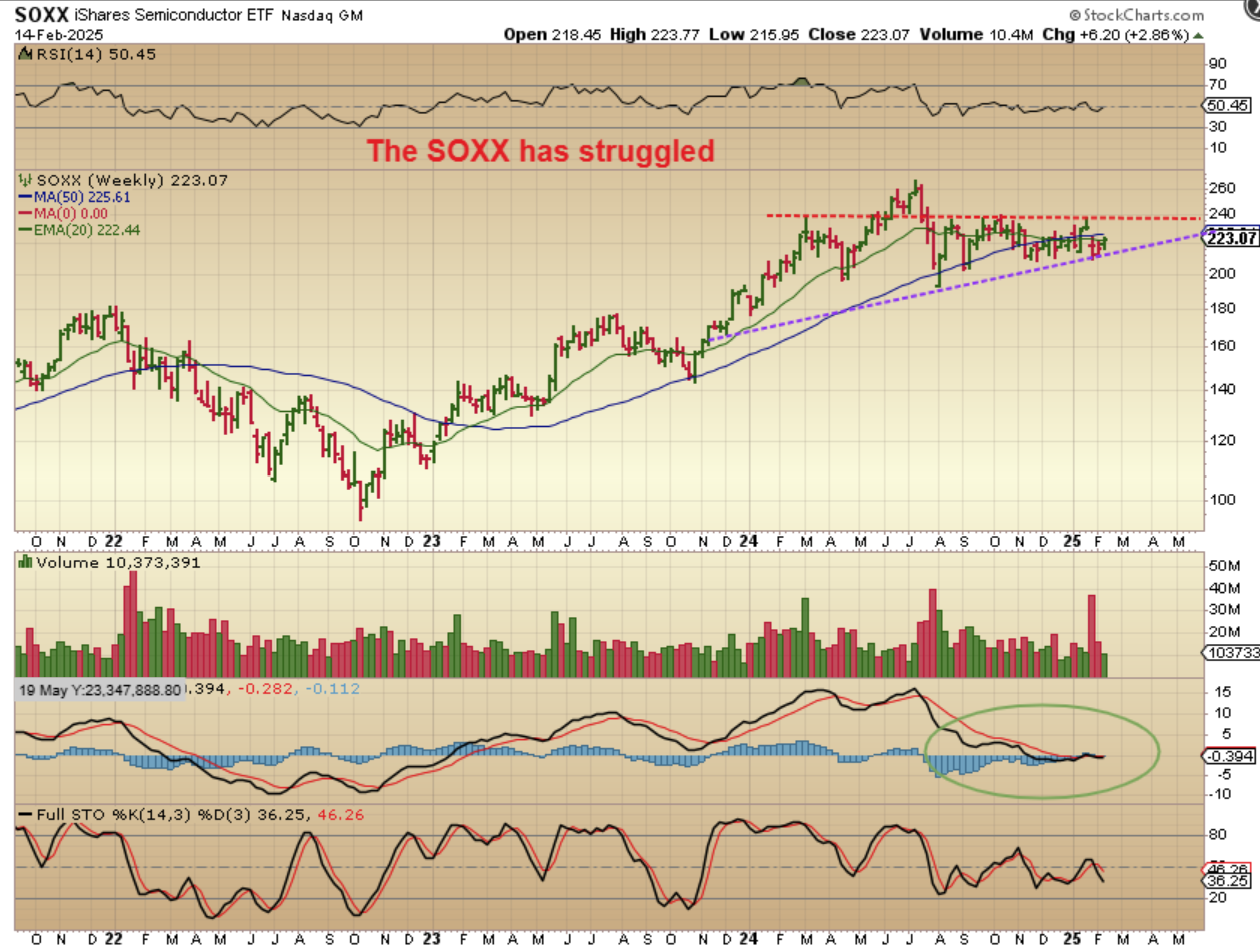
SOXX WEEKLY – Talk about weakness or sideways chop. You may recall that I was looking at this as a possible H&S pattern forming back at the end of last year, but it never broke down and it started to form more of a triangular consolidation. That is where we are now, at the lows of the consolidation and hoping to breakout higher.
.
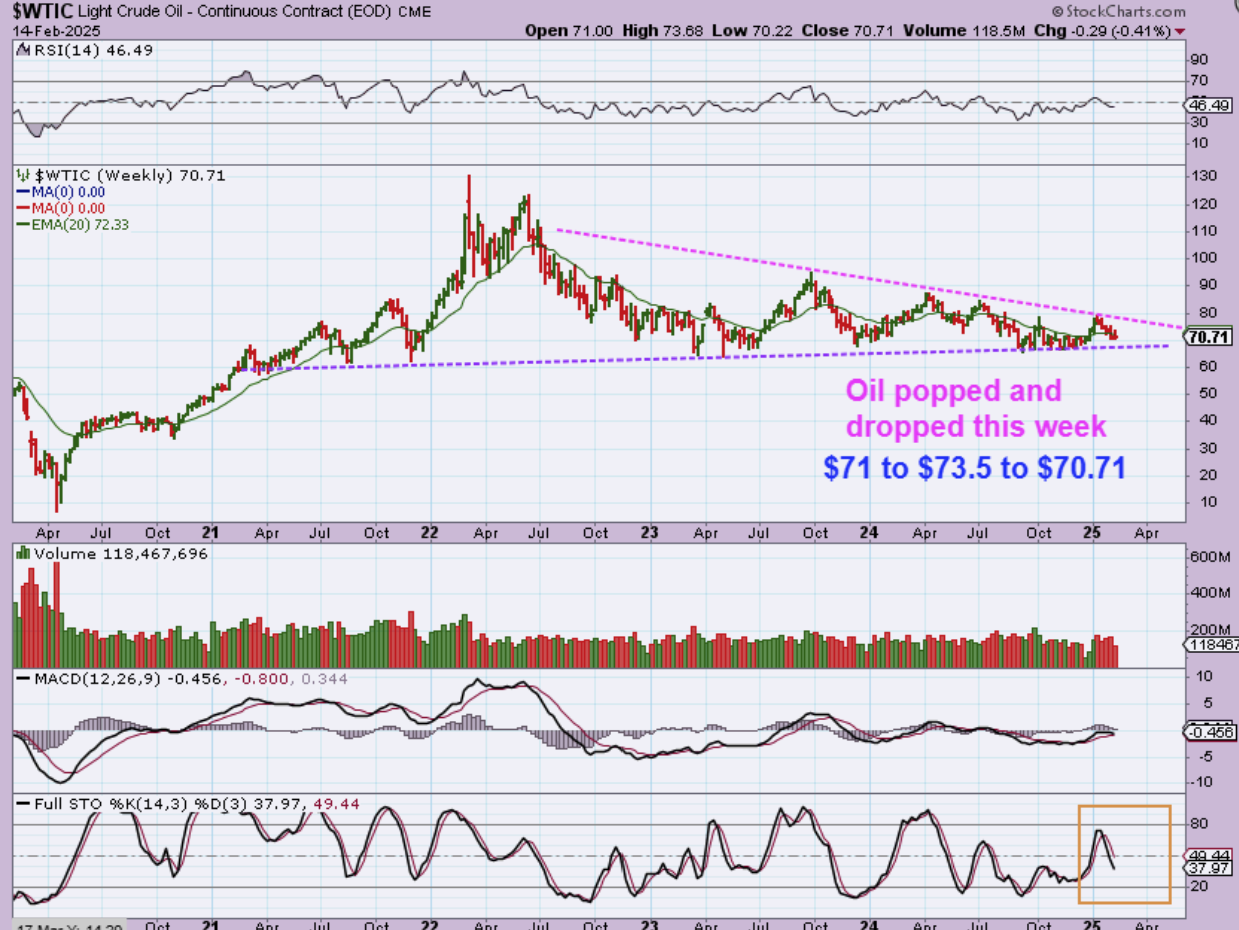
WTIC WEEKLY – Oil has also been very choppy, especially at the end of 2024. Recently it put in an ICL and rallied higher twice, but dropped back down & gave most of those gains back. In the Big Picture, we have a massive triangular consolidation that could break out higher or break down, so let’s zoom in…
.
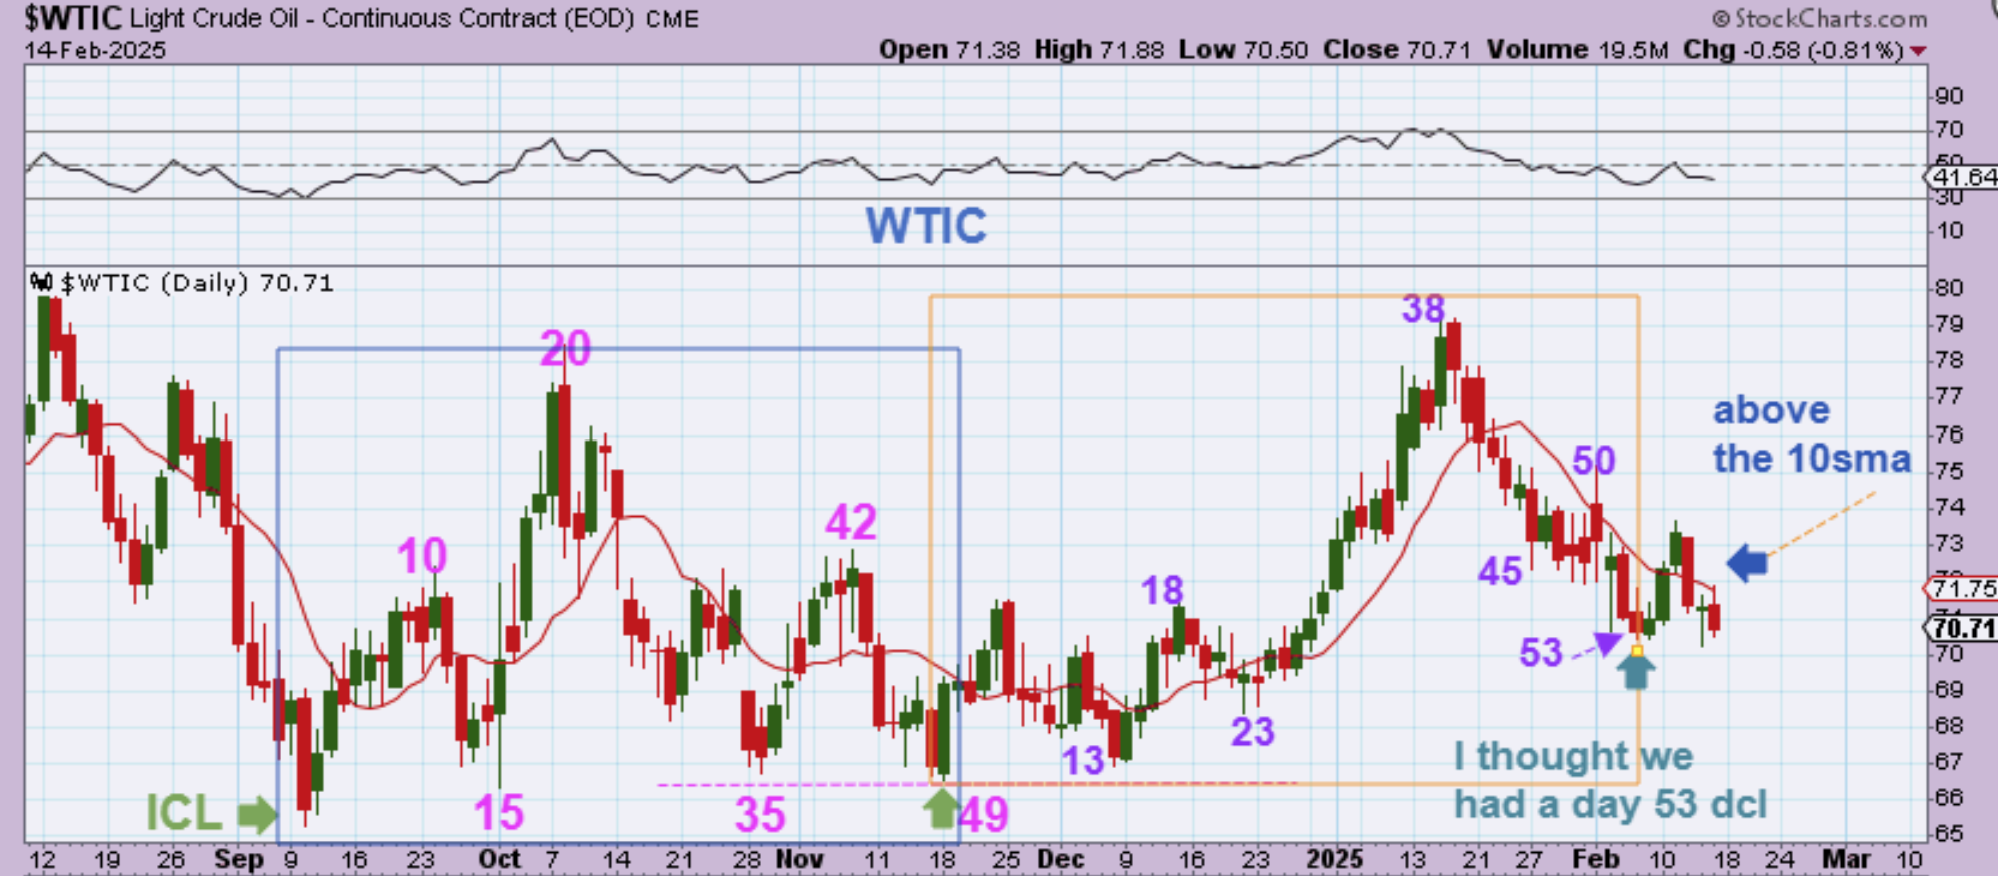
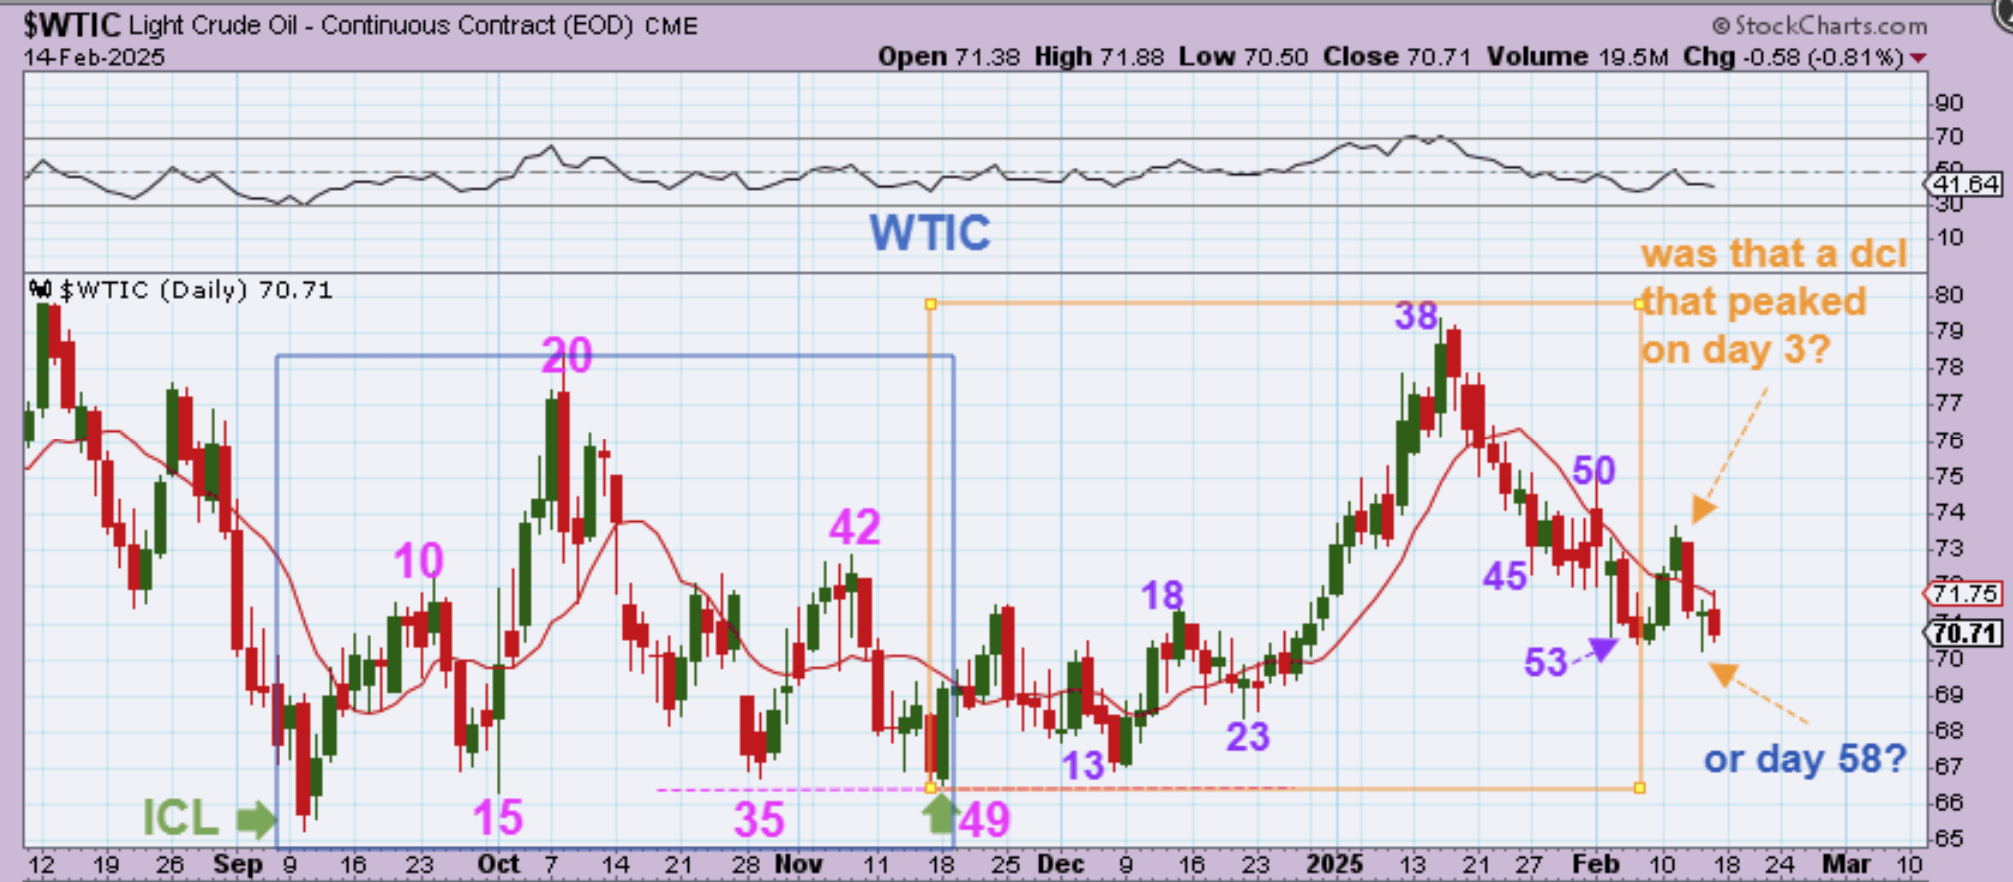
WTIC DAILY – looking at the cycle count, Oils cycles can run for 45 -50+ days! Going back to September where an ICL developed, we had 49 days of extreme chop.
Box # 1. The dcl for the first daily cycle would be that magenta day 49 mark.
Box #2. We then chopped a lot for 23 days followed by a strong rally up to day 38. We were now coming due for a dcl dip, so it could not break out from that large triangle in the chart above.
I see what I thought was the next dcl on day 53. It closed above the 10sma and I expected a 3rd daily cycle, but now that low was actually broken on Thursday. What does that tell us?…
.
This is not yet crystal clear:
1. Was day 53 the dcl, and we peaked on day 3?
2. Or are we on day 58 and the dcl forms this week?
Time will tell, but there is a small chance that we just saw a ‘day 3 peak’ and then a breakdown of the Daily cycle Low. IF SO, that means that we’d have 30+ days left to chop lower. We need to watch this carefully next week.
.
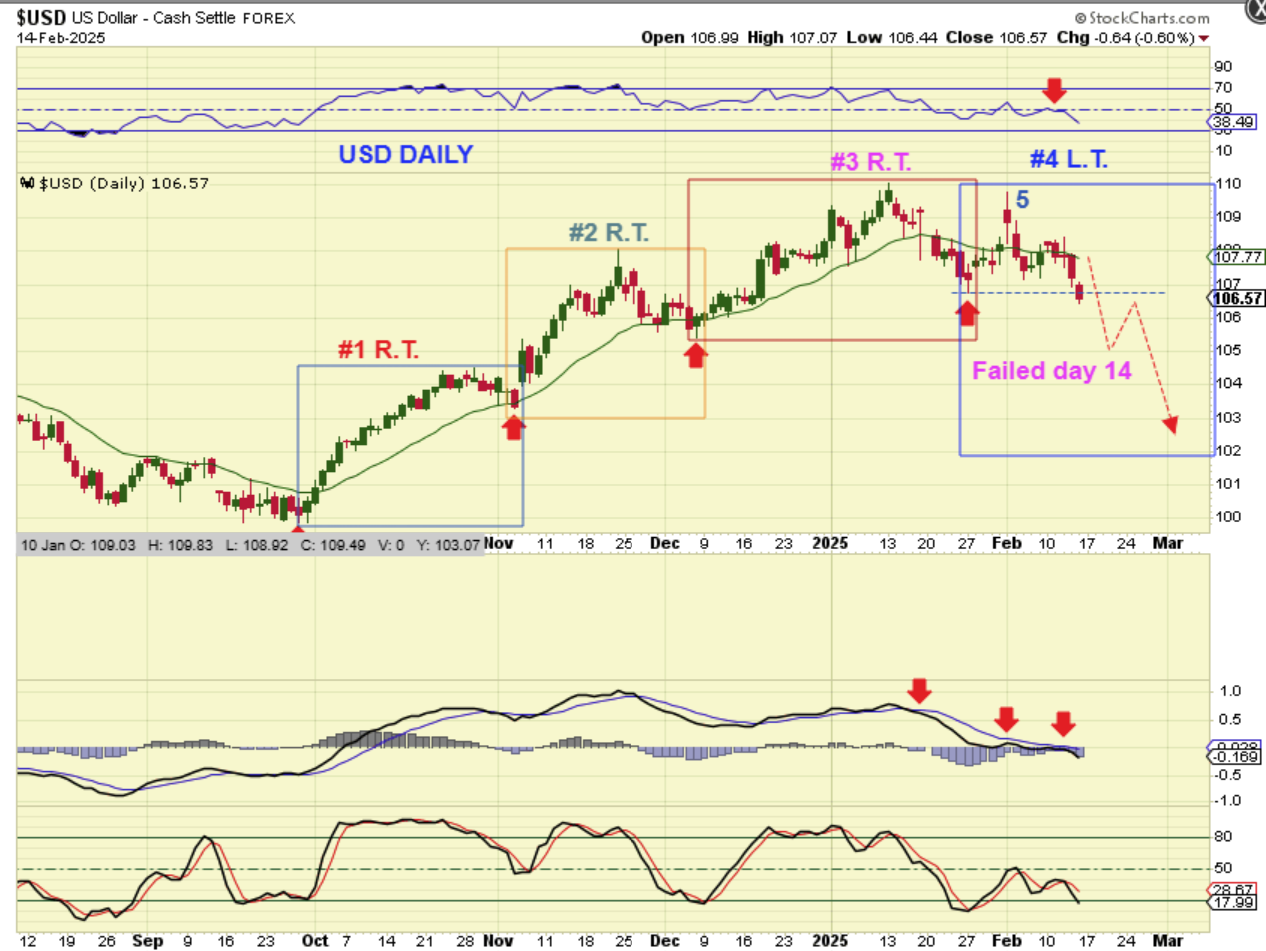
The USD is playing out exactly as I thought that it would, but it doesn’t really matter, because the USD doesn’t seem to affect Gold the way that it used to. Gold rallied with the USD and dropped with The USD recently.
.
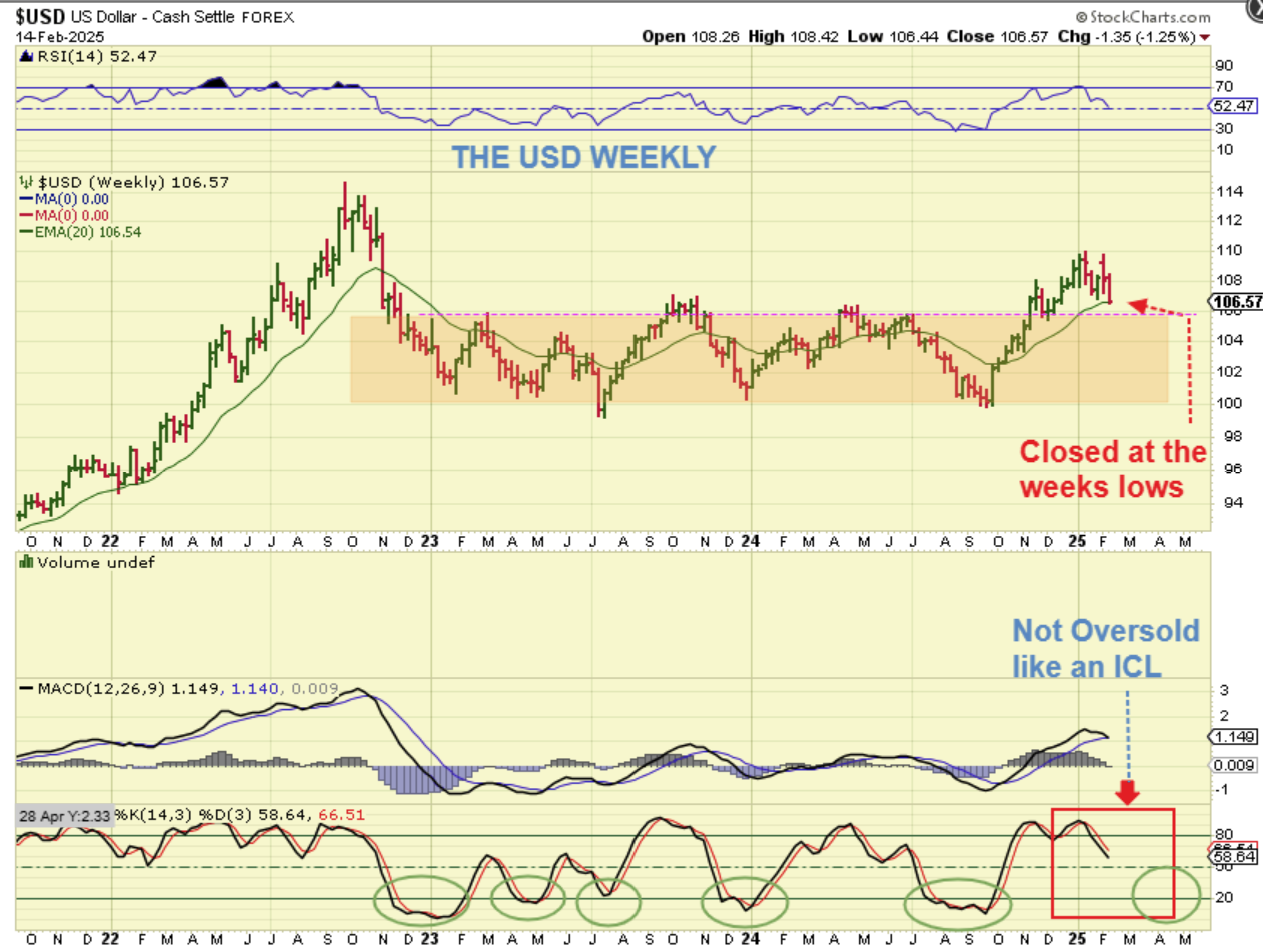
USD WEEKLY – That said, I’ve been expecting the USD to roll over and drop lower in the 4th daily cycle. The drop into an ICL has started.
.
USD WEEKLY – The USD is near a support area, but this may not hold up when an ICL drop comes into play. Take a look at the Stochastics and you’ll see that we may have a good amount of downside left.
.
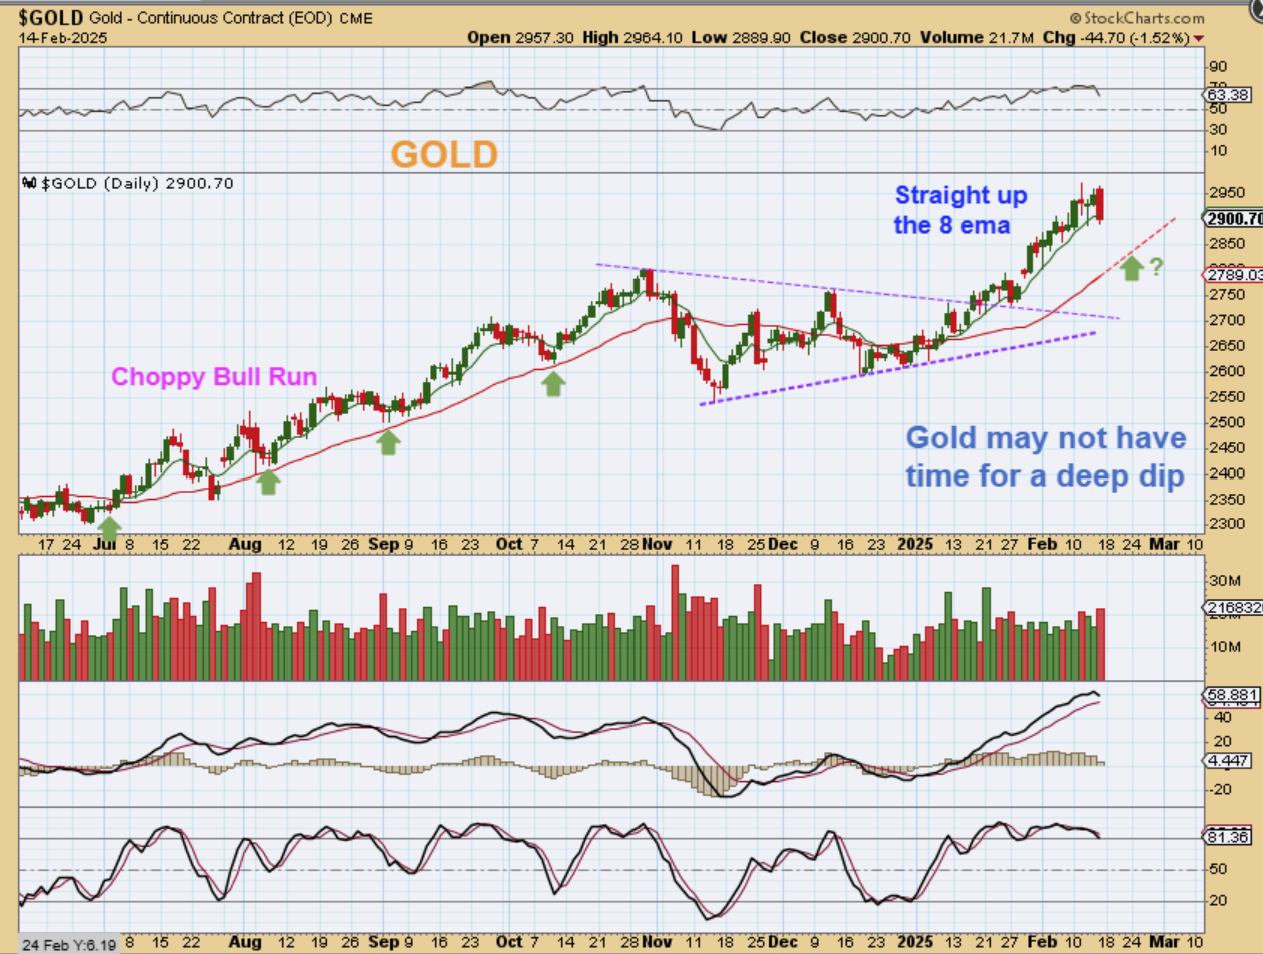
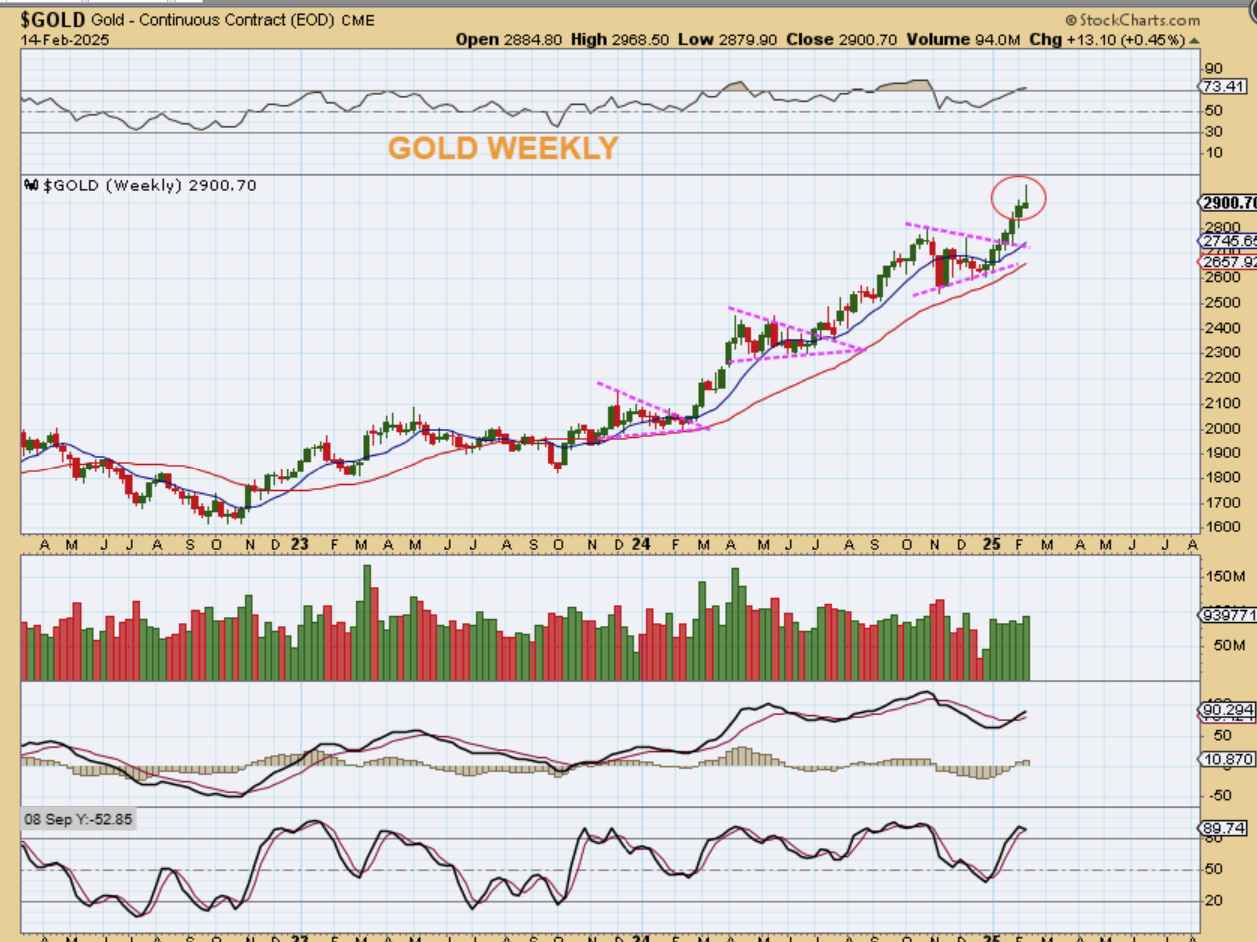
GOLD WEEKLY – You can see a difference between this recent Bull Run to new high and the one that took place in 2024. The 2024 run was giving us ‘dips’ to buy near the 20 ema often. This run ran right up the 8 ema and then on Friday we saw our first big candle lower. We are due for a dcl, but I would expect it to be short lived and recover quickly.
.
GOLD WEEKLY – We did get what is usually viewed as a topping candle, so Gold could pull back next week.
.
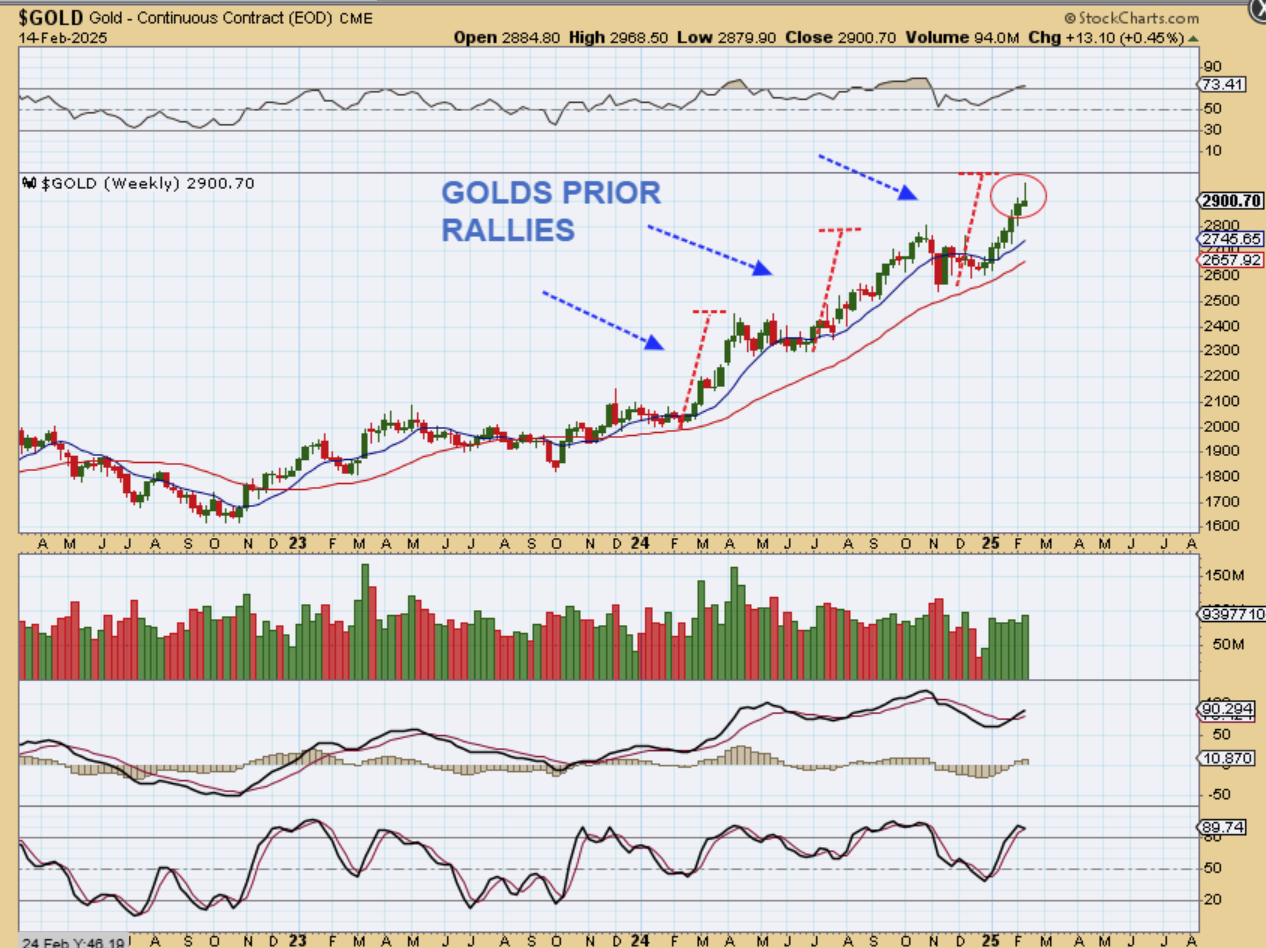
GOLD WEEKLY – I simply measured out previous rallies here and am seeing that this first daily cycle almost gave us what 2-3 daily cycles gave us in past rallies. This rally made it as high as $2968 on this chart. This chart concerns me slightly. Why?
.
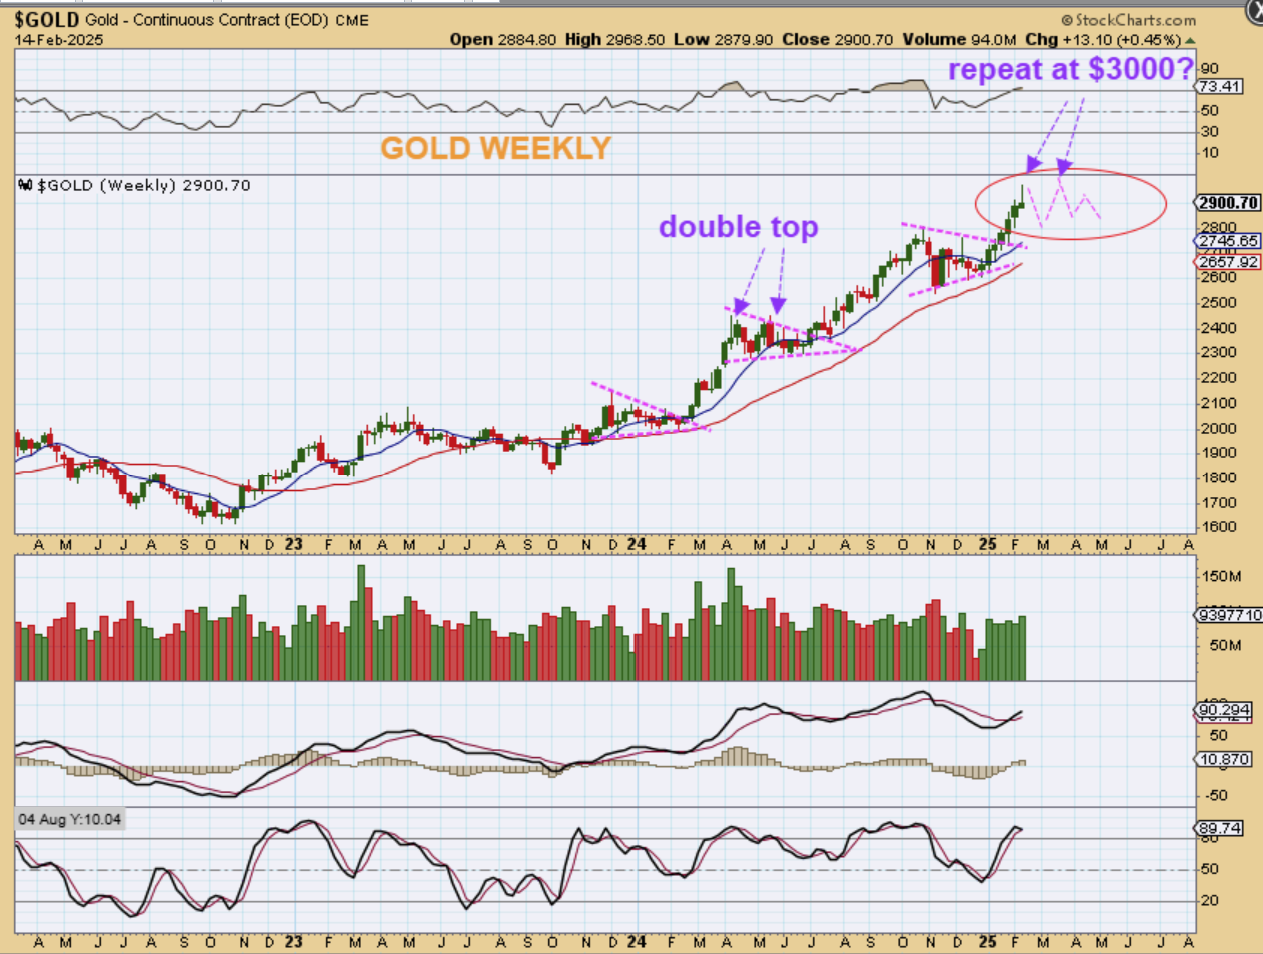
GOLD WEEKLY – I couldn’t help but to notice that middle rally. We have already reached the $3000 area, so will we just double top in the 2nd and 3rd daily cycle as drawn here? Or can we continue to power higher? Either could actually take place, so…
.
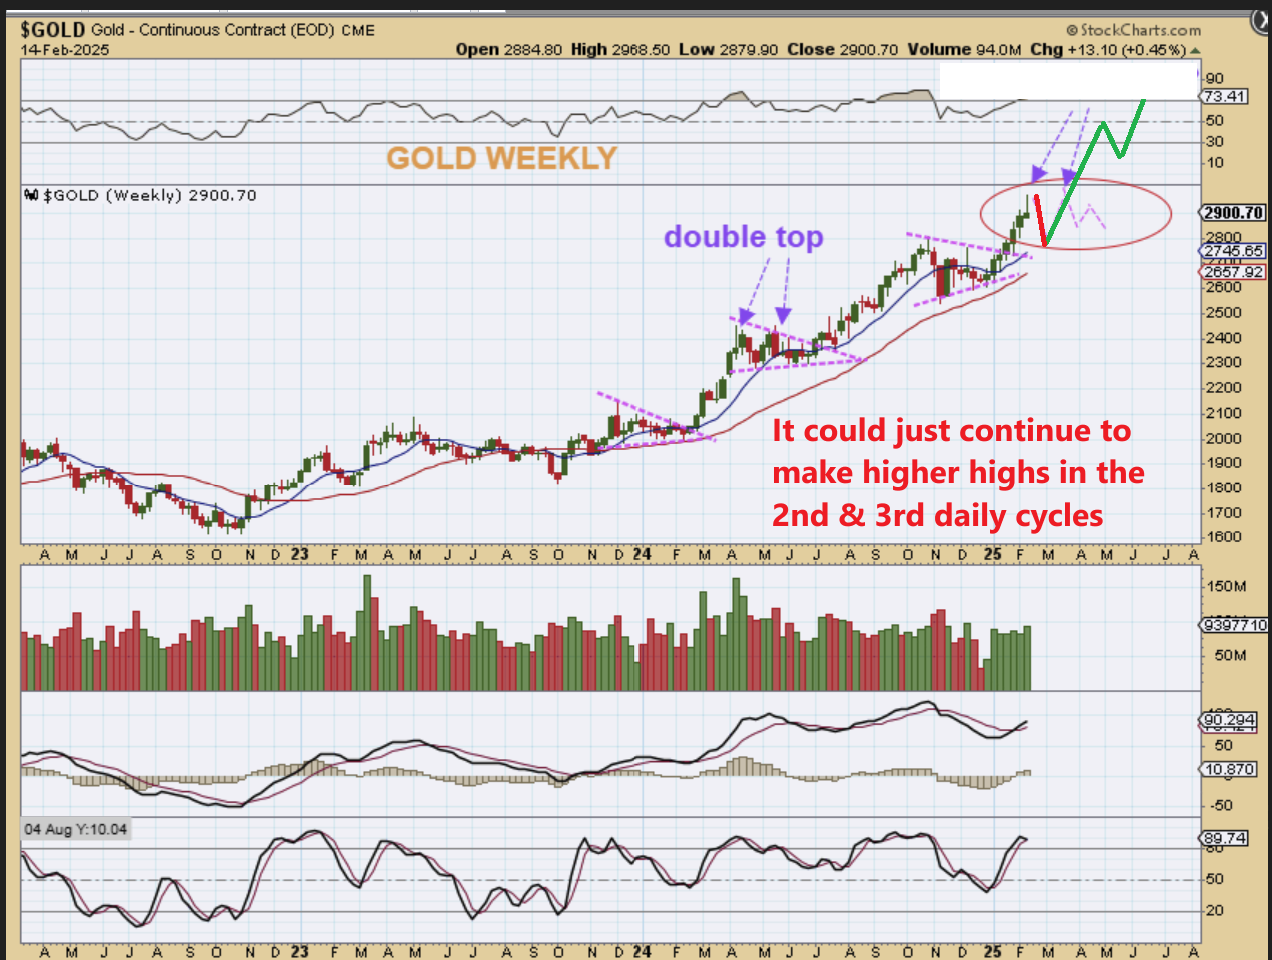
We could see either idea take place. A chop sideways at $3000, or a rally to new highs.
I’d say that we have to play it bullishly, as though that it will break $3000 and blue skies ahead will just see the rally continue. Even if it chops sideways around $3000, Miners could continue to rally and play catch up. Just play it bullishly and add on dips.
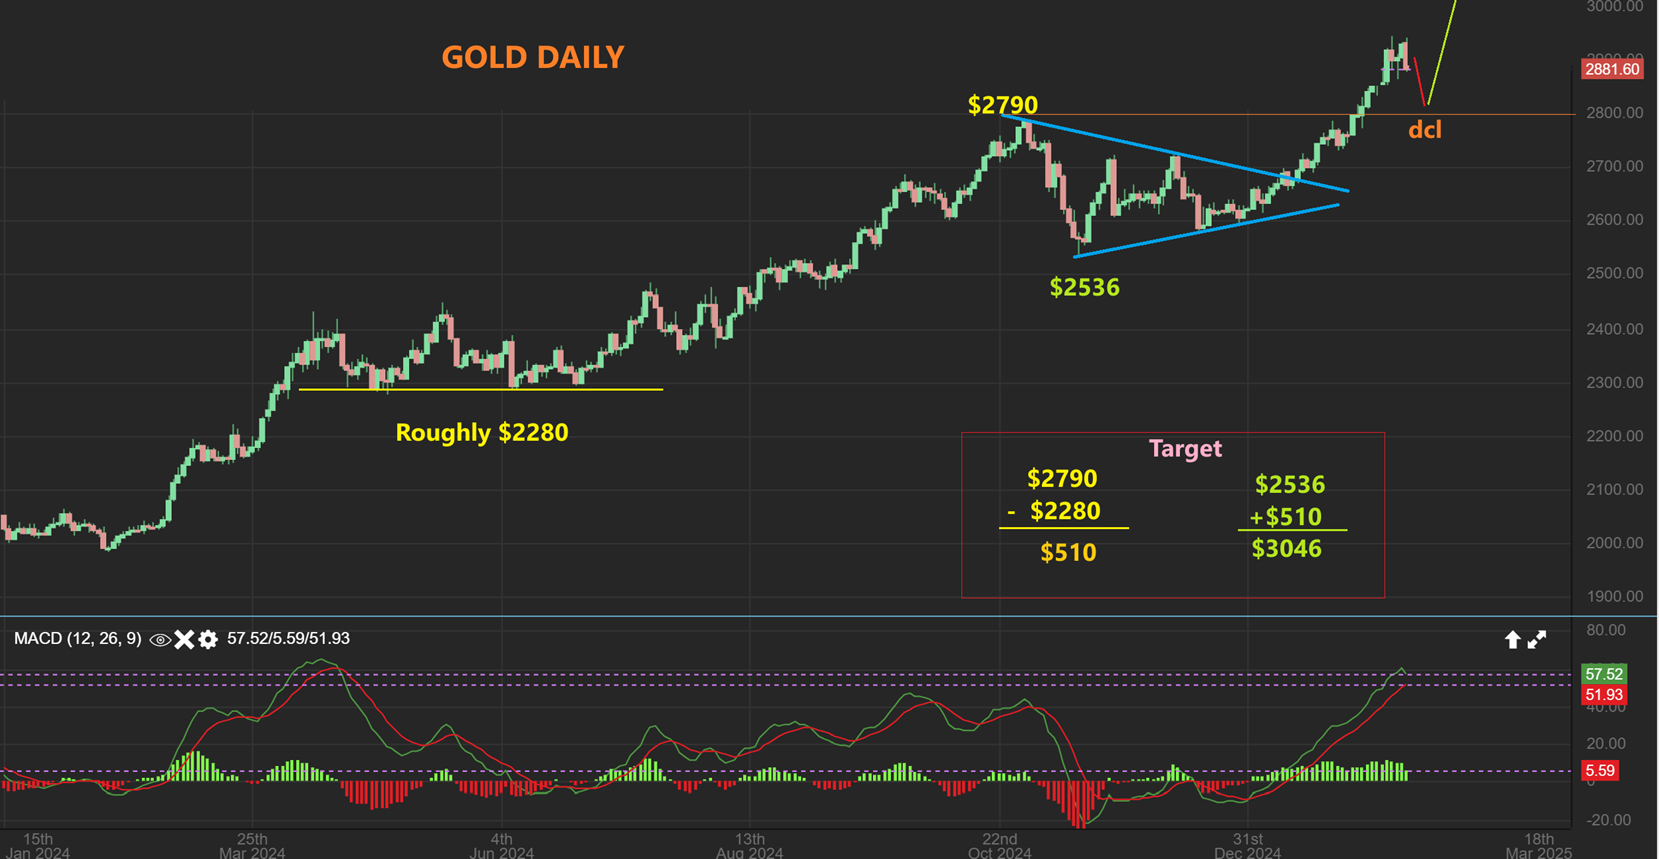
GOLD DAILY – We could dip next week and then rally onward. This chart shows a measured ‘target’ of $3046, but these targets can extend using Fibonacci.
.
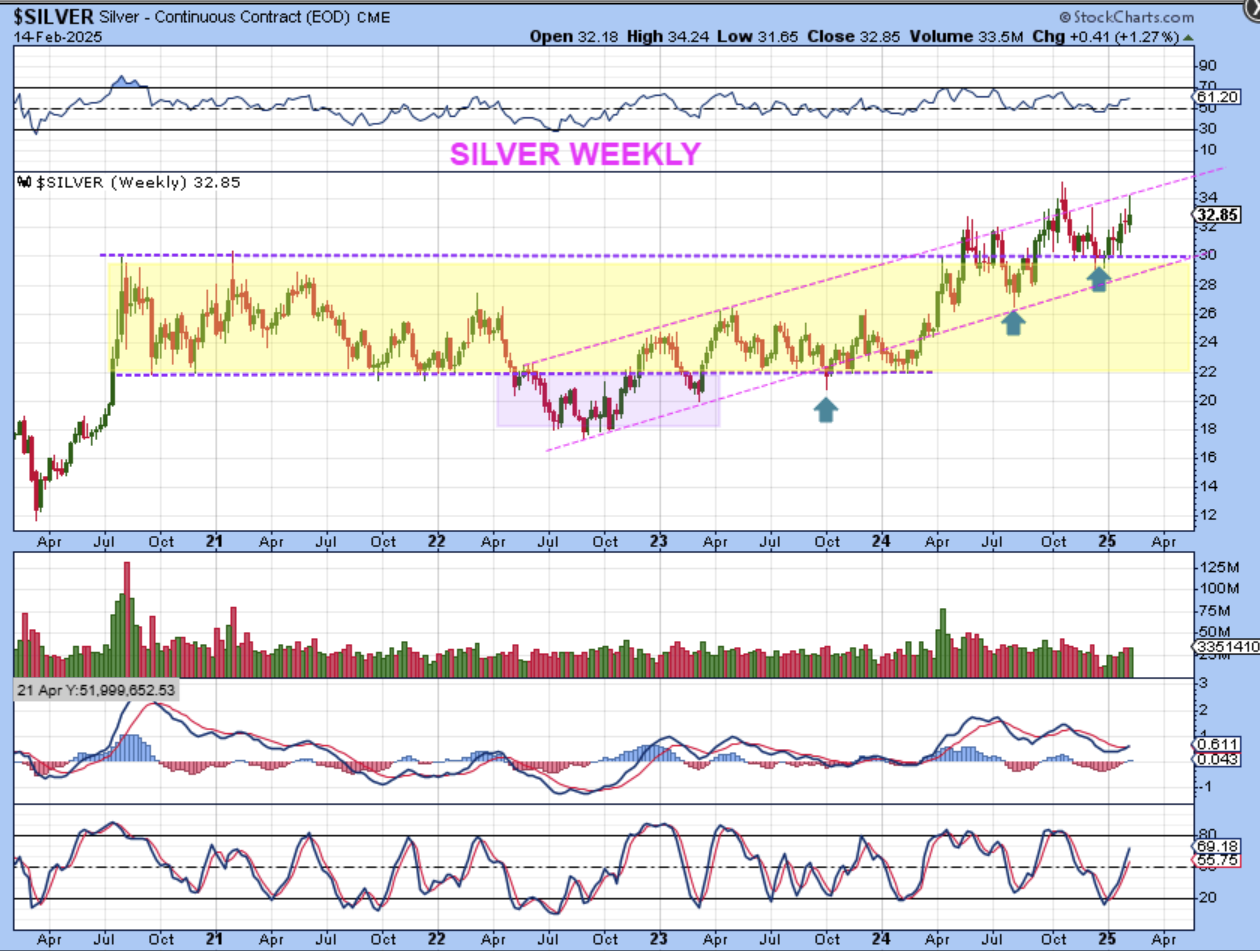
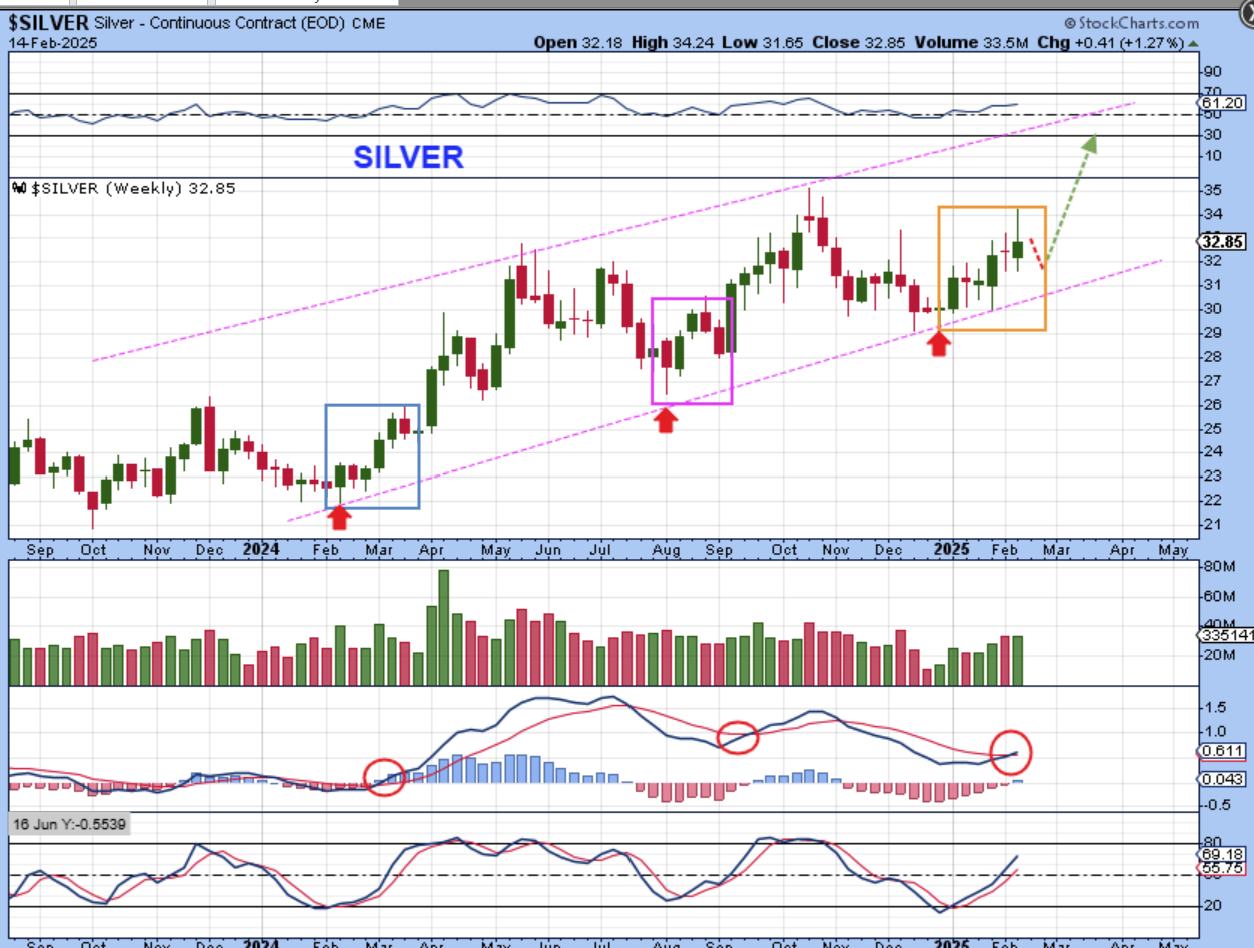
SILVER WEEKLY – I could draw the trendline across the top peaks in April & October, but drawing this upper trend line this way makes it parallel to the lower one and it shows that Silver was rejected at it this week. Silver can drop into a dcl this week.
.
SILVER WEEKLY – The 3 boxes are showing you the move out of past ICls, and where we would be now based on those first daily cycles. This shows you that we should have more upside coming and I’m hoping that this move for Silver is better than past ones (Like we saw with Gold).
.
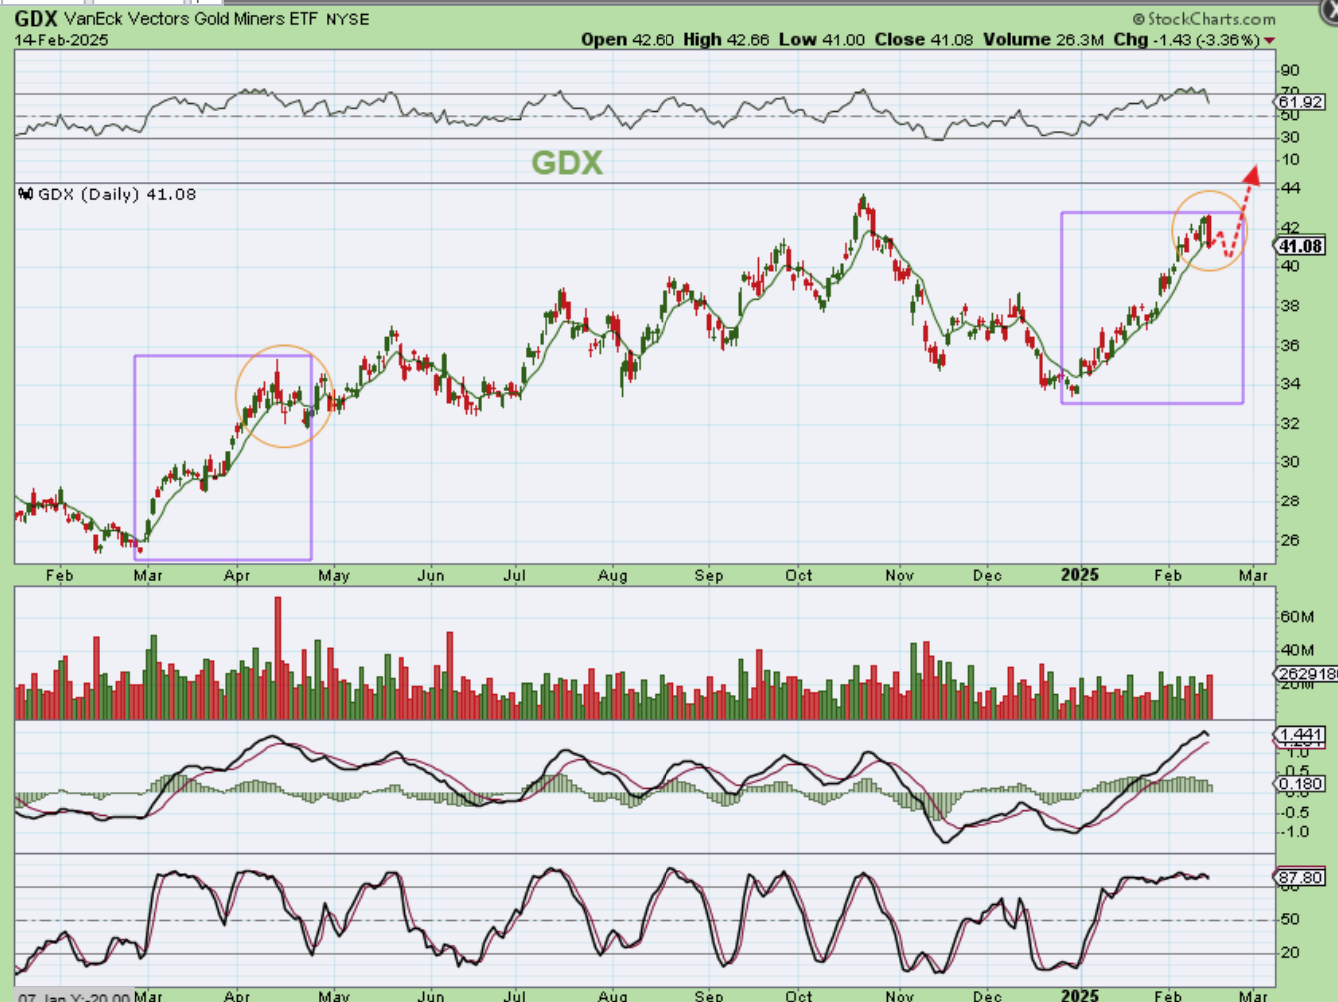
GDX DAILY – GDX rallied strong, also climbing up along the 8 ema. It is due for a DCL and it did drop rather sharply on Friday. GDX was down 3.36%. It can drop more to give us the dcl, but I would imagine that it will recover to new highs rather quickly after the dip.
.
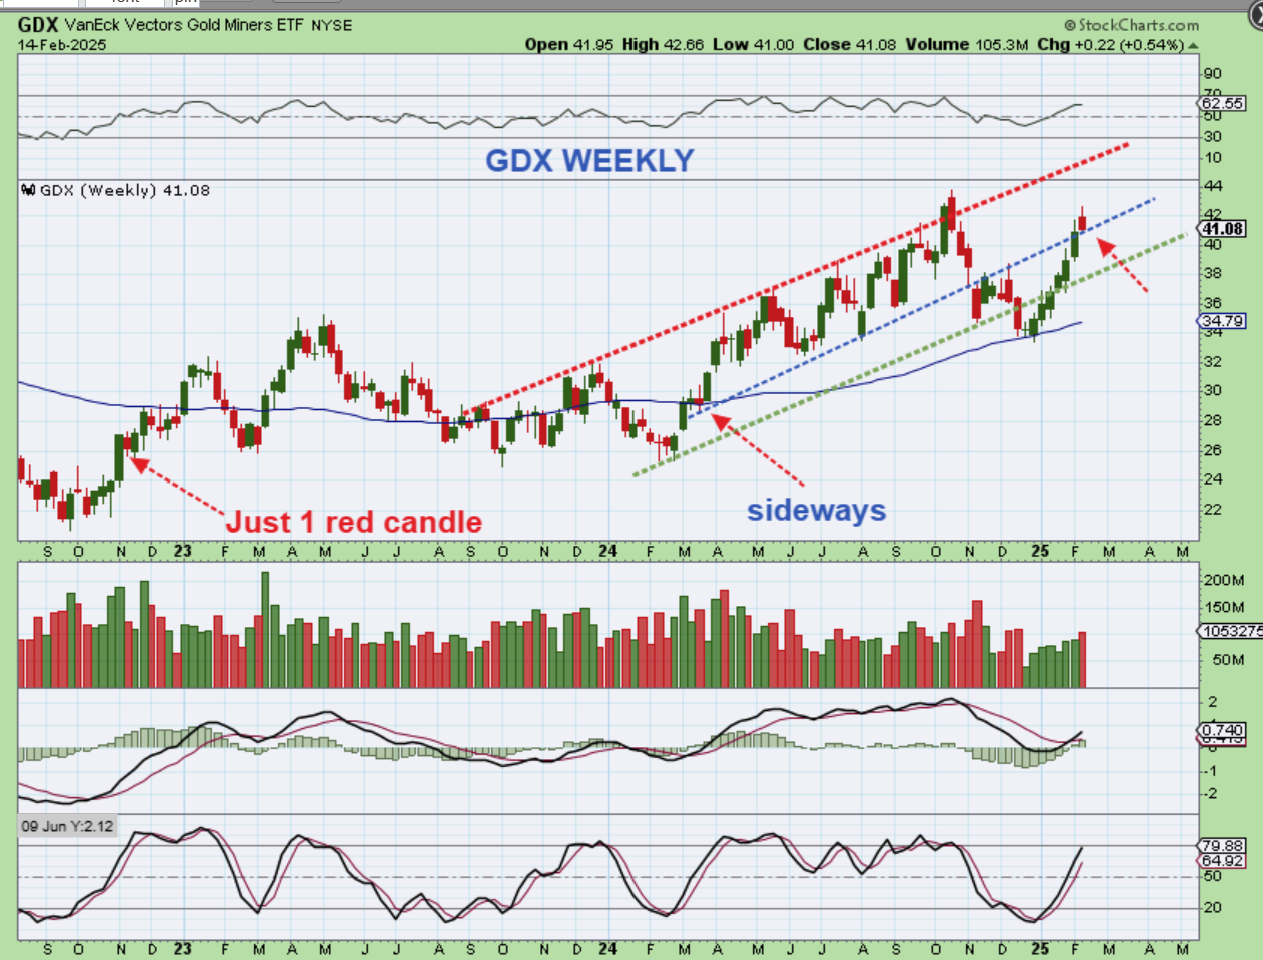
GDX WEEKLY – In the bigger picture, The GDX sold off sharply into that ICL, but it is also recovering rather quickly with that rally up the 8 ema seen on the daily chart. You can see that more upside is available, and we are only on the first daily cycle, so this would be a buy the dip dcl developing.
.
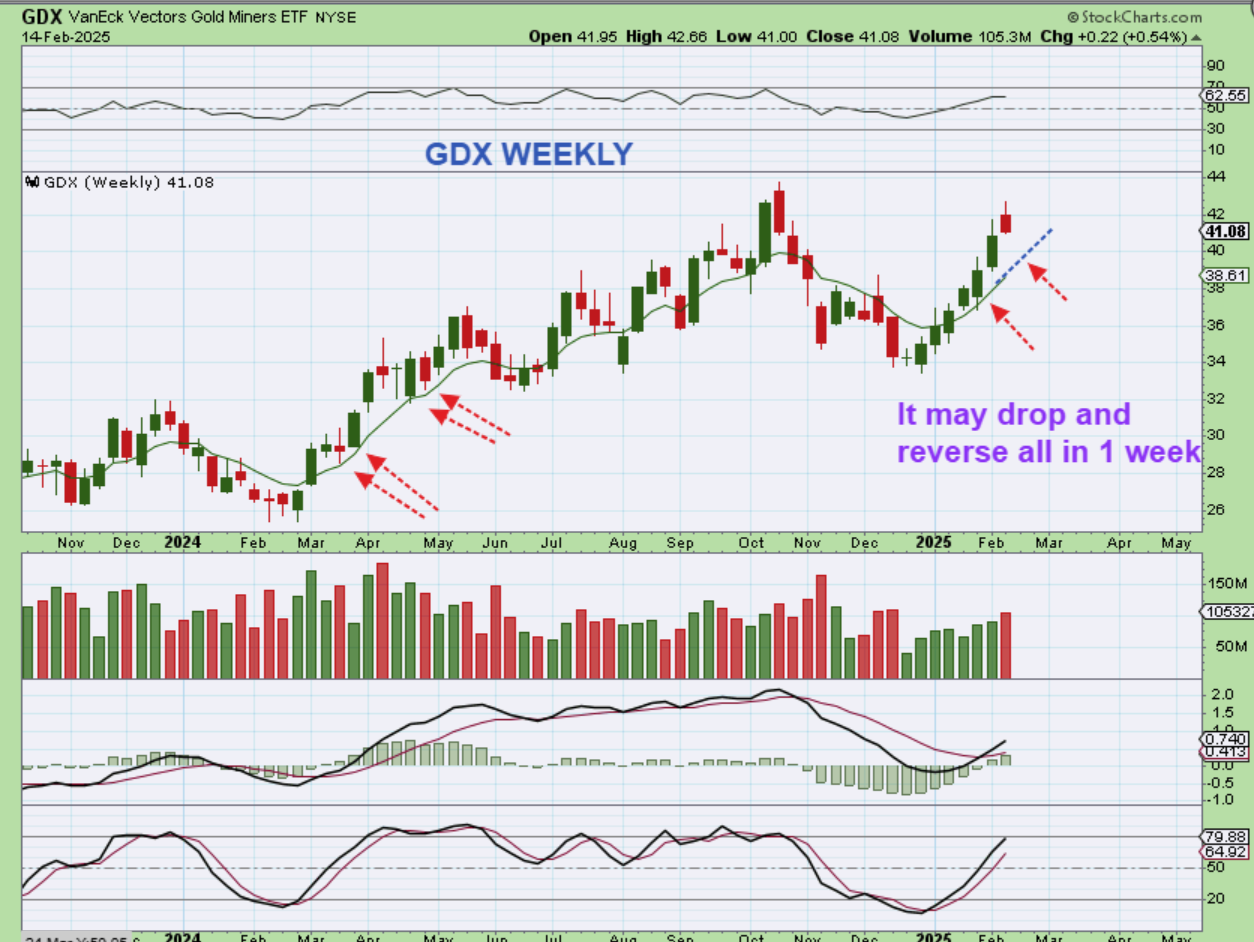
GDX WEEKLY -Past rallies rode up the 10 week ma, so we could drop there. I want to point out that a weekly reversal candle can develop when we drop for 2-3 days and then it turns higher for Thursday & Friday. Let me show you how bullish that can be. Look at the RED candle where we are now..
.
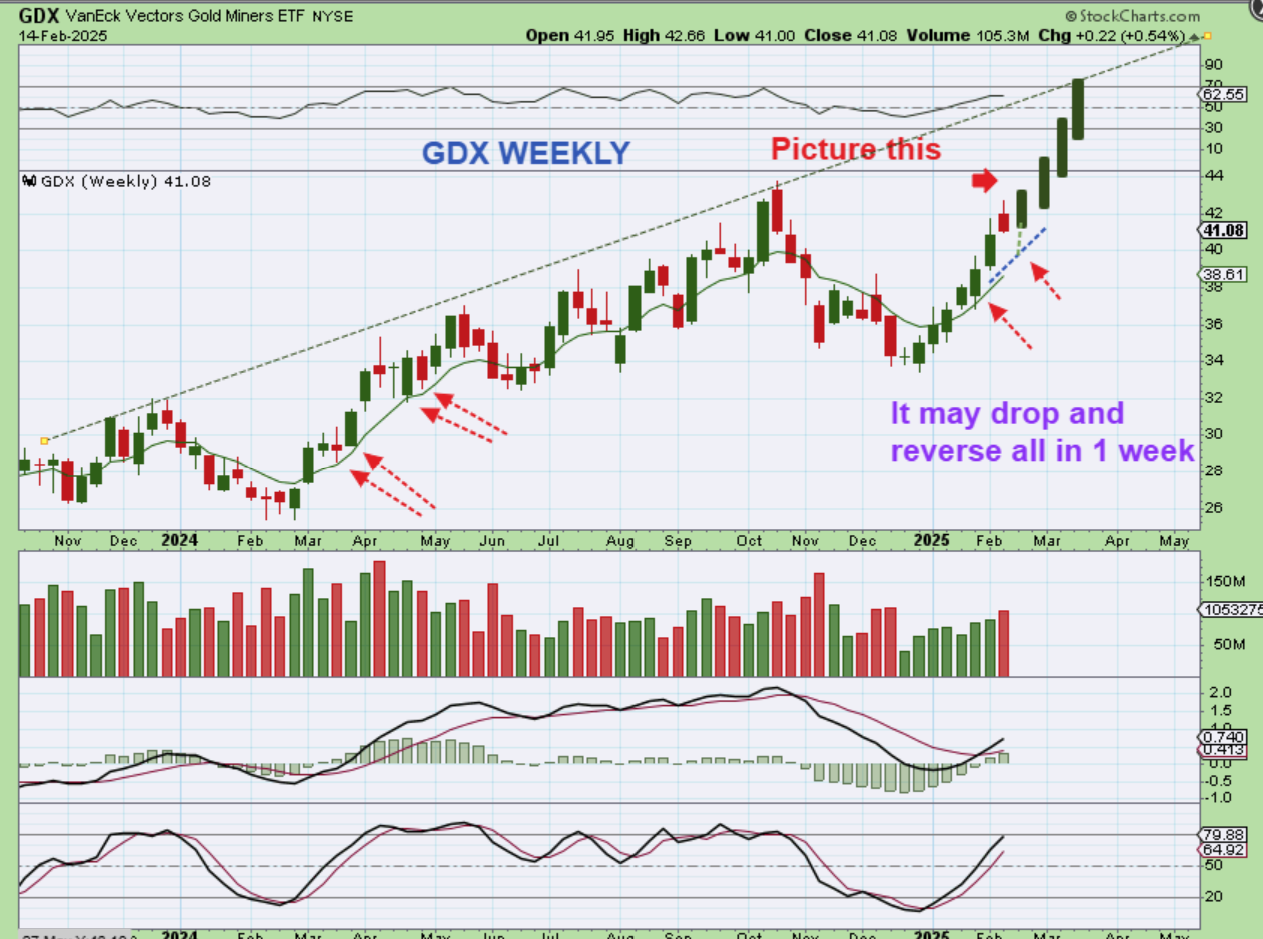
GDX WEEKLY – That Red candle could be followed next week by a drop to the 10 week ma that quickly reverses and off we run to new highs during daily cycle #2. I drew this about as bullishly as it gets 🙂 , but it shows that a dip next week can recover quickly. We’ll see.
,
The Bulls have been in control, but at times they do take a rest. When they do, especially if it is around the timing for a dcl, they become buy the dip / reversal set up. It is a long weekend in the US and the markets open on Tuesday, so rest up and we’ll see you on Tuesday! Have a great weekend!
,
~ALEX
.
From Friday:
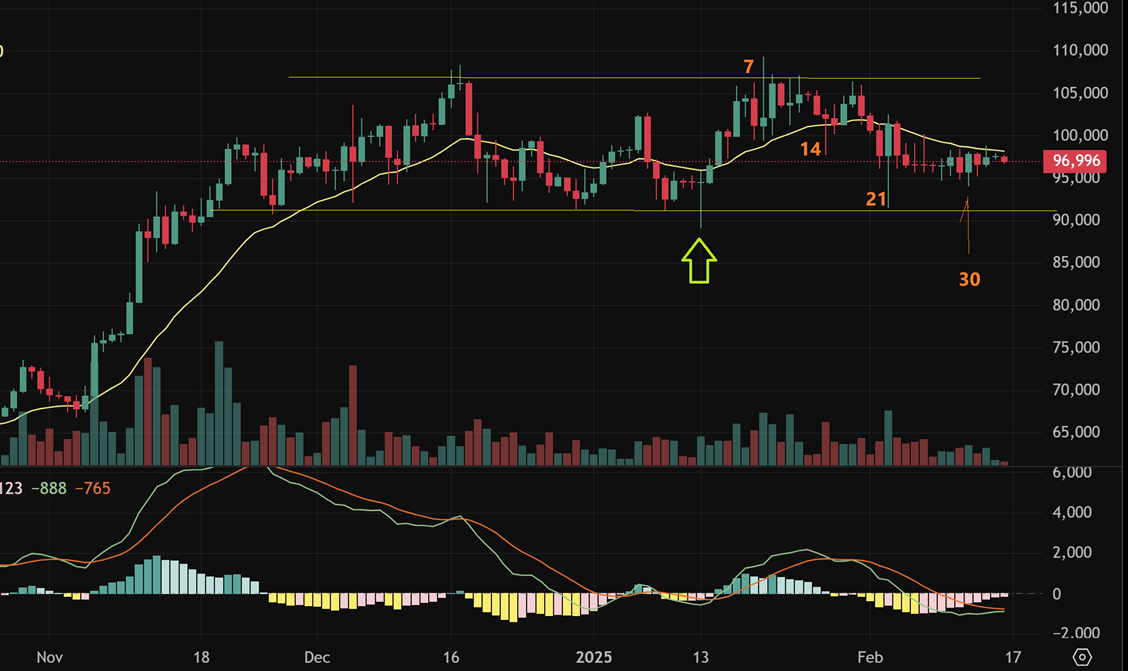
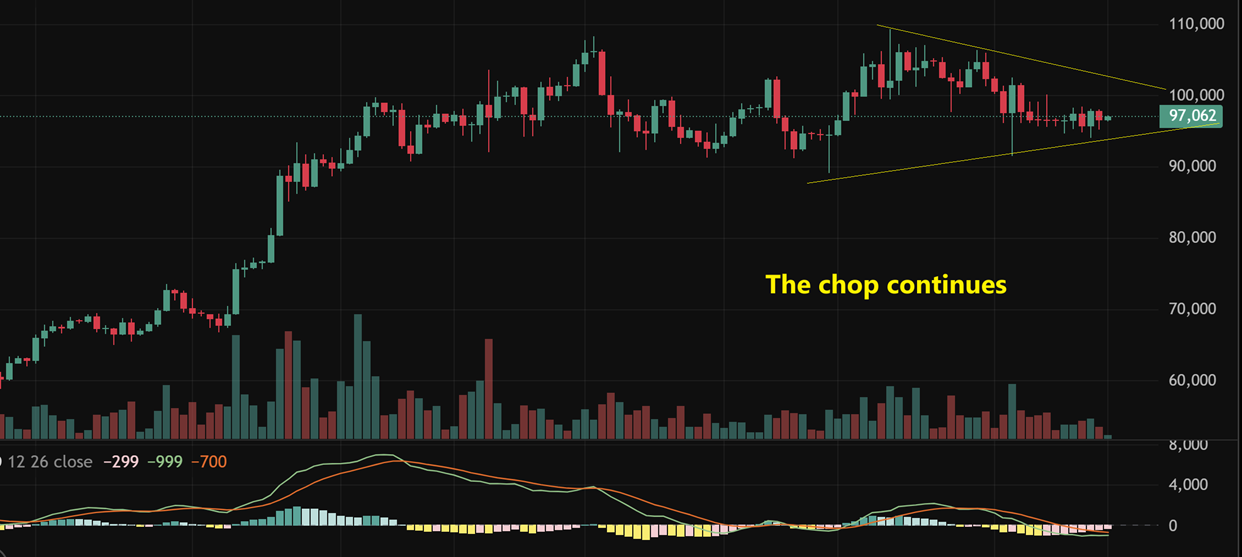
BITCOIN continues to chop sideways.
.
Bitcoin continues to chop sideways in this long boring consolidation. At this point, we do NOT want to see a break down below that green arrow, or it could be a real breakdown that continues for months if that was day 1. A break higher could get quite bullish. The yellow line is the 20 ema, and I’m just seeing it act as short-term resistance in this chop. A move above $100,000 would be bullish.