January 4th Weekend Report
.
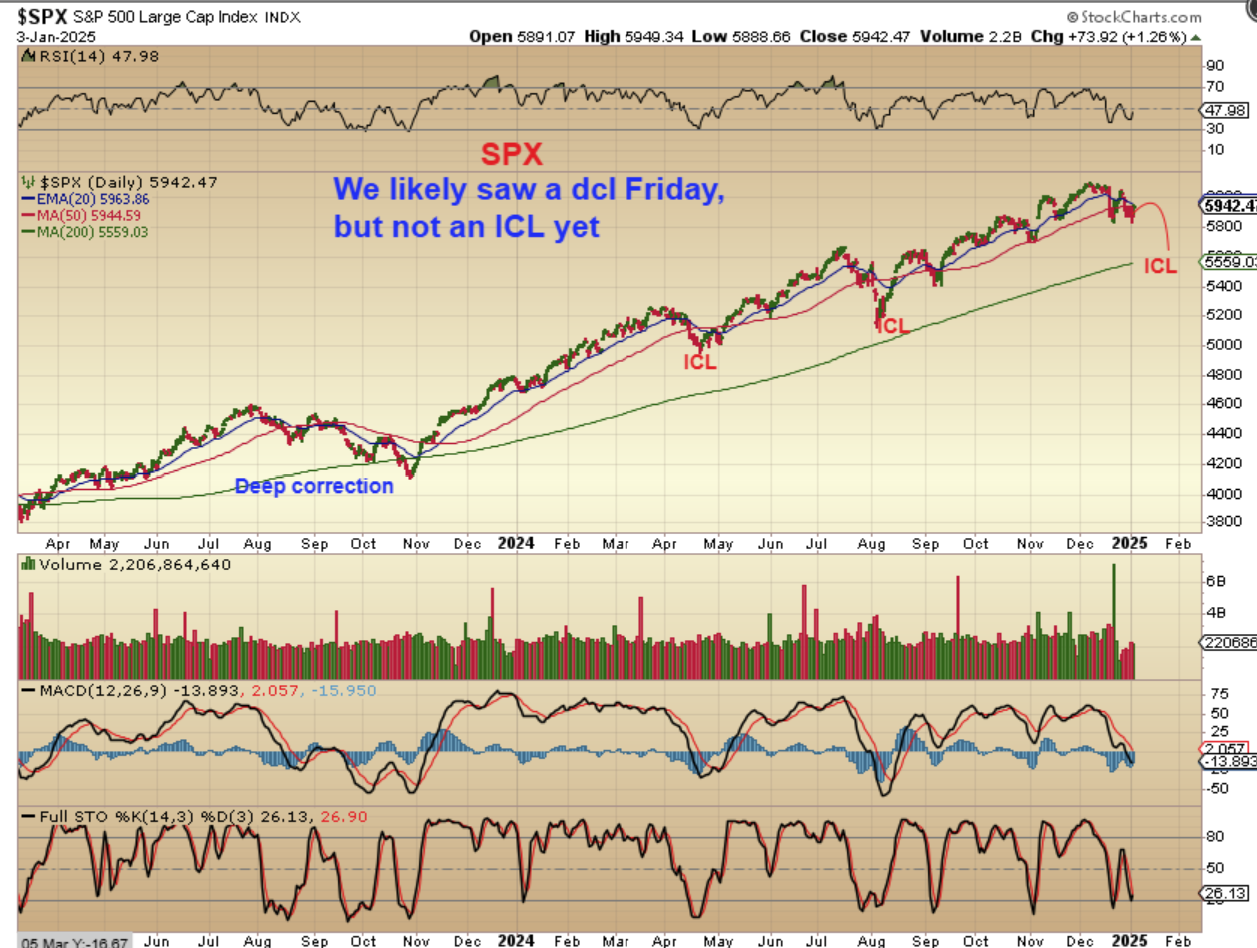
SPX DAILY– I want to point out a couple of things that are ‘Interesting’ about how last week ended. This looks like a dcl and we would normally expect a drop into an ICL later, maybe 3 or 4 weeks from now, starting after a good bounce. That is my main thinking right now, but let’s discuss this further though. I did see some interesting things last Thursday and Friday.
.
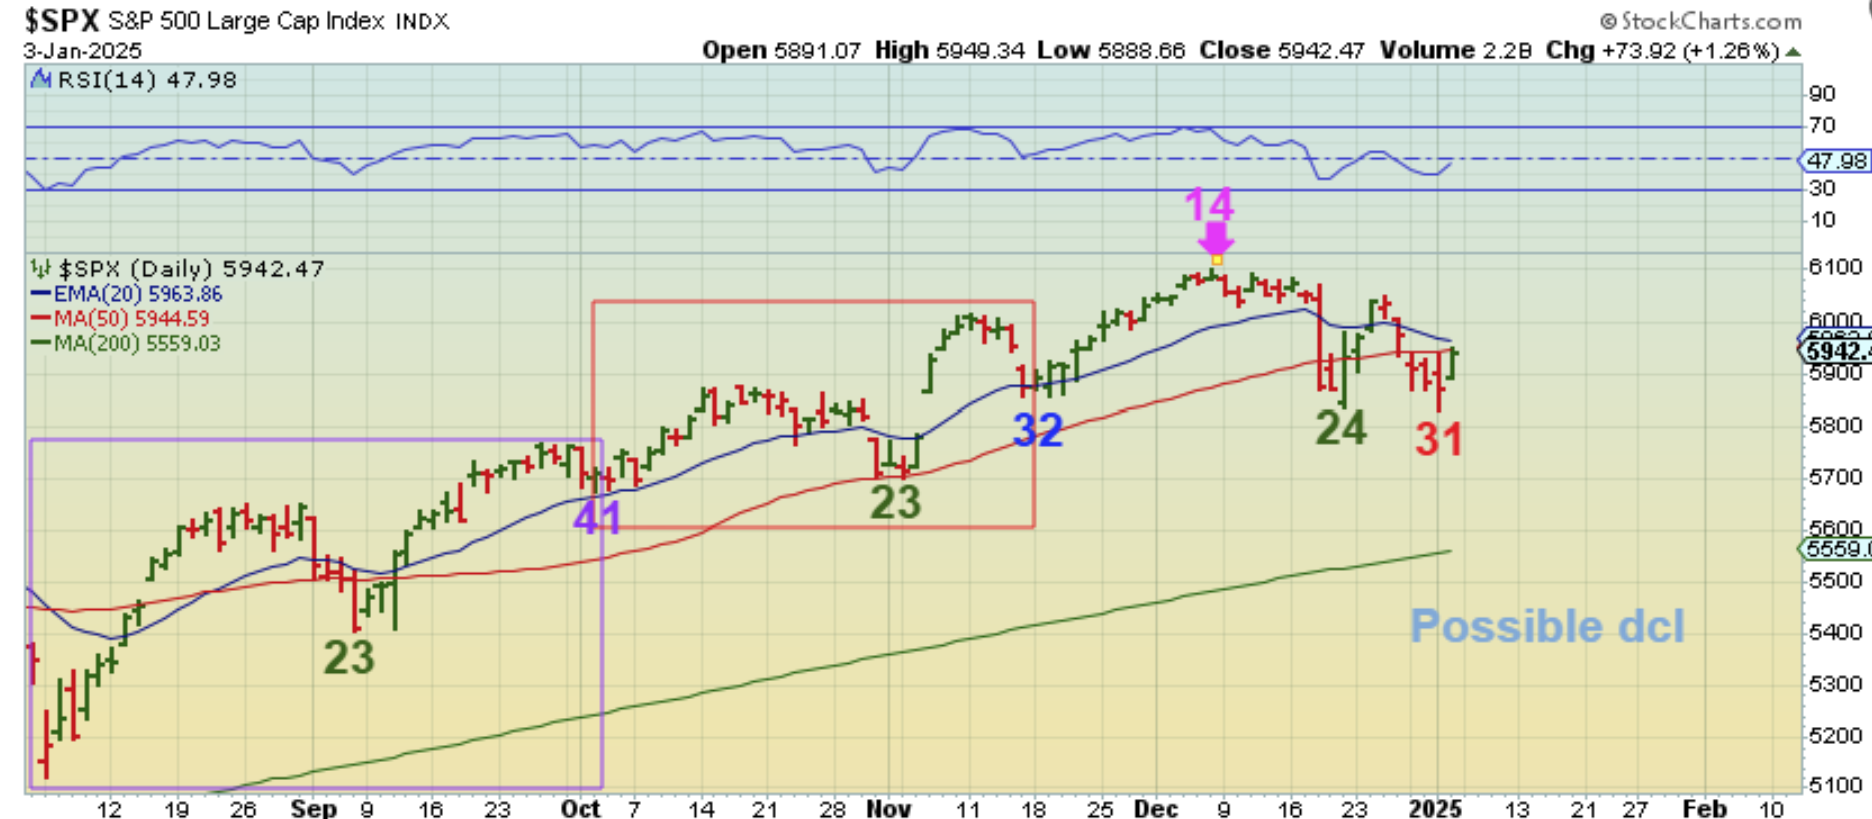
SPX DAILY – I can say that we had a L.T. daily cycle and a swing low after day 31, so this looks like a daily cycle low. This does NOT appear to be an ICL, it is very mild. Could this become a MILD ICL, with this a-b-c drop? Well, it’s not most likely to be an ICL, but I will show you something that I found that has me wondering about this bull run…
.
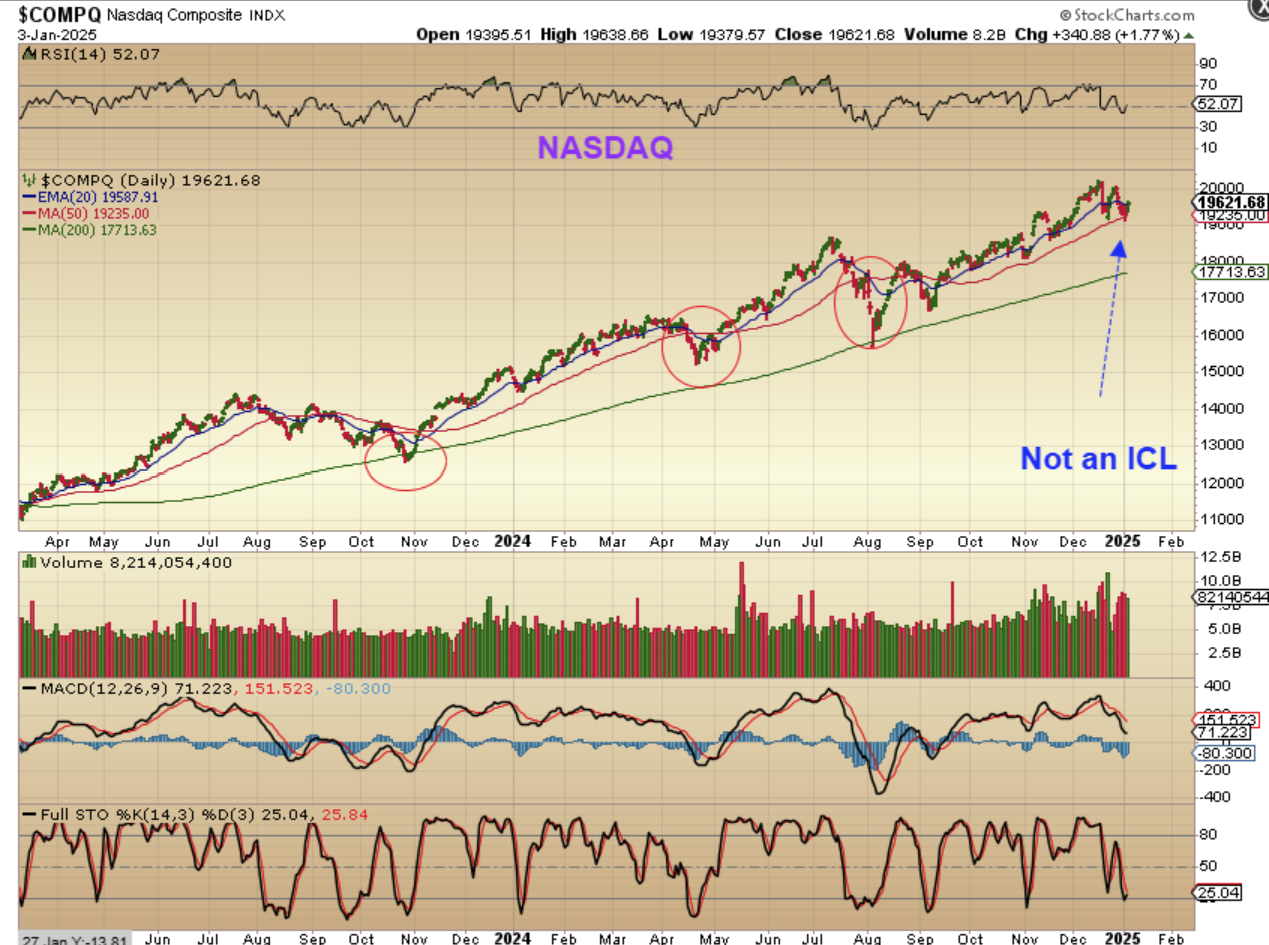
NASDAQ DAILY– Again, you can see just how mild the dip is where the Nasdaq didn’t even lose the 50sma. It doesn’t seem like an ICL, but could this just keep running? Let me show you something that I saw Thursday and Friday…
.
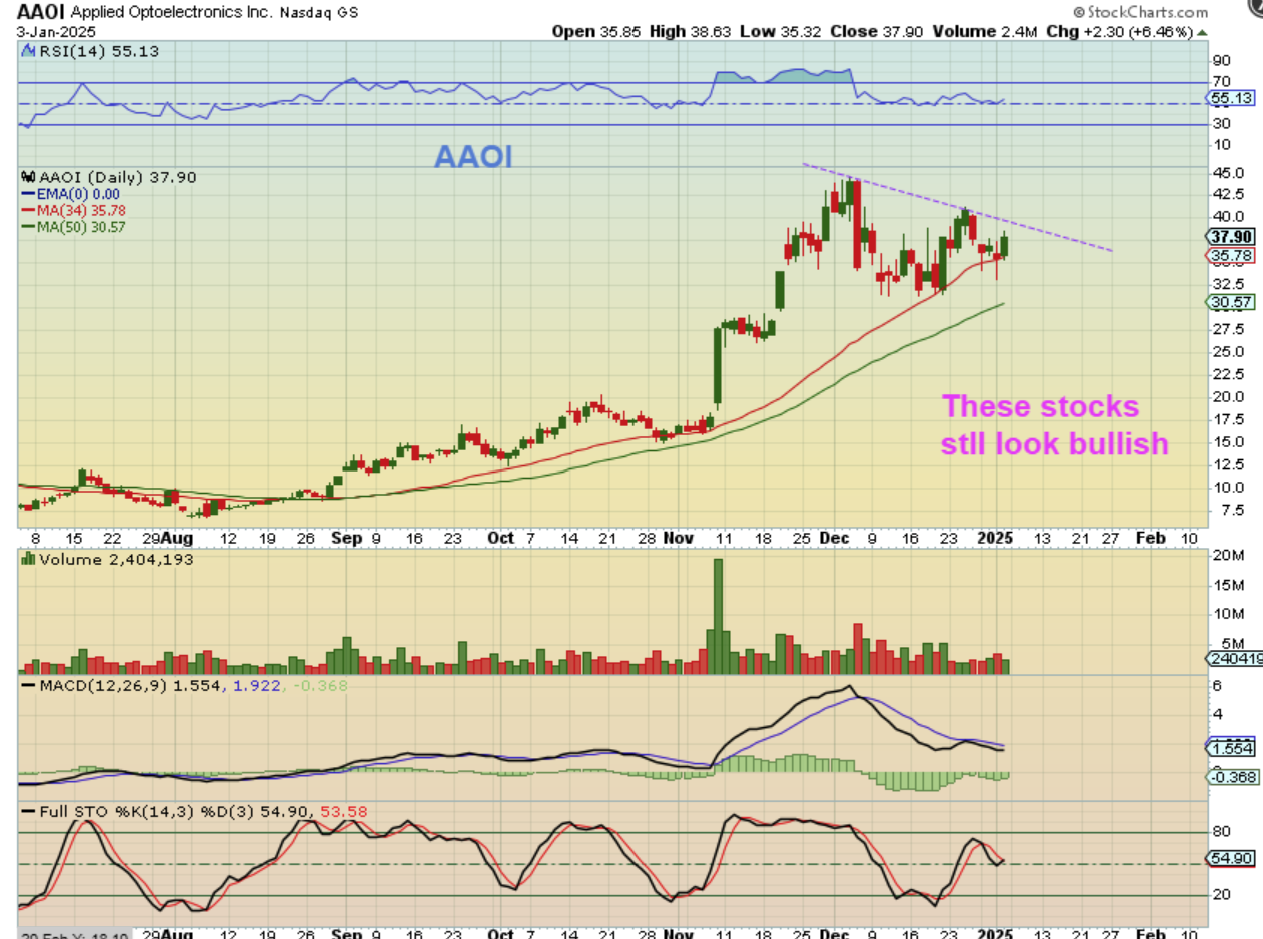
The bullish stocks that I liked and said I wanted to watch on the pullback are remaining quite healthy, so far. This could be a reaction to a dcl or an ICL…
.
AAOI didn’t make a new low this week, it rode the 34 sma and is turning up. Again, it may be a dcl and a buy with a stop, it also may be signaling that the bull isn’t done yet? And…
.
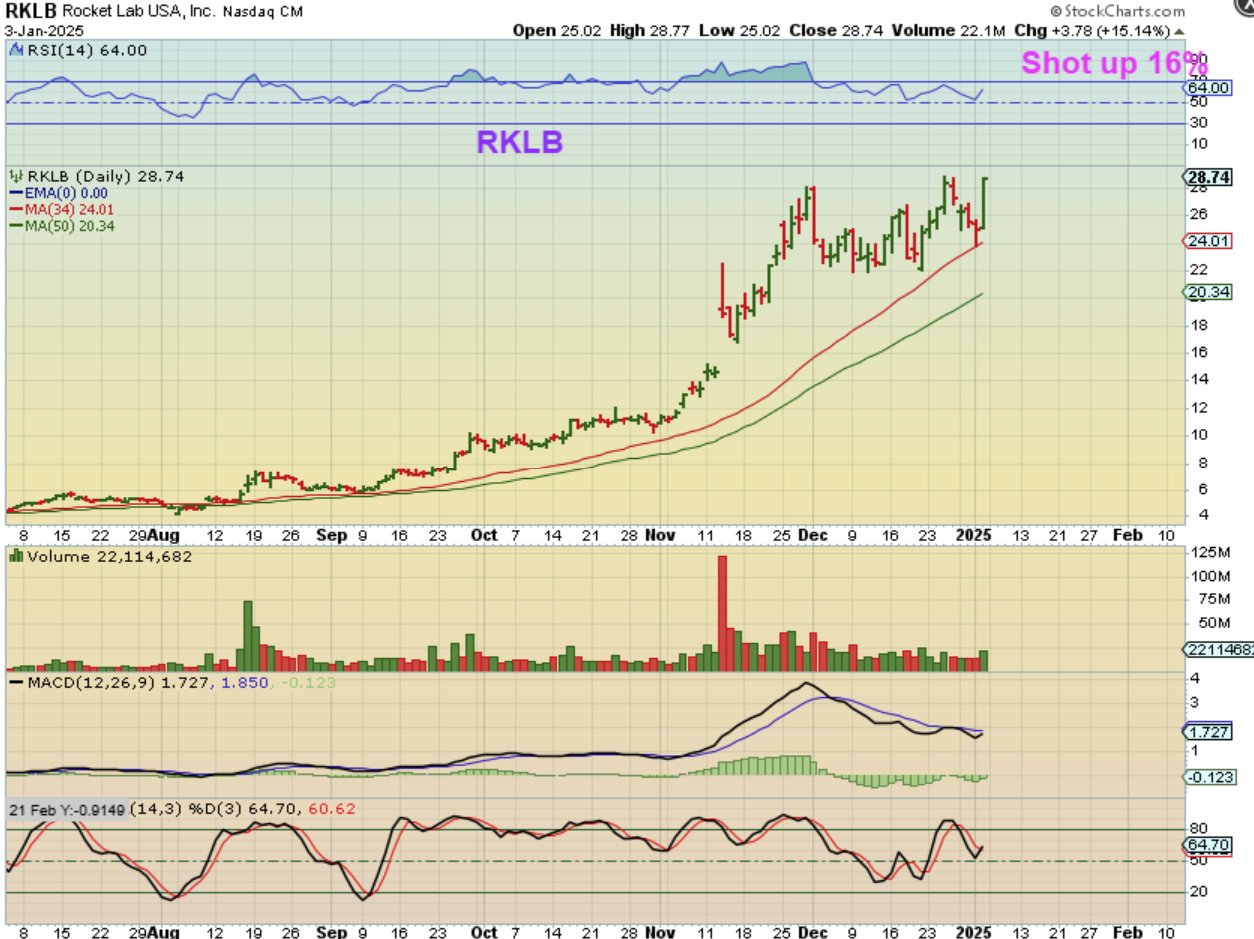
Another one that I really liked was RKLB, and it shot up 16% to new all-time highs.
.
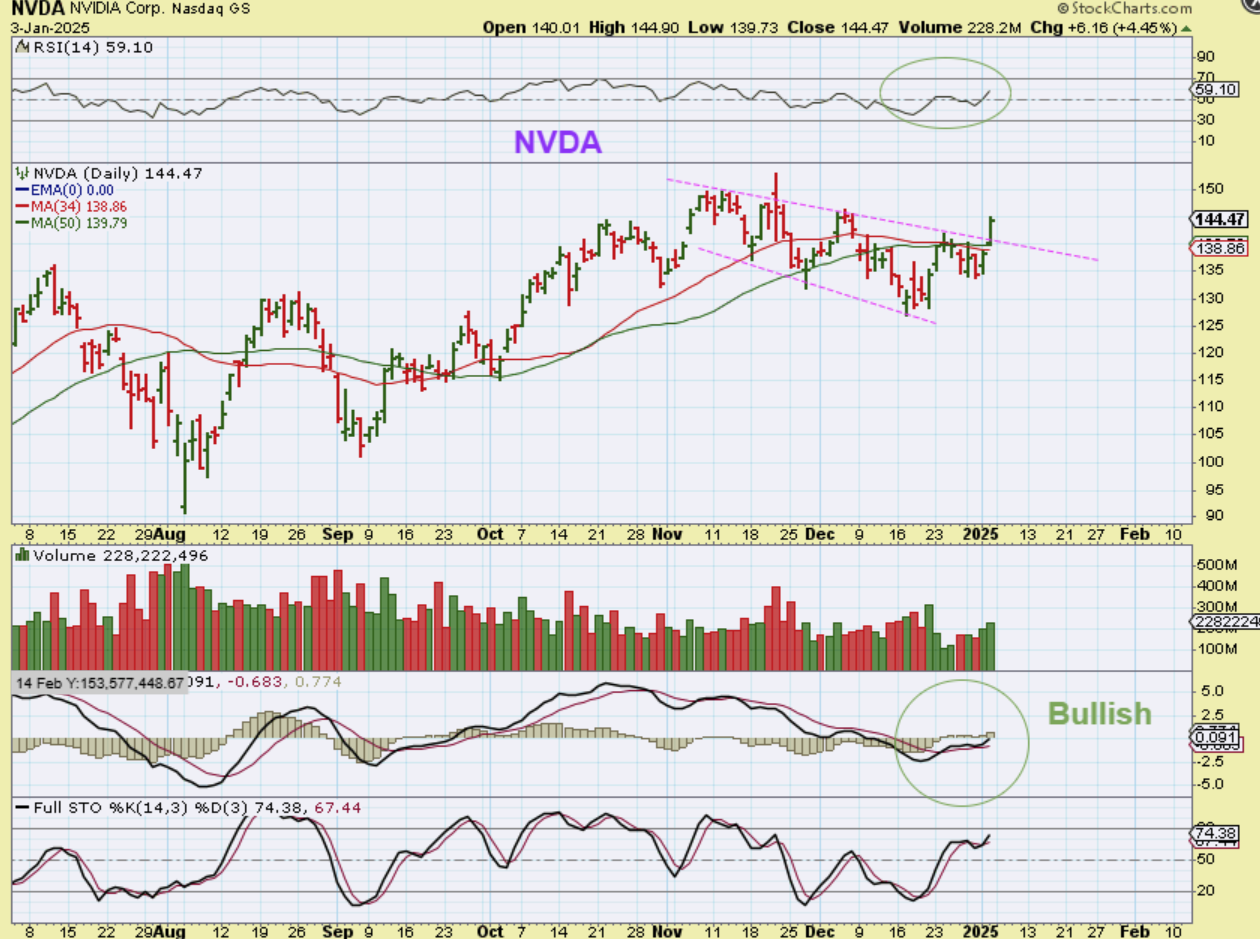
NVDA really looks like a ‘buy’ to me. So think about this: Last week it was looking like it was being rejected at the 50sma and suddenly Thursday & Friday it breaks out. Let me explain this another way…
.
Let me explain this another way. ICLs come roughly every 6 months and we had an ICL last August, so 6 months is January. It makes sense. On Monday and Tuesday we saw the markets selling off. They were selling off into the end of 2024 and it looked like they’d continue to sell off into 2025 into an ICL (and they still could after a dcl bounce for 2 weeks or so), but we saw buying for the first 2 days of 2025. I also saw something that made me think twice, so I’ll just mention it here as a possible point of interest…
.
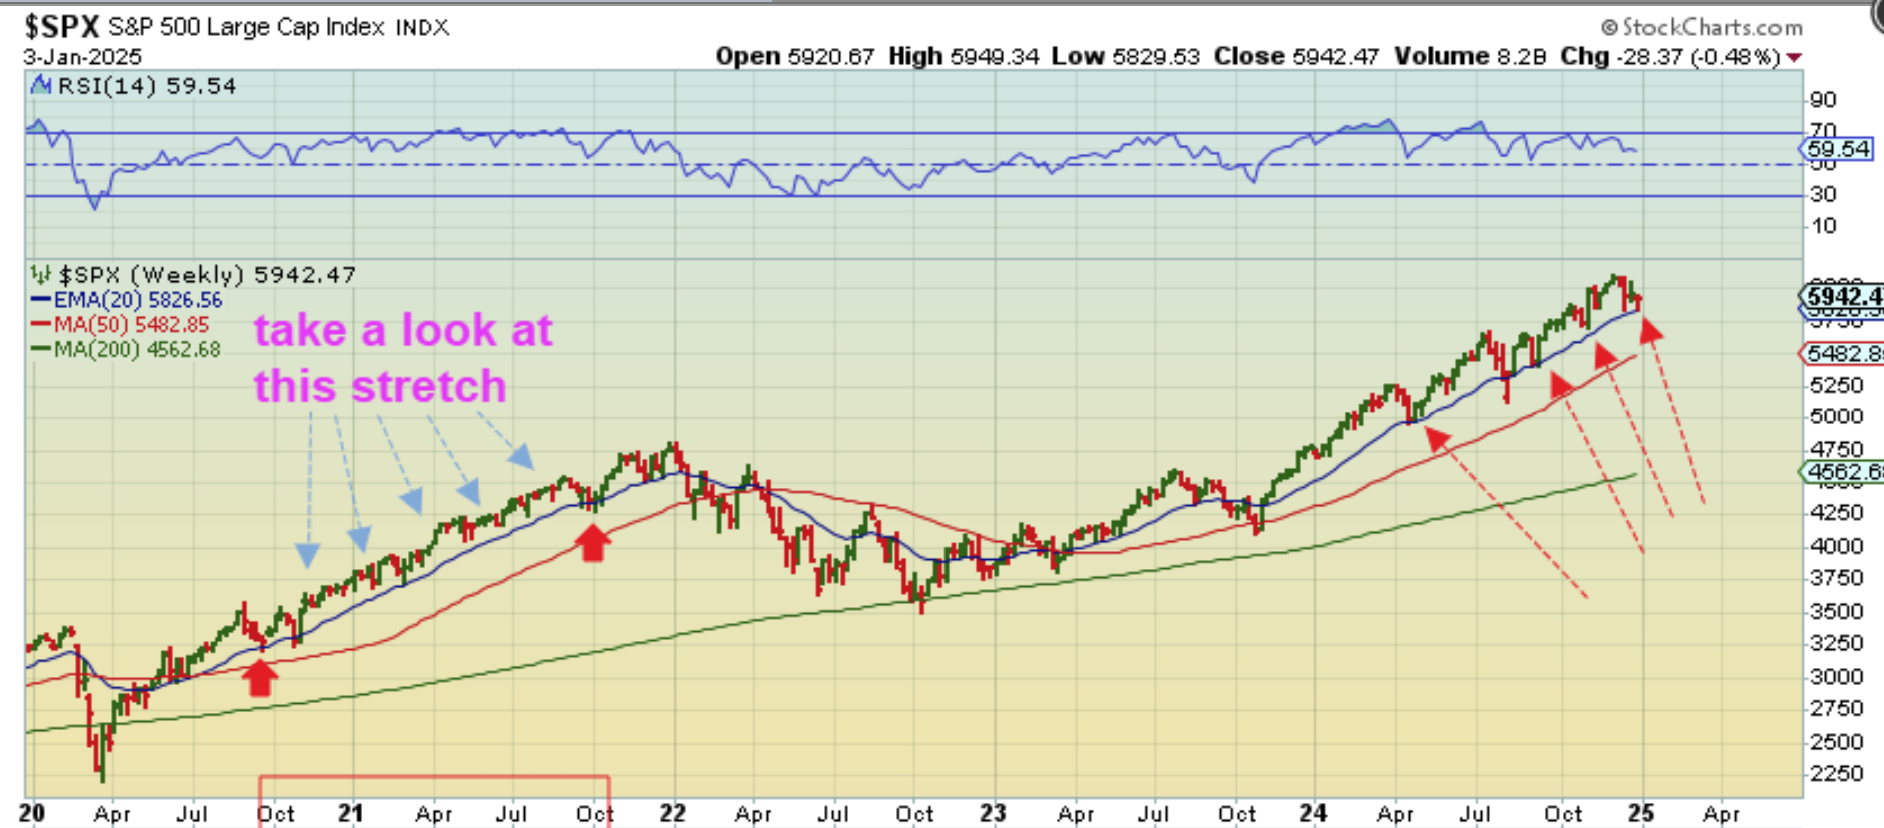
SPX WEEKLY – 2020 and 2024 were election years. I wanted to compare that with now and was surprised at what I found:
1. Look at October 2020 and that post-election rally into 2021.
2. That rally in 2021 didn’t give a solid slam down ICL for about a year, right? It dipped to the blue 20ema weekly line, and really that is all that we are seeing now. SO that raises the question:
3. Could 2025 rally in a similar way that 2021 did? I’d say maybe it could, but you can still just buy the dcl with stops in case we do roll over in a couple of weeks into the ICL drop.
.
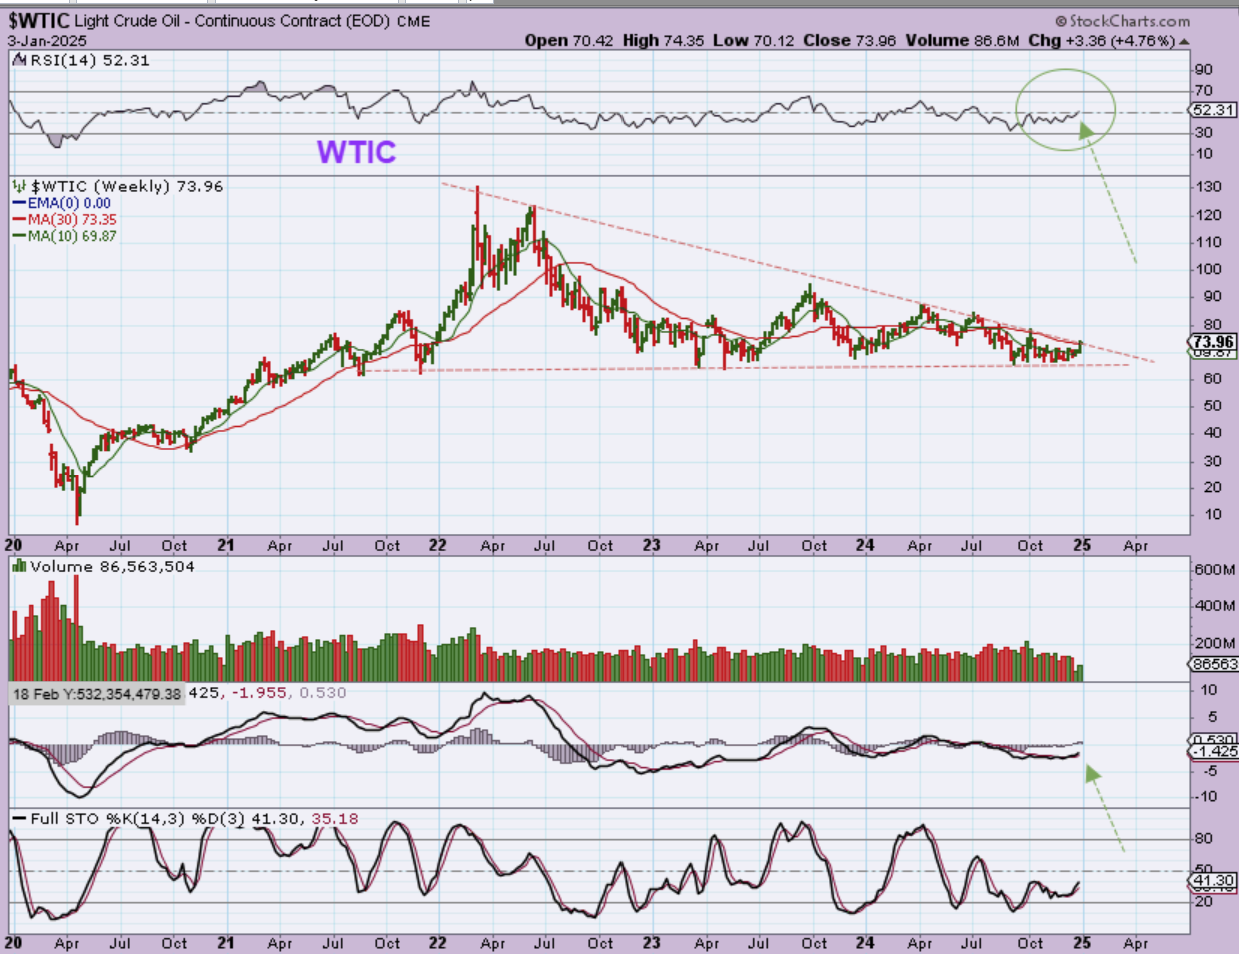
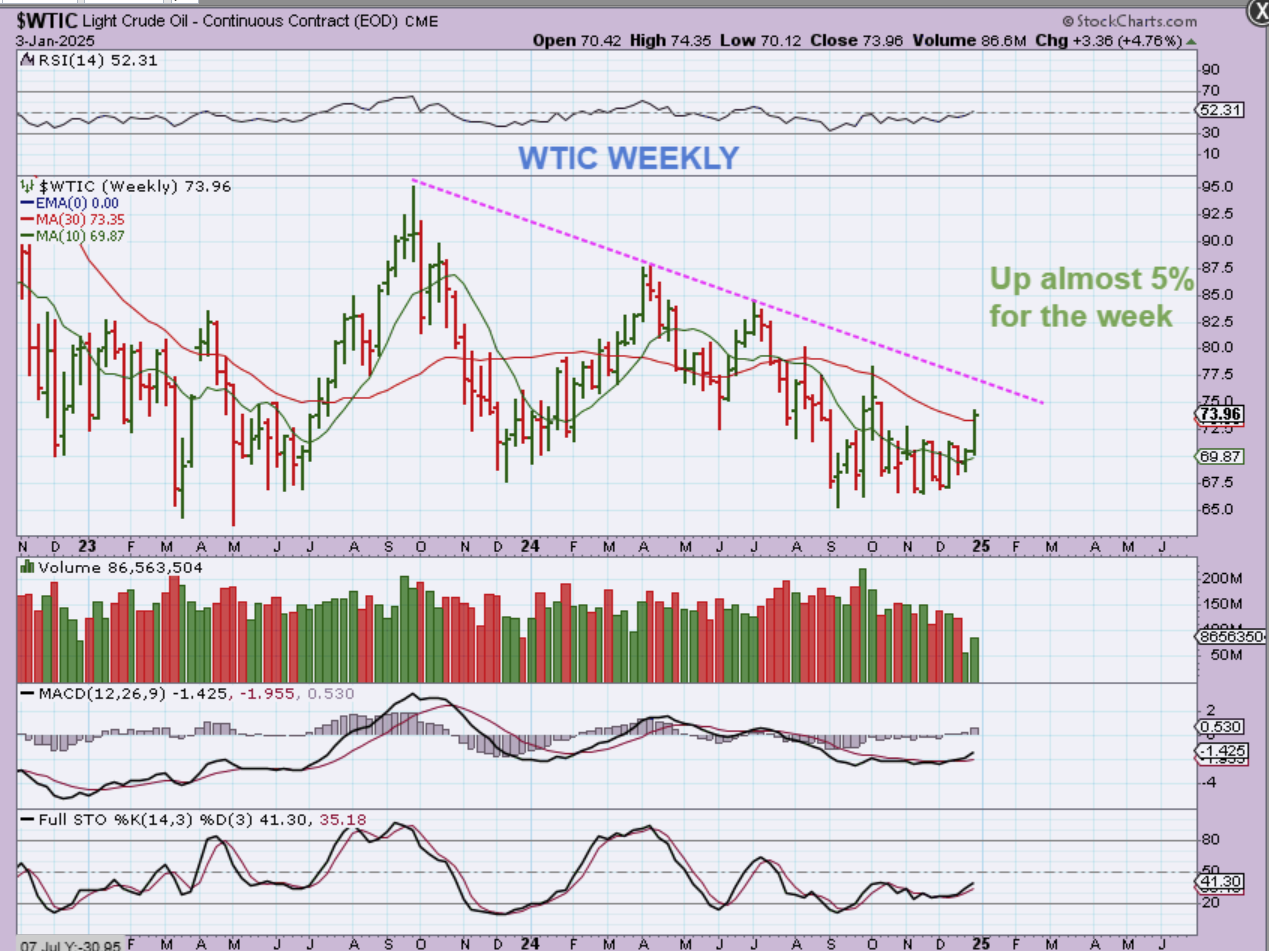
WTIC WEEKLY– Oil has actually been showing strengthening, so we’ll see if it can breakout or not next week. This is another case of a set up that is L.T., but it is also inside a triangular formation. Let’s zoom in…
.
WTIC WEEKLY– Before this 5% ‘up week’, Oil has chopped sideways week after week after week. It was set up to break down because we are about 16 weeks from the last ICL, but suddenly it pushed higher. A move above the October highs makes this R.T. and a downtrend breakout, so that could change this from bearish chop to bullish pop.
.
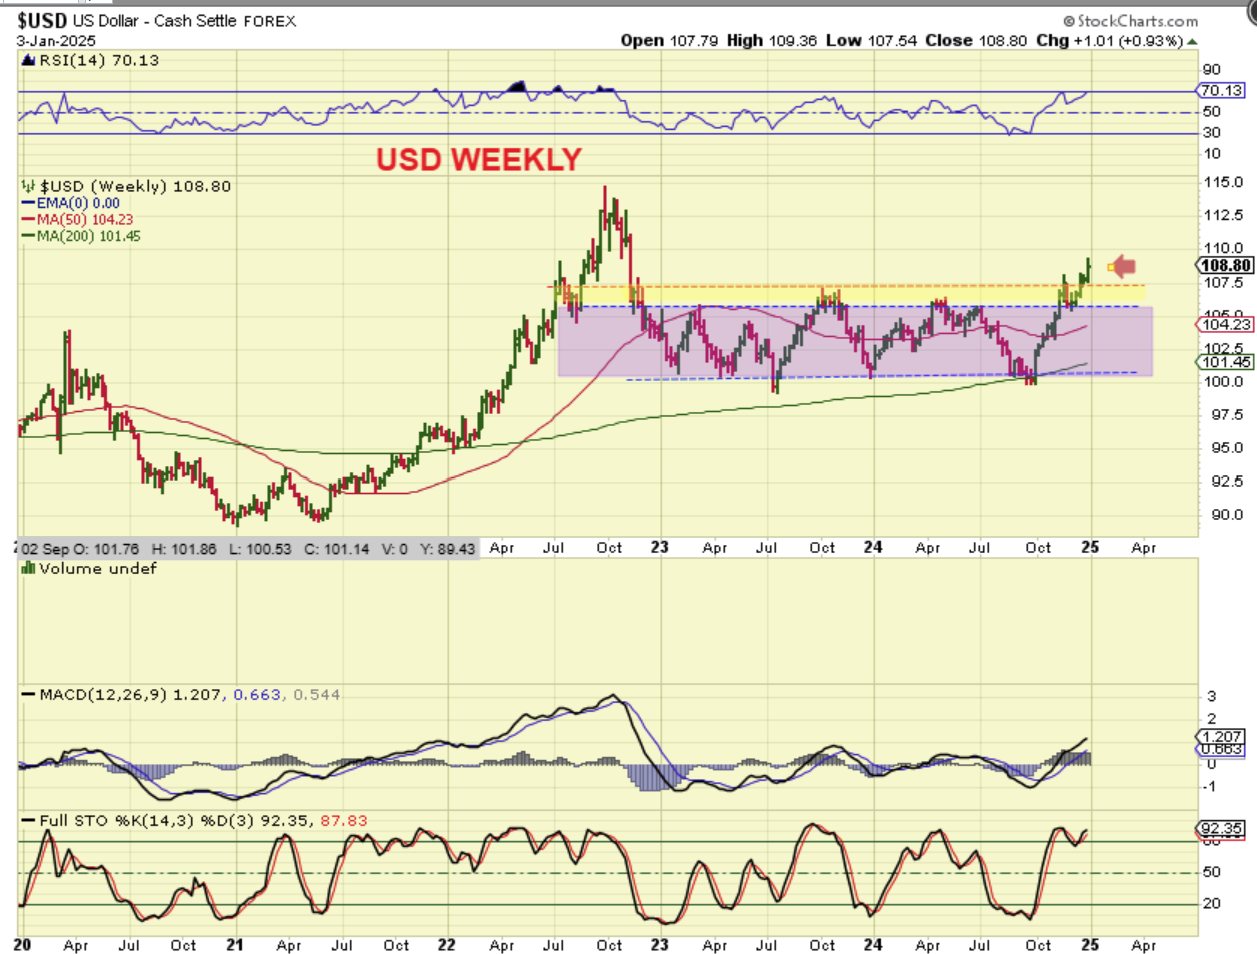
THE USD WEEKLY is showing us a breakout with a back test and now more new recent highs, so this is bullish, but it has not hindered Gold at all.
.
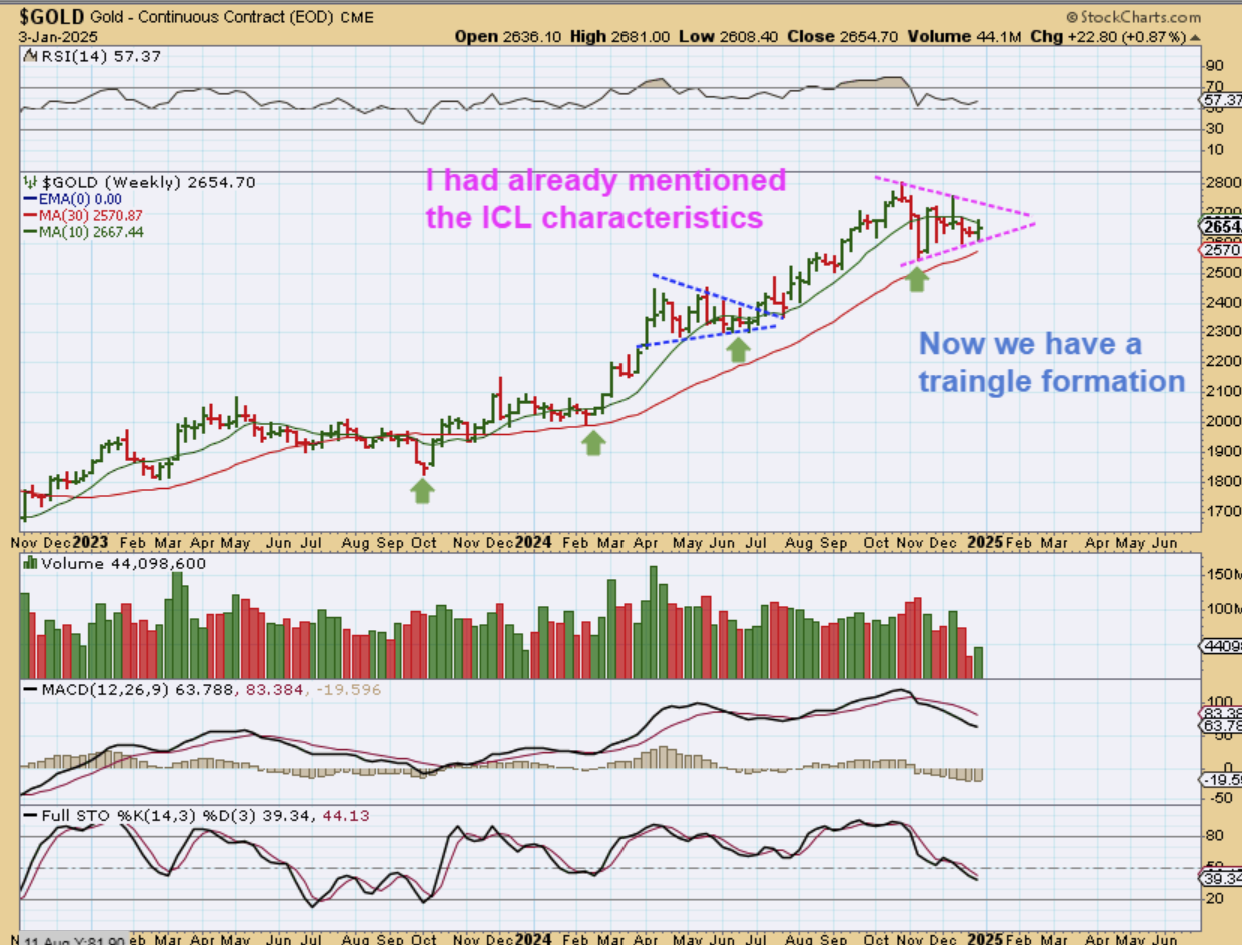
GOLD WEEKLY – I said that an ICL appears to be in place, but Gold chopped sideways. It is now forming a triangle. Please read the chart, Gold does look set to continue higher in a second daily cycle. Excuse the typo on the chart 🙂
.
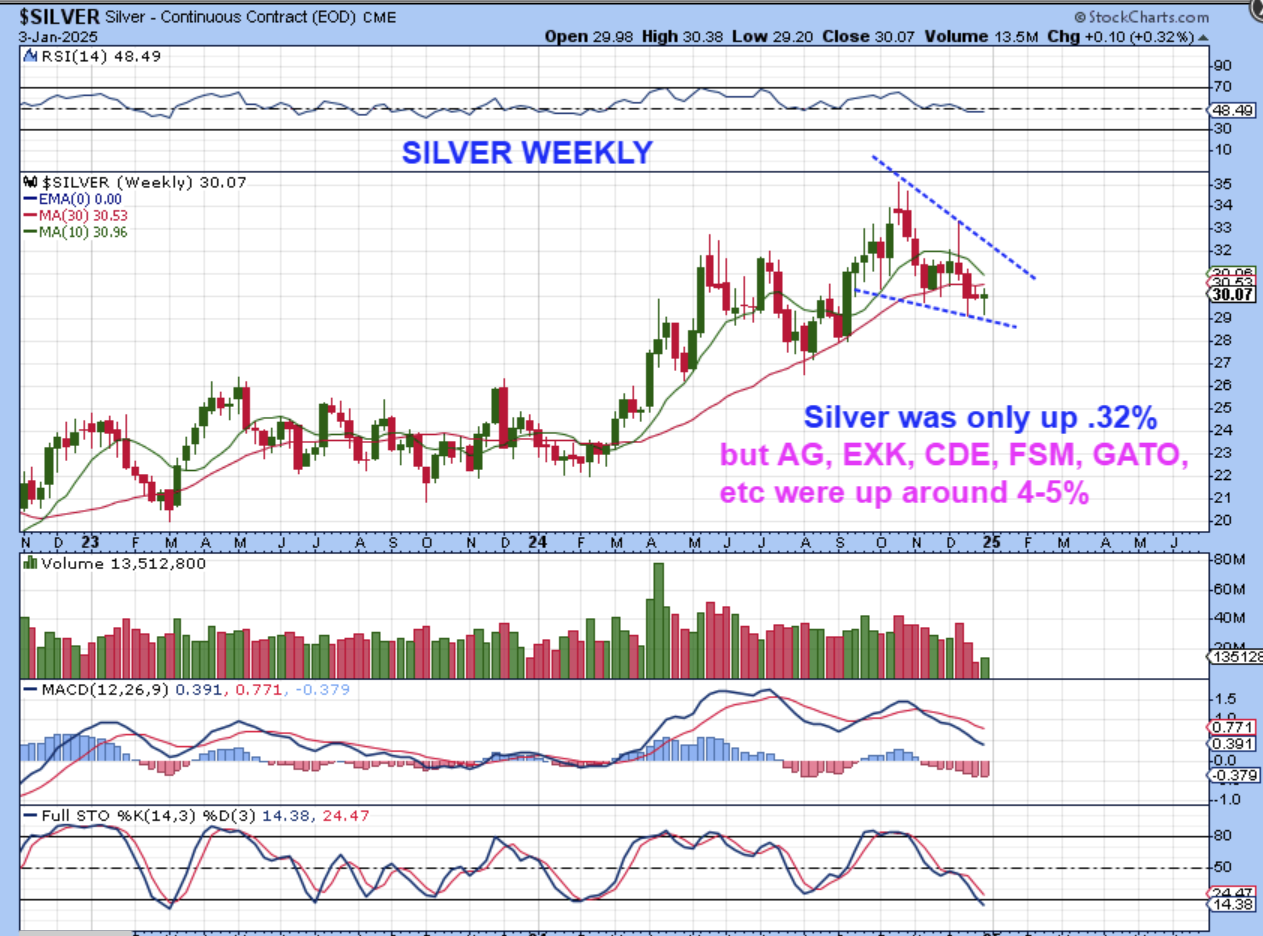
SILVER WEEKLY– Silver was up slightly last week, but Silver Miners did a bit better. This also may be ready to break & run, but the wedge also does have time for more chop.
.
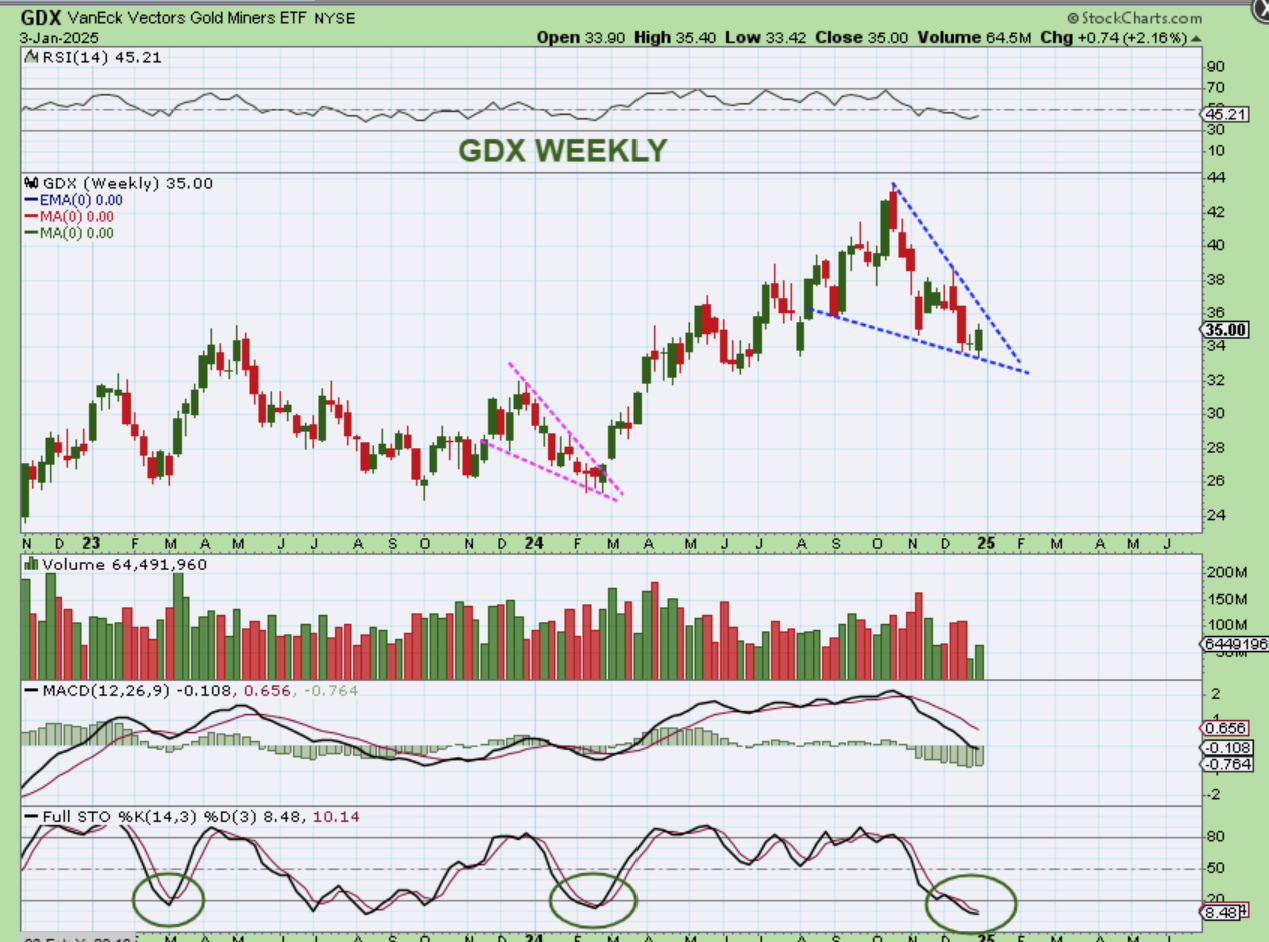
GDX WEEKLY- The Miners may be ready to go too. This bullish descending wedge is running out of room in the Apex and if Gold has an ICL and a move higher in the 2nd daily cycle is taking place, I see Miners reacting positively. They did look good last week and since they are at the lows, you can buy with a stop.
.
Things look pretty bullish heading into 2025, and Bitcoin is included in that. I’ll cover that below, have a great weekend!
.
~ALEX
.
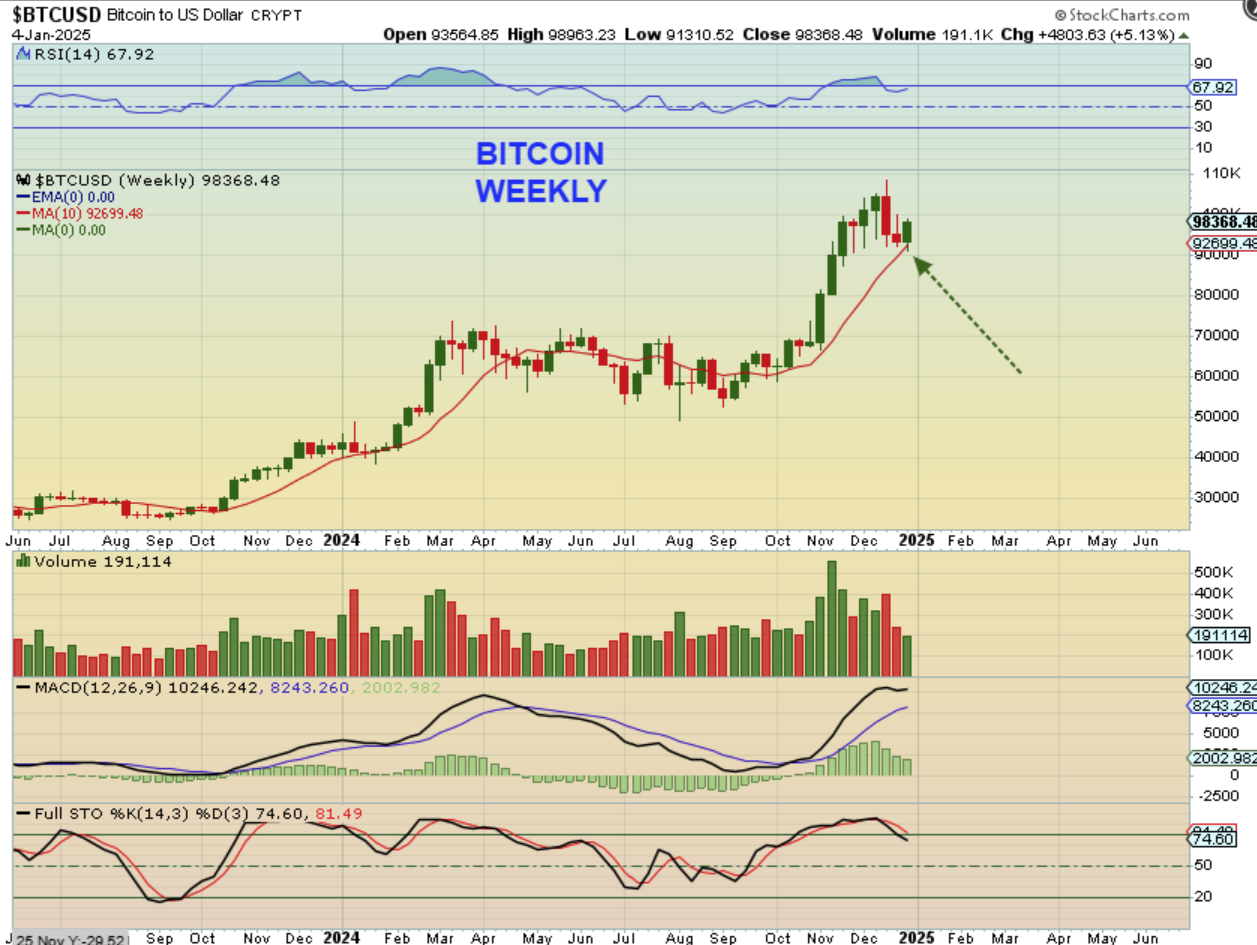
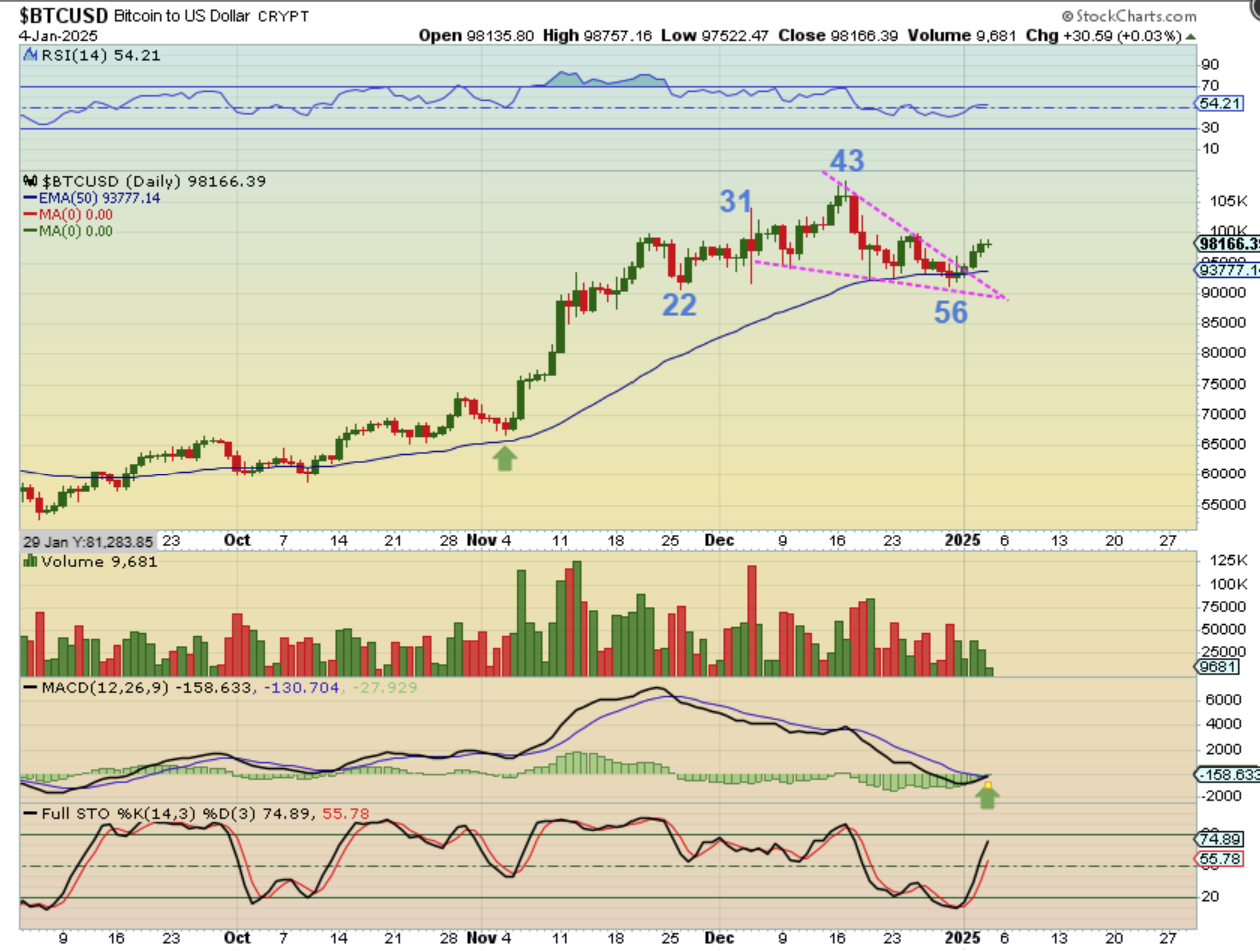
Bitcoin put in a low at day 56 and broke out from a bullish descending wedge. With that downtrend break and reversal at the 50 ema, the crypto stocks seemed to finally respond bullishly. Let’s hope for follow through and a continuation on the run.
.
Bitcoin Weekly: Bitcoin popped off of the 10 week ma, and that is a bullish set up in technical analysis.