
January 12 Weekend Report
.
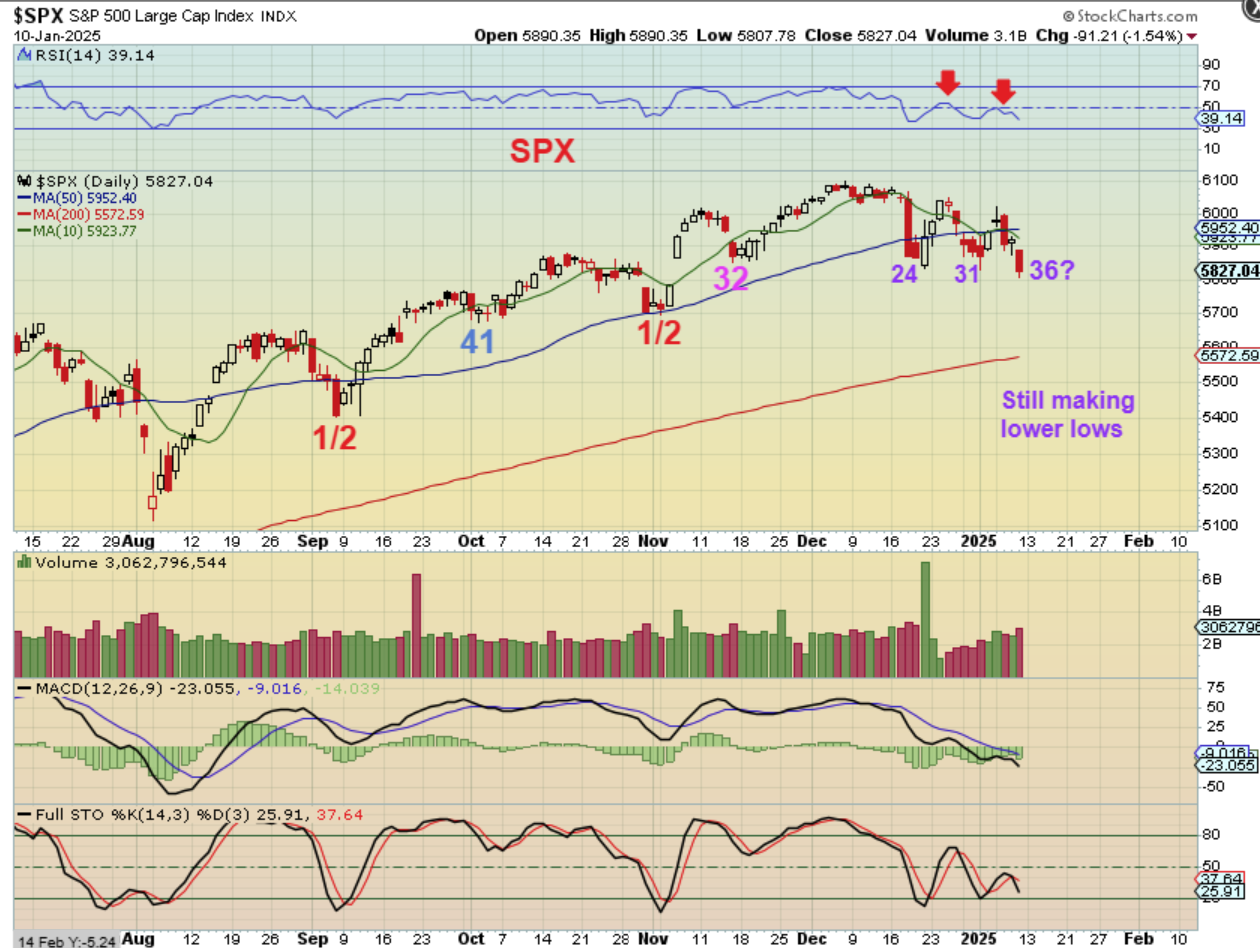
SPX– Entering the new year, the markets are choppy and a bit indecisive. We rally for 2-3 days and then drop to a slight new low, so it is making it hard to tell of we have a dcl or the dcl is still ahead. So with that…
.
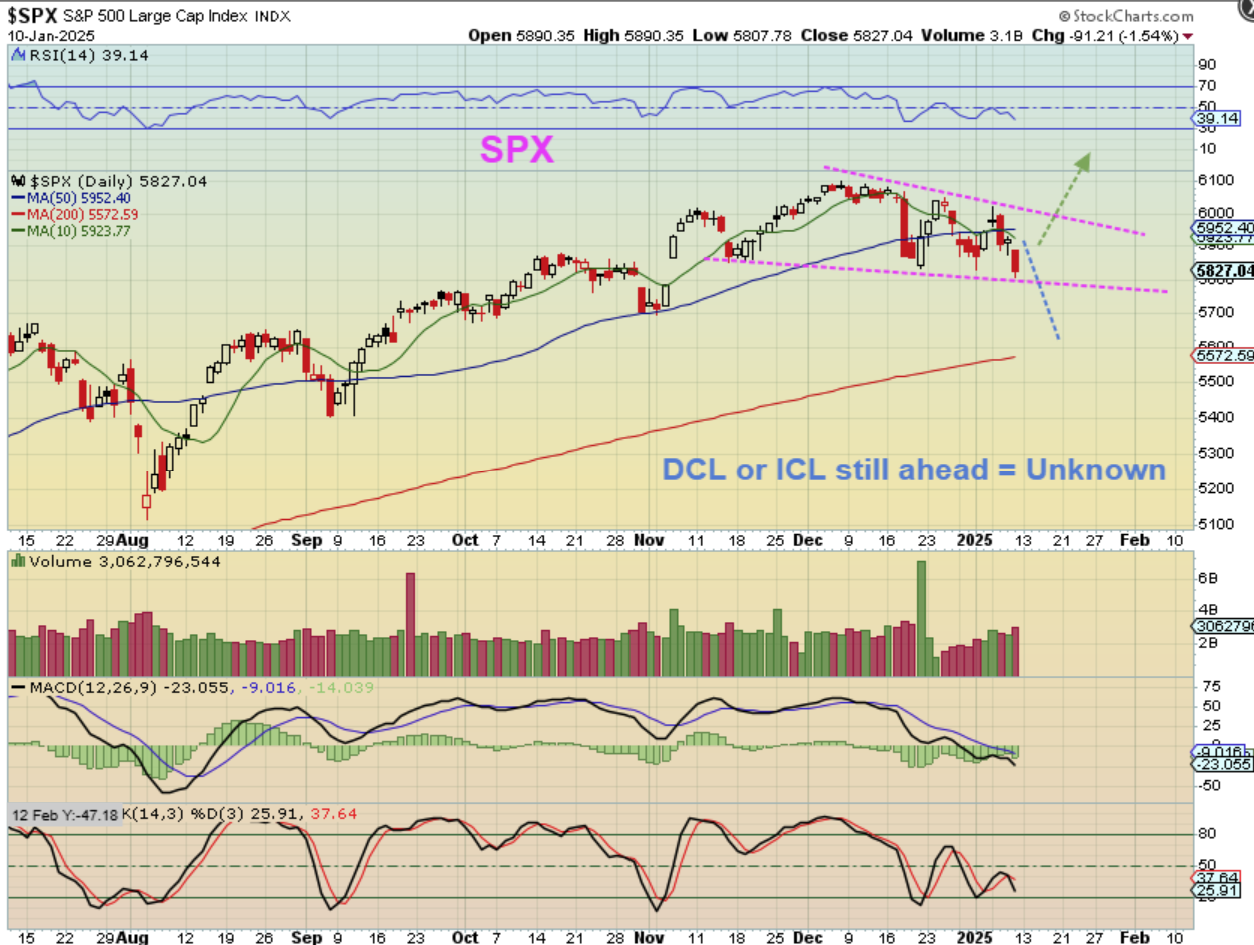
SPX – This COULD/MAYBE drop to the 200sma for a dcl, if we get some unacceptable data, or it could just rally out of a dcl anytime in this choppy period. Let’s go to a weekly chart of the Nasdaq…
.
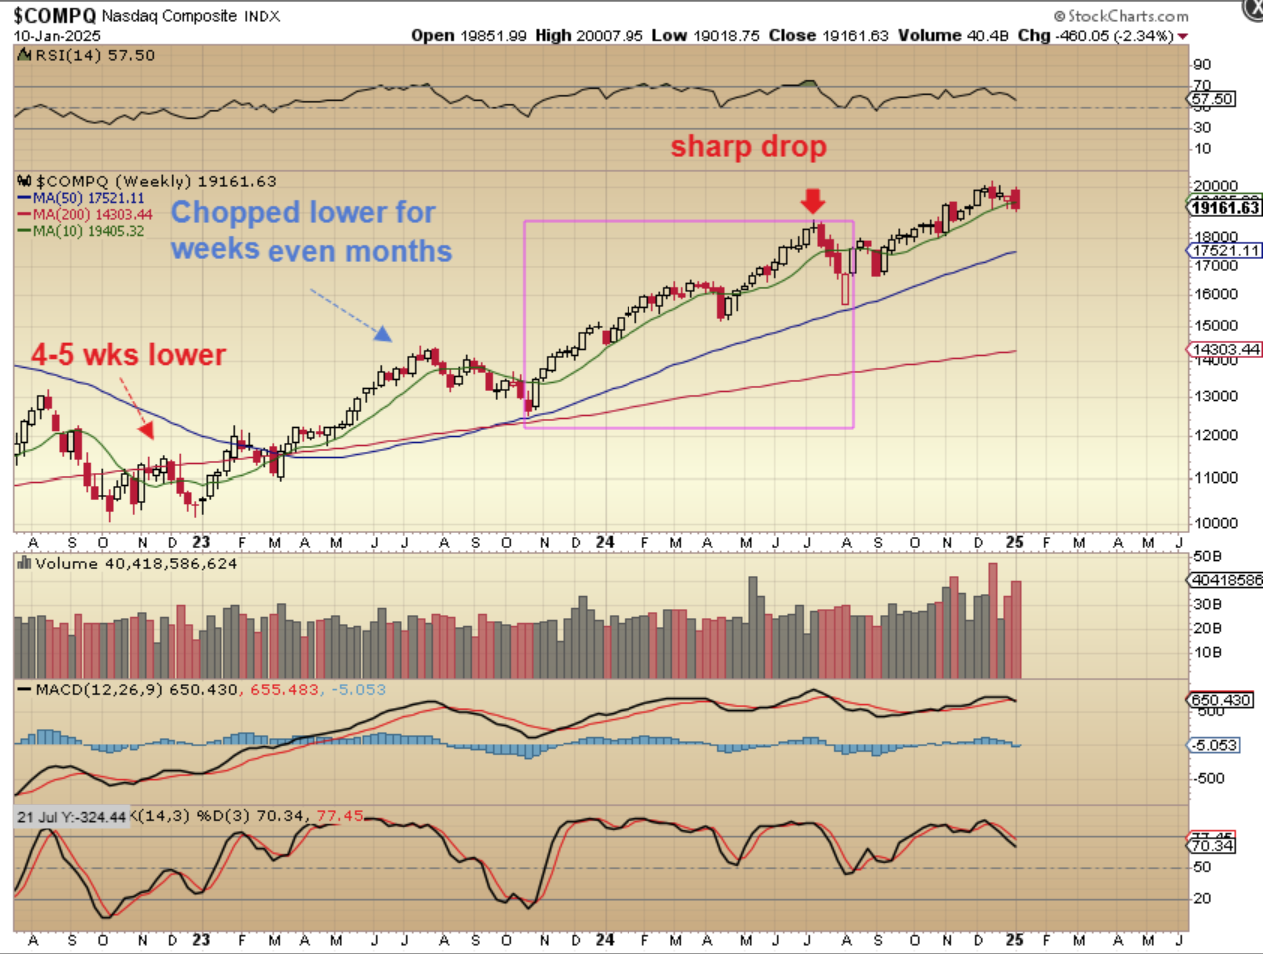
NASDAQ WEEKLY- Here I just wanted to show you various kinds of ‘selloffs’ when an ICL comes due, because the severity of the selling does vary in a bull market. I do see volume increasing right now & the weekly MACD about to cross lower, so this does cause me to feel more inclined to think that we will see a sell off into an ICL soon. The blue 50 week ma could be a target.
.
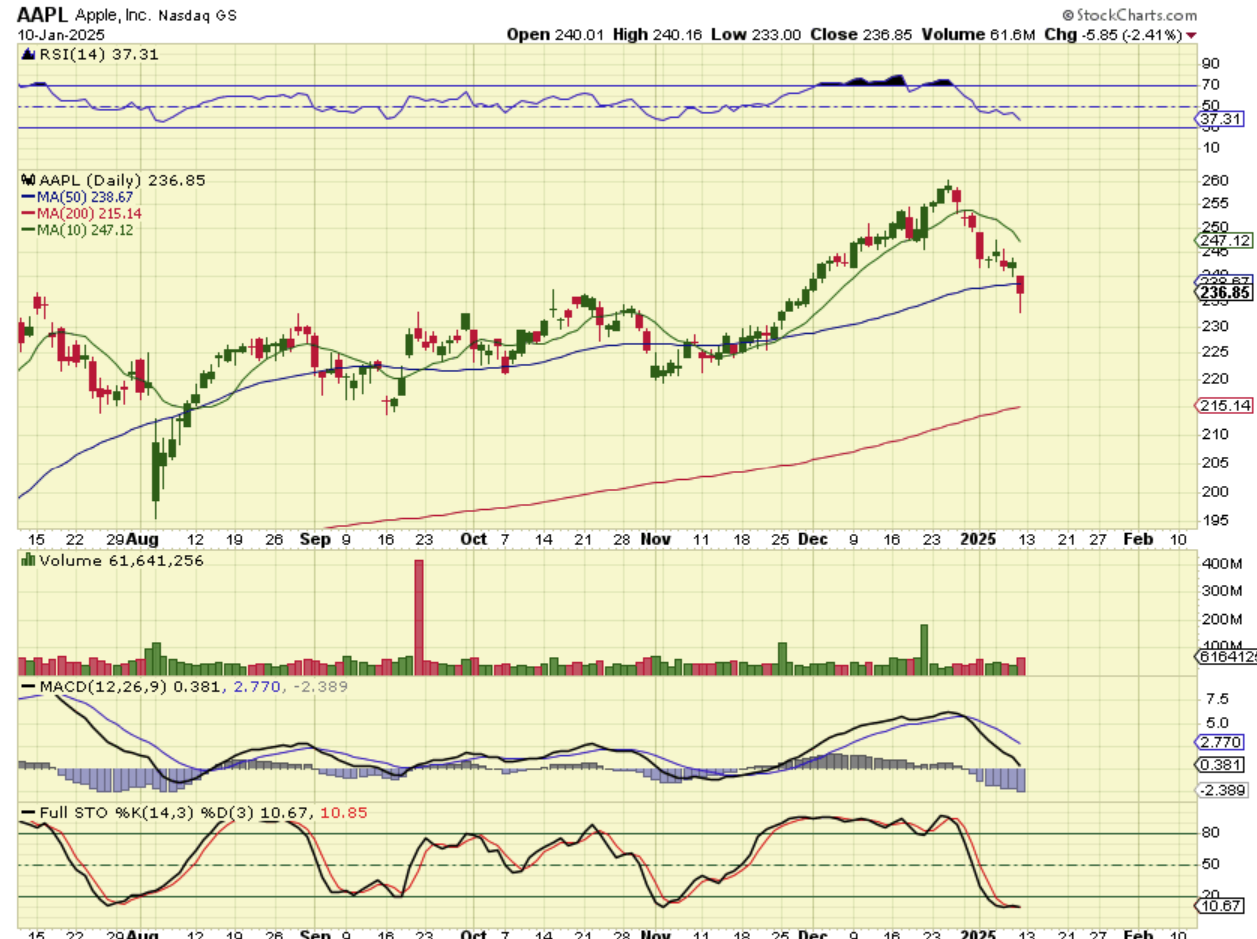
AAPL – I saw a lot of stocks do a reversal on Friday, so if we do get that sell off lower, it may involve small rallies and then a drop over and over.
.
ON FRIDAY:
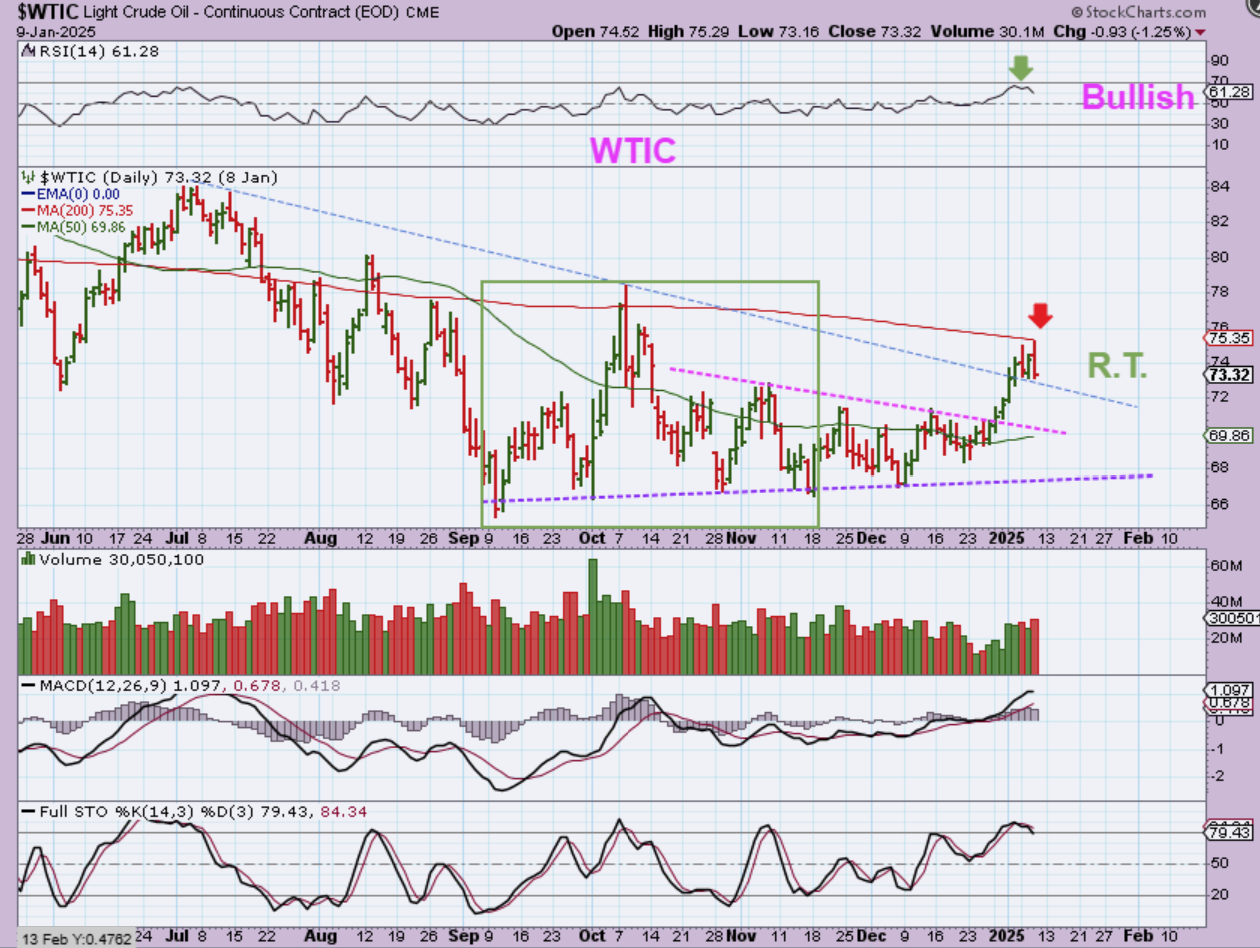
1. Oil now has a Right Translated 2nd daily cycle,
2. The RSI reached almost 70 (that isn’t bearish or weak).
3. It is day 34, so Oil may be due for a dcl. EDIT: DID OIL DROP ON FRIDAY WITH THE 200SMA HOLDING IT BACK?
.
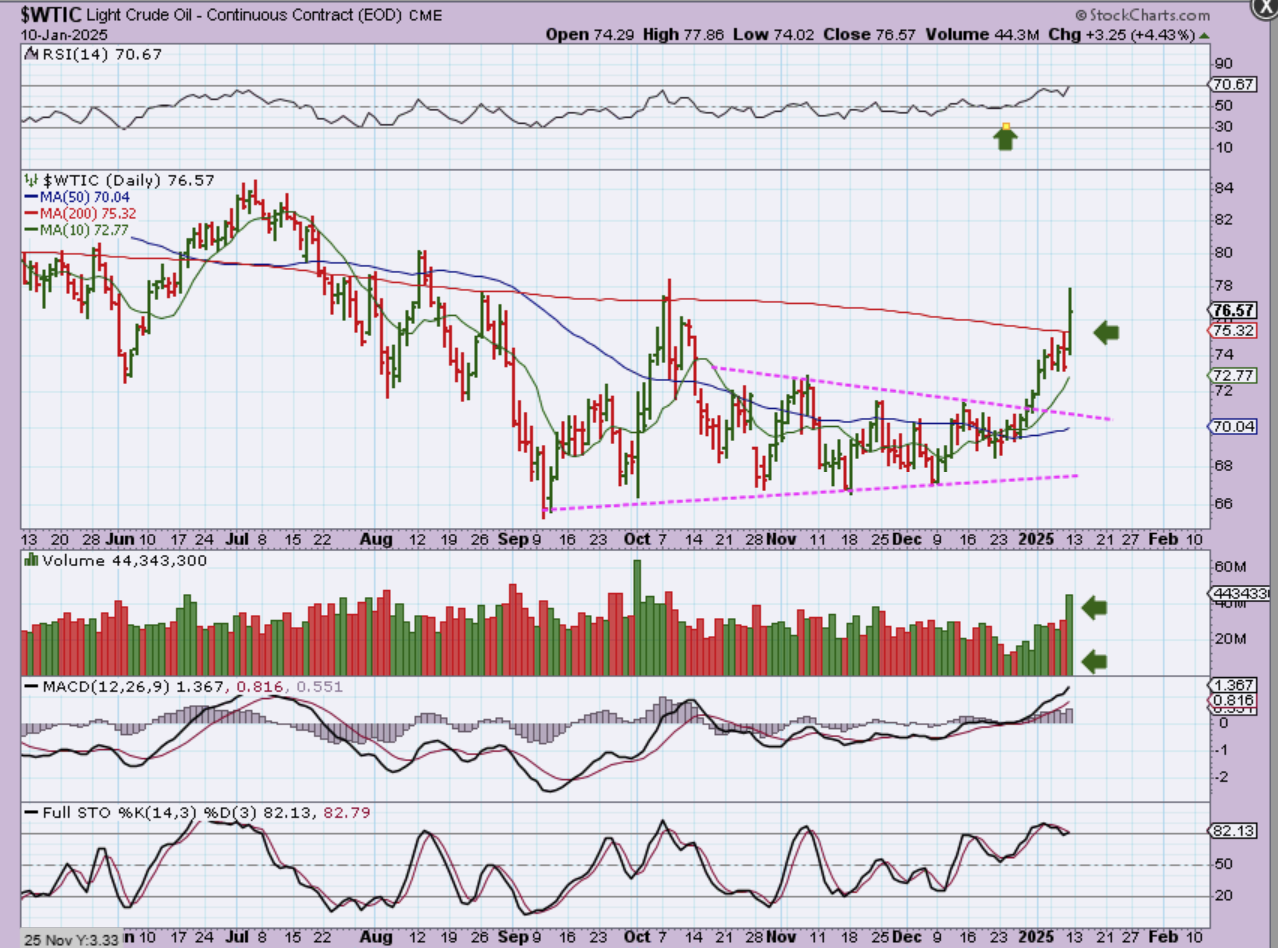
WTIC – Oil surged right through that 200sma, so I’ve mentioned that Oil has been slowly becoming more bullish, and Friday was really a good show of strength.
.
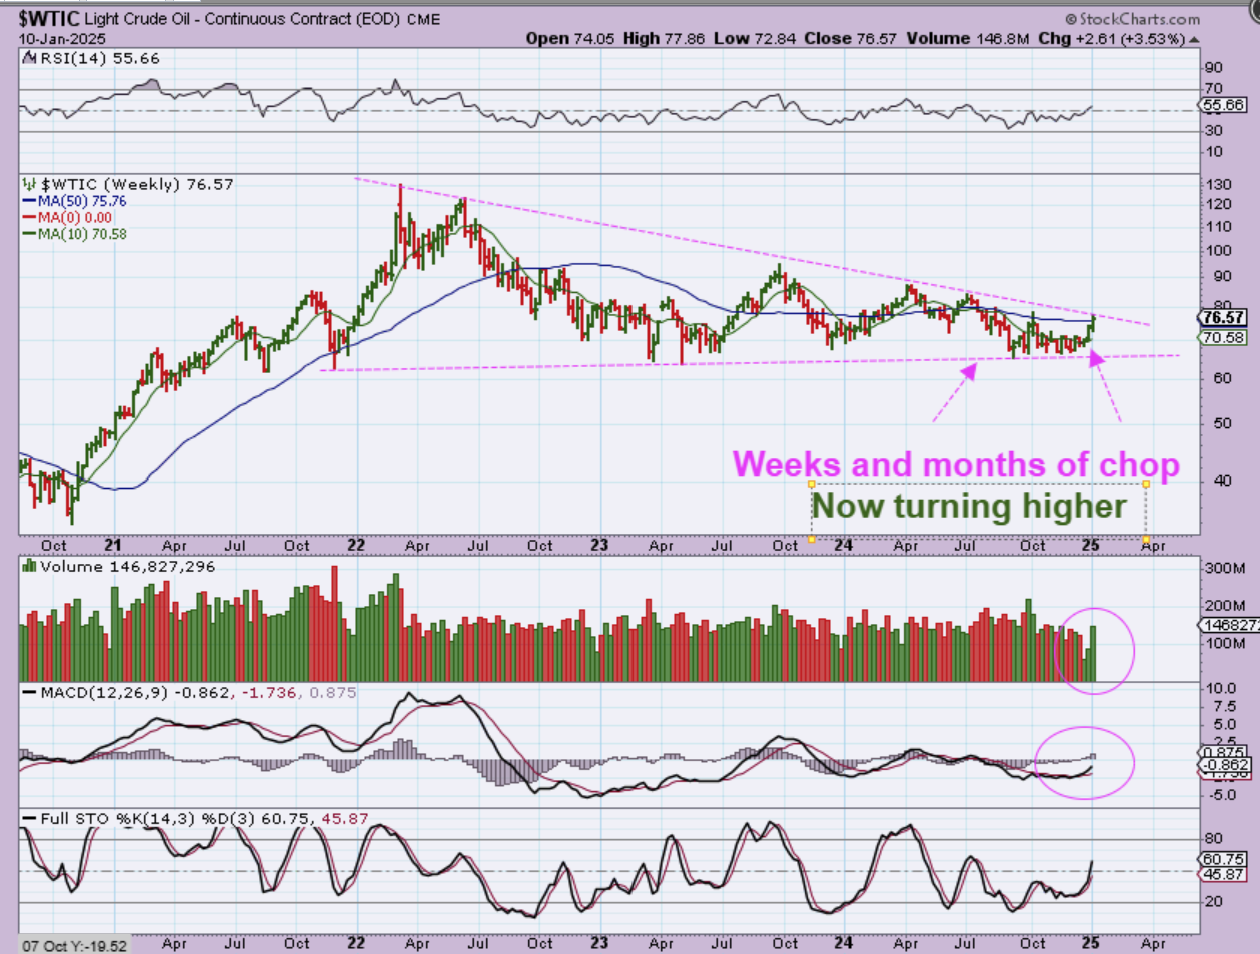
OIL WEEKLY– So on the above daily chart we saw that Oil formed a small bullish triangle and broke out, but Now we see Oil is pressing up against the upper trendline of the larger triangle. Oil looked like it could sell off just a month ago, but it has gained some bullish momentum.
.
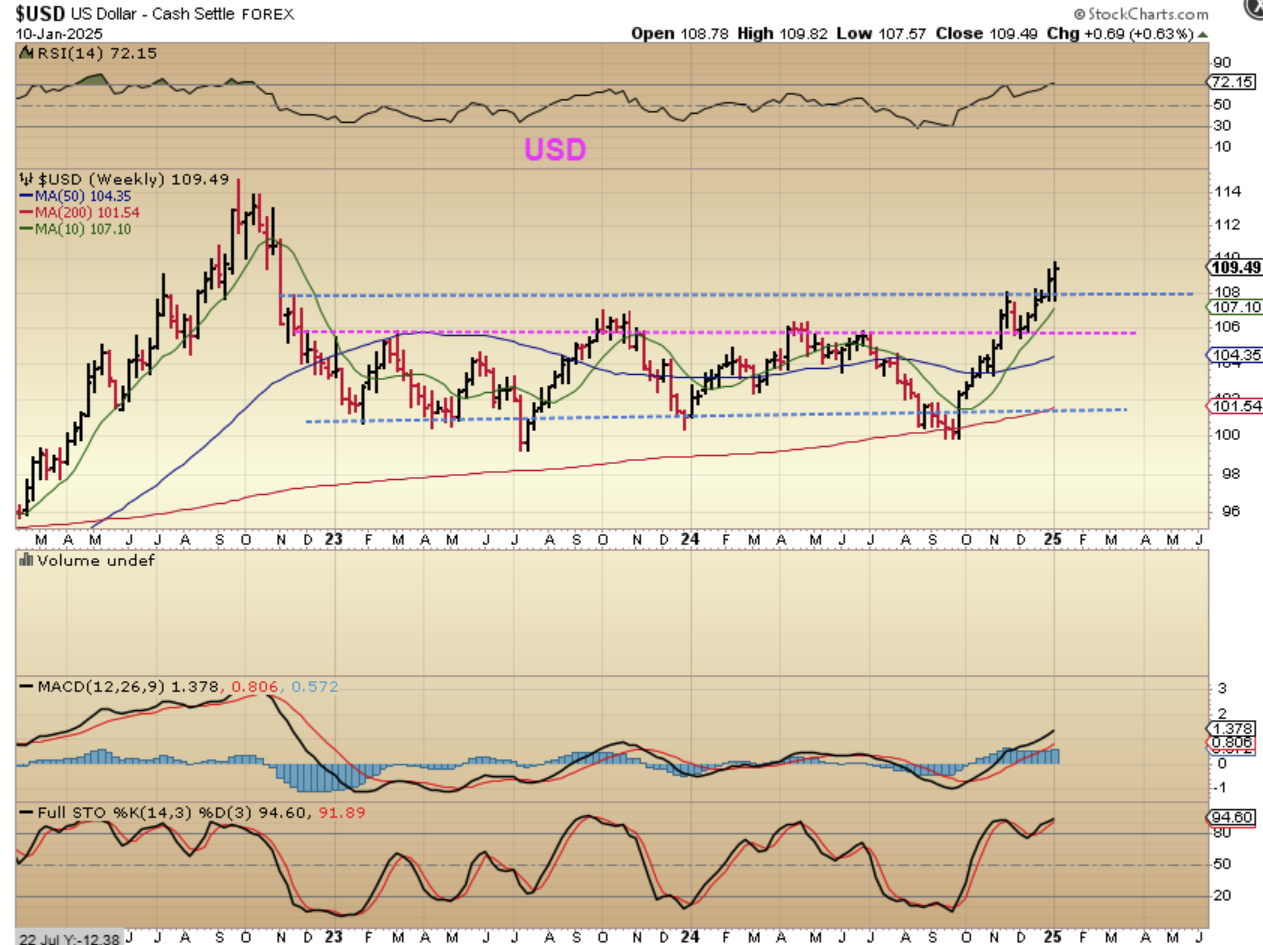
And THE USD continued higher last week too. Fortunately, Gold has completely Ignored the USD rally, so it is less important now.
.
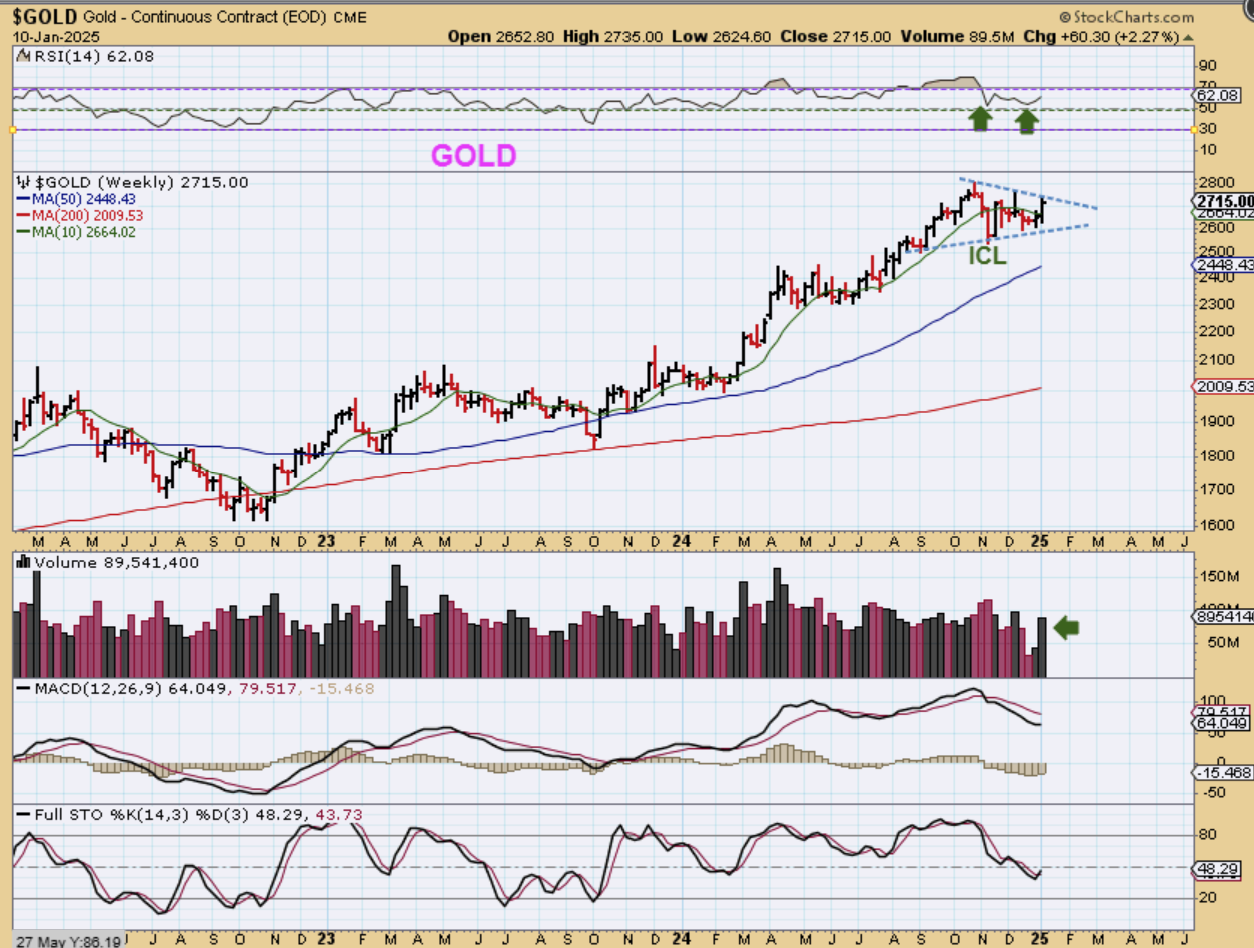
GOLD wanted to prove that it could ignore the USD by popping up $60 inside of this triangle that it has been forming. We could see a breakout this week, and I have already discussed that an ICL was put in place November, and it was followed by a R.T. Daily cycle, so I think that its just a matter of time before this really starts to go again.
.
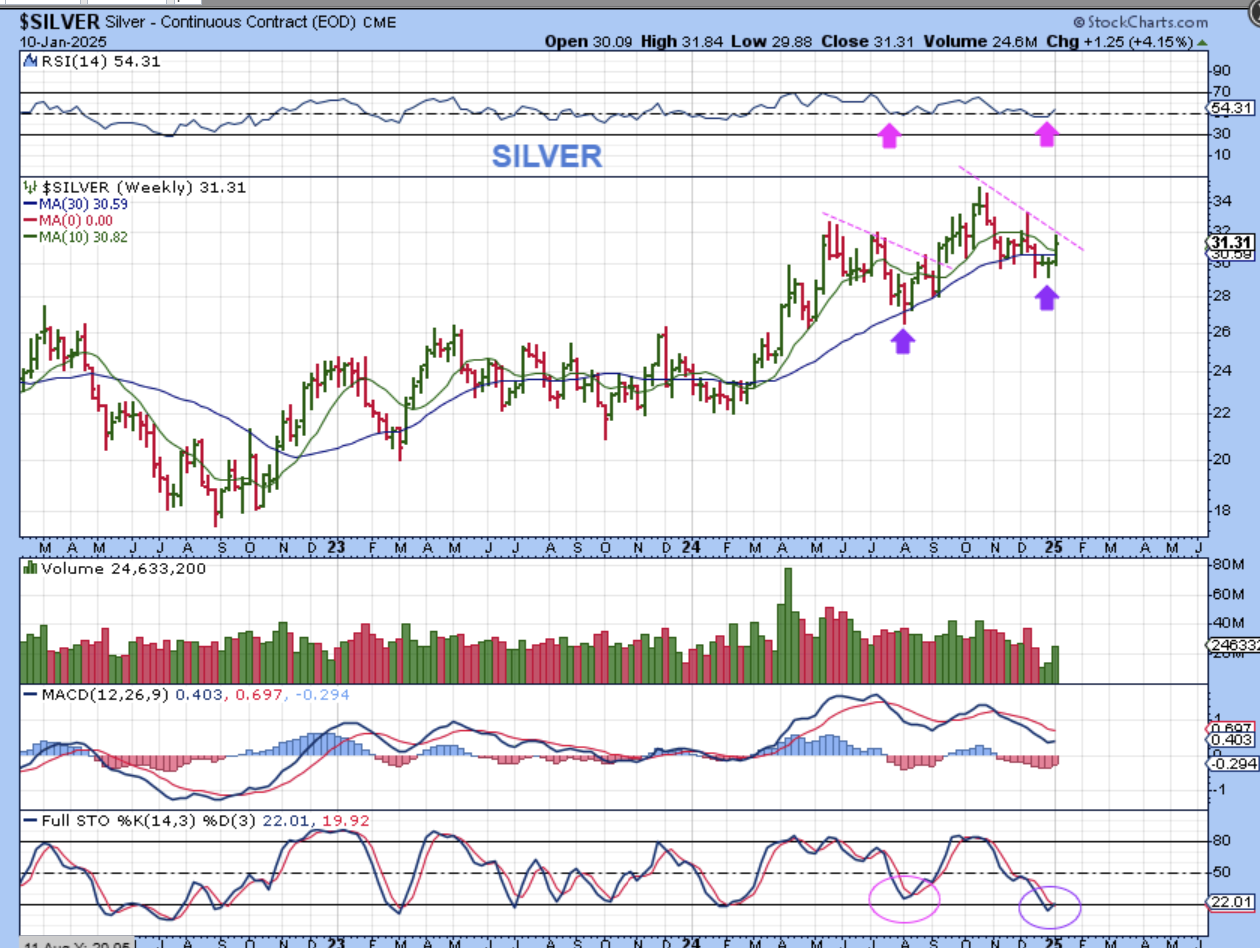
SILVER WEEKLY – Silver is set up similarly to what we saw at the lows in August 2024. Price is reversing at the 30 week ma, and the Stochastics is oversold. Silver is a bullish set up at this point.
.
THIS WAS FROM FRIDAYS REPORT: A Bullish Wedge
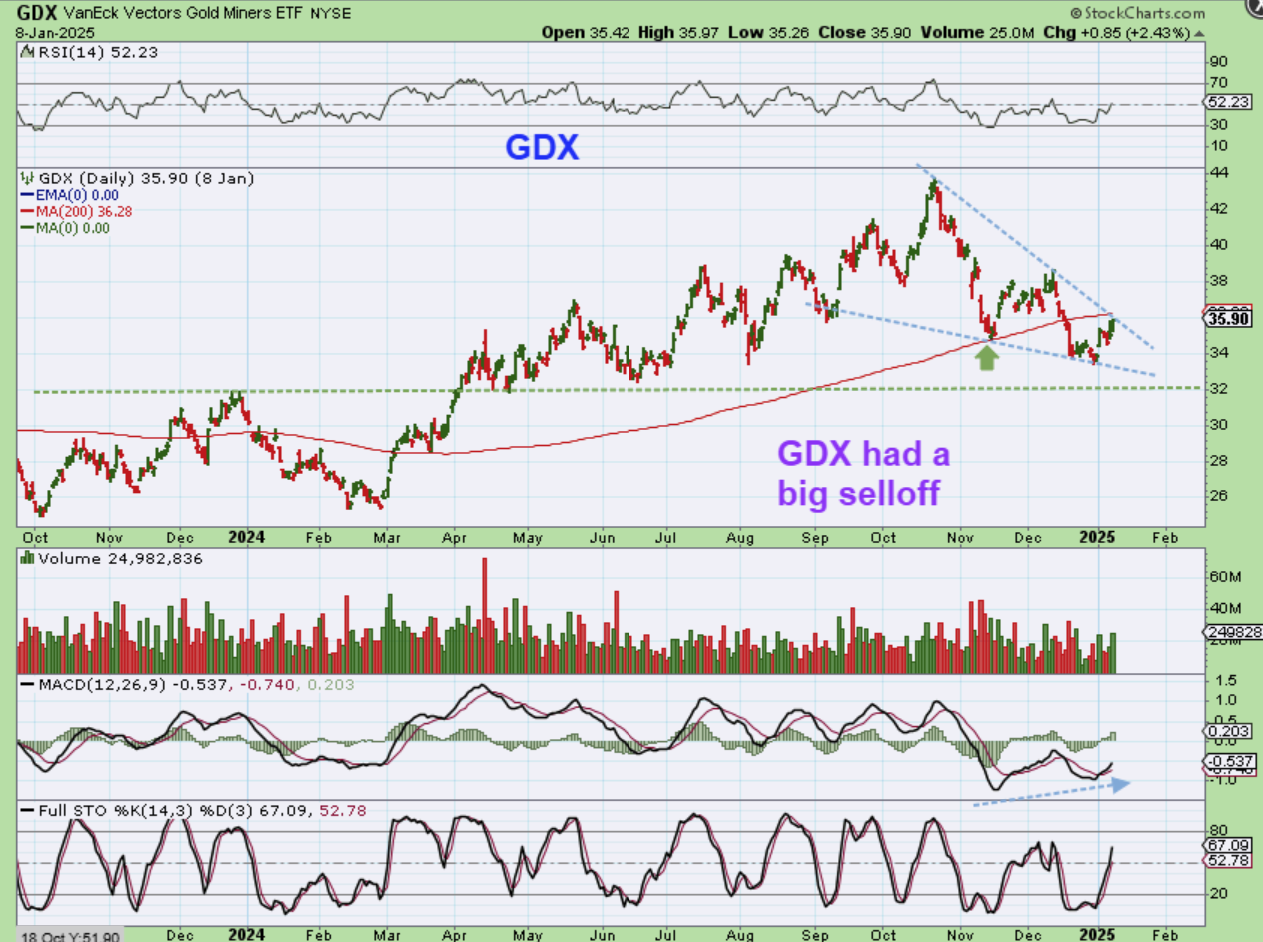
GDX -After that sharp sell off to the 200sma, GDX bounced and broke down further. That has formed a possible Bullish descending wedge, and I’ve discussed that Miners could be a buy again to start a basket if you don’t have one. The MACD is shaping up, but we may be a resistance point too (temporary resistance).
.
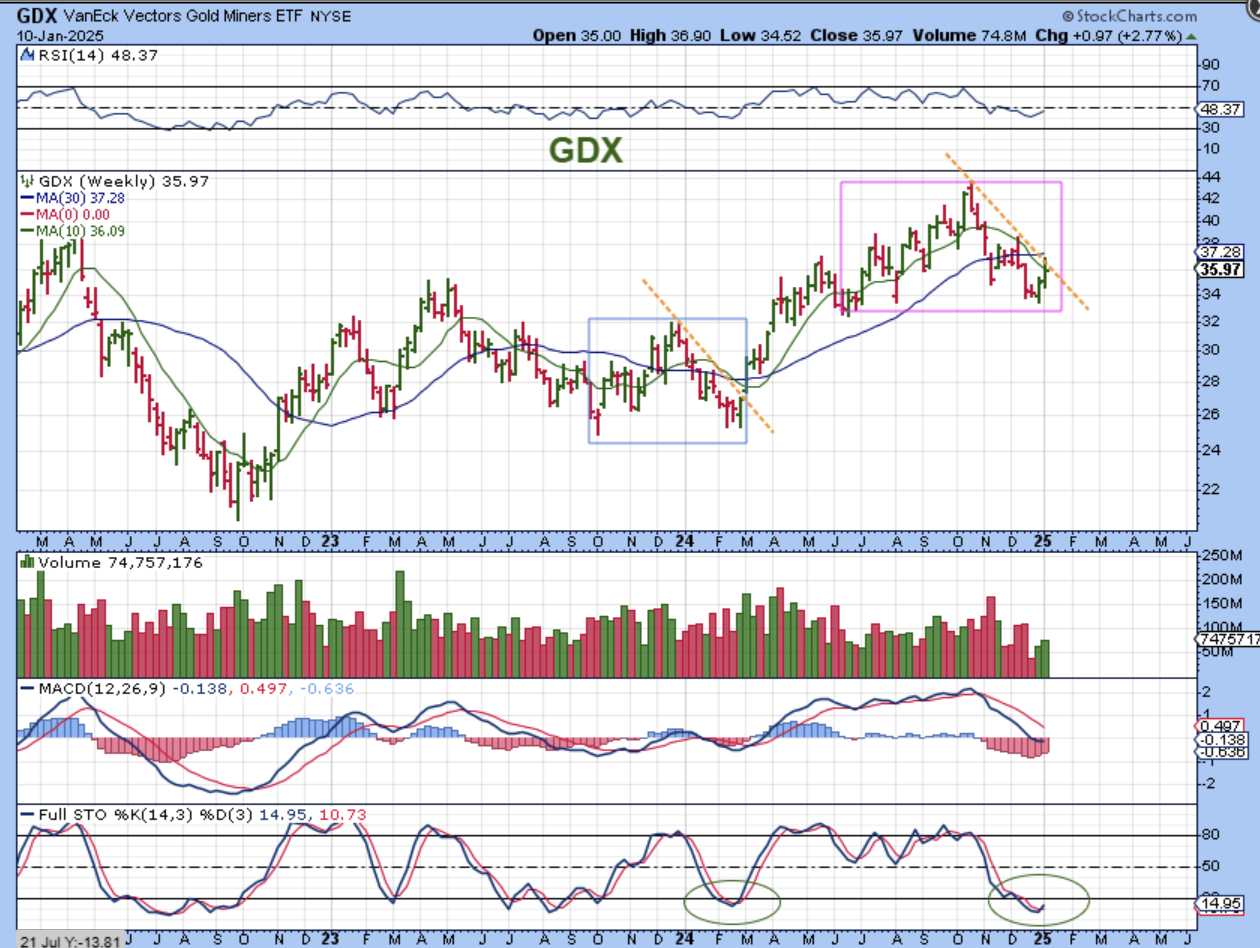
THE GDX WEEKLY – GDX did not breakout yet, but this does look set up to do so, likely when Gold breaks from its tringle. Getting in now allows you to get a good price. Notice, please, how similar this current choppy set up in the magenta box is to the blue box that broke out and rallied higher. We’ve finally reached that oversold spot right at the breakout of the downtrend too.
.
The General Markets are choppy and near the time for a dcl, but they also may give us a deeper ICL, as mentioned above. Oil has turned upward and is giving bullish bursts higher, and The Precious Metals is set up bullishly and had a good week last week. We could see Gold breakout as soon as next week if it continues higher and that may also cause Silver and GDX to break above their downtrend lines with follow through. I’ll discuss Bitcoin below, have a great Sunday everyone!!
.
~ALEX
.
ON FRIDAY: I said…
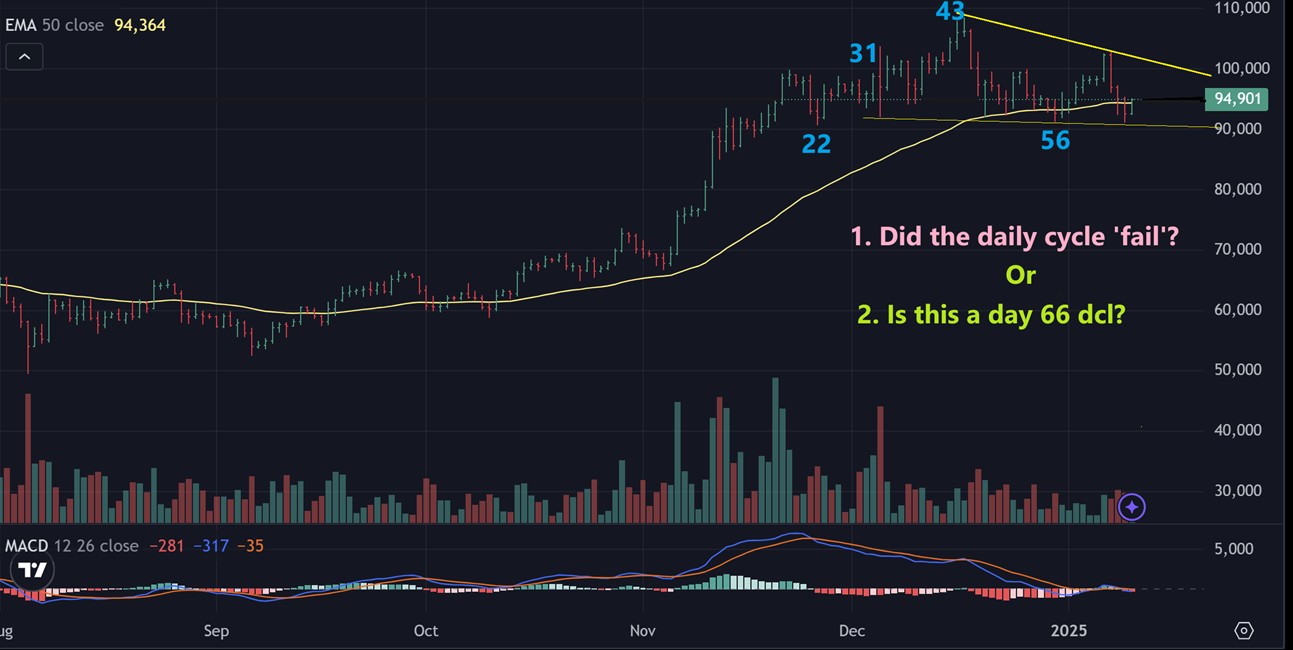
Bitcoin is raising a question here.
We DID get a lower low overnight, so we naturally think that we have a ‘failed daily cycle’, and we might! HOWEVER, Bitcoin cycles can last 60-70 days, so is that low & reversal today the dcl now on day 66? Some might say, ” But the dcl was confirmed above the 10sma, right?” Yes, I agree, but it also formed in the wedge or triangle, and from what I have seen – Bullish wedges or Triangles hold up stronger than anything else. They are the technical analysis pattern that seems to ignore cycle rules. So we MIGHT have a day 66 dcl.
.
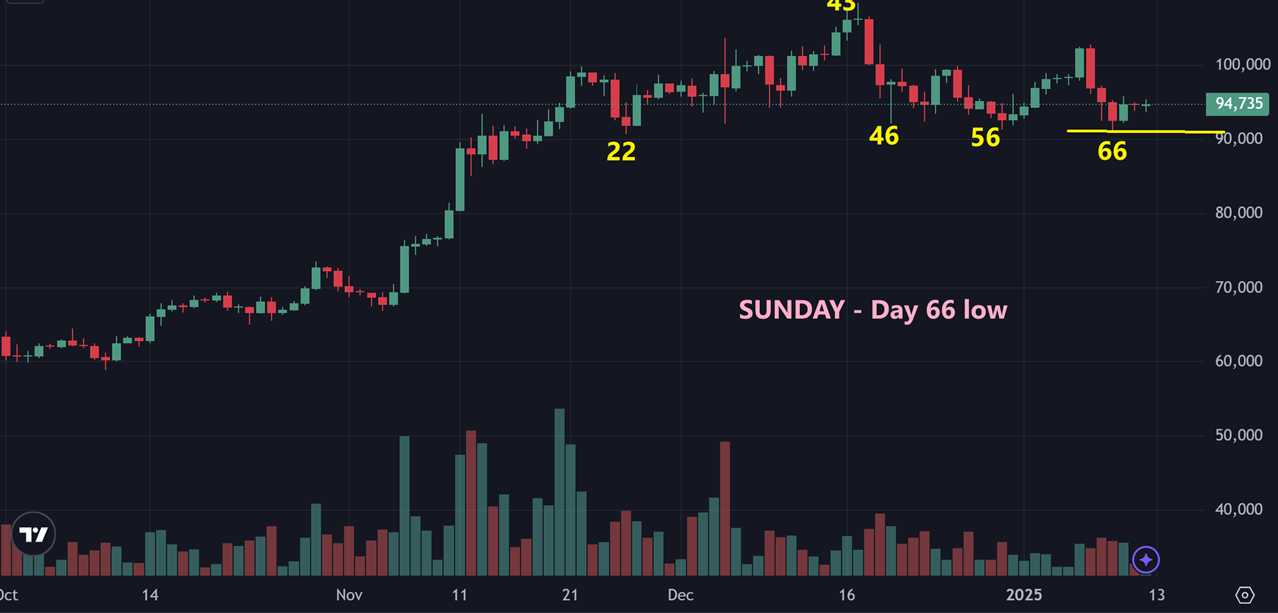
We MIGHT have a day 66 dcl, since that day 66 low is still in place. If so, that would make Sunday day 2.
.
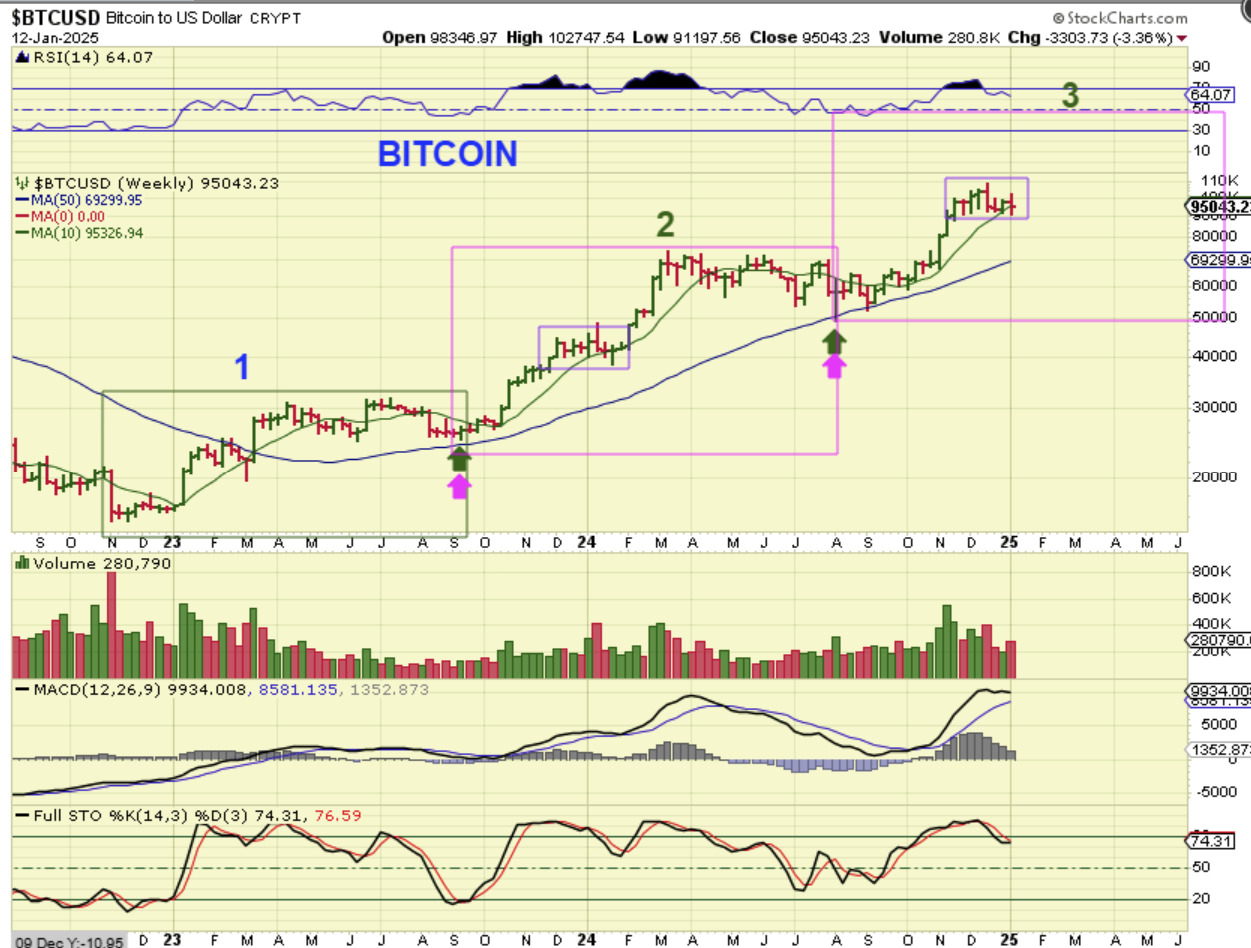
Bitcoins weekly chart is very interesting to me.
Take a look at Box 2 & Box 3.
The rally out of the lows (Green & Magenta arrows) was strong and then we saw a mid-point consolidation in Box 2 that looks very much like what we have going on here. If that is the case, then the rally that I have been discussing to the $120,000+ area should take us to the top of the box over the next couple of months. Also…
.
Notice that the rally to the peak in Box 2 also took place in early 2024 (January to March). If it plays out the same way, we would see that January to March kind of a rally again. I hope so 🙂

