
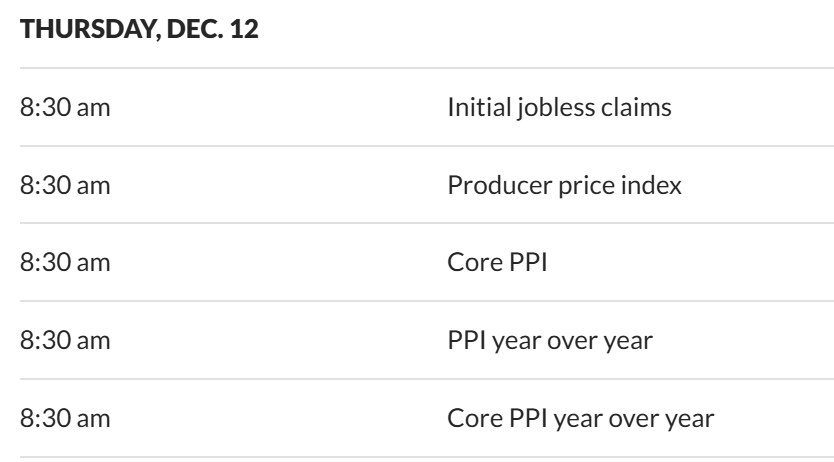
Thursday December 12th – More Inflation?
DATA – Wednesdays CPI Numbers (inflation) were released at 8:30 am and the futures began to shoot up at that time. Today we have PPI Numbers (inflation) too. That and Jobless Claims could give us follow through, so lets take a look at the charts…
.
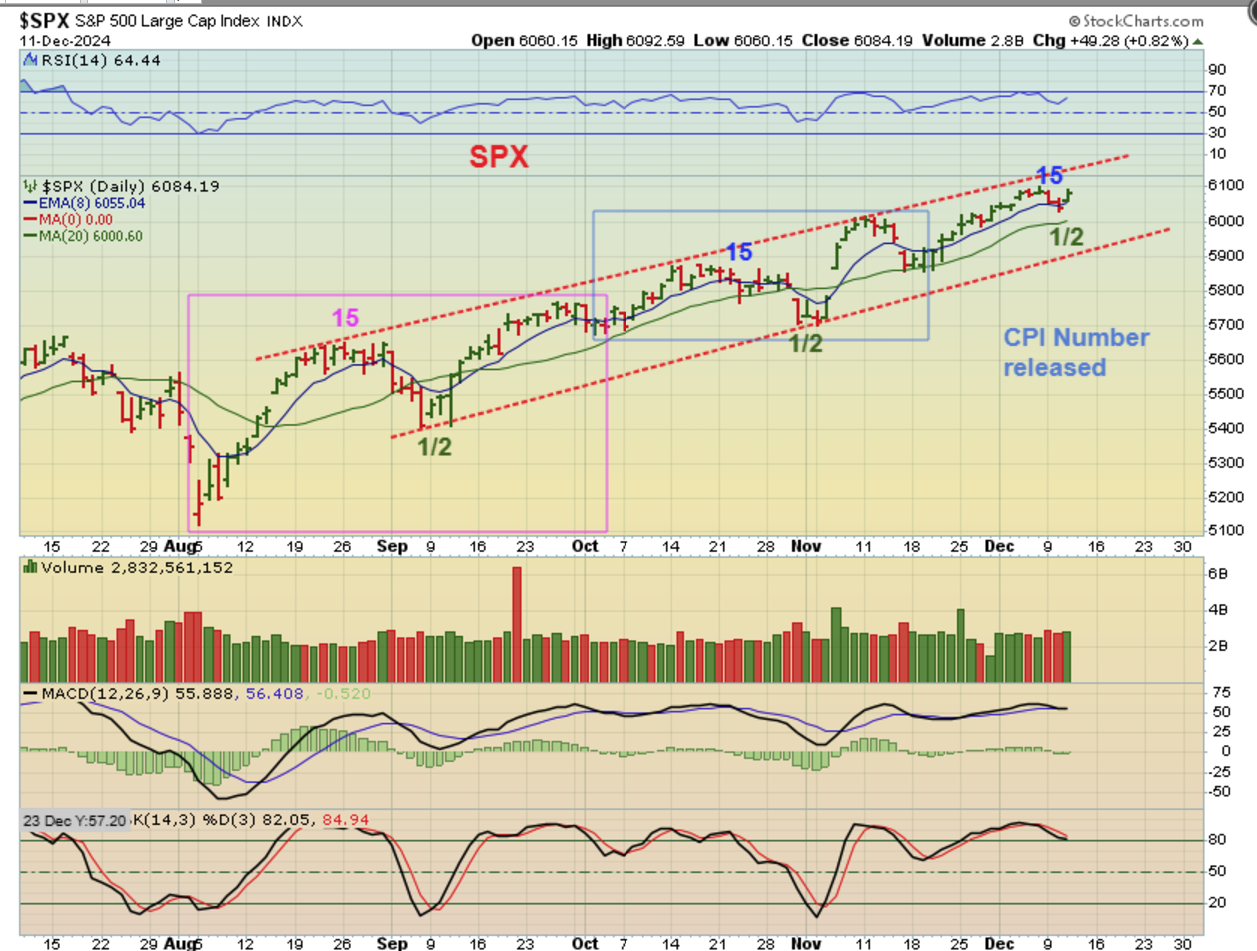
THE SPX turned up on Wednesday and we may have an early 1/2 cycle dip if the jobless claims doesn’t send the markets lower. In prior daily cycles, the markets got choppy around day 15.
.
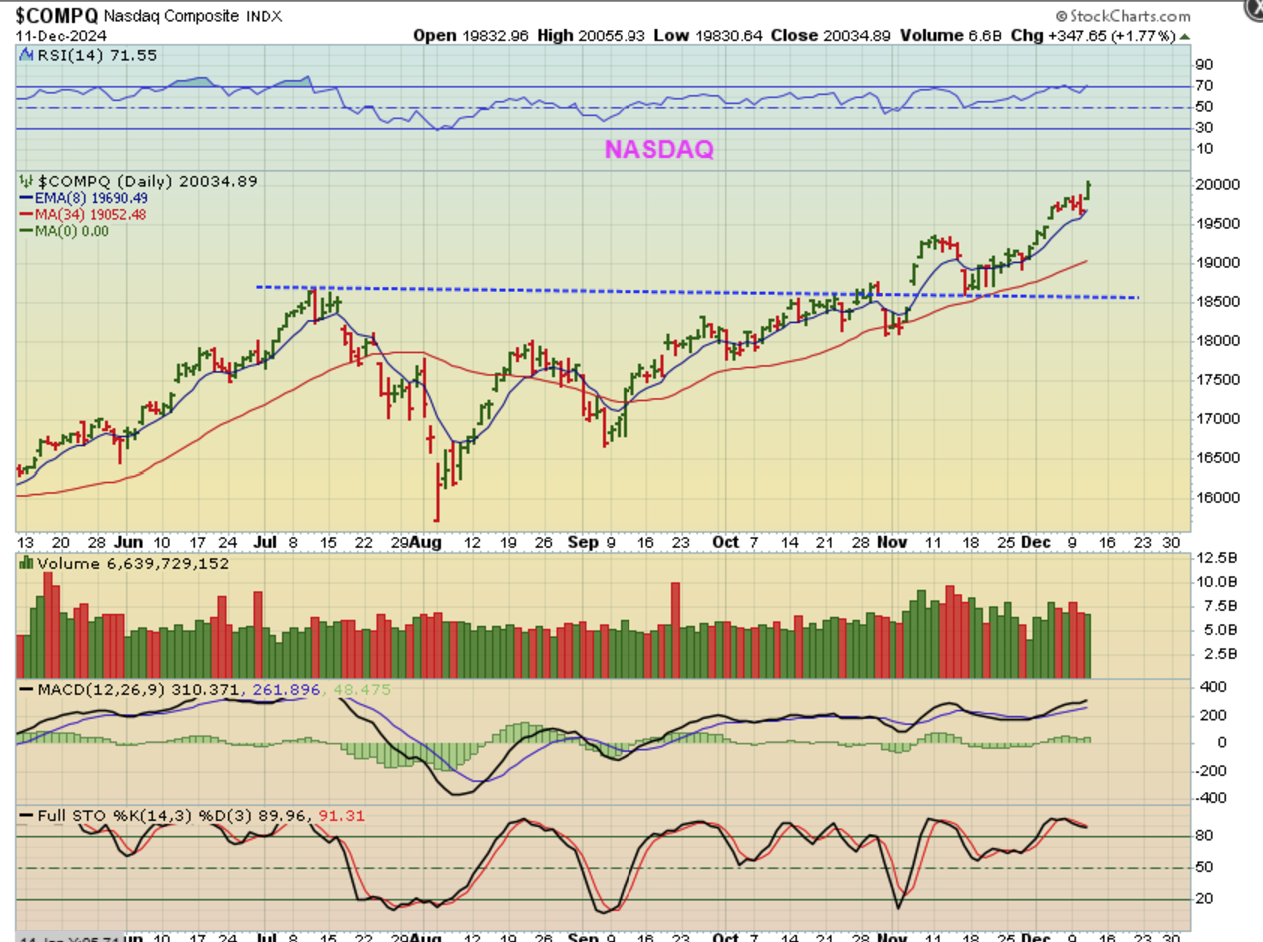
THE NASDAQ 20,000 – Yep, the NASDAQ reversed at the 8 ema and then closed above 20,000 for the first time, and this tech sector had a nice day.
.
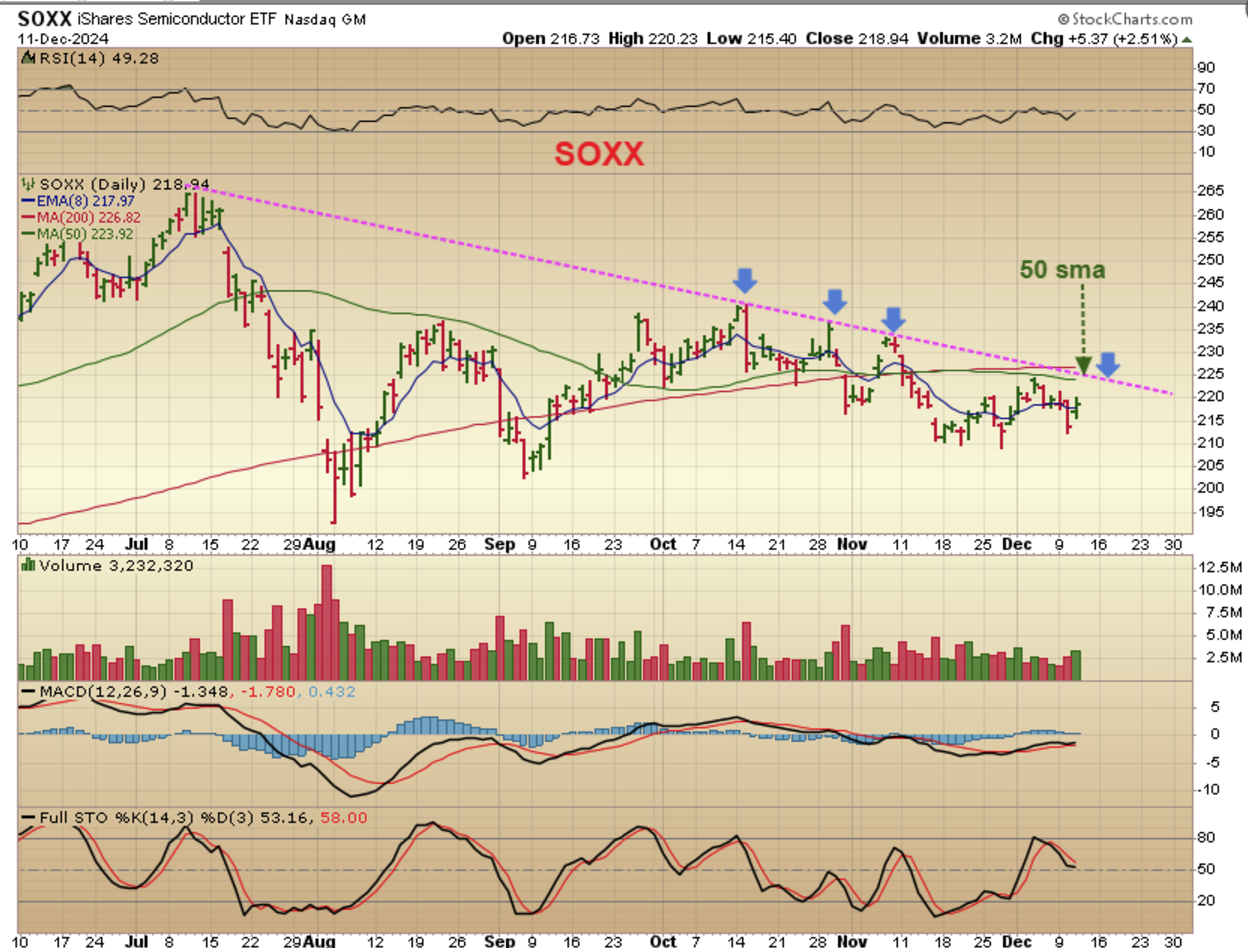
The SOXX gapped up too, and it was up 2.5%, but it is still under the area where a shorting opportunity could develop soon.
.
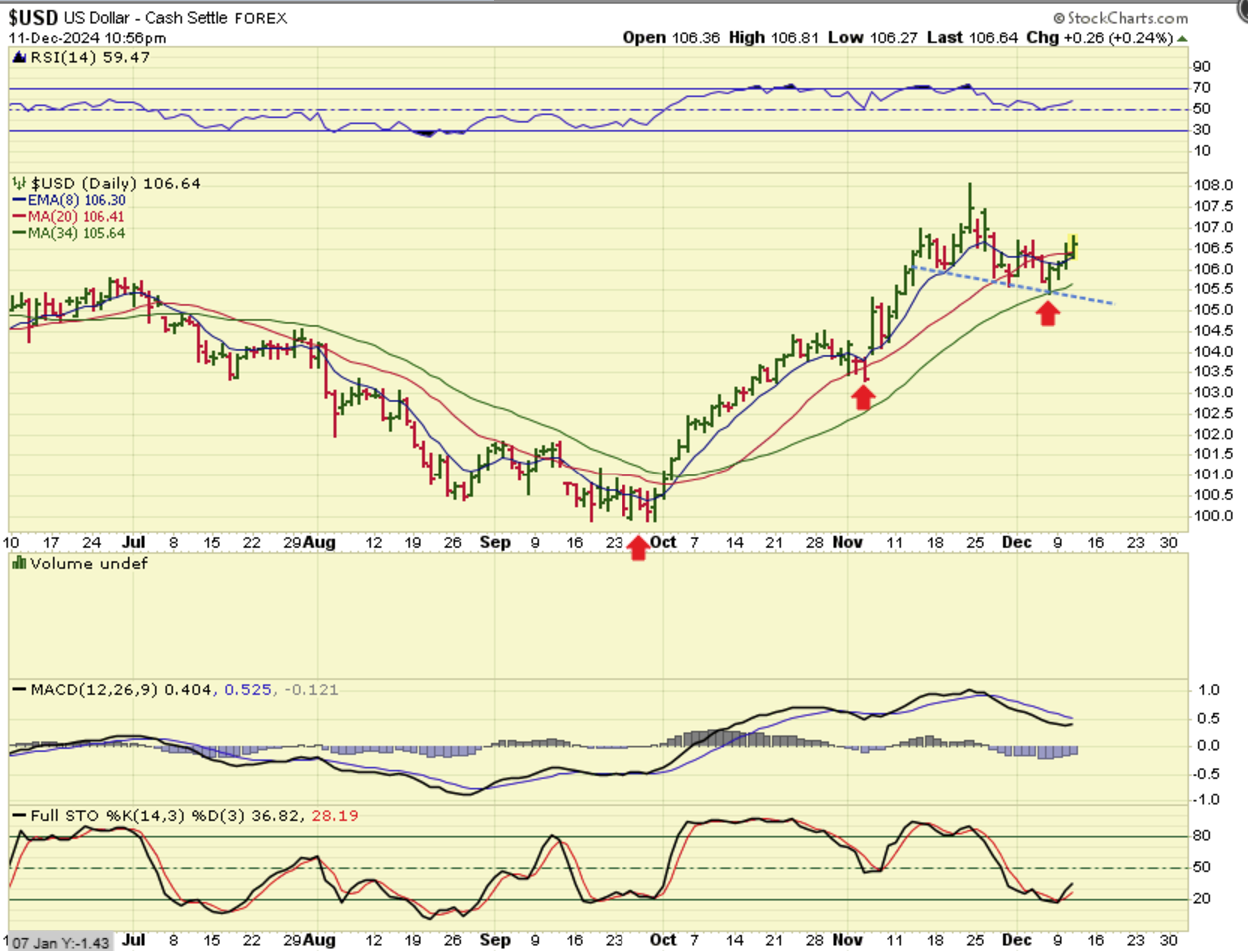
THE USD moved higher too, but as has been mentioned, The USD higher does not mean that Gold can’t run higher with it. It has been doing that lately.
.
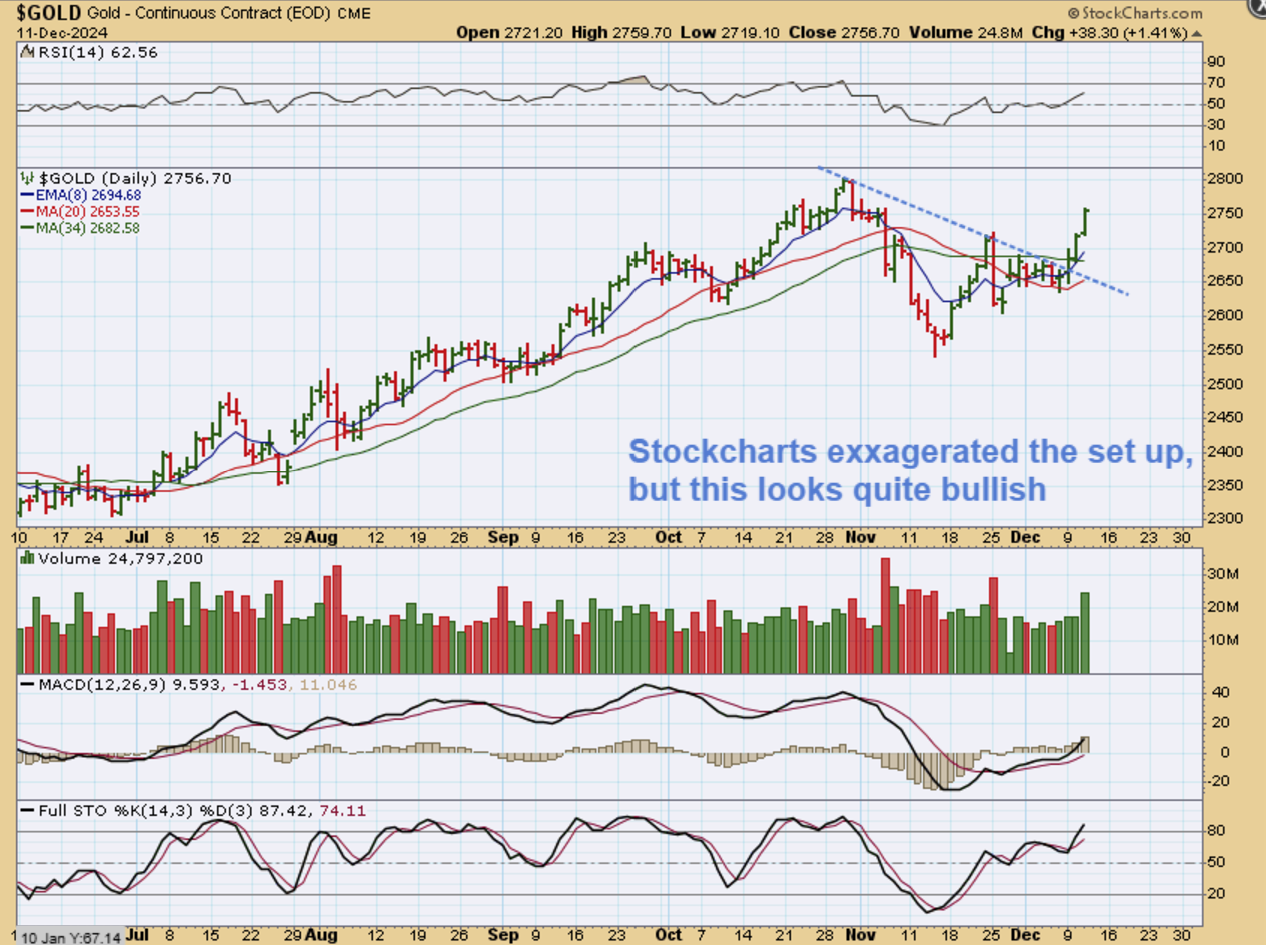
This definitely looks like the Bull is running in GOLD, so an ICL does appear to be in place. I will take a look at the difference in Spot Gold, but when I look at this chart, it truly does look like an ICL. Gold broke the downtrend, closed above the 50sma and is heading for the last daily cycles highs.
.
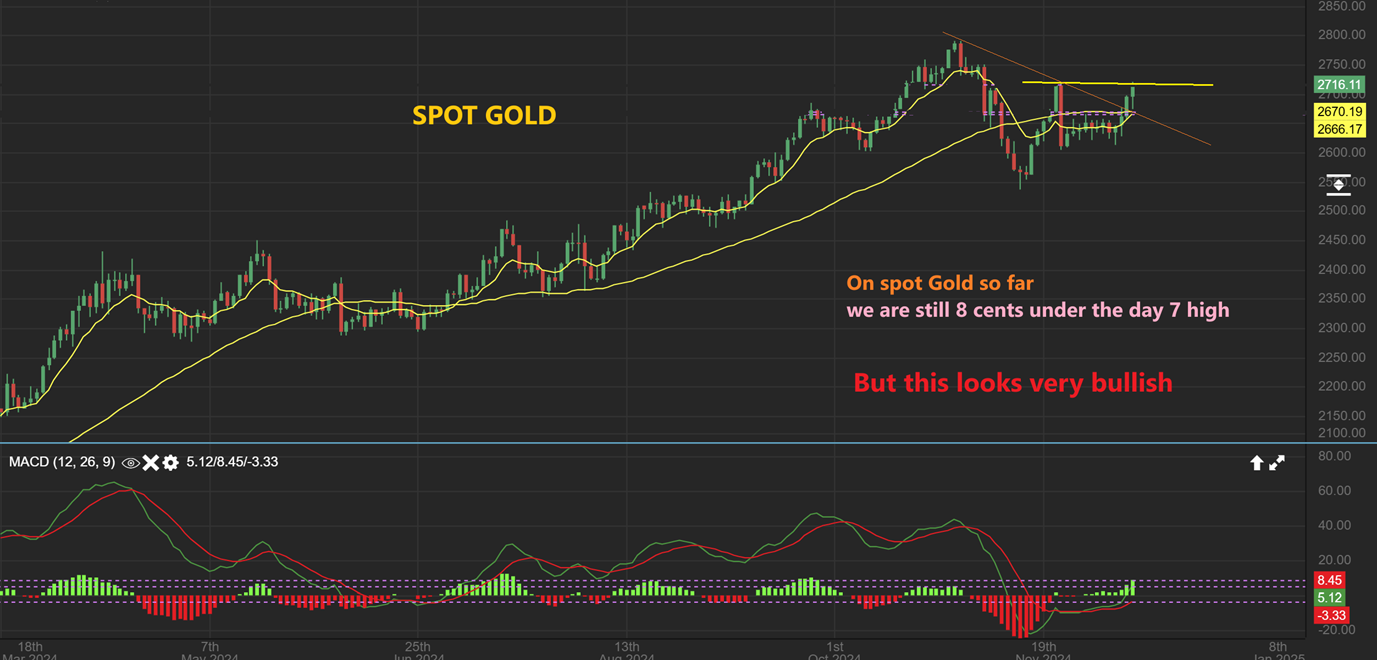
SPOT GOLD did not break the day 7 highs yet, but it was only 8 cents under that low. We still have the trendline break here and the close above the 50sma. This really seems to be an ICL.
.
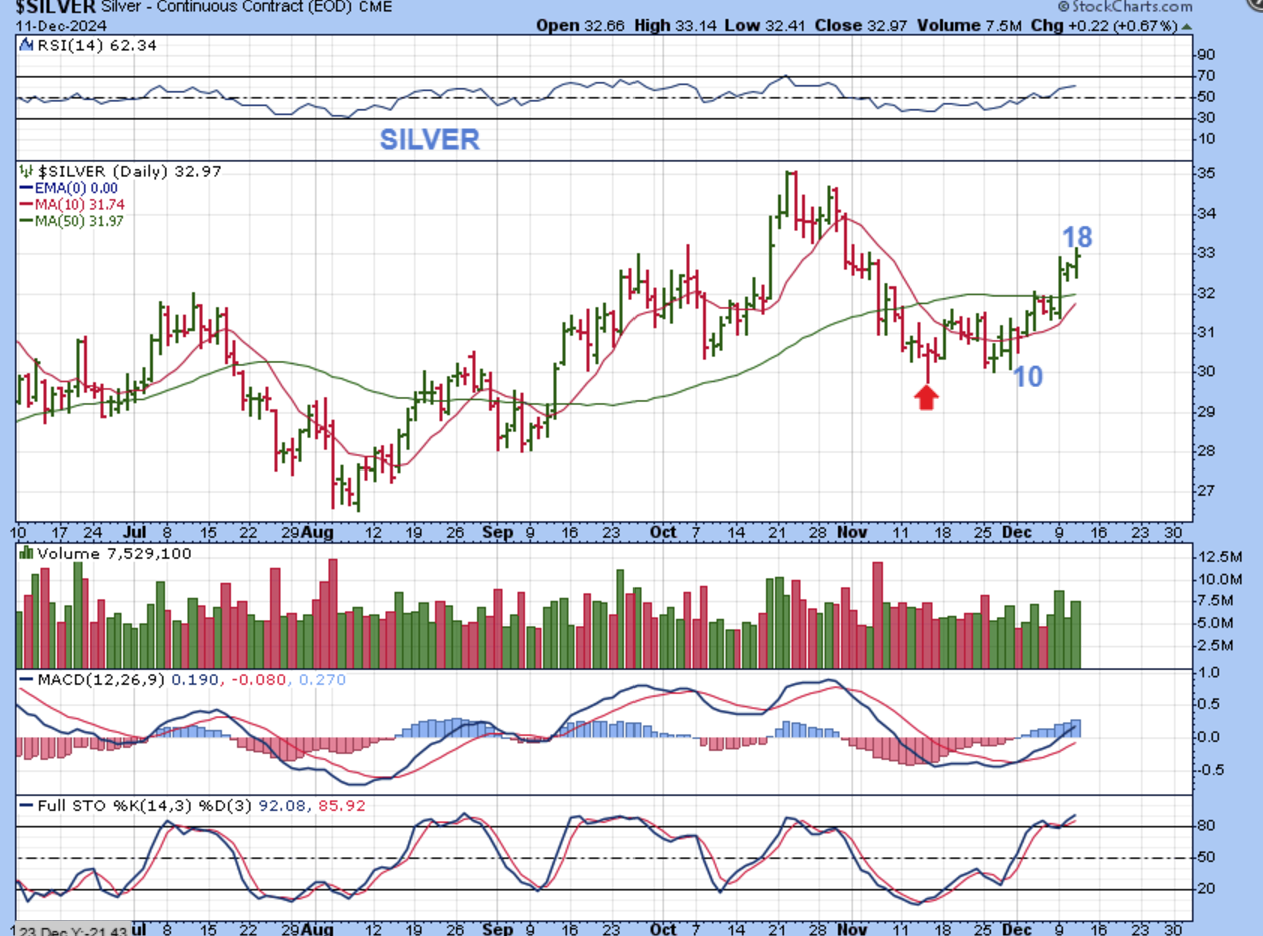
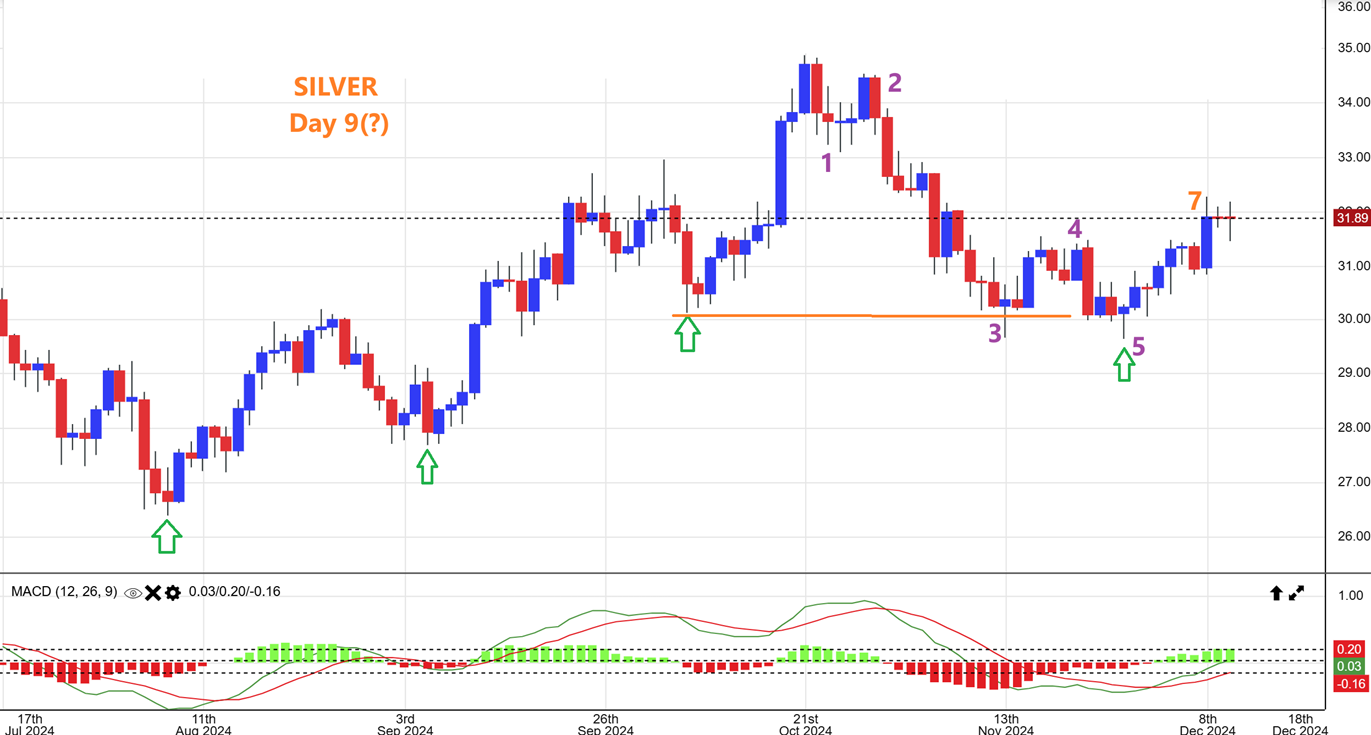
On Stockcharts SILVER looks to be on day 18, so this would be R.T. and would indicate that we had an oddity here with Silver too. We only had 3 daily cycles and the third crashed into the ICL? Silver Miners were lagging so much that they did NOT look to be in an ICL. Yesterday I showed how they were still at the lows, so an entry on Wednesday was easy at the lows. What about Spot Silver?
.
With SPOT SILVER the setup is a bit different too.
I see 5 waves lower and that is because the lowest low here is 9 days ago. Either way though, Silver had a L.T. 3rd daily cycle and it did sell off in ICL fashion. Silver is not blazing higher yet, so Silver stocks remain cheap.
.
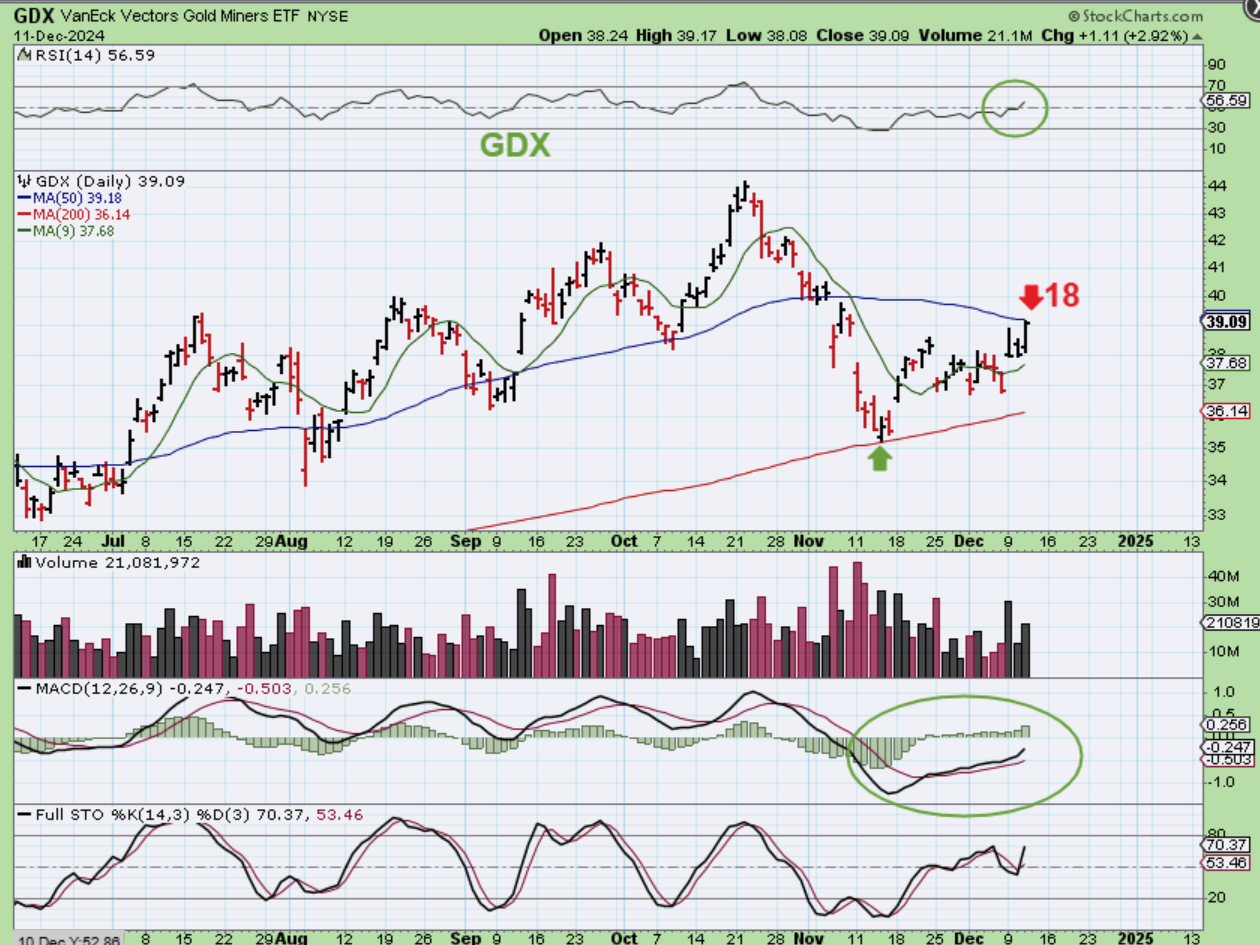
GDX I’ve actually been saying all along that the GDX chart did look like an ICL sell off, but now we also seem to have a R.T. Daily cycle developing.
.
LET’s JUST TAKE A LOOK AT A FEW MINERS: Some are near the lows, others have been making progress.
.
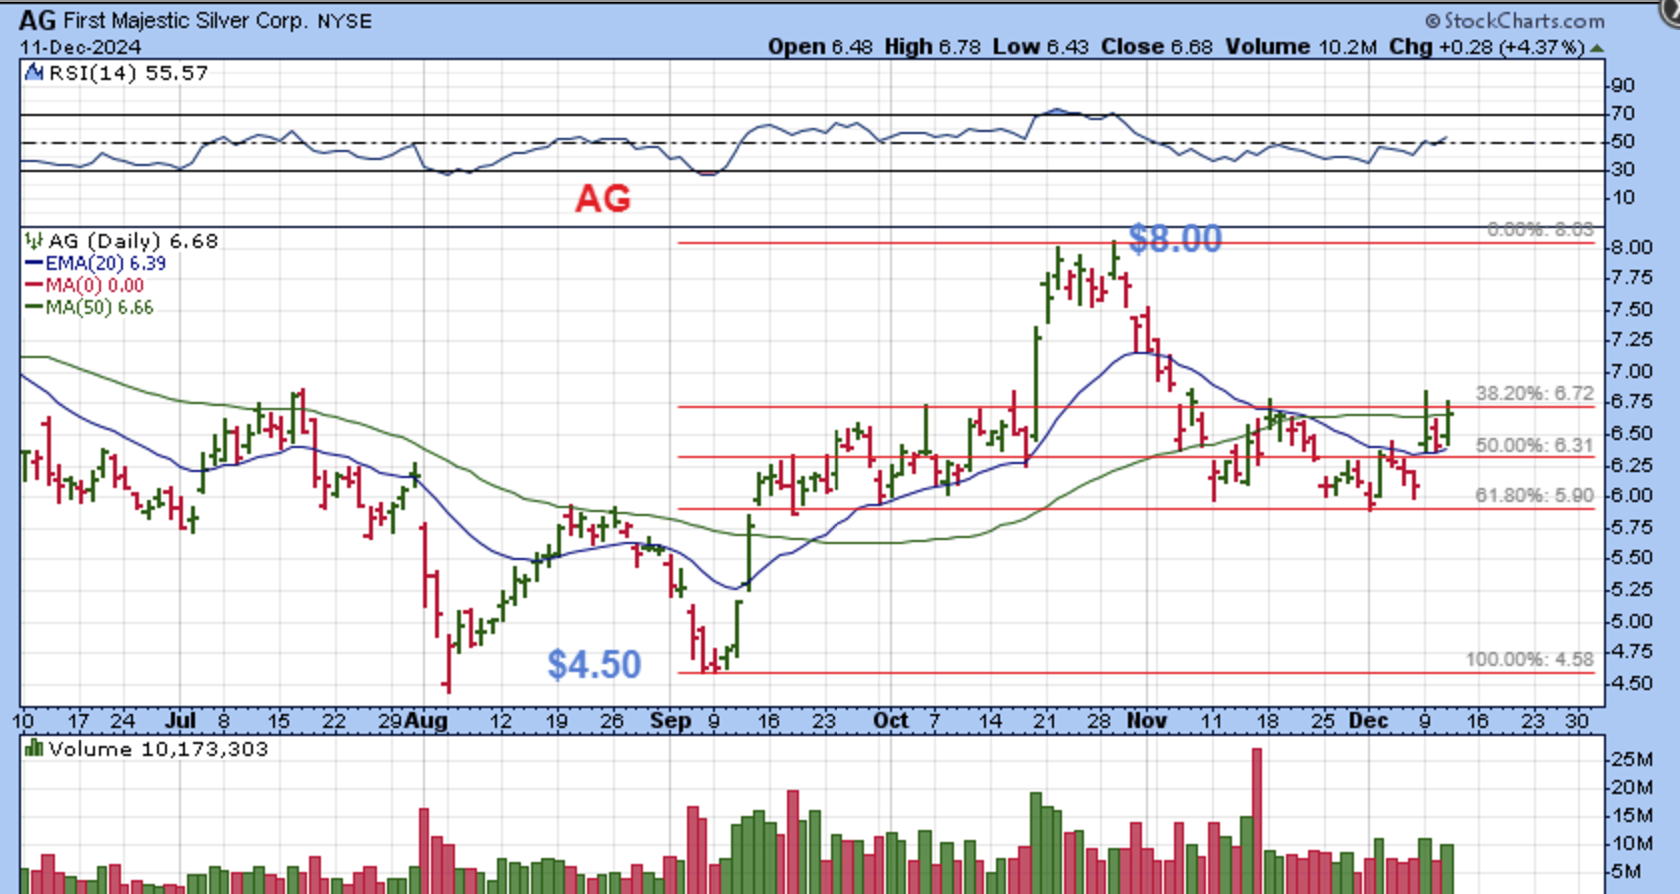
AG was lagging at 2:37 p.m., so I pointed it out and said that it could be bought with a tight stop -even under this weeks lows.
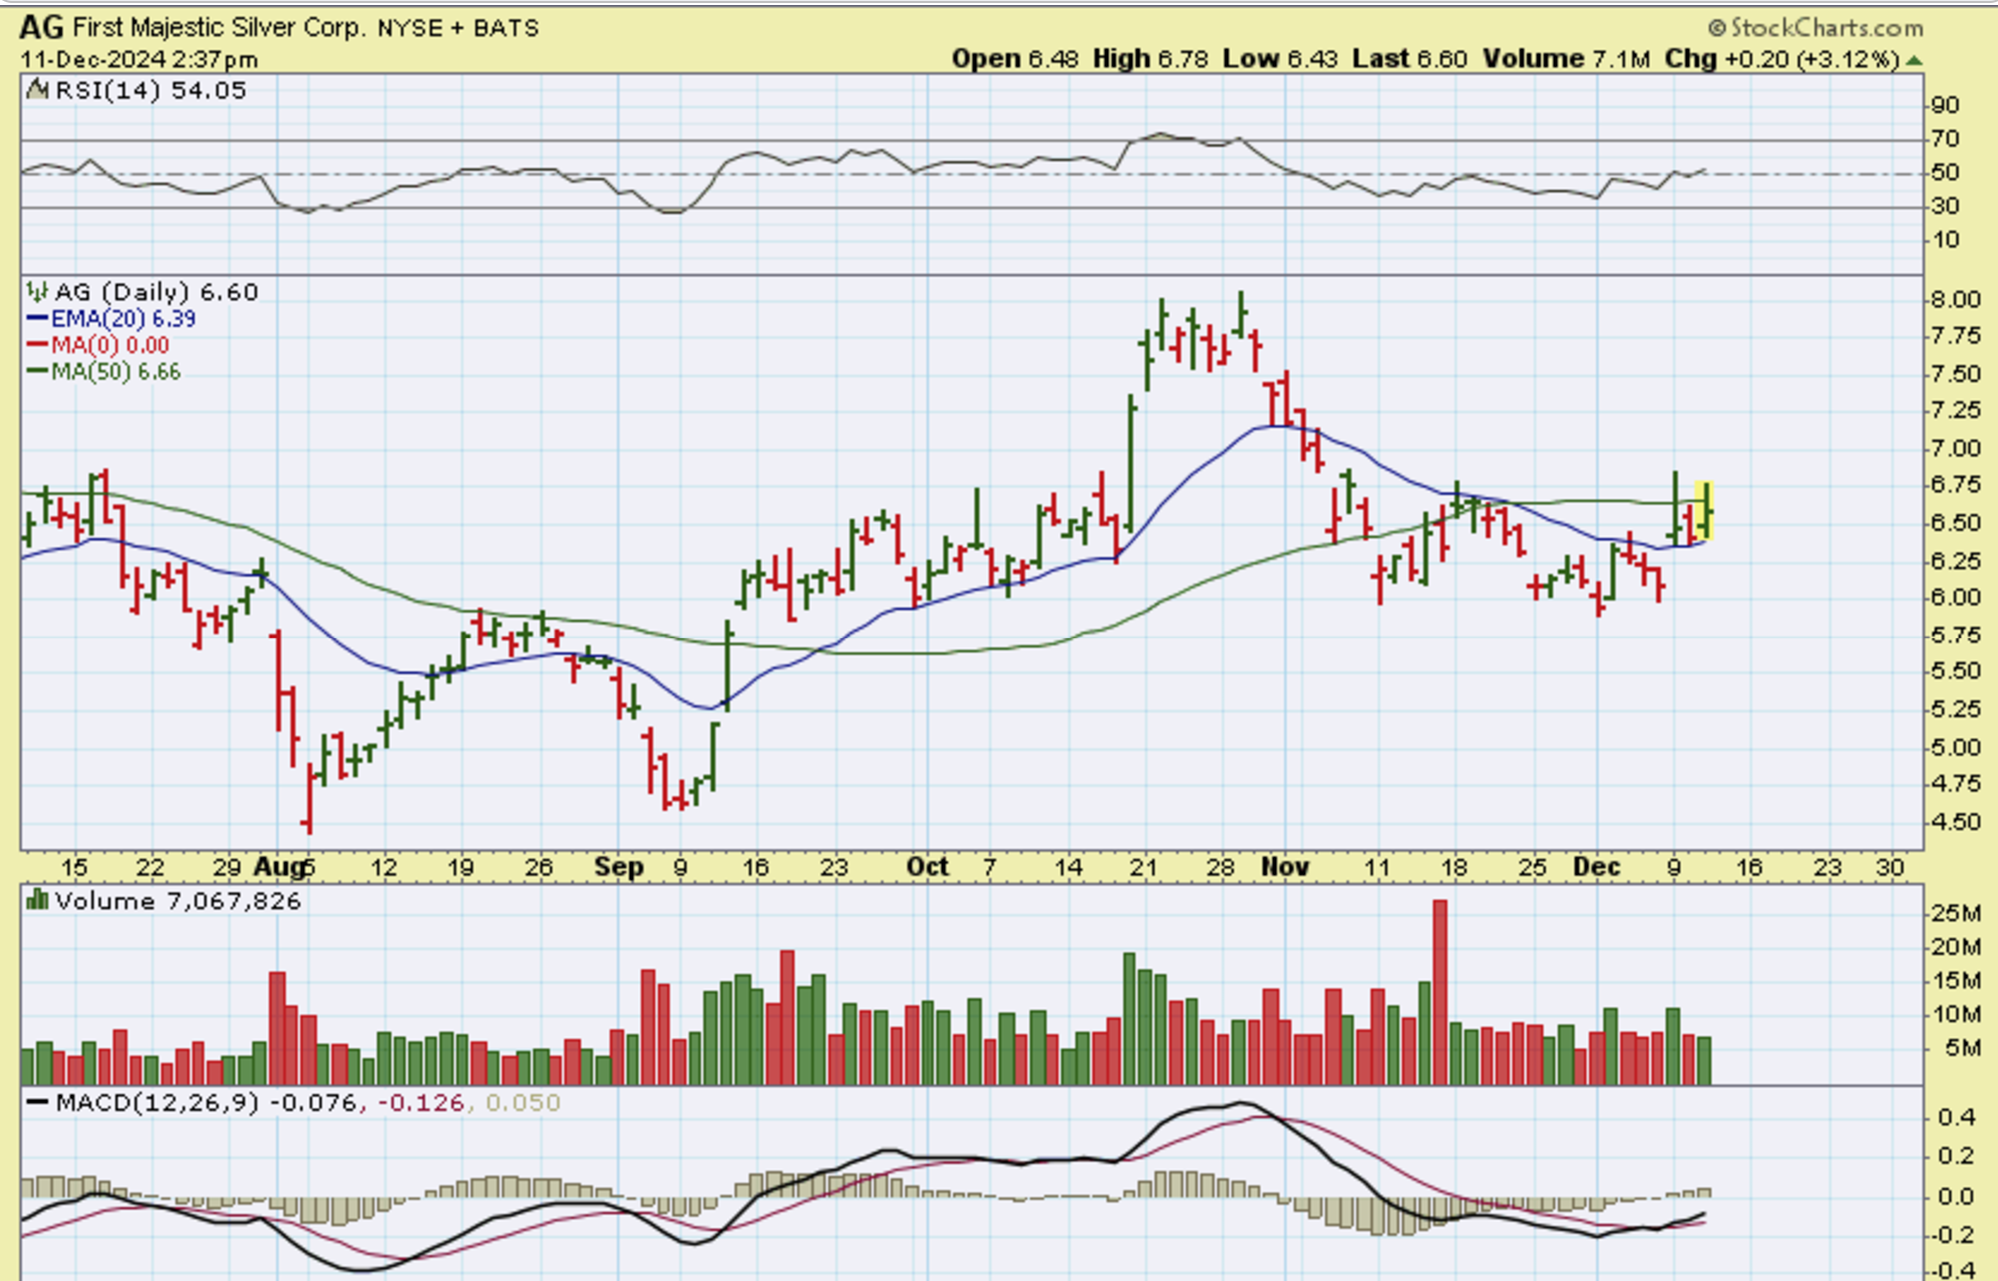
.
AG closed up 4.37% and SLIGHTLY above that 50sma. I look at $4.50 to $8 as a Great run for the last daily cycle, so I think that AG will do well when the time is right.
.
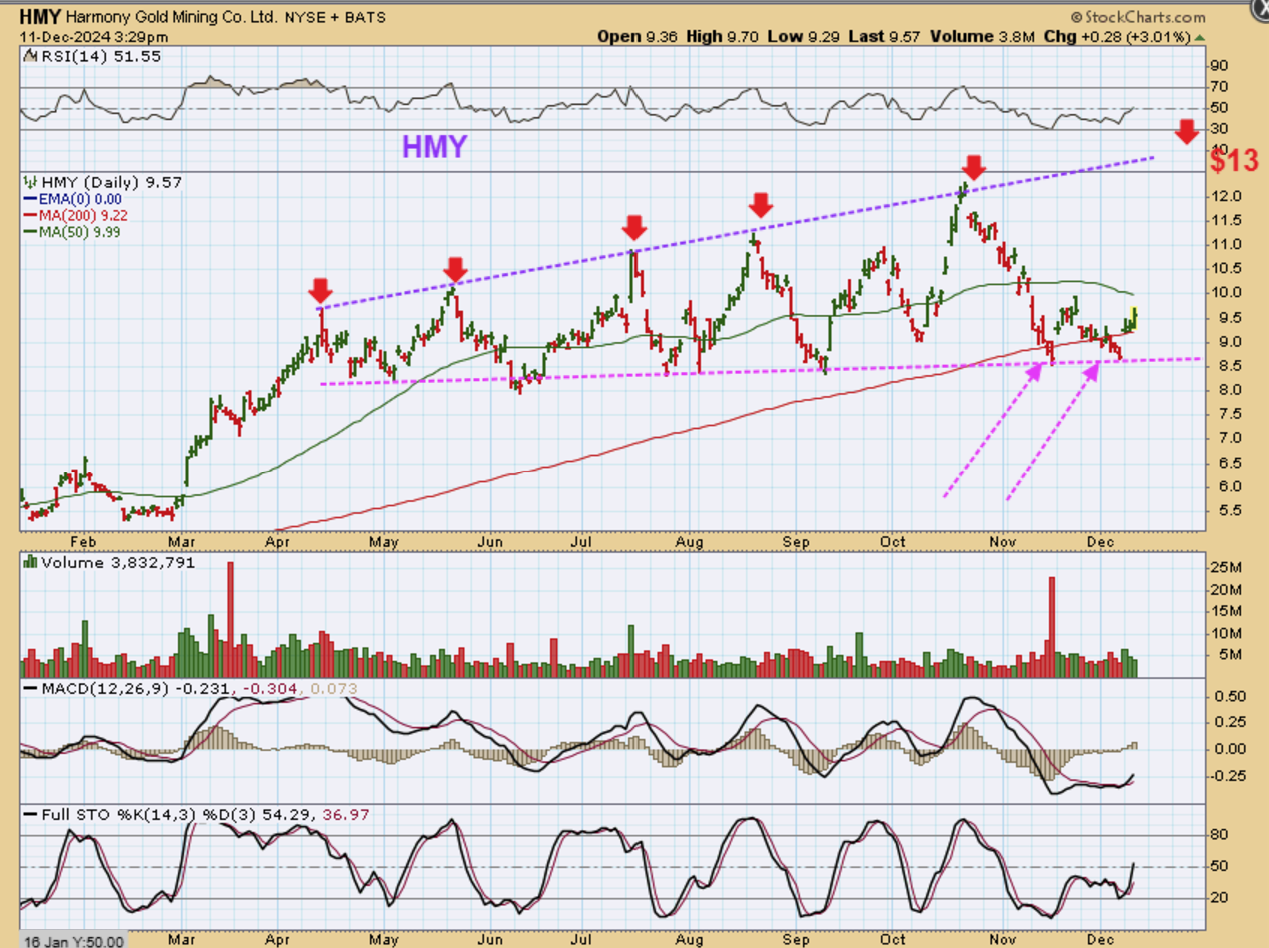
I found an interesting pattern in HMY. When Harmony runs, it runs pretty swiftly, and that can be seen from each run off of this magenta low. Gold is nearing the highs, HMY is near the lows, offering a cheaper entry.
.
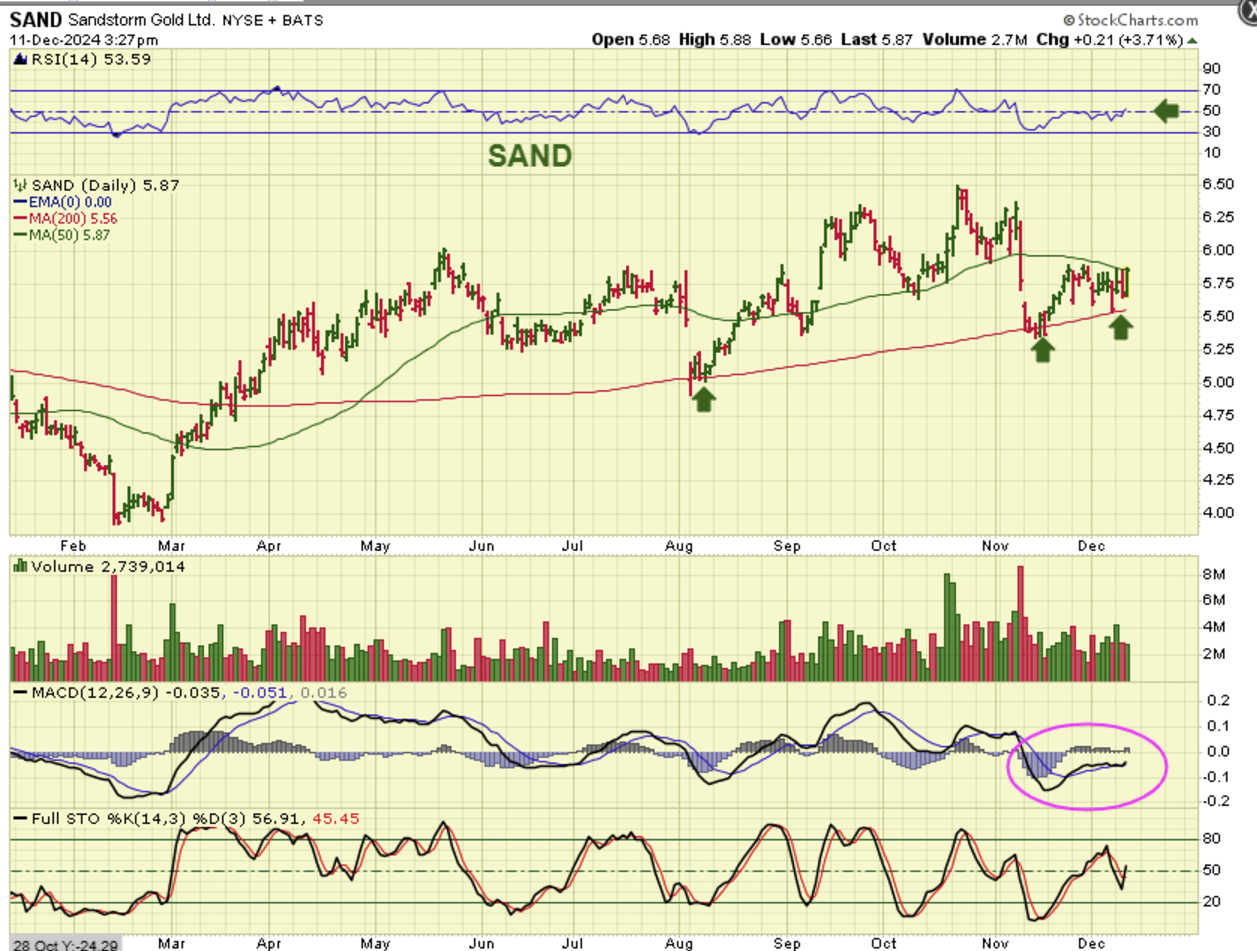
SAND has been bouncing at the 200sma, so it could be bought with a stop there.
.
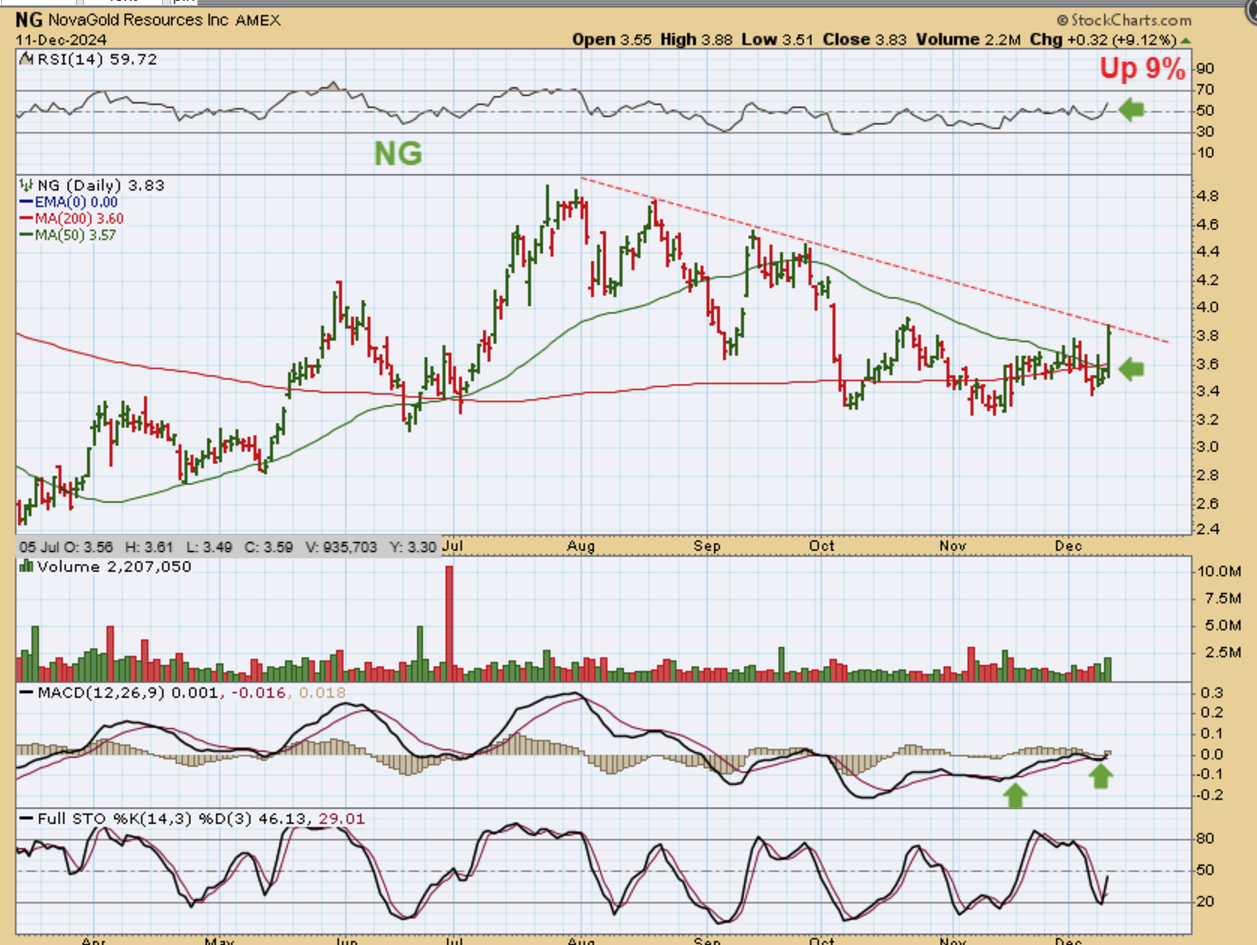
NG popped up almost 10%, but notice that it was under the 50sma and under the 200sma at the open! That is how much the miners seem to be caught off guard with Golds surge.
.
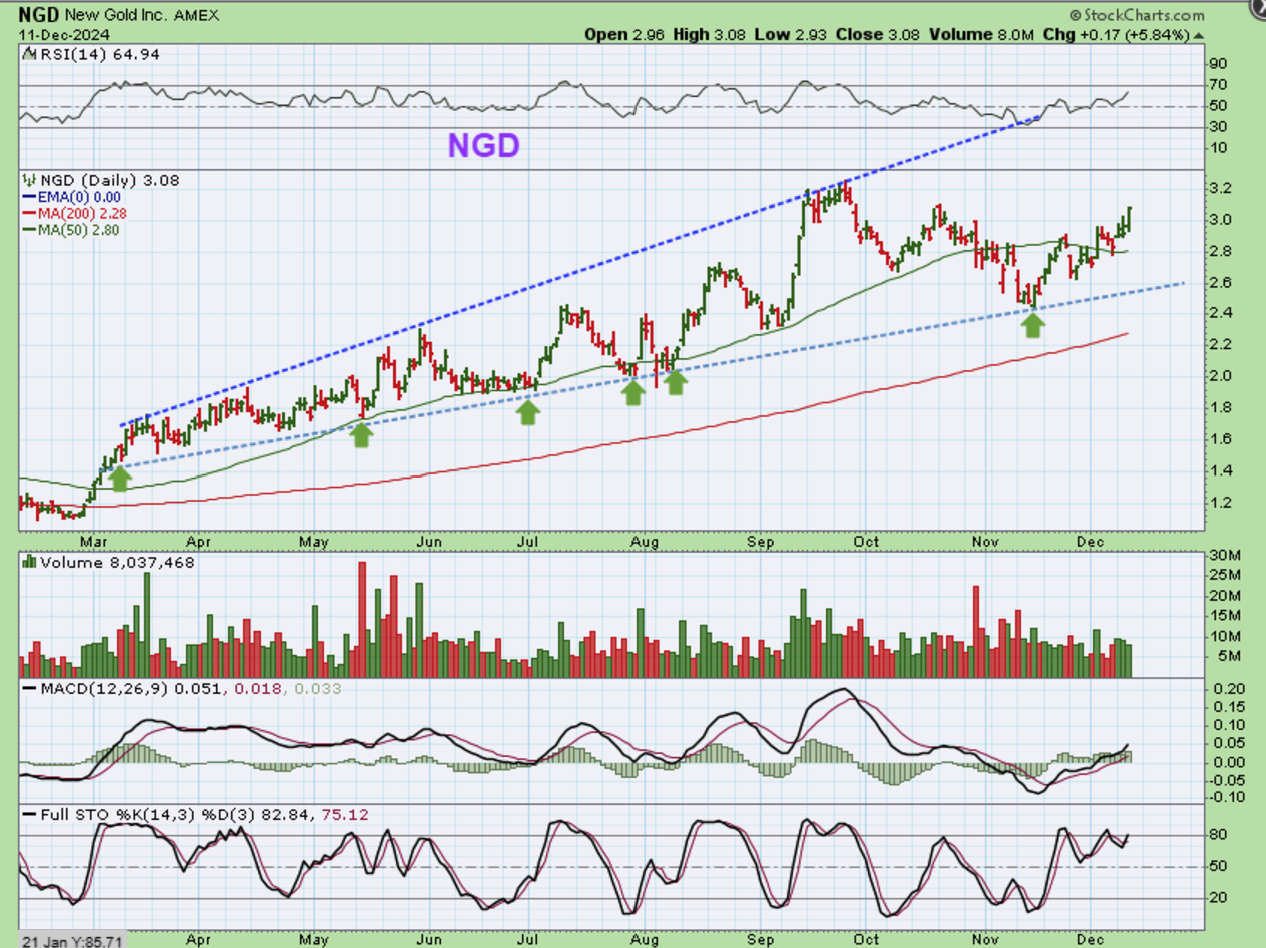
NGD has actually bottomed and has been running since mid-November.
.
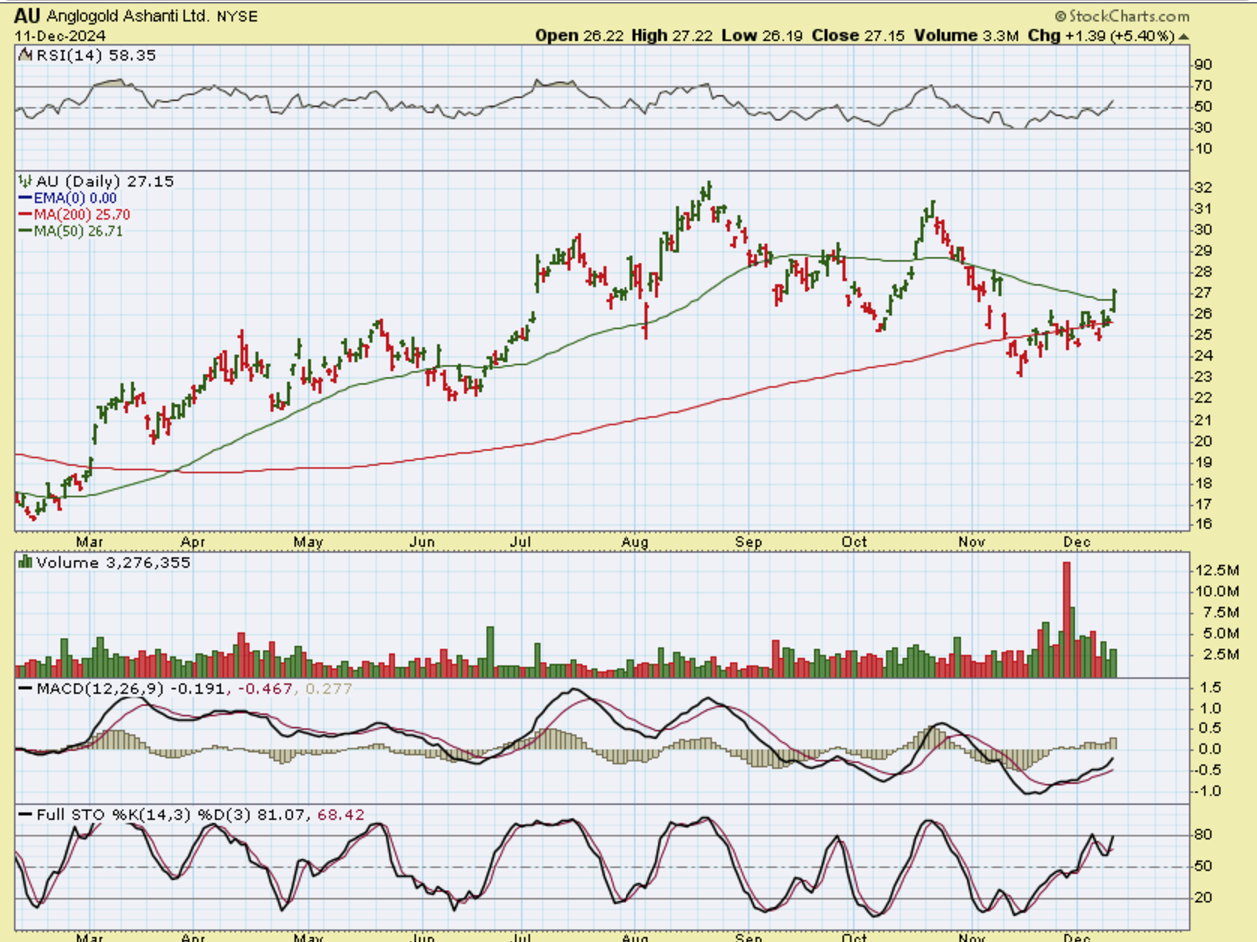
AU is still near the lows, but it did pop above the 50sma.
.
The inflation numbers indicate that the Fed should do another rate cut and the markets really like that. Today we have the PPI Numbers and Jobless claims, so it is possible that we could see follow through, so we’ll see what happens to the futures in all sectors at 8:30 am again. Enjoy your Thursday trading!
.
~ALEX
.
YESTERDAY I STATED:
BITCOIN is choppy at these levels, and
1. The MACD is not turning upward and the RSI made a lower low, but
2. It is also having a hard time dropping to the $90,000 area, which is what I am hoping to see.
3. I’d love to see a new low below that day 47 area this week. If we get that and then a reversal higher, maybe the Crypto stocks will join in the move, but right now Bitcoin looks like it should drop, yet it looks like it has buying preventing it.
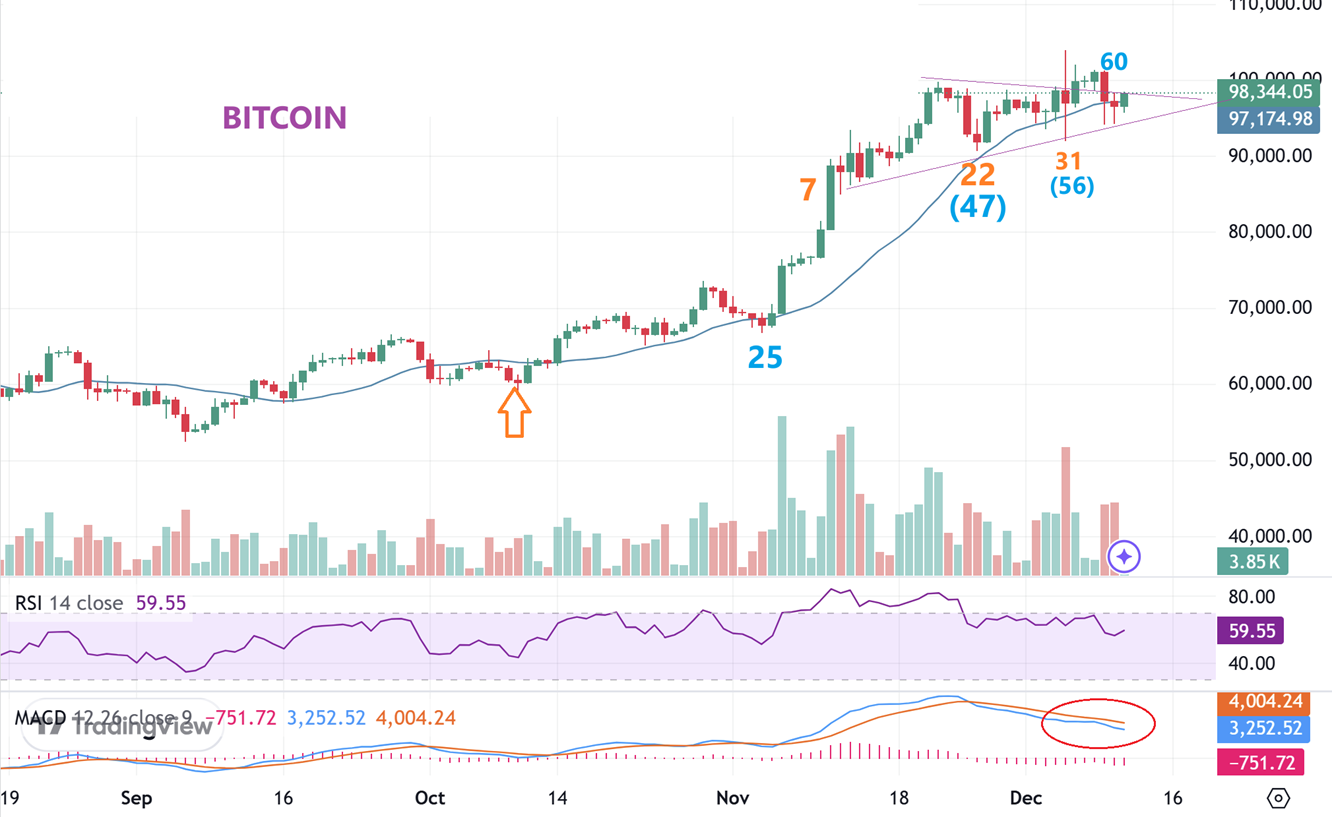
.
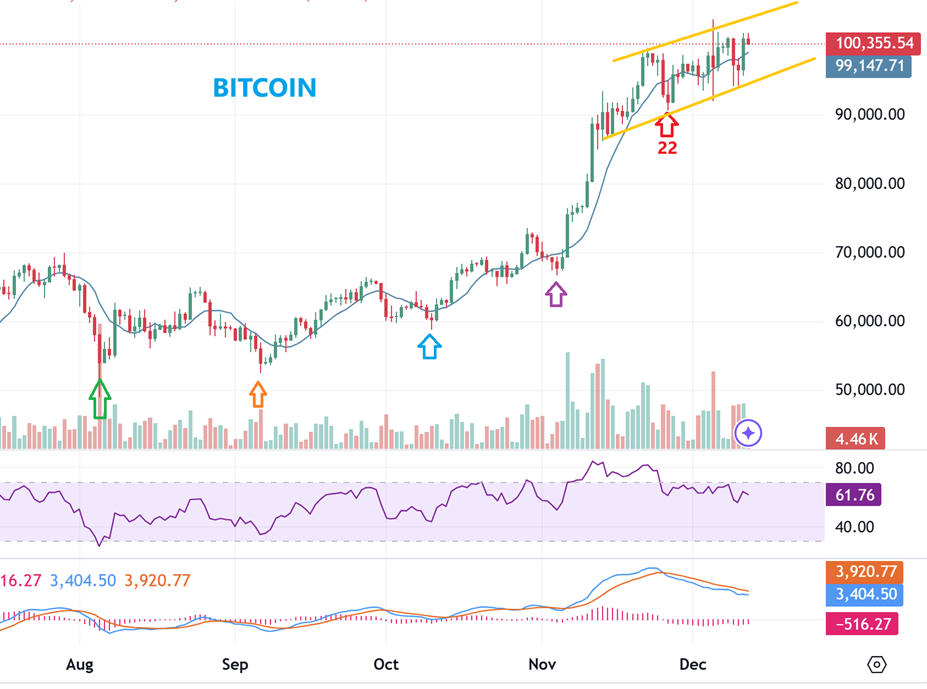
BITCOIN did NOT drop, instead it pushed higher after the CPI Numbers were released. On this 6 a.m. chart from today we see yesterdays candle higher at day 62 (or early in a new cycle count) and a slight red candle for today. Crypto stocks start to rise up with Bitcoin, but they are at the recent lows and Bitcoin is at the recent highs, so we really have to see how this plays out. The inflation numbers seemed to help, but the action in the stocks is still questionable ( The ETFs have done well, since they track Bitcoin).
.
RIOT – We;ll just take a quick look at RIOT. Bitcoin is at the highs and above $100,000, RIOT dropped to the 50sma and that was a drop from $16 to $11. OUCH!
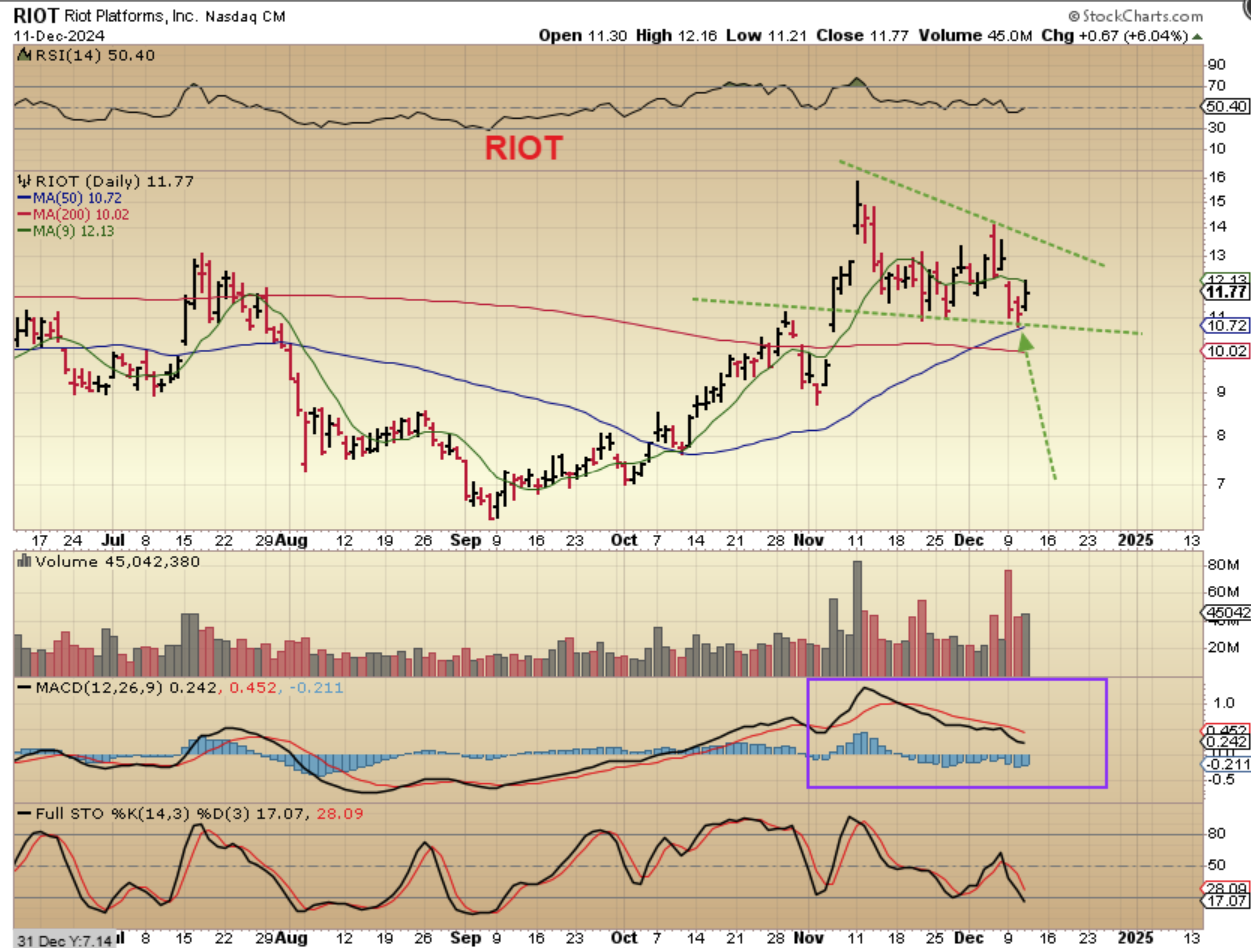
Many Crypto stocks have dropped like this, so are they ready to start following Bitcoin, or just bouncing at support on a good day for Bitcoin? The fact that prices are down here when Bitcoin is up near all-time highs is again…. certainly questionable. We’ll need a little more time to decide, but buying at these lows with a TIGHT stop is a possibility.

