
The Last 2024 Weekend Report
The way that things are currently set up, it is possible that 2025 becomes more of the same type of market action that we saw in 2024. The incoming administration seems to be friendly to corporations with Tax exemptions, but then again some of his policy could also cause waves (tariffs on other countries could raise import prices, etc). So we’ll really just have to see how it all plays out, especially with geopolitical change and wars popping up. In 2024 we saw a bull run in the General Markets, Precious Metals, and Bitcoin, with normal corrections or pull backs as buying opportunities along the way. If that changes, we’ll catch it as things unfold and plan accordingly, but really this could continue to be the market set up through 2025.
.
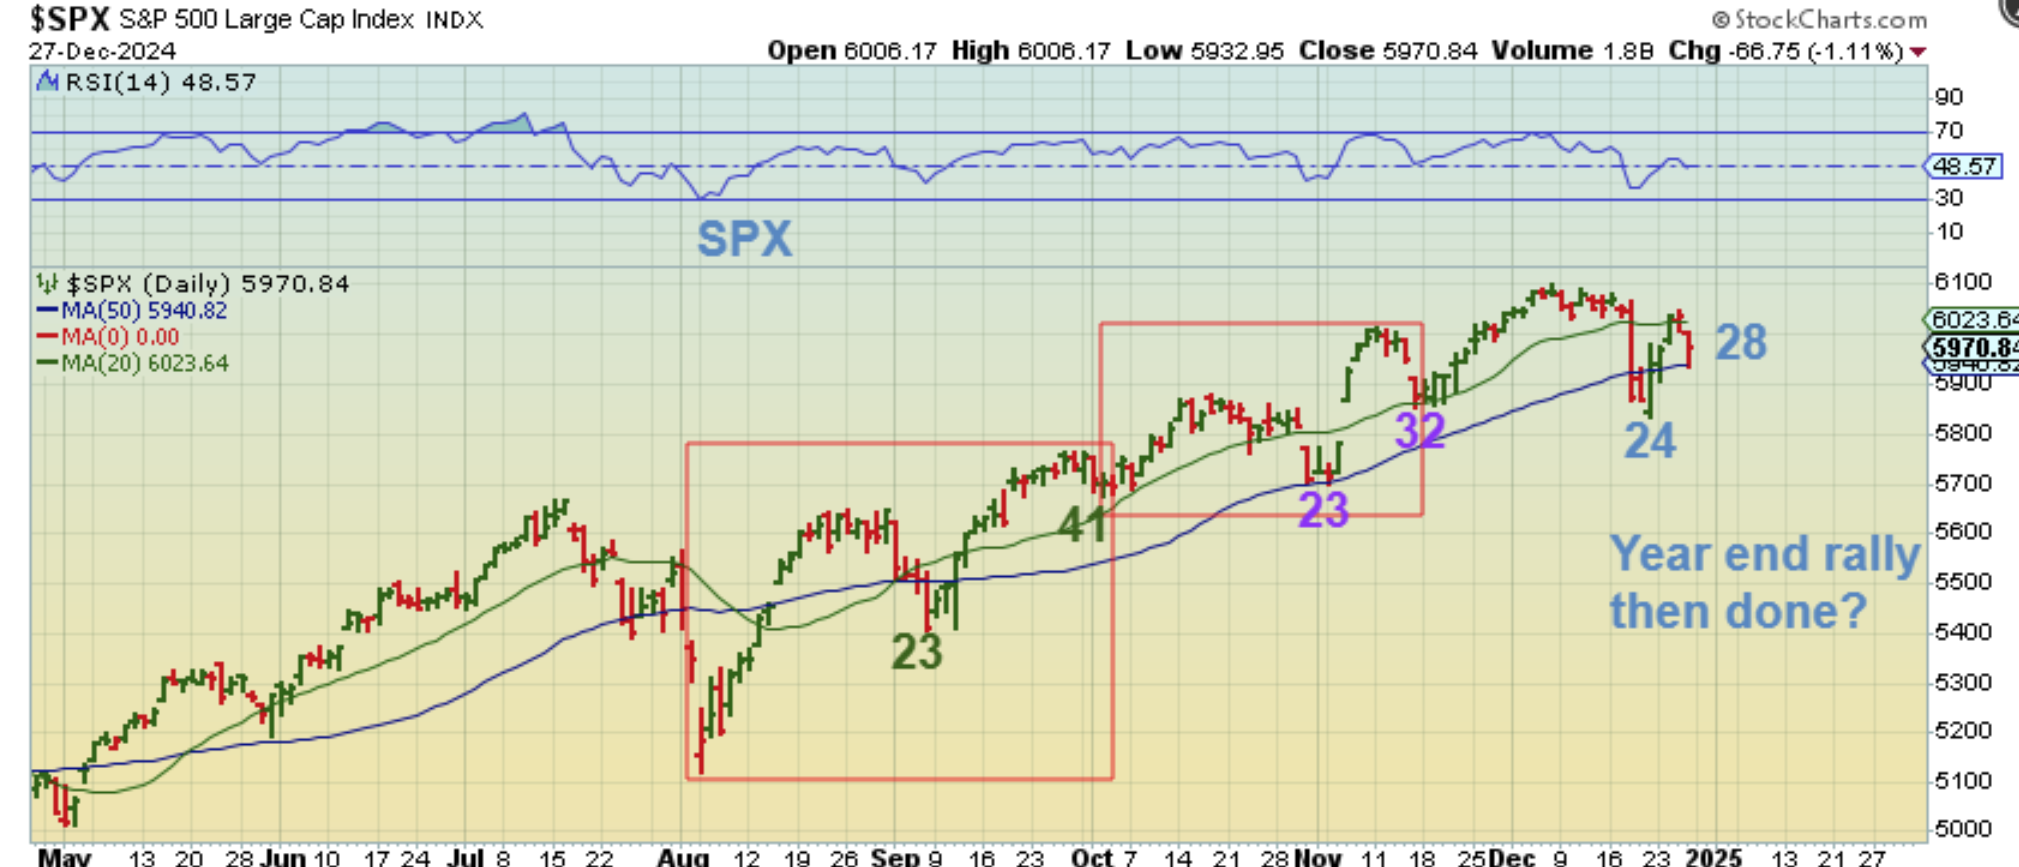
SPX – The General Markets dropped on Friday, but we still have 2 trading days left in the year and the markets can still run higher one more time. Will they? We’ll see, but they can. We are on day 29 as of Monday. The last dcl was day 32, the prior one was as late as day 41.
.
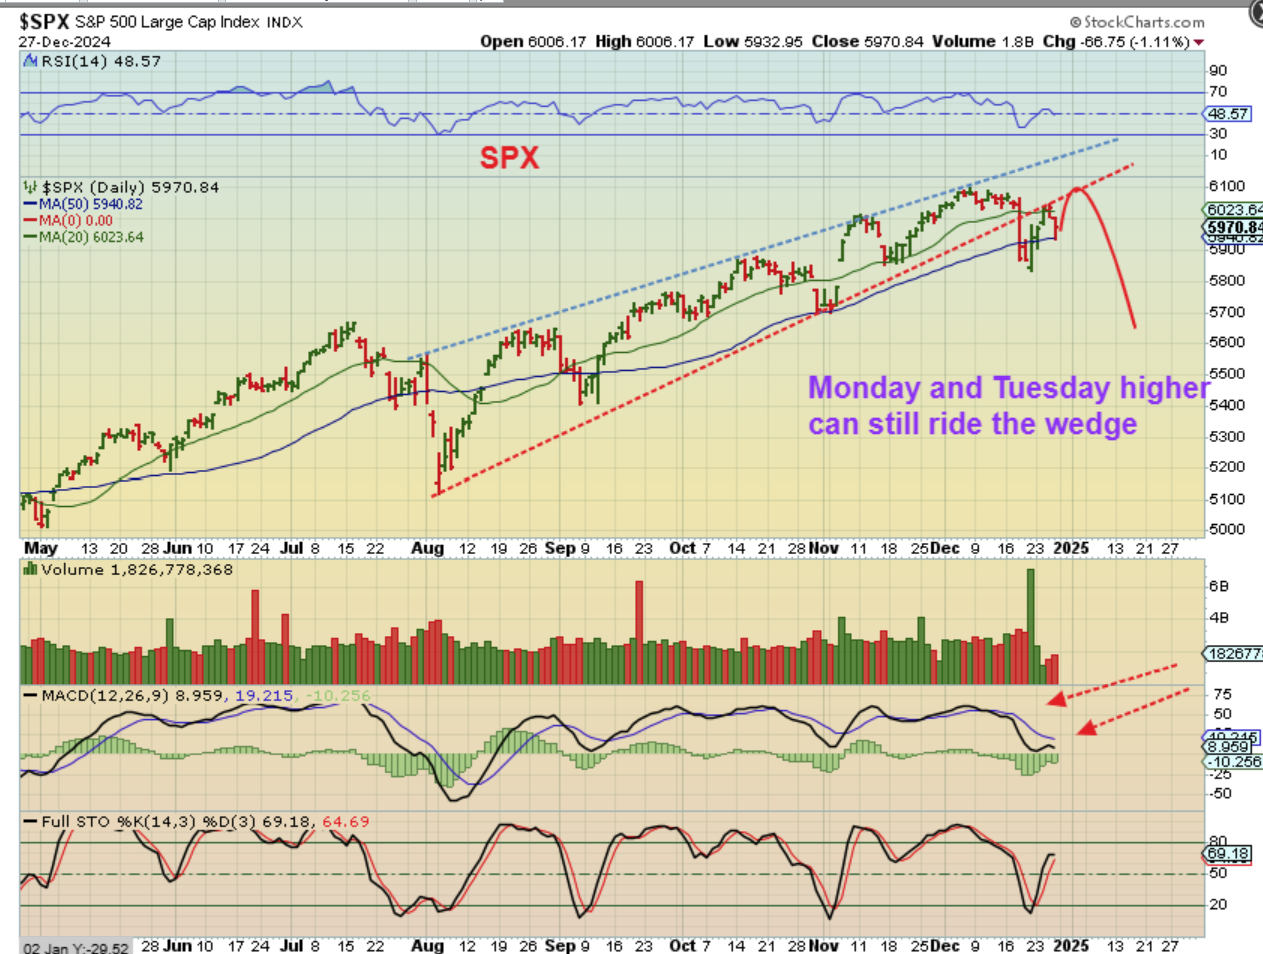
THE SPX rising bearish wedge has already been back tested, so we can drop. That said, price bounced on the 50sma Friday too, so we can run up one more time for a year end rally, as drawn here, too. That MACD was very weak on this bounce.
.
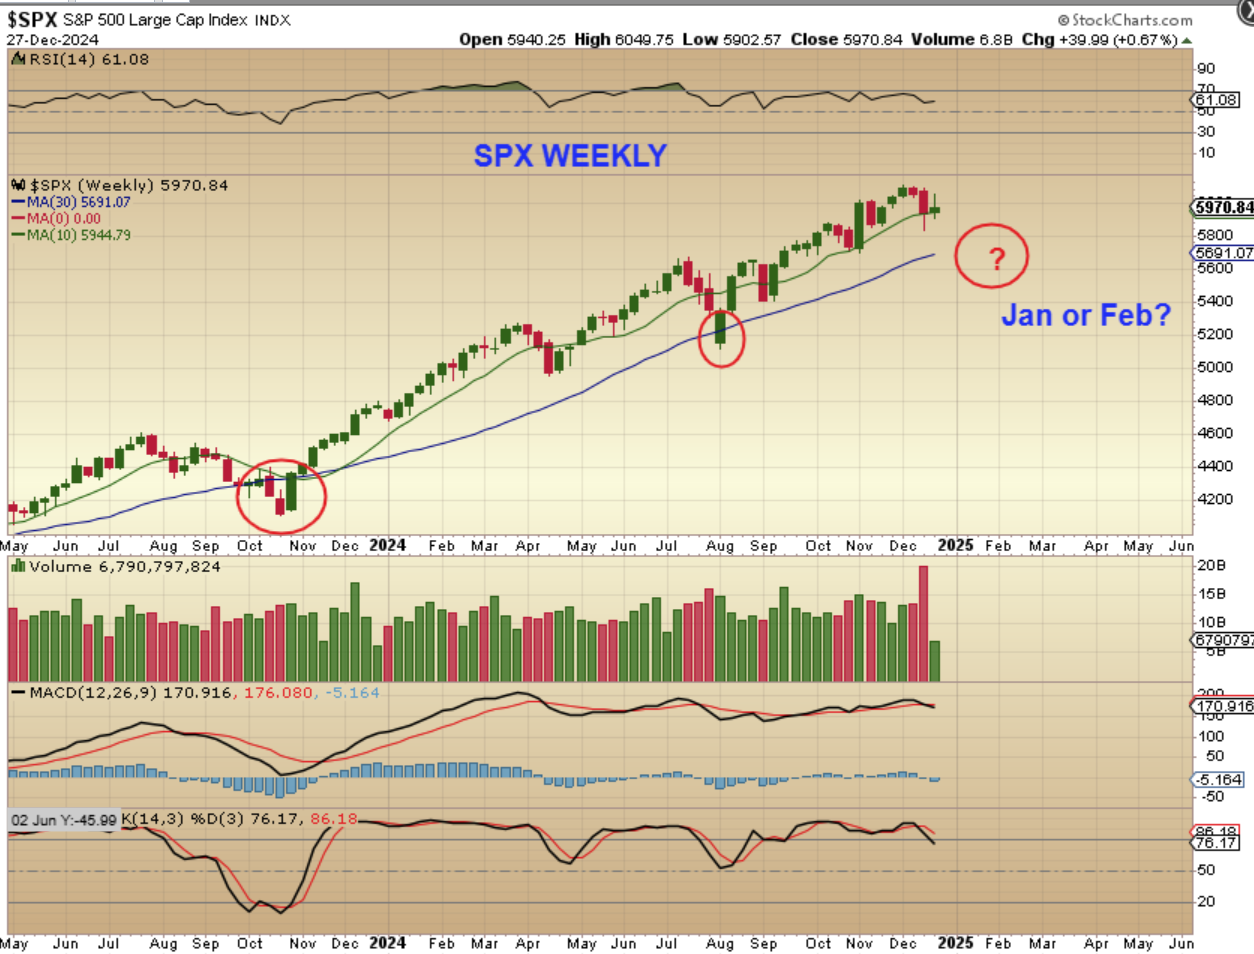
SPX WEEKLY– Even bull markets make a sudden multi week deep correction and those are the ICLs that we get, often twice a year. Our last one was in August, so we should sell off into our next low in January or February. Then we get stocks that sold off, maybe found support, start to reverse, and ….they become a good buying opportunity.
.
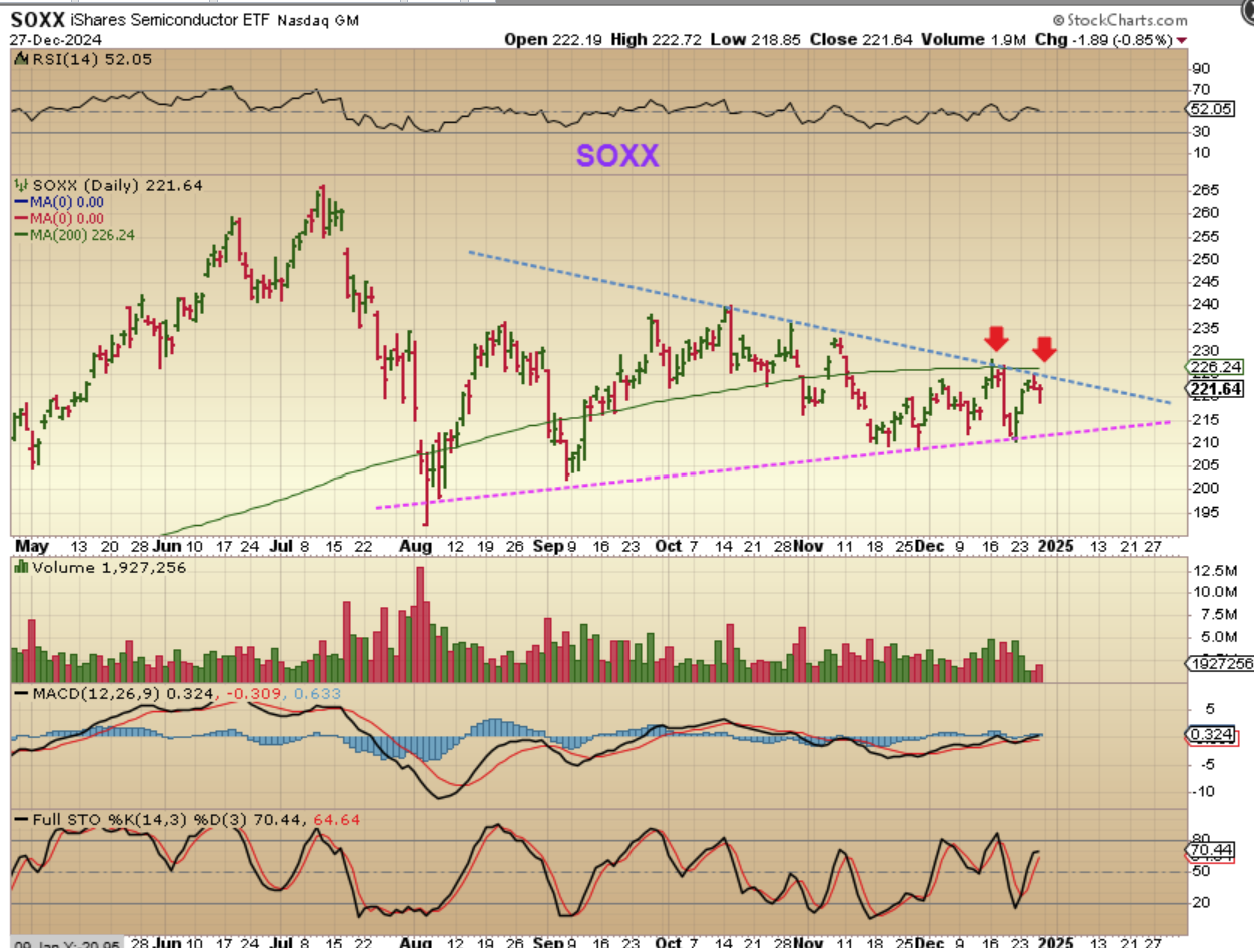
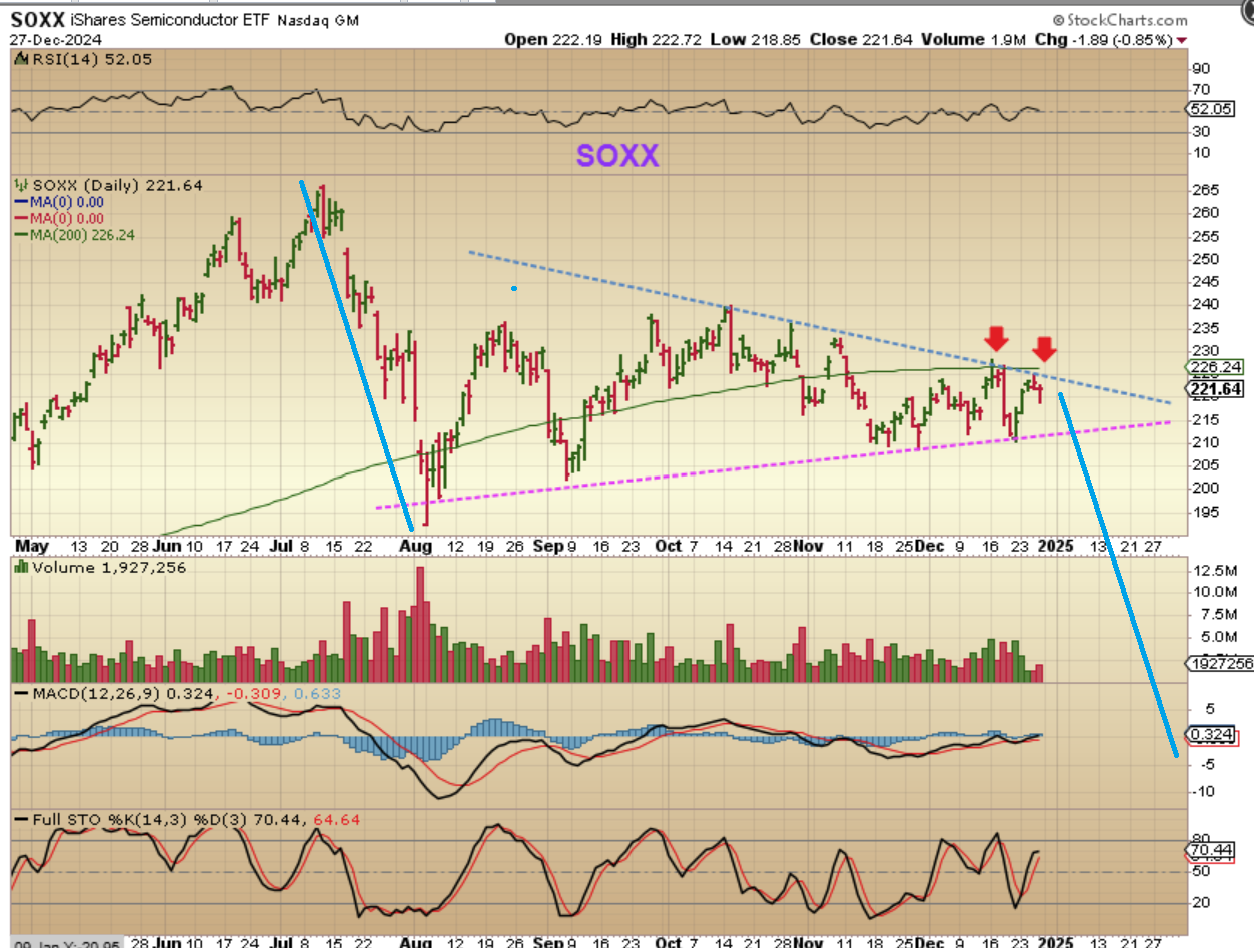
THE SOXX has been the weak one after giving us a failed daily cycle. I do not see this getting back above the 200sma for a while. I have been discussing a SOXS trade (Short the SOXX), but timing it perfectly can be tricky. That drop…
/
That drop could resemble the July to August ICL drop, so you can see why it should be a good trade. Believe it or not, SOXS ran from $17 to $38 then!!
.
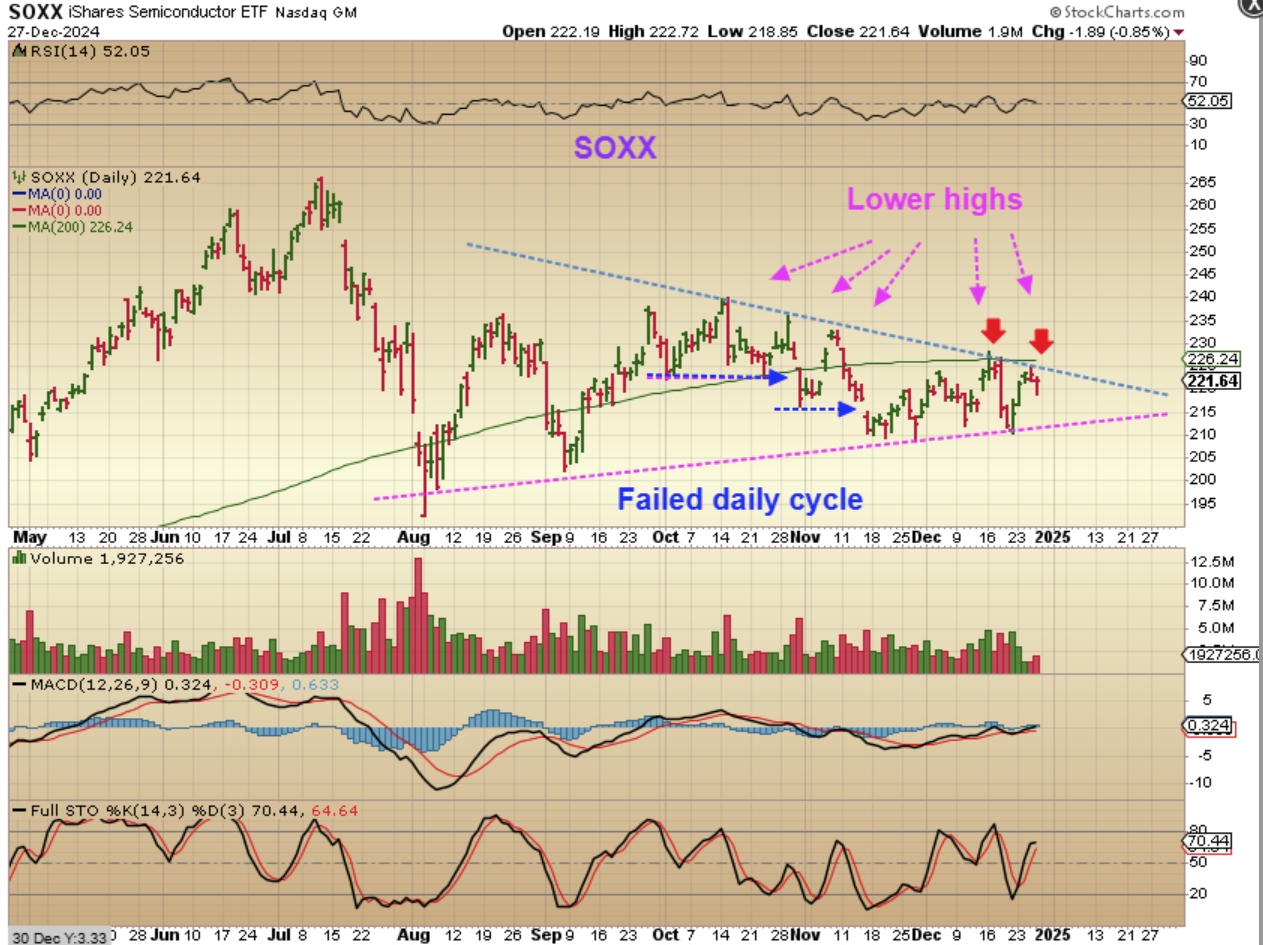
SOXX formed a triangle, and some may view it as a bullish development, but I still expect a break down from here. We had a failed daily cycle early in the Intermediate cycle and a series of lower highs since then. I have to view this as a failure in the making.
.
Conclusion: I want the SOXS trade, but I will admit that I have always had a hard time shorting a bull market, despite knowing cycle timing. I have yet to enter and completely ride it down into an ICL, and I had planned to do that in July 2024 too. Maybe I’m just too optimistic? 🙂 Maybe I’ll try a small starter position on Tuesday at the close?
.
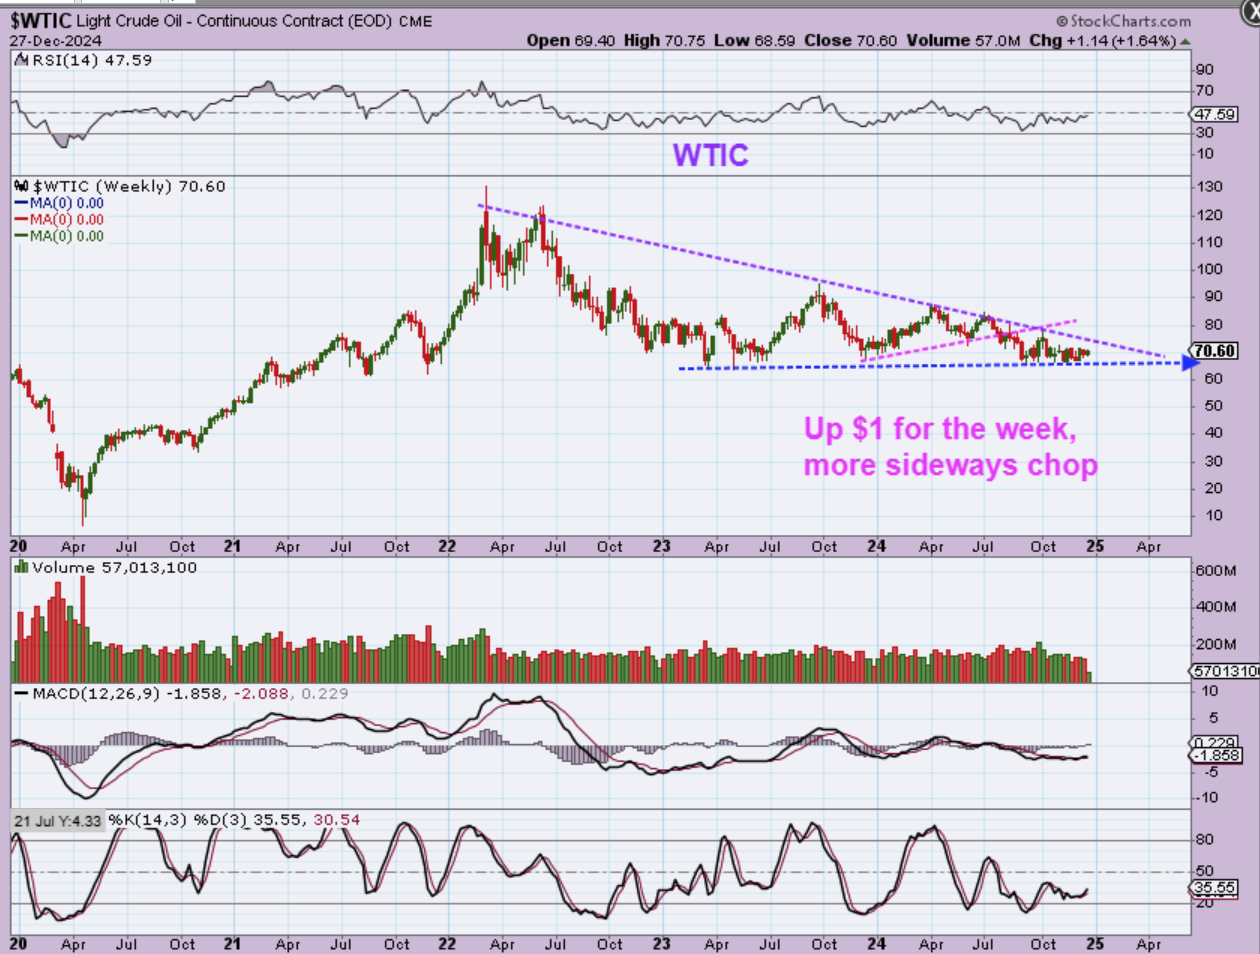
WTIC WEEKLY -Another week has passed and Oil moved up $1. We are getting to the apex of the triangle though, so this constant sideways chop will come to an end soon, and we are actually getting late in the intermediate cycle, so I have to expect a break lower in time.
.
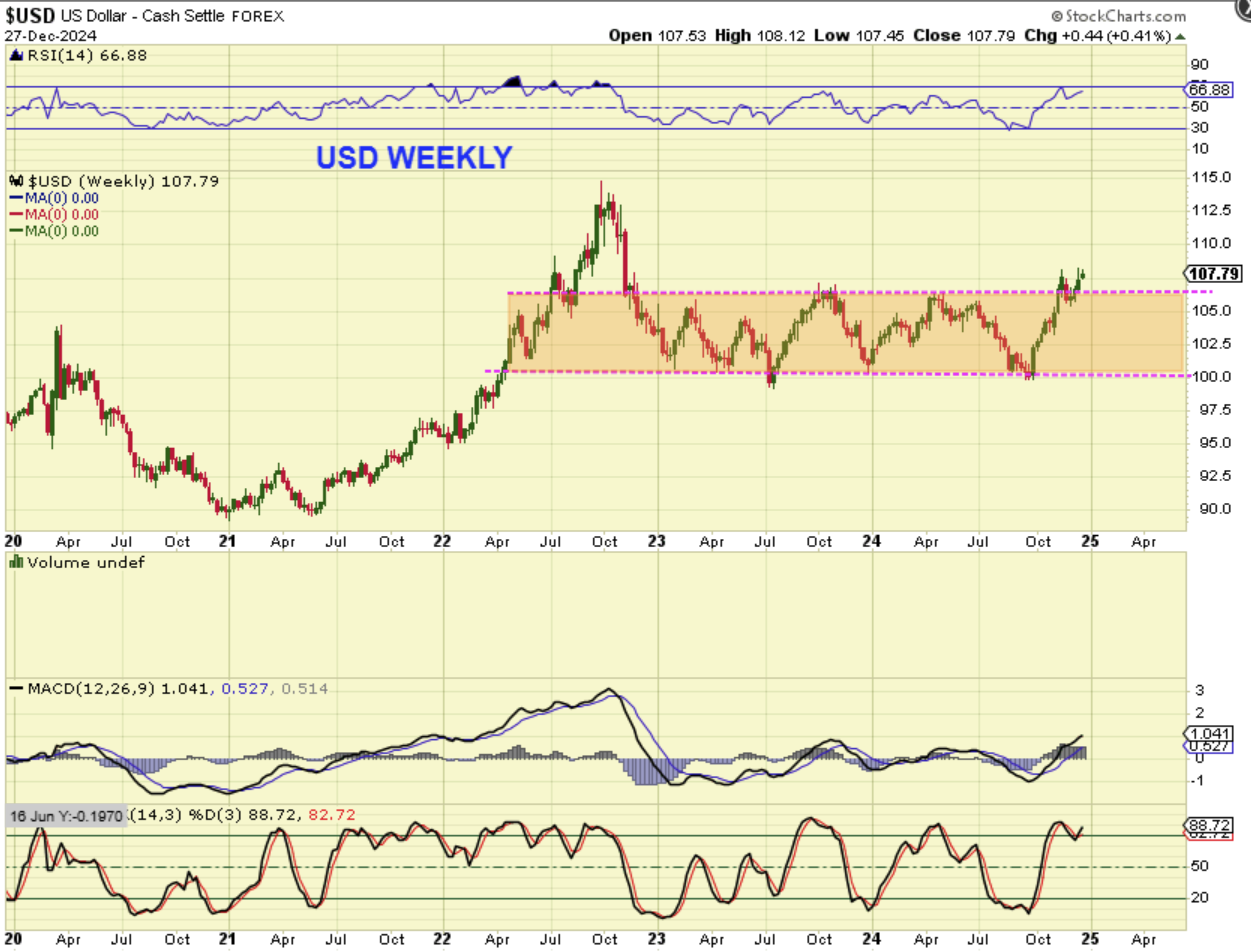
USD WEEKLY– The USD stalled last week and this week at the $108 area. That does give it a breakout above my $107.50 target, but we are also in the 3rd daily cycle and it could pull back from here. Everything considered, Gold rallied strongly from July to November and the USD ran with Gold for a few months, so the USD strong rally did not affect our trading at that time.
.
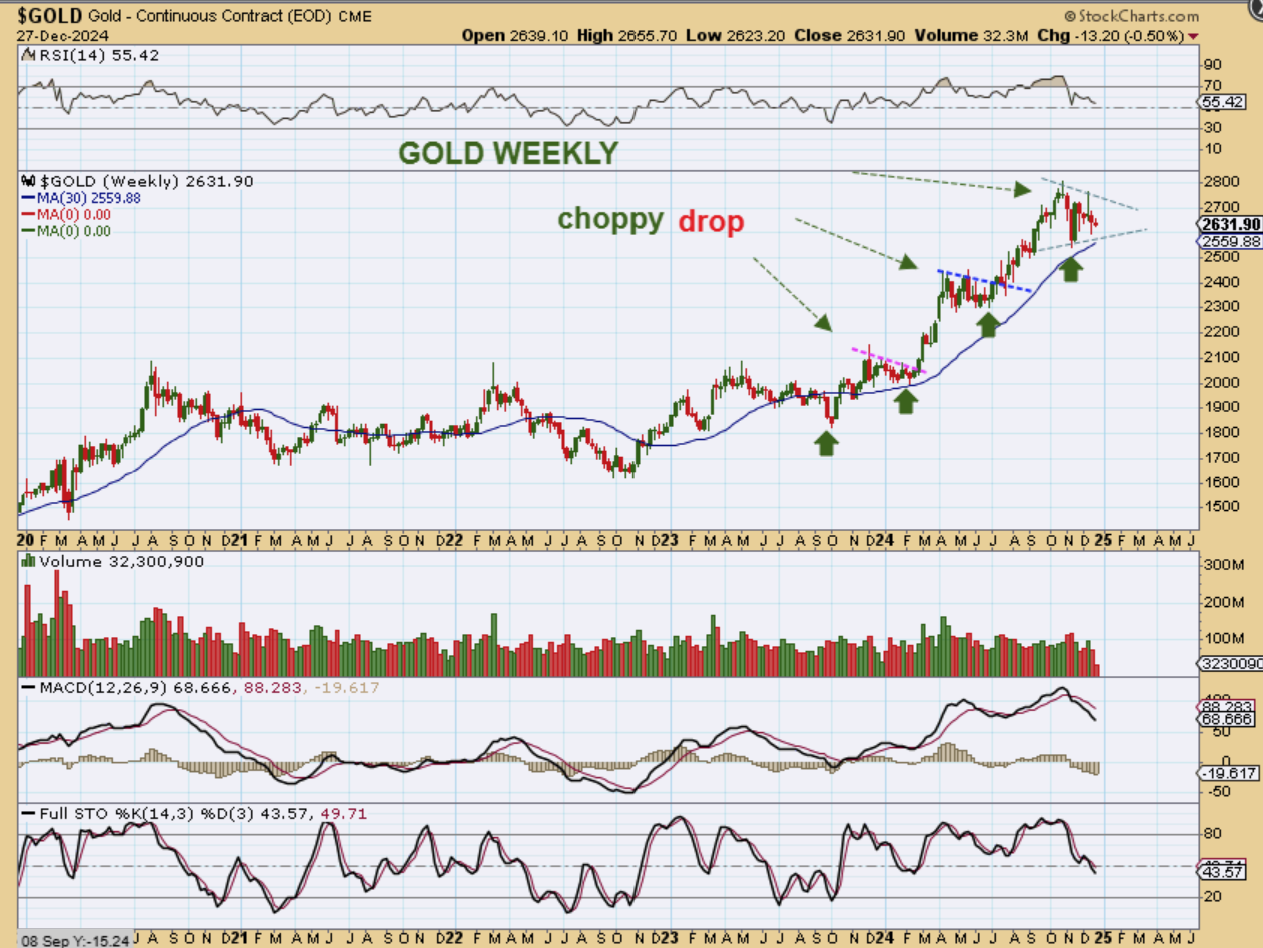
GOLD WEEKLY– After breaking out from that LONG 3 year consolidation, Golds rally was strong and the last couple of ICLs for Gold were choppy and semi-mild. They look more like triangles. Recently a sharp drop appeared to be the ICL, since the following daily cycle is R.T. So we may be choppy, but we also may have an ICL and a triangle forming.
.
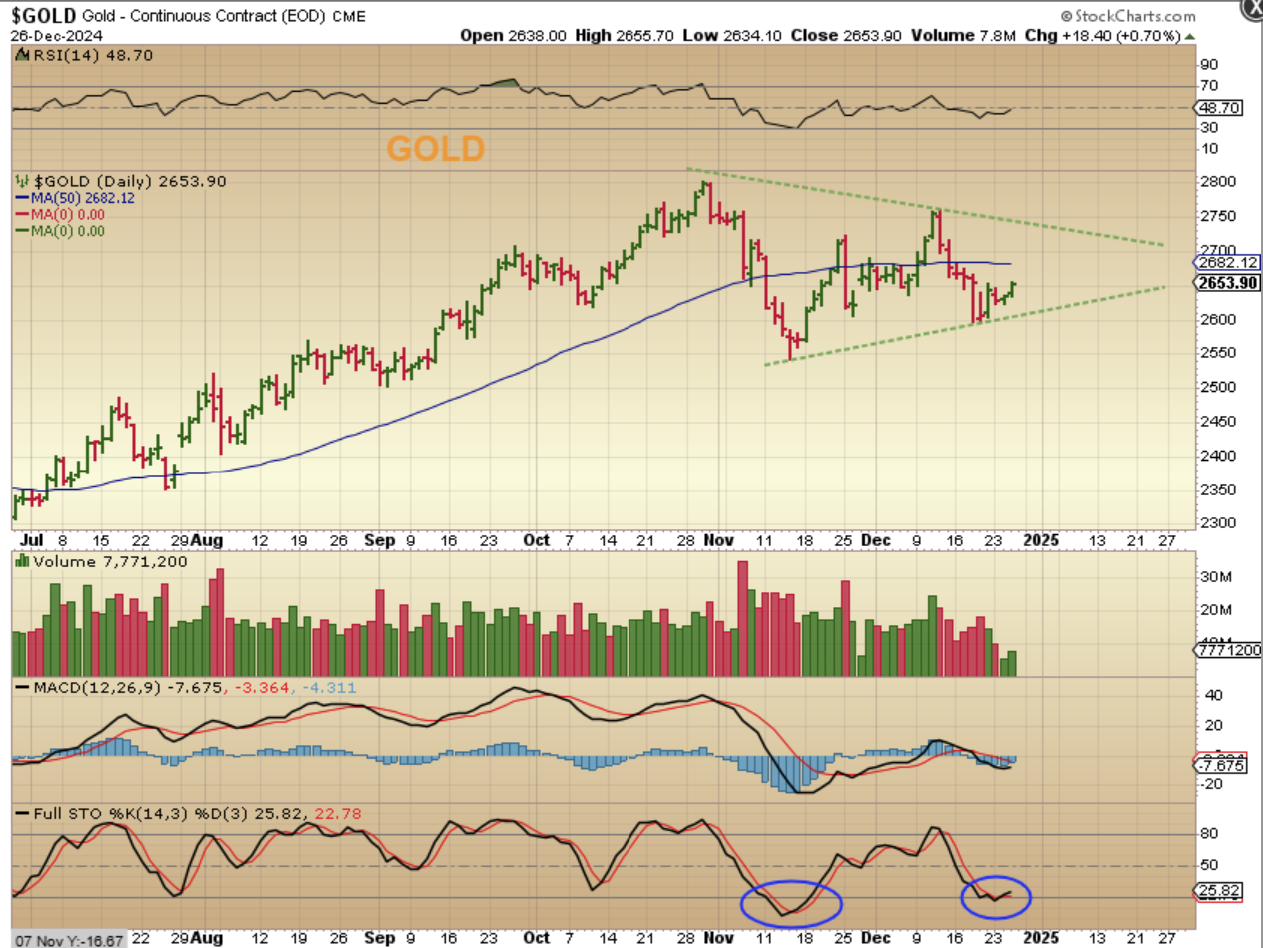
GOLD – This was my triangle in Fridays report and I said, due to the cycle count here, that Gold may be the putting a dcl in place as it climbs around the triangle.
.
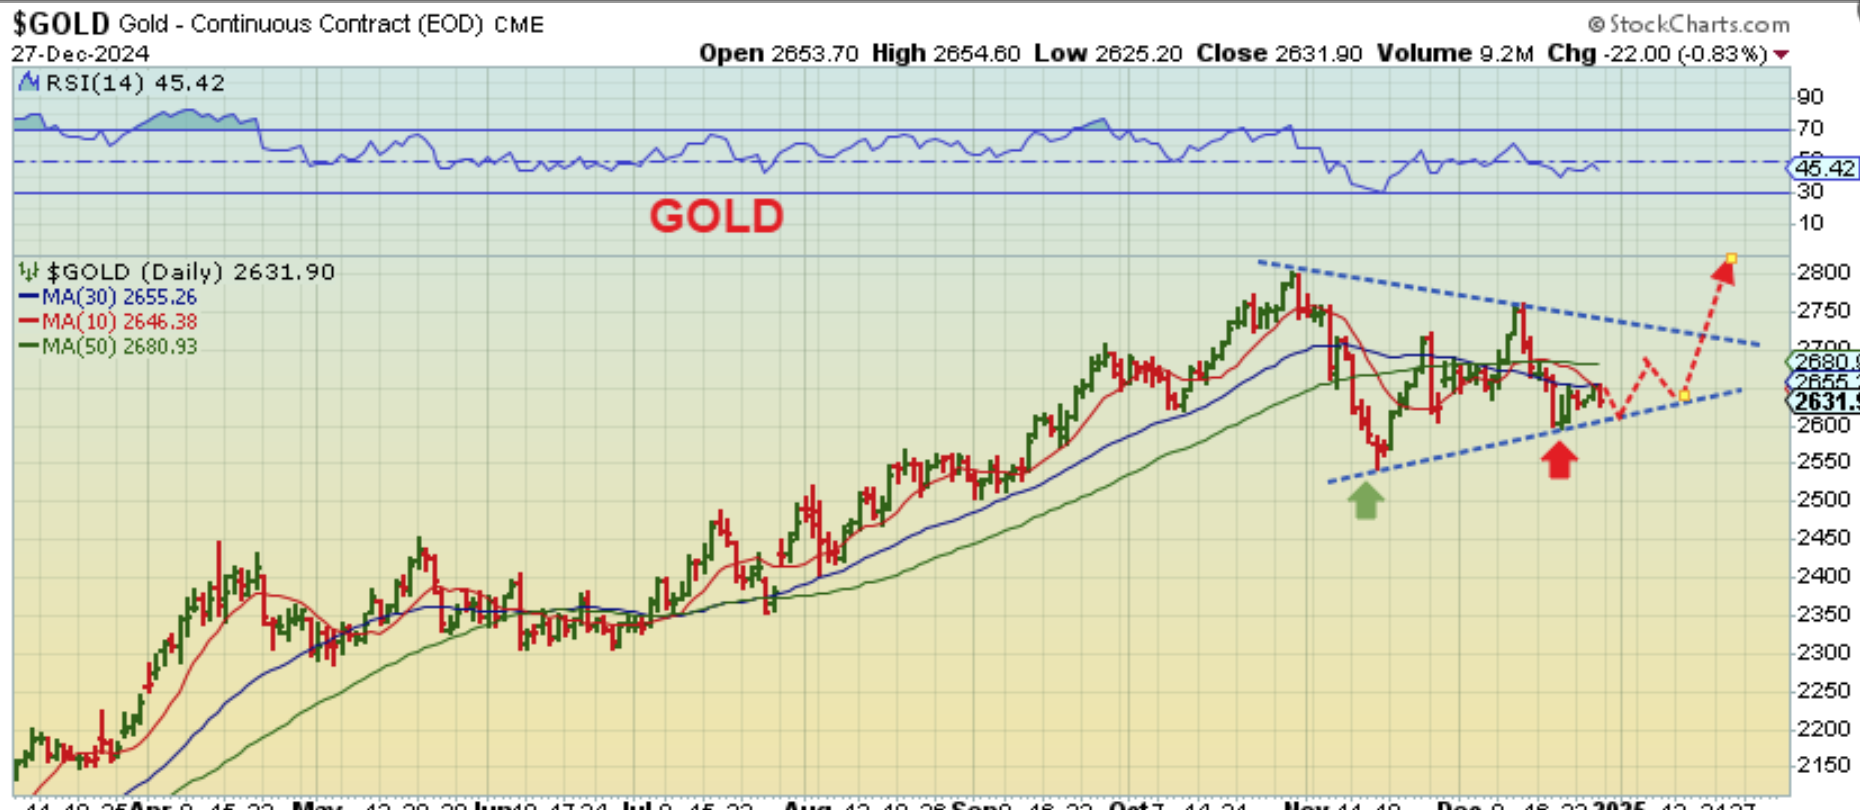
GOLD – This was my idea with an ICL and then a short daily cycle with this red arrow at day 24 as a possible dcl. That dcl on day 24 has NOT been confirmed yet, it is stuck below resistance, so…
.
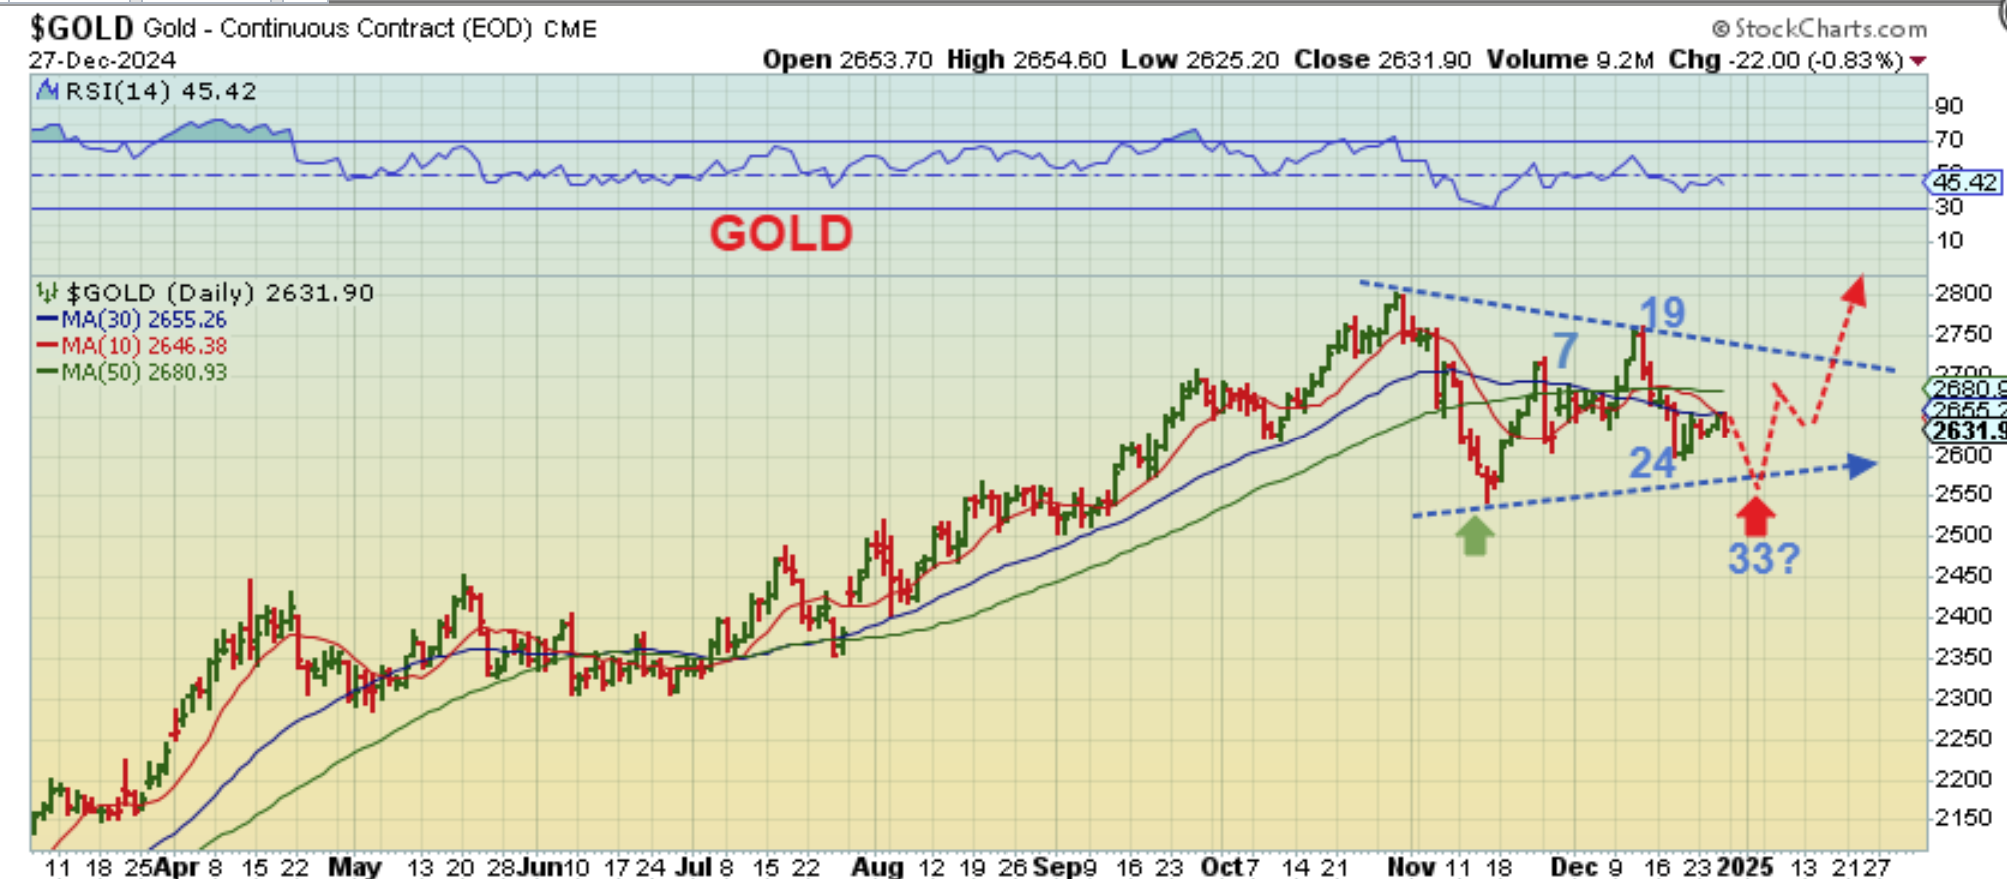
GOLD – The day 24 dcl would NOT be the dcl if Gold can’t break through that resistance to confirm it. Gold could then sell off below day 24 to find a slightly deeper low as the dcl near day 32. I would not expect the ICL to be broken though, so the triangle could expand a bit, as shown here, with a slightly deeper dcl around day 32 or 33.
.
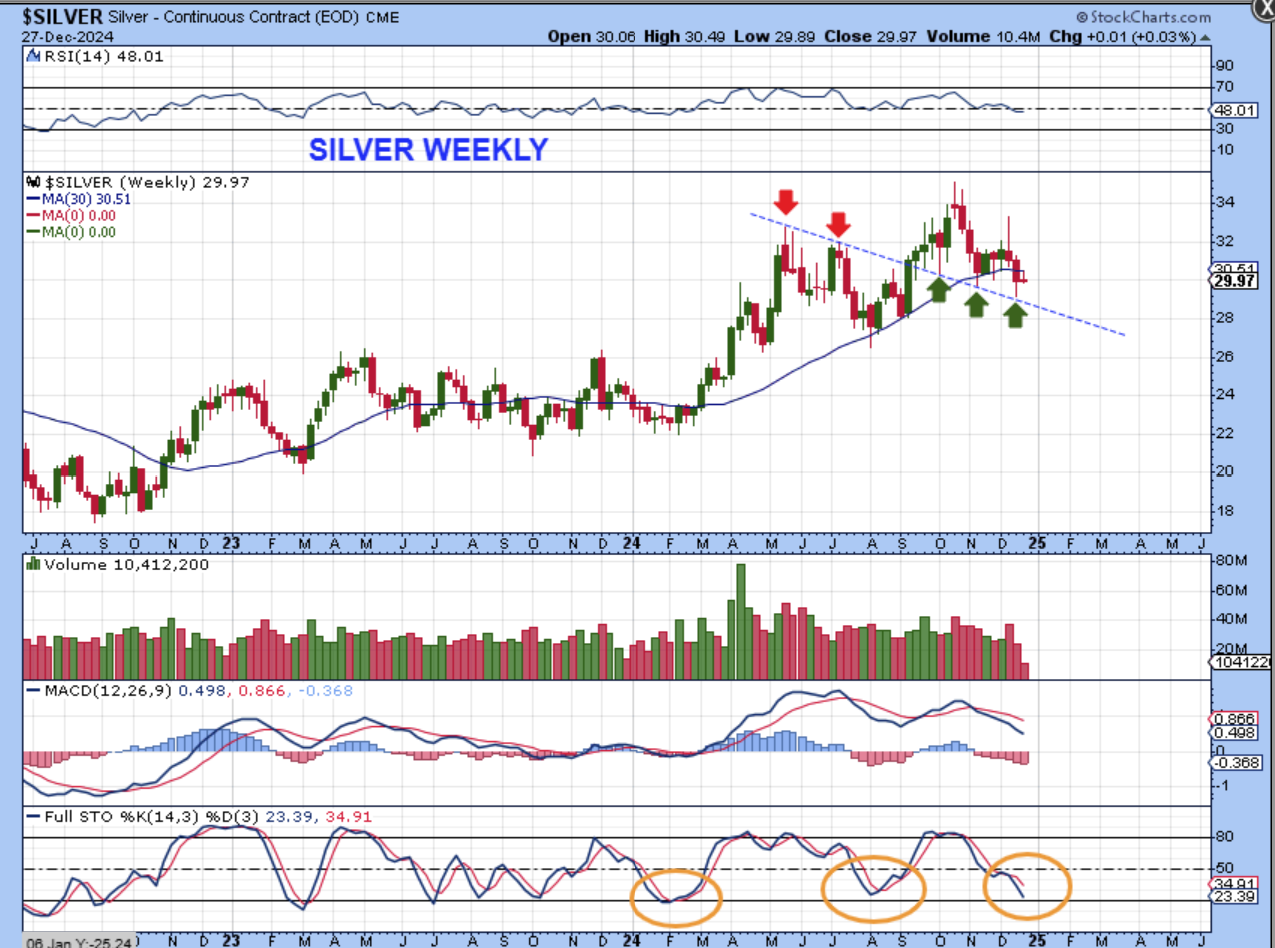
SILVER had a very small candle this week after reversing off of the trendline last week. Silver emains under the 30 week ma.
.
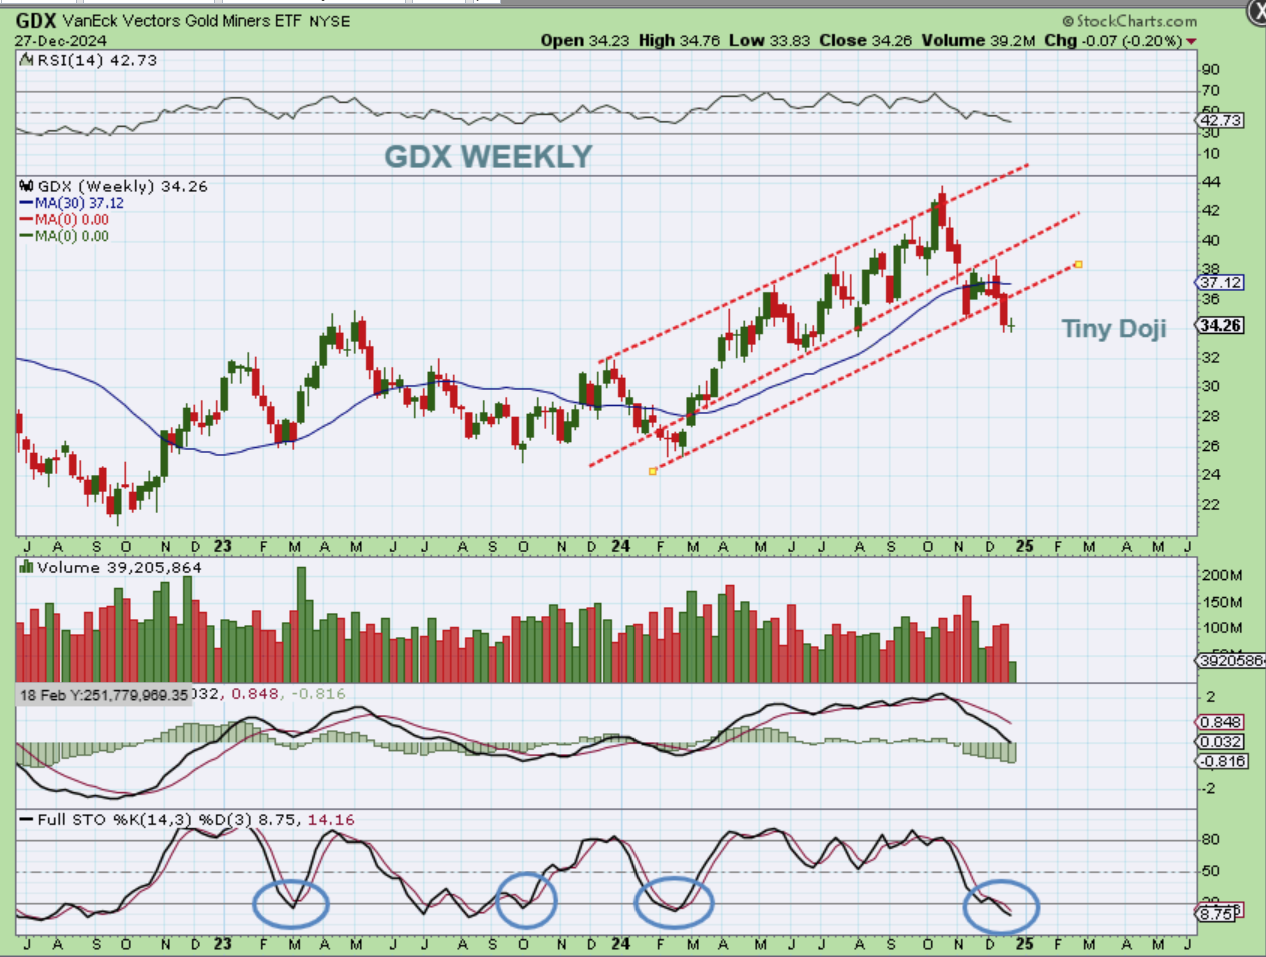
GDX WEEKLY -The miners also had minimal movement this week, closing down 7 cents with a weekly doji of indecision. Look at the amount of selling (red candles) we see in October, November, and December. The chart tells us that for now, the sellers stopped selling, so that is good, and when Gold is ready to run, the Miners should move higher too.
.
Using both Cycles and Technical Analysis, I’ve been trying to calculate what we might see as we cross over from 2024 to 2025, but the reality of what we get will be seen in the coming week. We trade out of 2024 Monday and Tuesday (still time for a continuation rally in the general markets) and then 2025 trading starts on Thursday and Friday. It is true that we could just have a great week and just rally right through the week, since there is ‘time’ for that cycle-wise, but we also could start selling down like we saw on Friday, because we are past the midpoint of the 3rd daily cycle.
.
With that above mentioned General Market set up comes Gold looking and acting like it already has an ICL in place. The Miners are still right at the lows, so we haven’t missed a low entry point. That makes it appear that the General Markets could start to move lower soon, and as they do the Miners may become the safe haven play. Bitcoin is also nearing day 60, so now we might have a market chopping lower as safe havens move higher. That is how it looks for now, I can’t wait to see how next week plays out. And when we get to the ICL in the General Markets, stocks like AAOI, LMND, NFLX, NVDA, GOOD, RKLB, XMTR, SOFI, AI, SOUN, BBAI, Quantum Stocks and many more may become excellent buy & hold candidates.
.
Bitcoin is below, enjoy your weekend!
.
~ALEX
.
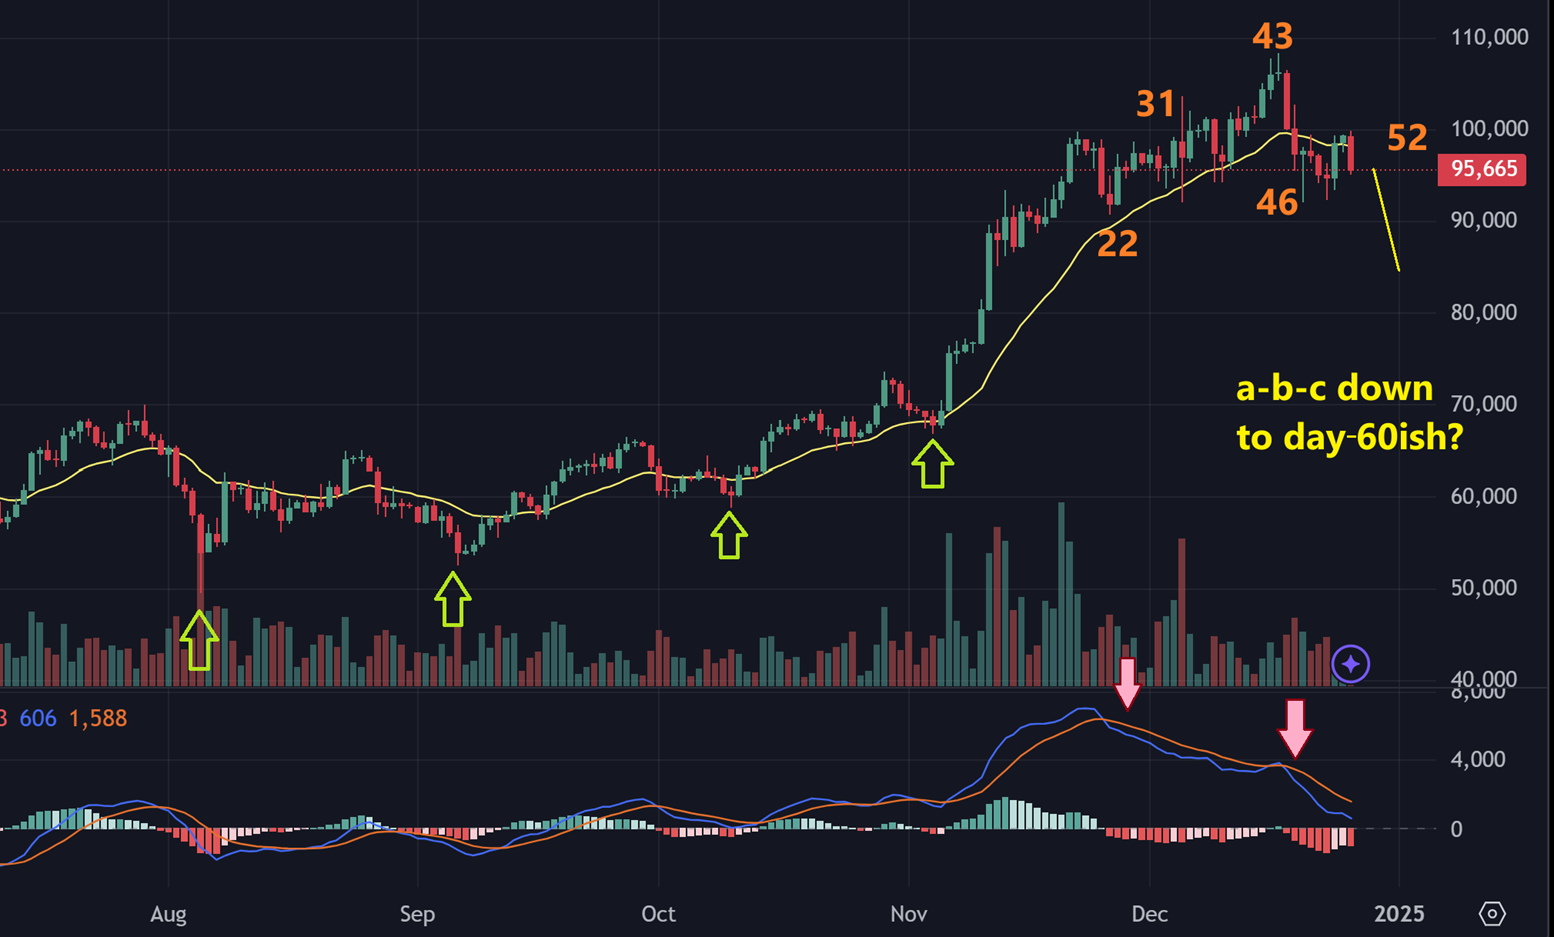
Bitcoins daily charts have been discussed this way: It should be coming due for a dcl around day 60ish and Bitcoin was on day 53 Friday.
.
BITCOIN Popped on Tuesday, but then started to roll over on Thursday, so I mentioned that we should be on day 52 Friday and a drop into the day 60 area would lead into next week (Bitcoin trades 7 days a week, so day 60 would be next Friday on January 3rd, but the low does not have to be EXACTLY on day 60).
.
So Bitcoins day 60 is Friday Jan 3rd, but a low does not come right on day 60. Next we go to the weekly charts.
.
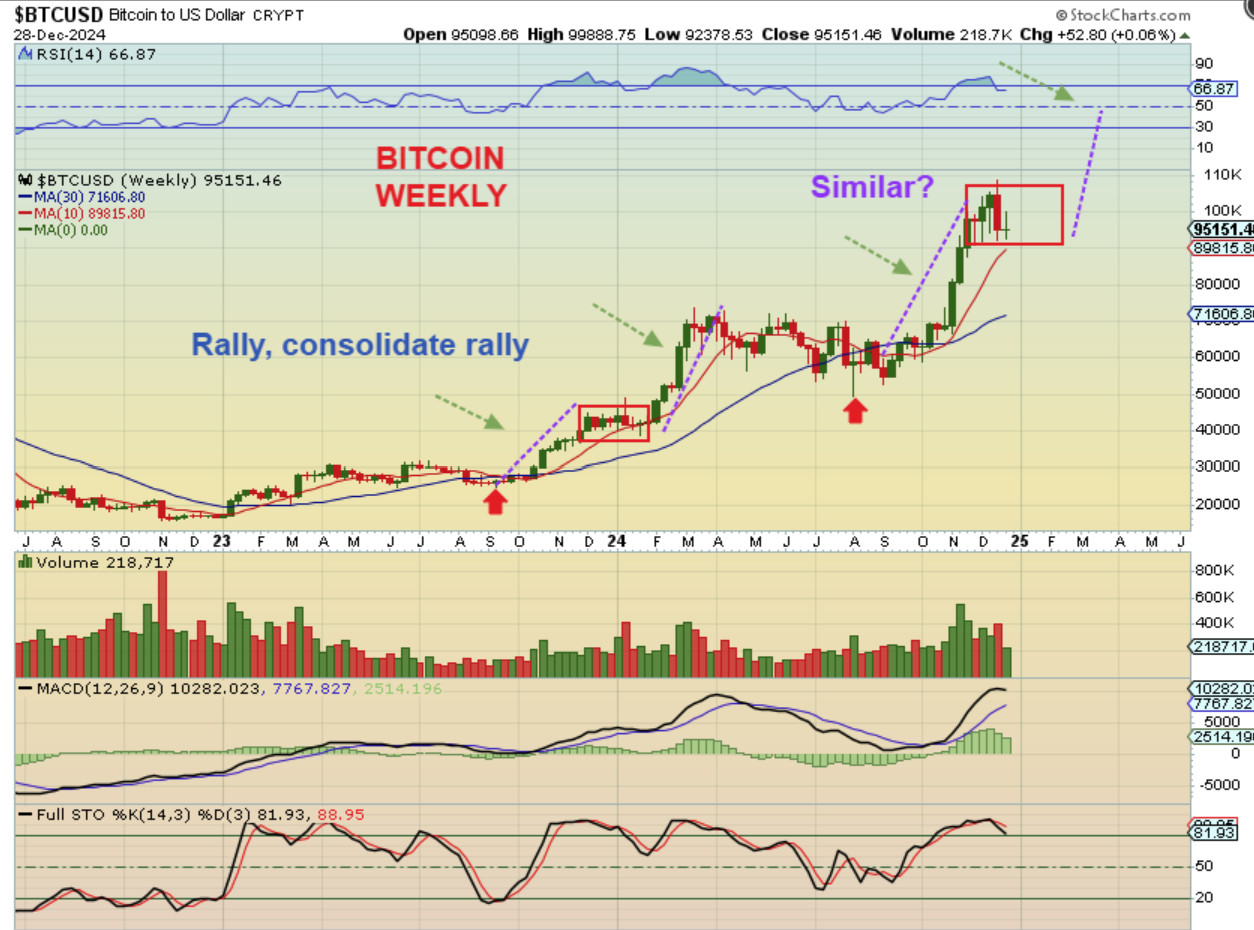
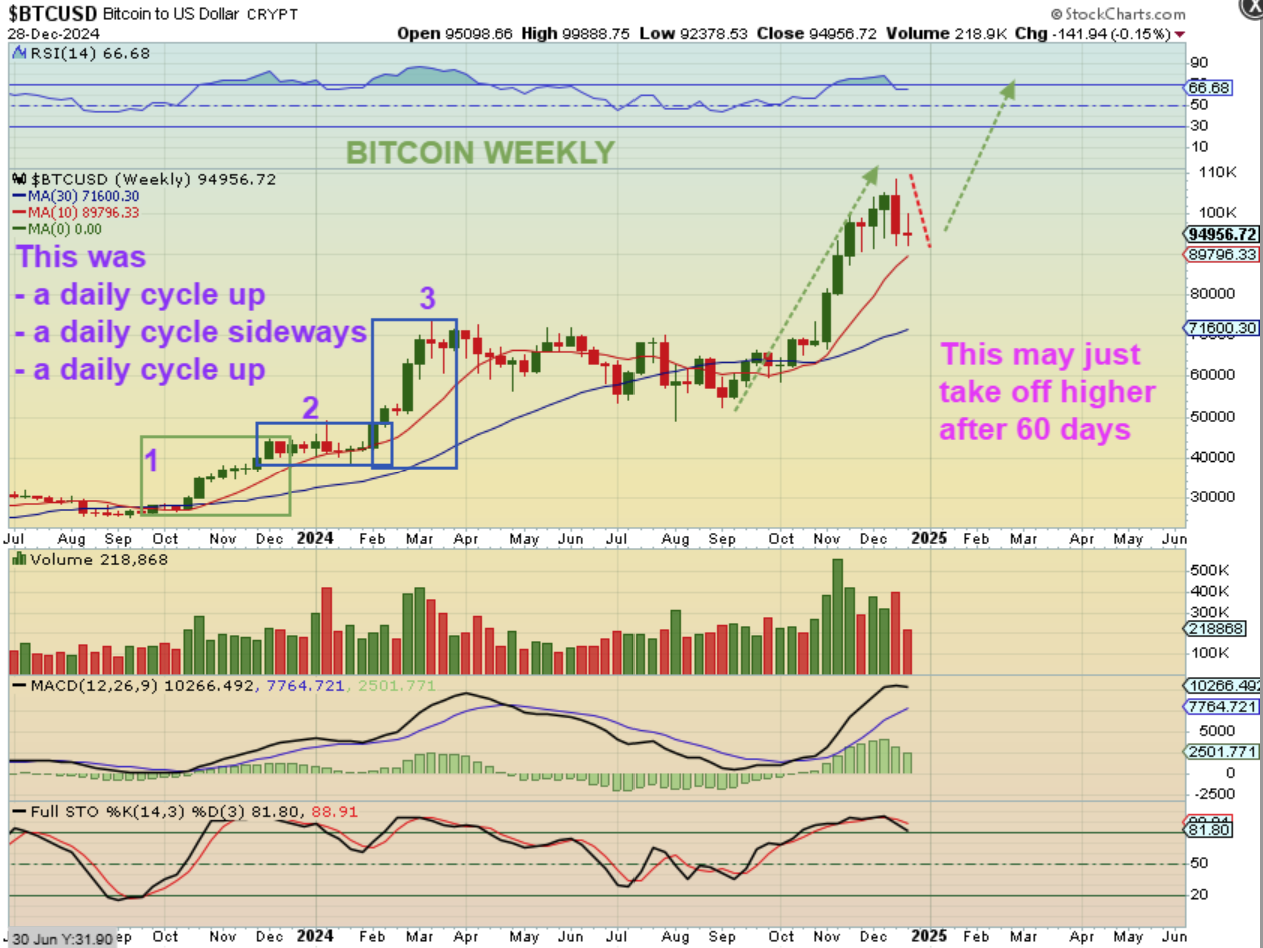
BITCOIN WEEKLY – I was looking at the 2023 rally into the year end and see that it is a little similar to what we see now.
I currently see a rally, and pause/consolidation, and a rally.
The question now is does Bitcoin pause that long (?), or just give us this current dip?
.
BITCOIN WEEKLY – So I just wanted to look at it as a close up. Again, this can repeat what it did then, but it also may not. So…
That rally in 2023 looked to be…
1. A daily cycle up,
2. A daily cycle sideways, and
3. A daily cycle higher. Each daily cycle is 60 days long.
– We currently have that strong rally higher, and now we either repat that pattern (2 months sideways(?), or we find a low near day 60 and rally one more time. So…
.
