Friday December 6th
.
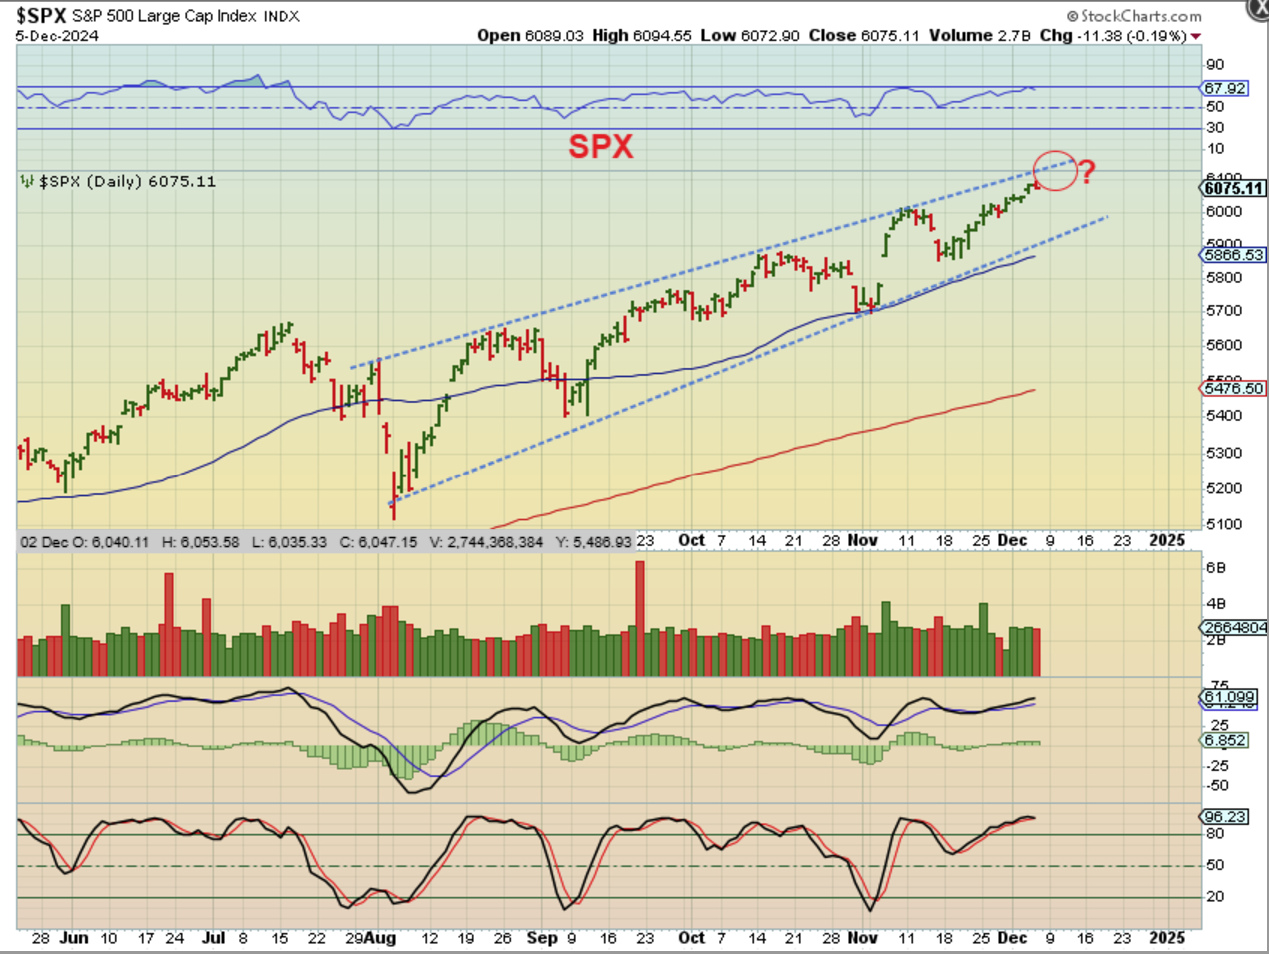
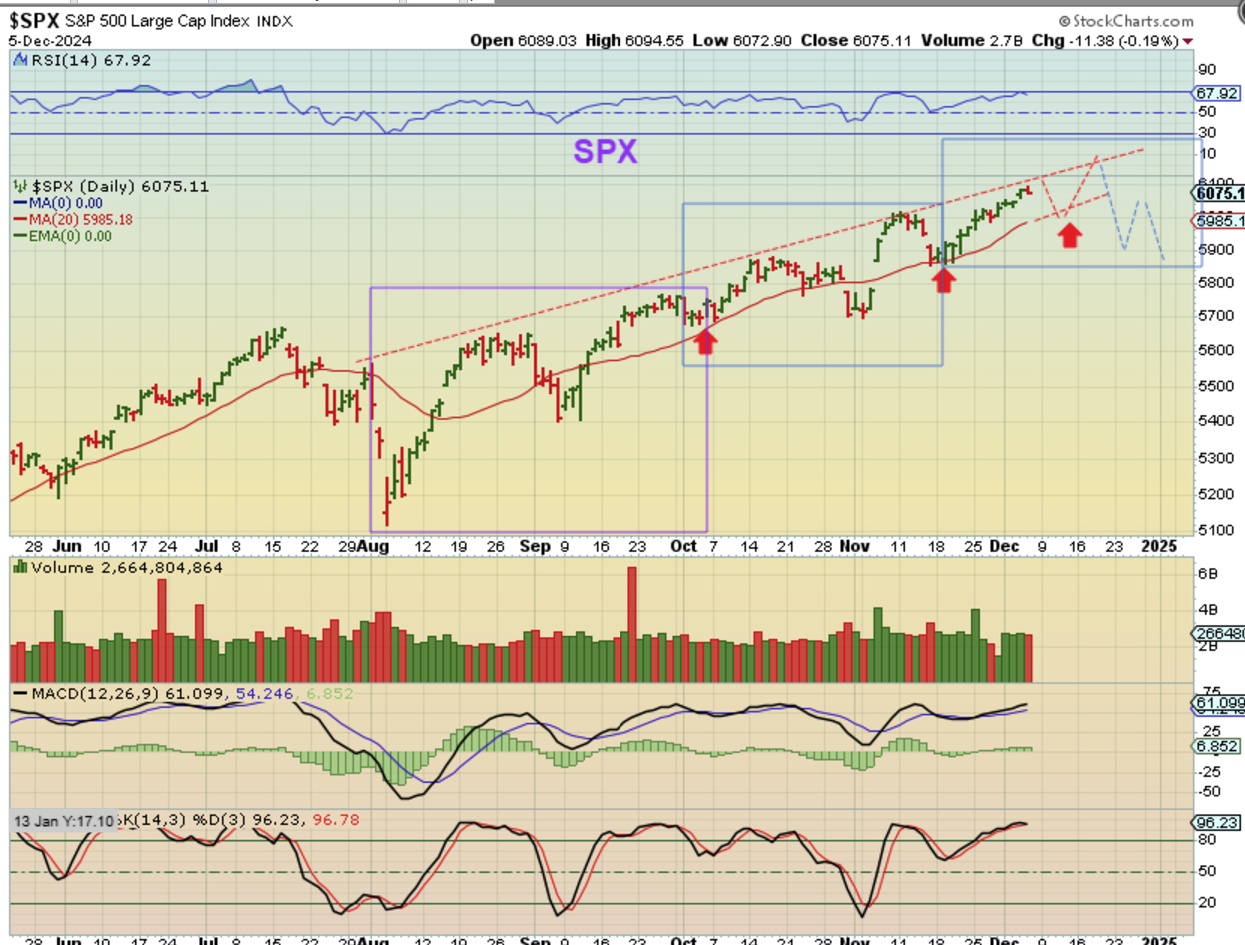
The SPX has been slowly chugging along higher, but it was slightly red on Thursday. It can continue chugging along higher along the upper blue trend line, or…
.
THE SPX could dip lower to the 20 ema again and then move higher. The SPX & NASDAQ remain bullishly set up.
.
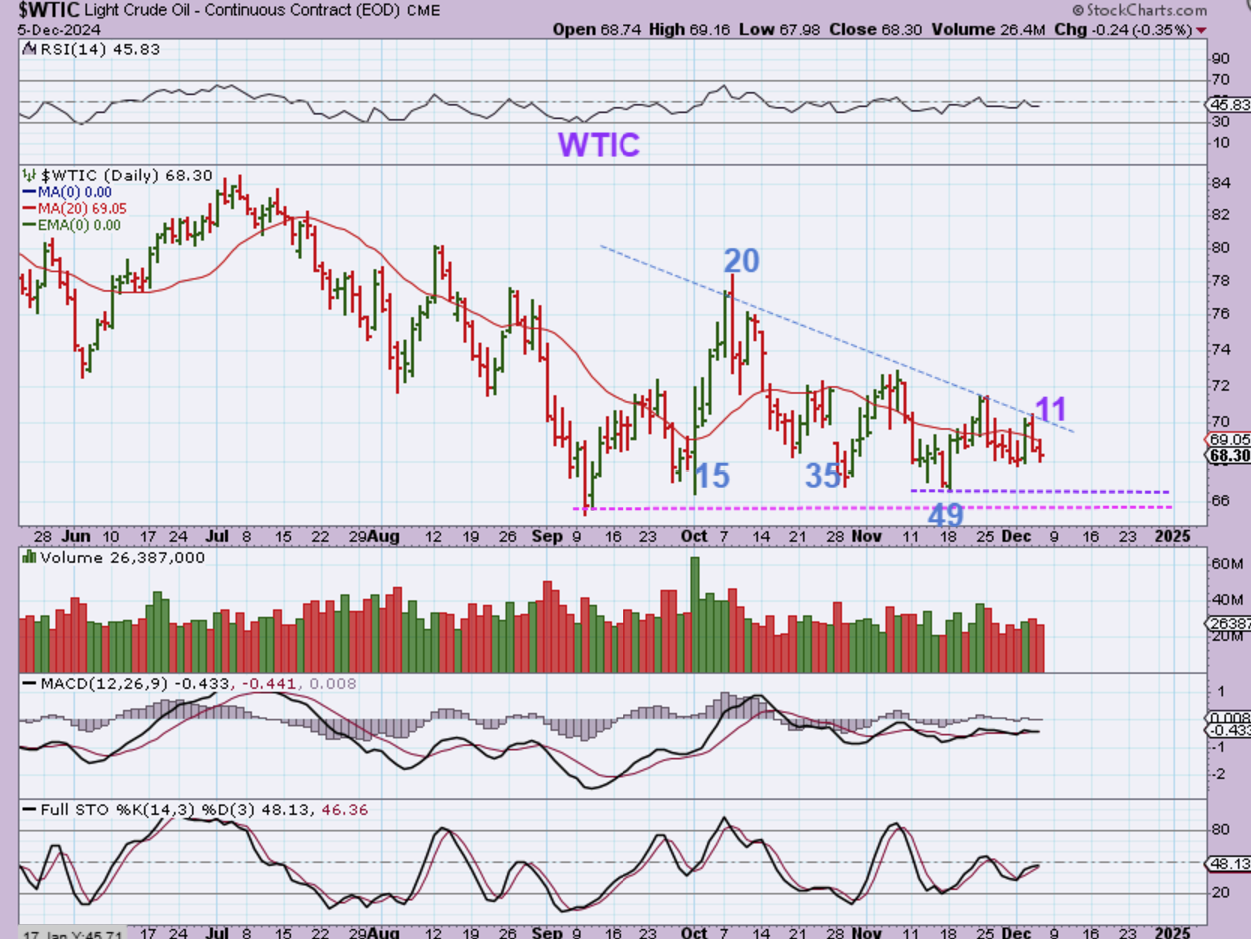
WTIC – Oil is very choppy, but I am thinking that it already has a dcl in place at day 49, and that would put us on day 12 yesterday. This has been too choppy to trade.
.
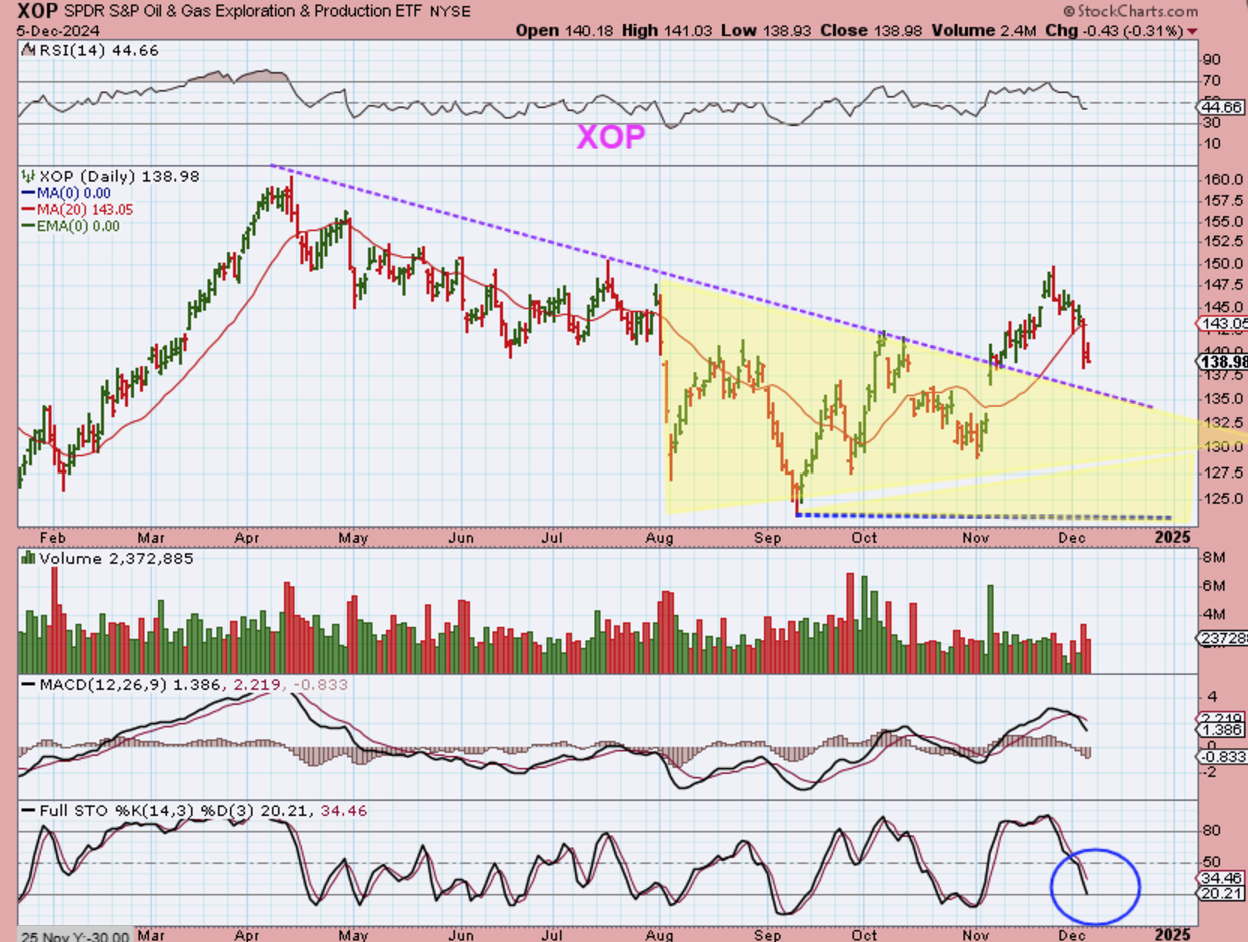
The Oil stocks and The XOP have been dipping lower, and it looks like the XOP is doing a back test of the break out. In the past it climbed above the 20 ema, but on Wednesday it lost that support. This looks like a dcl drop.
.
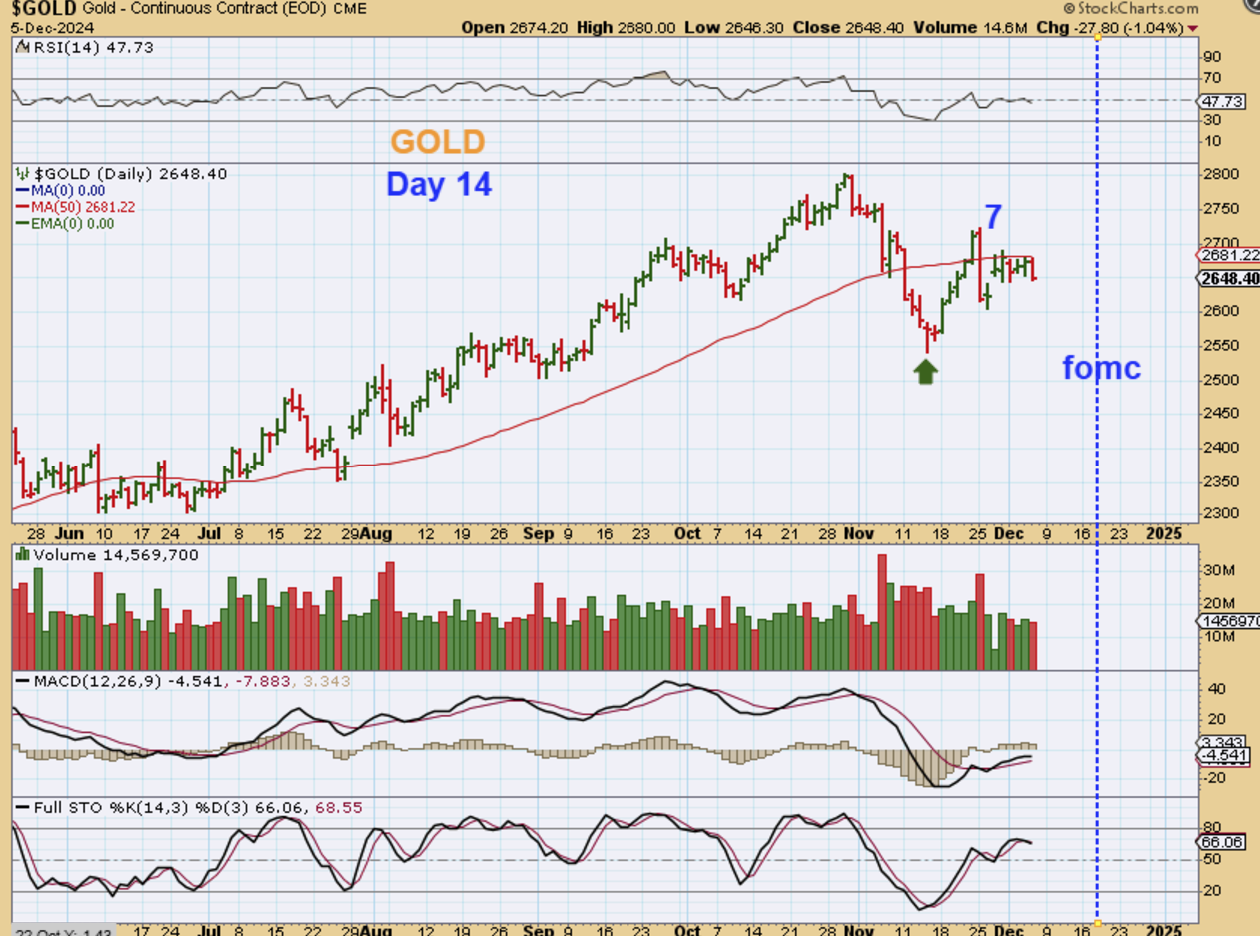
GOLD is on day 14 and it is normal that it has been unable to get above the 50sma, since it should be due for a drop into an ICL. A day 7 peak makes this L.T. and that also fits what we are expecting, with a possible low around the FOMC.
.
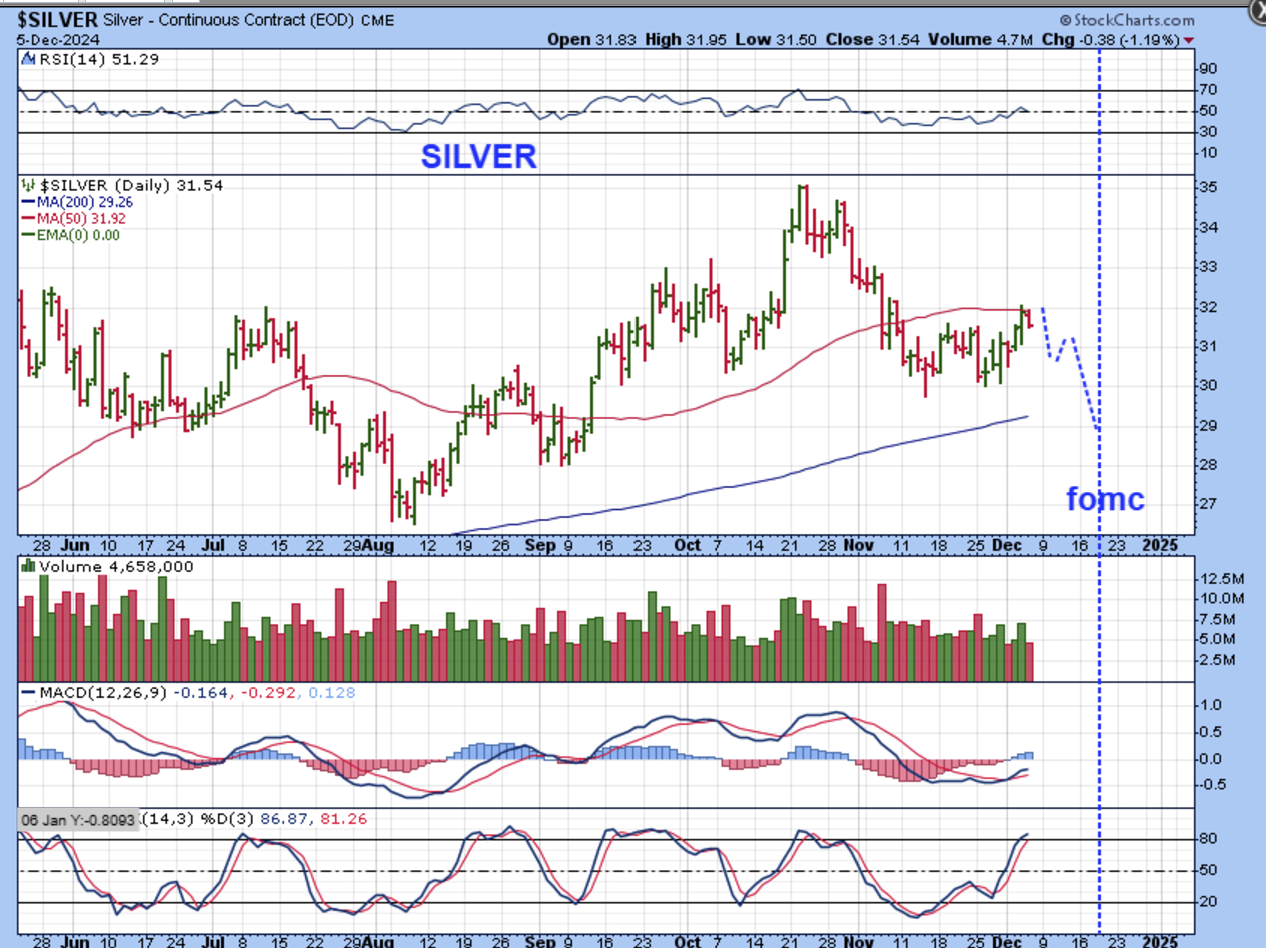
SILVER also tagged the 50sma and then dropped yesterday. I am guessing that the next low could come in sometime around the FOMC Meeting.
.
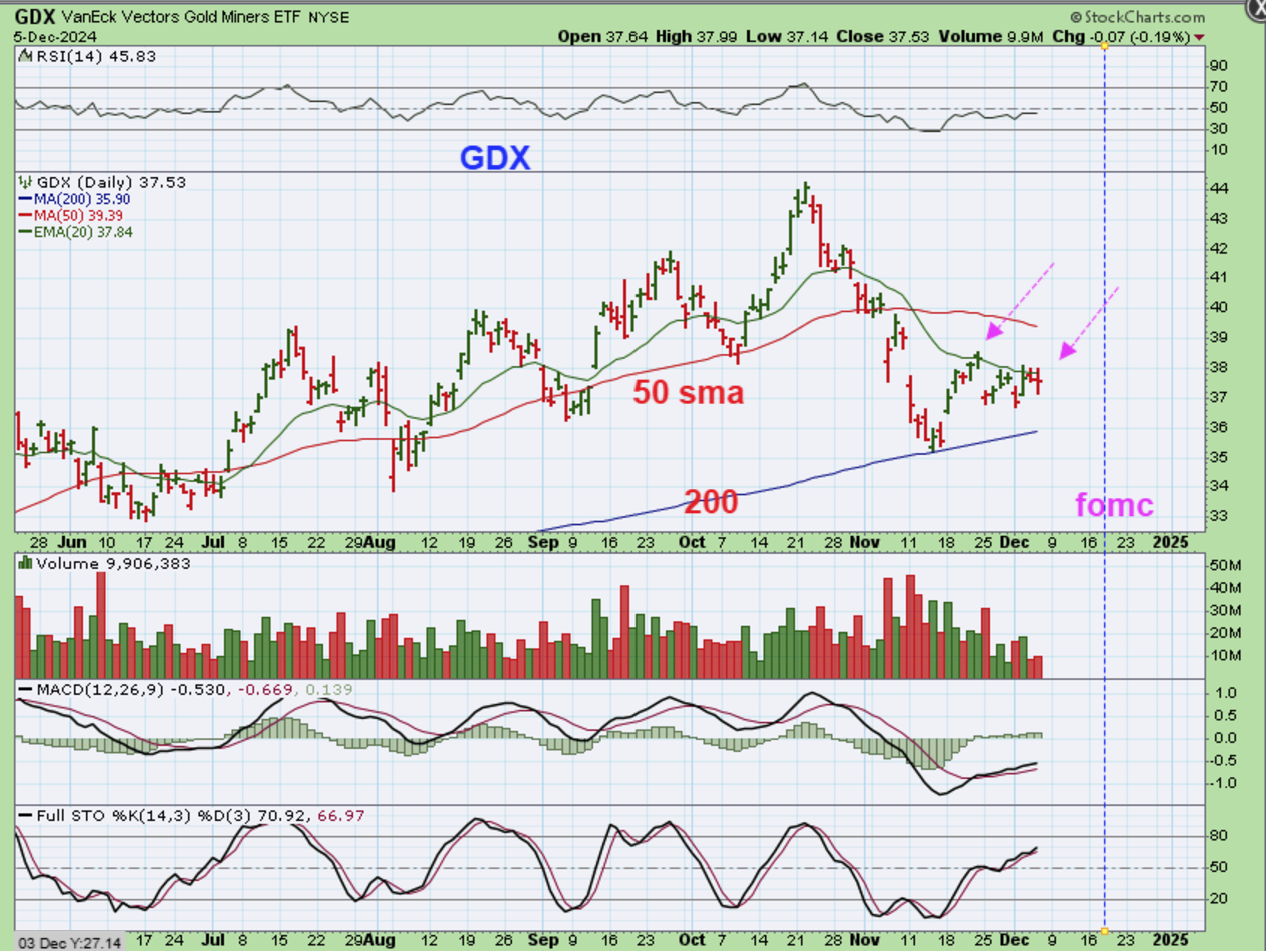
GDX has actually struggled at the 20ema and couldn’t even make it to the 50sma.
.
Yesterday Bitcoin broke out above $100,000 and ran to $104,000, but then it sold off and dropped quickly to $92,000, so we’ll need to discuss that below. If you do invest in this sector, you may be interested in what I found pertaining to that large Doji candle at $100,000 yesterday. I will be away for the morning, but I will be home in the afternoon. I am personally quite interested in seeing what Bitcoin & crypto stocks do from here.
.
Enjoy your Friday trading and enjoy your weekend!
.
~ALEX
.
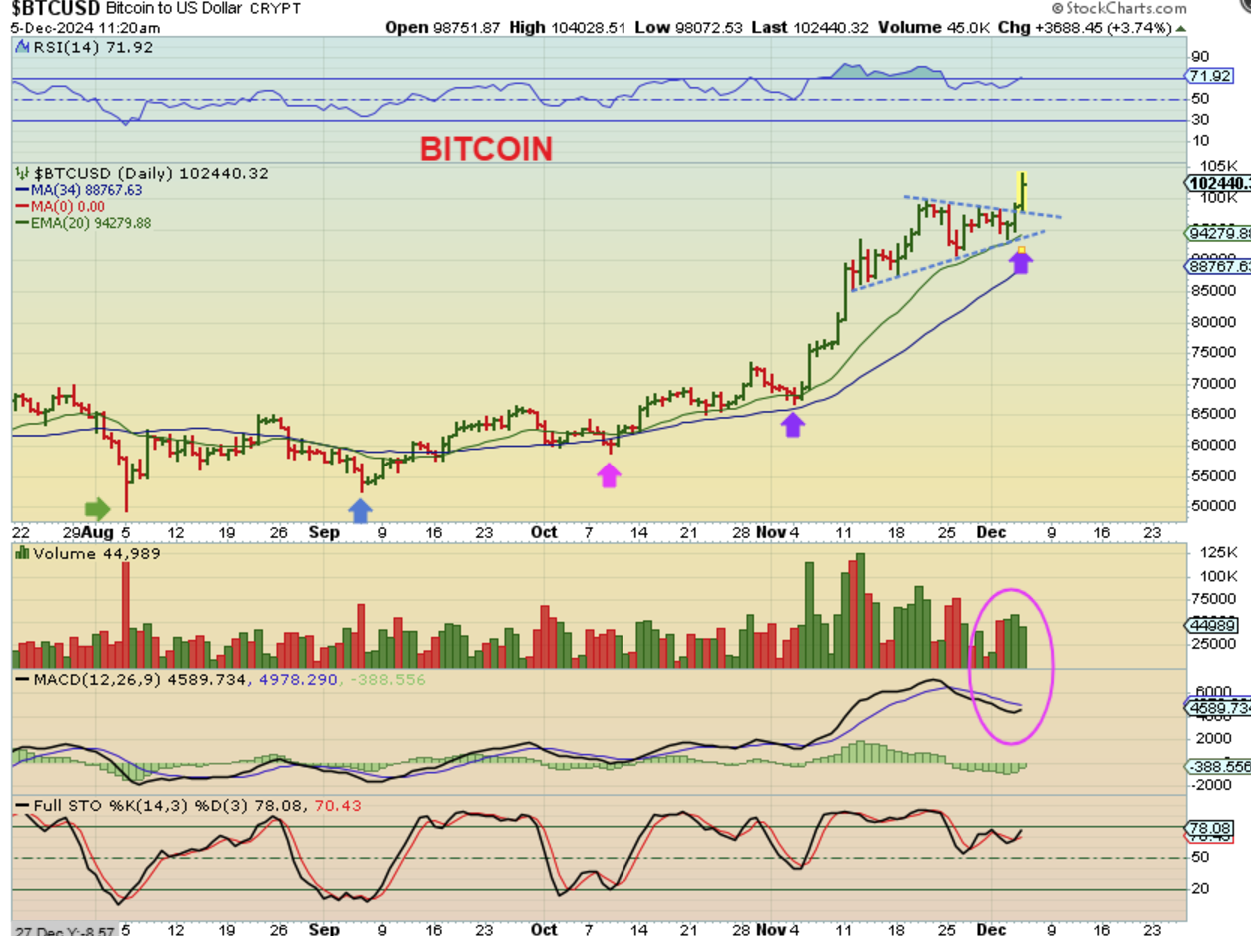
BITCOIN – This was an absolutely gorgeous chart of Bitcoin on Thursday morning. We saw Bitcoin break out from a triangle and run up to $104,000, and pre-market my Crypto basket of stocks was FLYING. Yay, right?
.
.
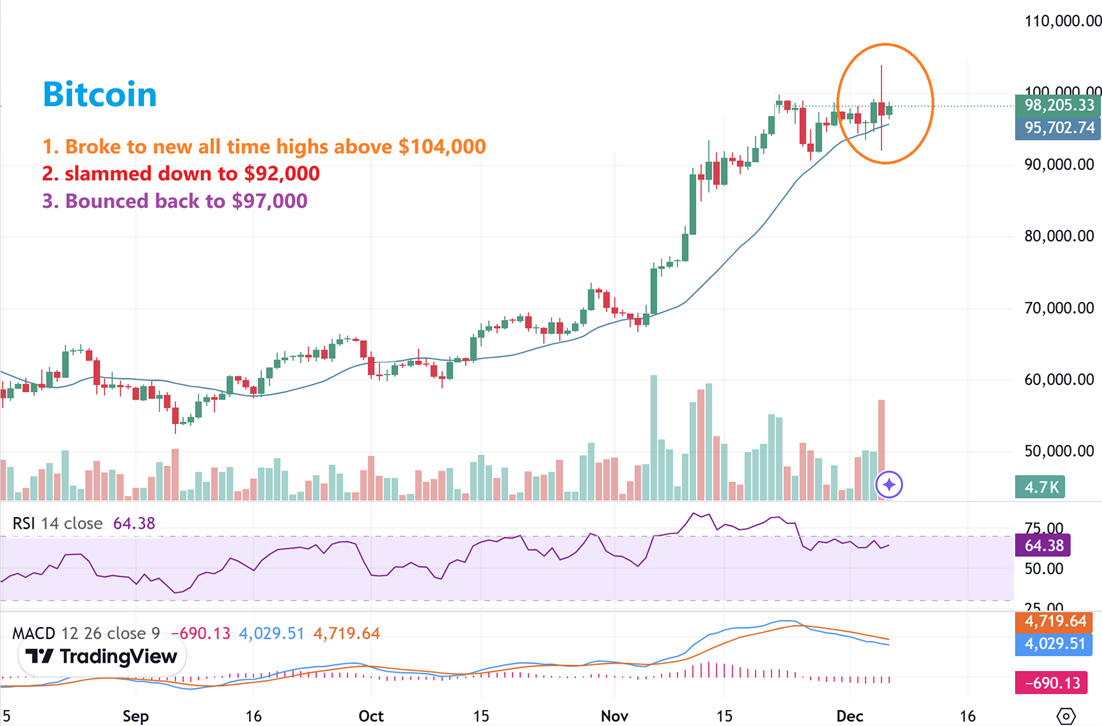
BITCOIN ran to $104,000, then dropped $12,000 & slammed down to $92,000 and my basket of Crypto stocks went from up 7-10% to down. They are not broken, but I might be (ugh). Well, the natural question is ….’now what?’ Isn’t that a Doji of indecision? Yes, it is, so…
.
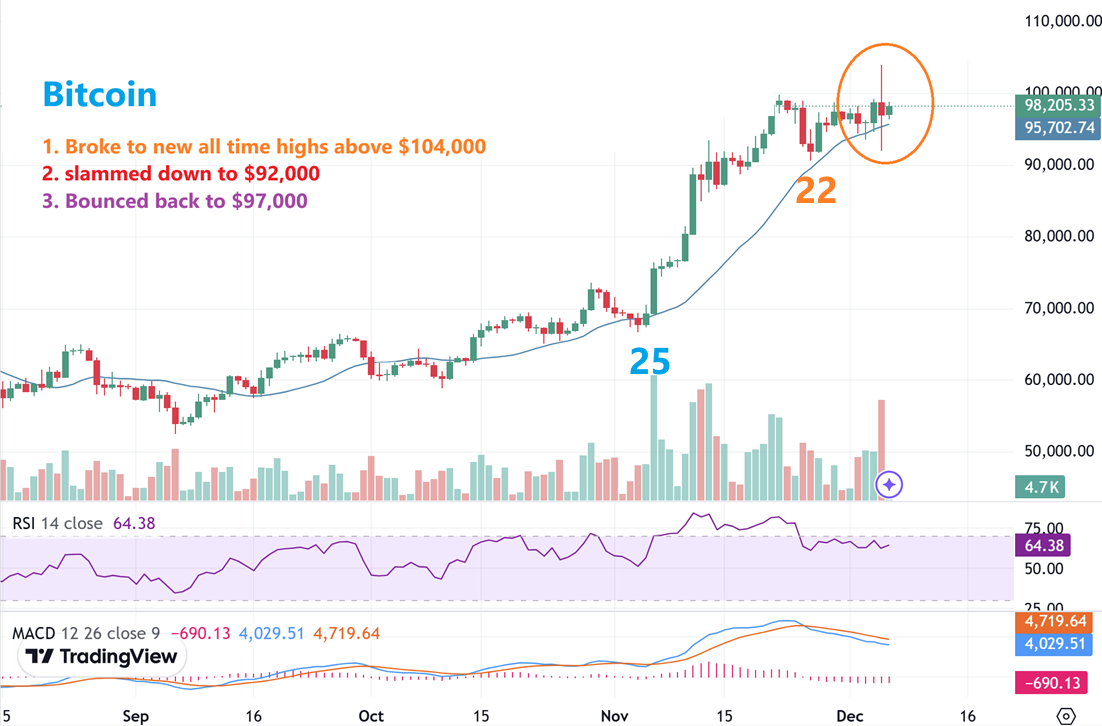
BITCOIN – You may recall that the cycle count had a day 22 low and I started to think yesterday that
1. Maybe we’re going to drop to a day 30+ low?
2. Right now that Doji candle would be day 31, so that COULD happen. If so…
3. Then we MIGHT get a new low in the next couple of days on day 34 or so. If so, the drop should be short lived.
.
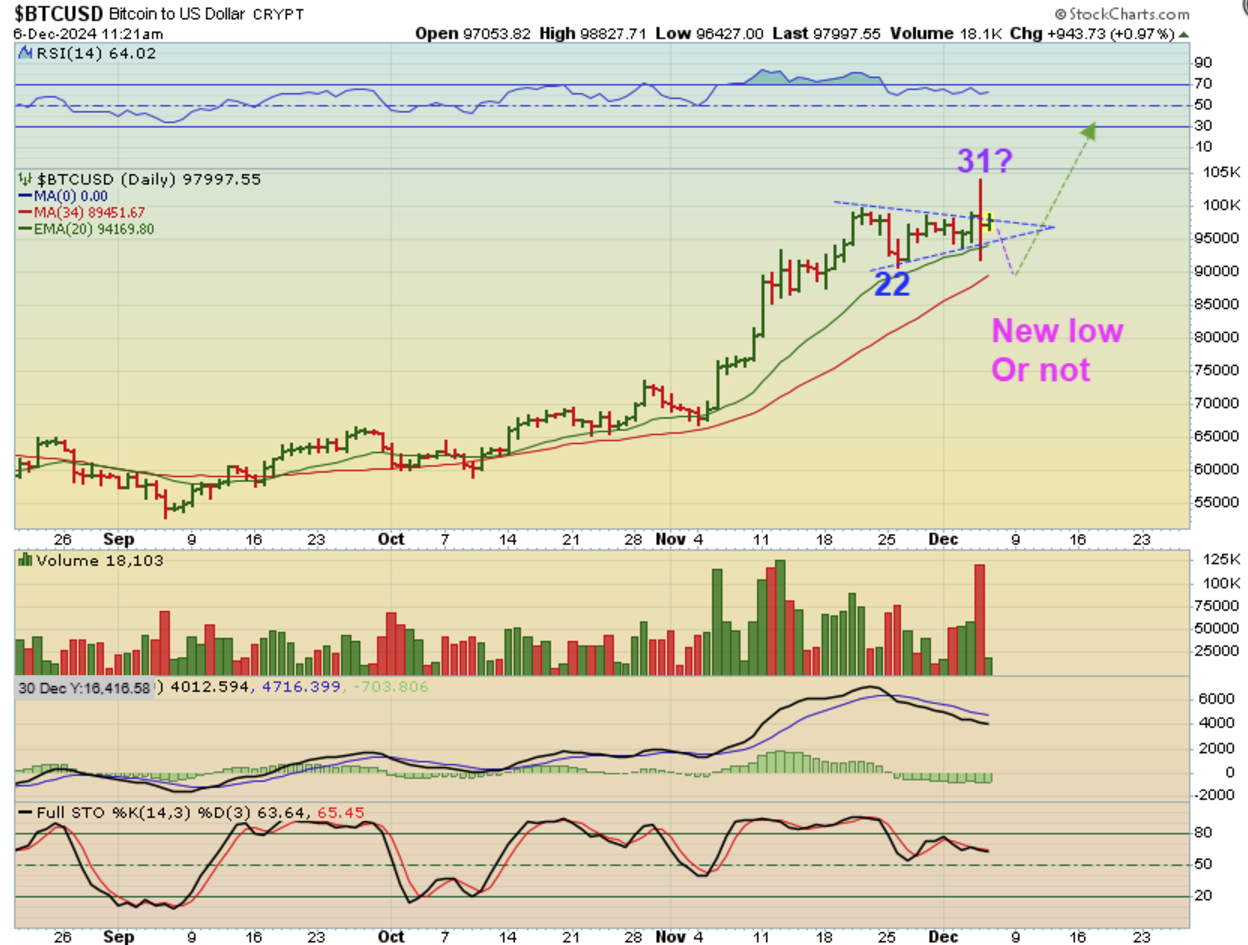
So let me draw that as a possibility here:
We MIGHT get a new low in the next couple of days on day 34 or so. If so, the drop should be short lived and may tag the 34 sma at $90,000.
.
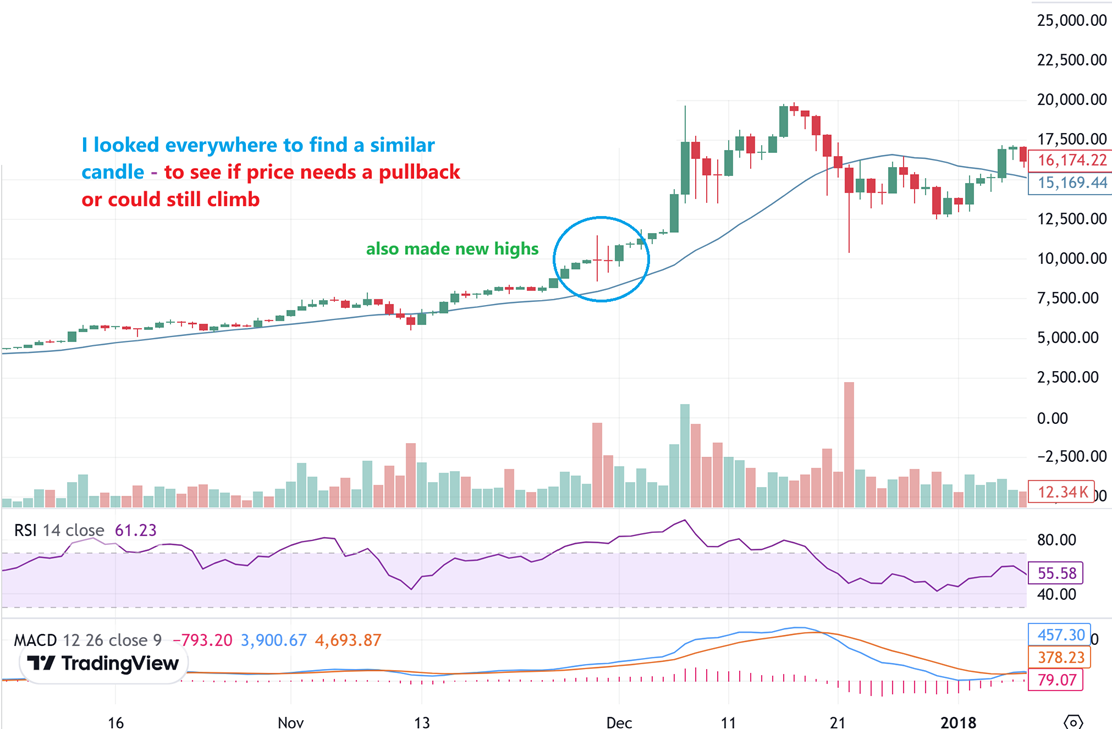
And then I went through my charts and searched for that Dojii candle in Bitcoins past. Did we ever see bitcoin at new highs and suddenly put in a large Doji? And if so, could it still climb higher? The answer was…
.
Yes, I found a large doji in BITCOIN that did allow price to climb higher. This was in 2017 and Bitcoin was running from $3000 to $20,000, and it flipped us a Doji at $10,000. Yes, a nice round number like $10,000 ( & now a nice round number like $100,000?). What this told me was that we have seen this before and it didn’t kill the run higher, but it did stall for 2 days.
.
A QUICK LOOK AT A COUPLE OF CRYPTO STOCKS:
.
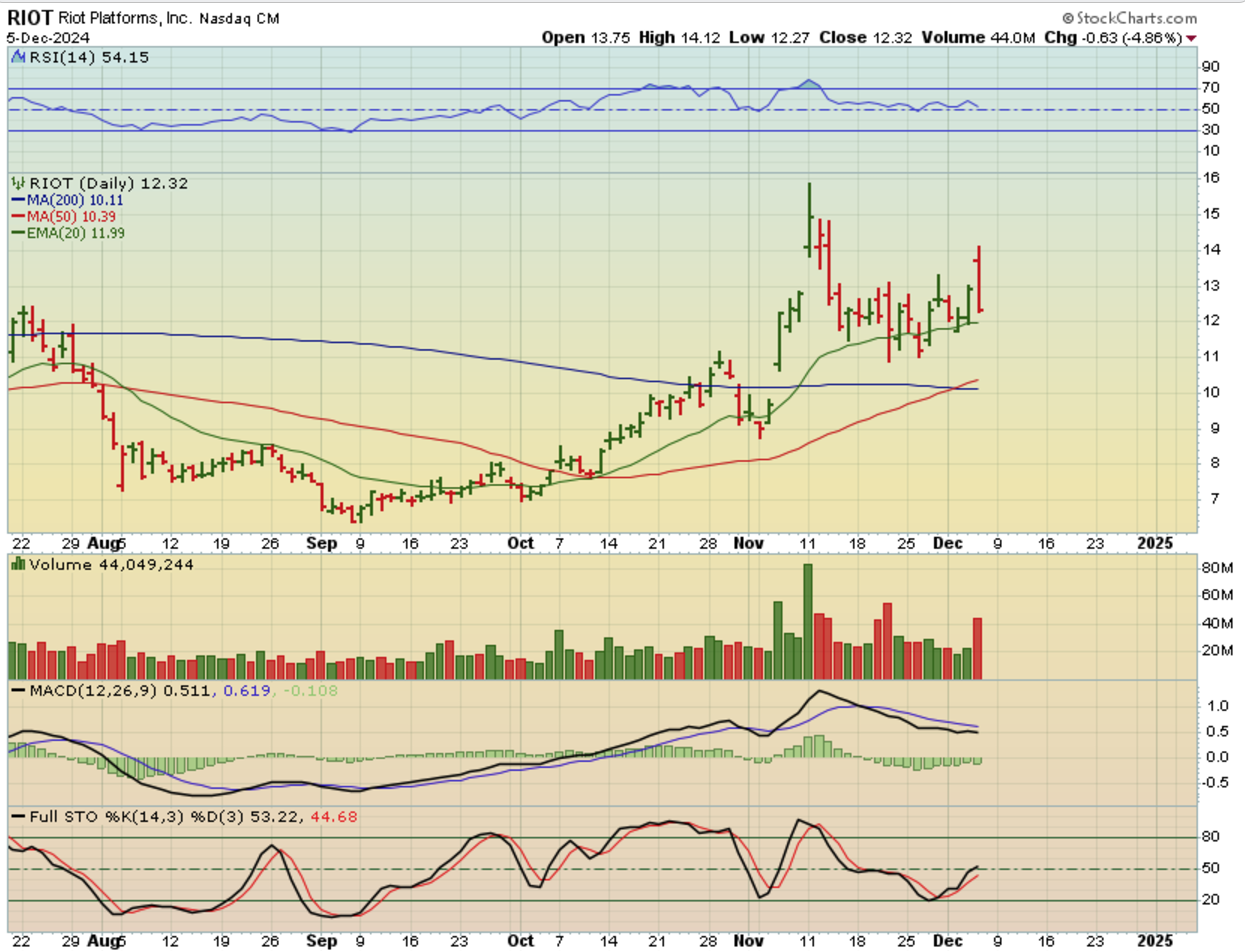
RIOT isn’t a ‘broken’ chart, but a 2 dollar drop from above $14 to $12.27 feels like it was. If you owned 1000 shares, that was a $2000 drop from highs to low. If you held 2000 shares, you saw a $4000 drop from highs to lows. Now multiply that by 5 stocks in your basket and it was a very green day to a very red day, however….The illusion is that we lost a lot of money, but really it gapped open quite a bit and was only down 63 cents at the end of the day.
.
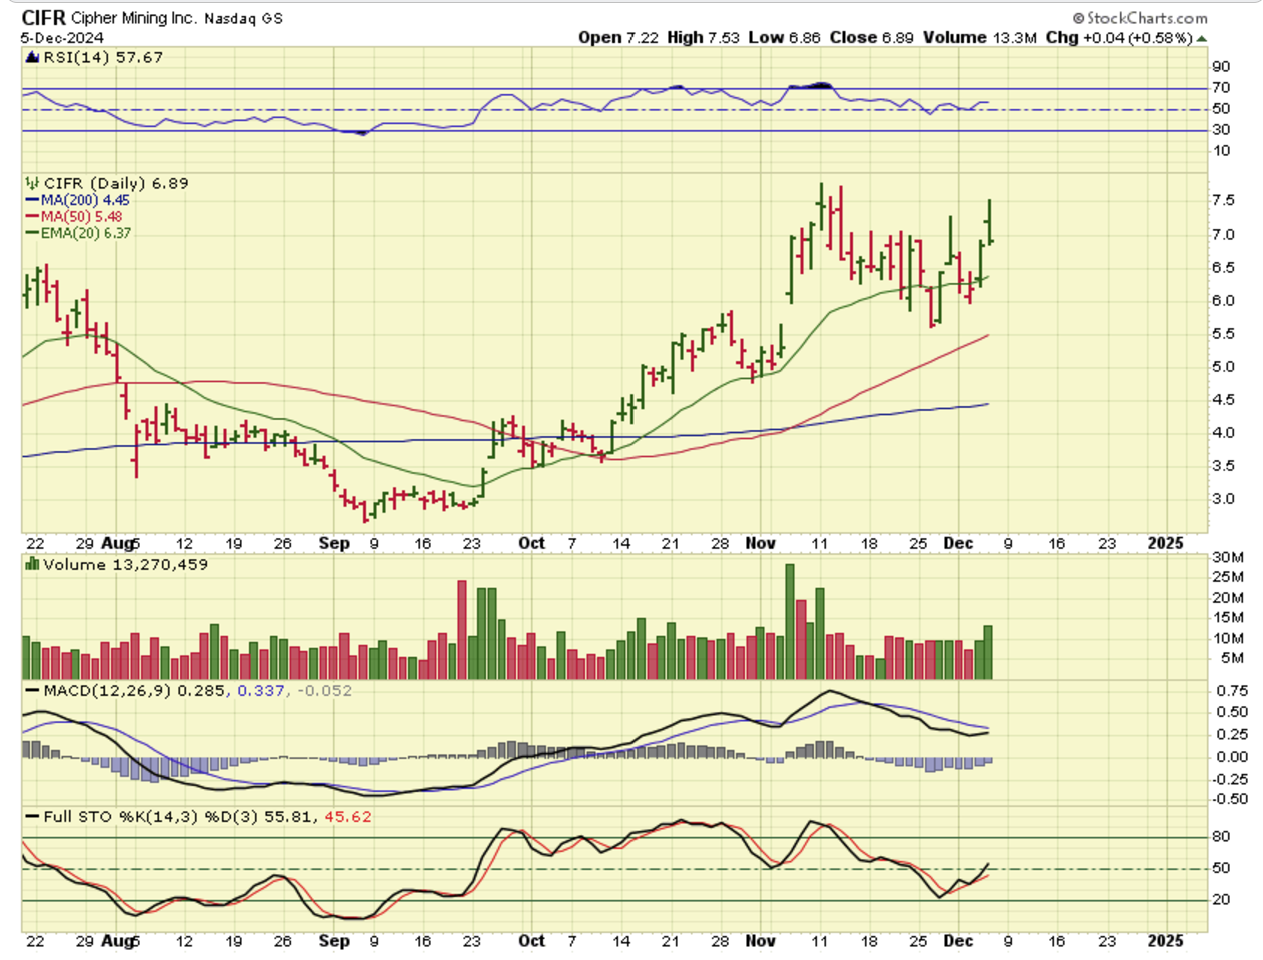
CIFR was up 4 cents, but it also Popped and dropped, so now their price action likely depends on what Bitcoin does going forward.