December 7 Weekend Report
To start off, I just wanted to look at the long-term daily charts and see what we have there.
.
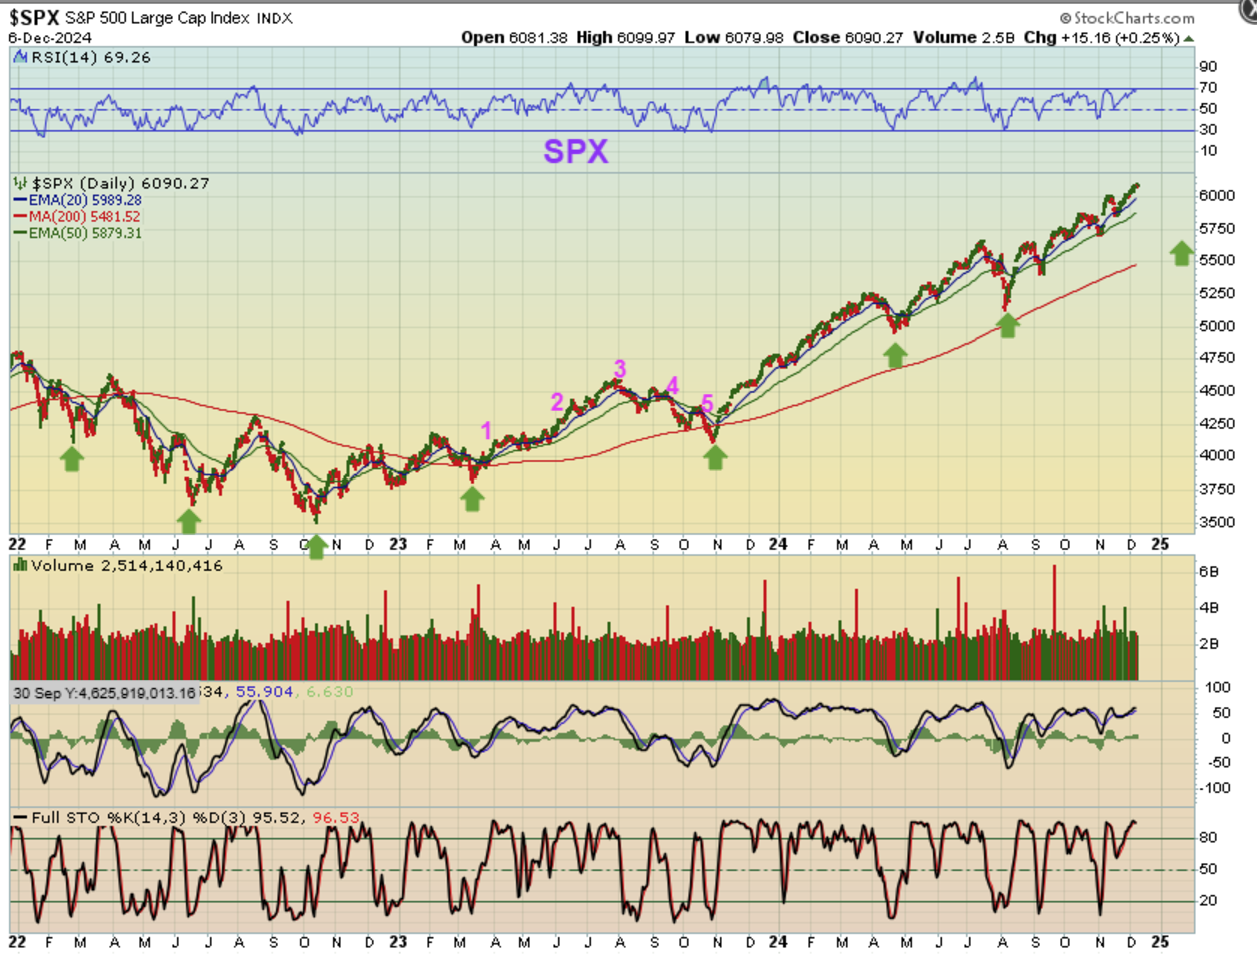
SPX DAILY – The green arrows should represent ICLs. On one of them I pointed out the clearer 5 daily cycles, so that you can see how it might play out (but the other Intermediate Runs like Oct 2023 to April 2024 were strong and didn’t dip as clearly). With this current run, we are in the 3rd daily cycle and that is often when it will peak. The 3rd or maybe the 4th. So we are on day 14 of the 3rd daily cycle, which may have 35 or so days.
.
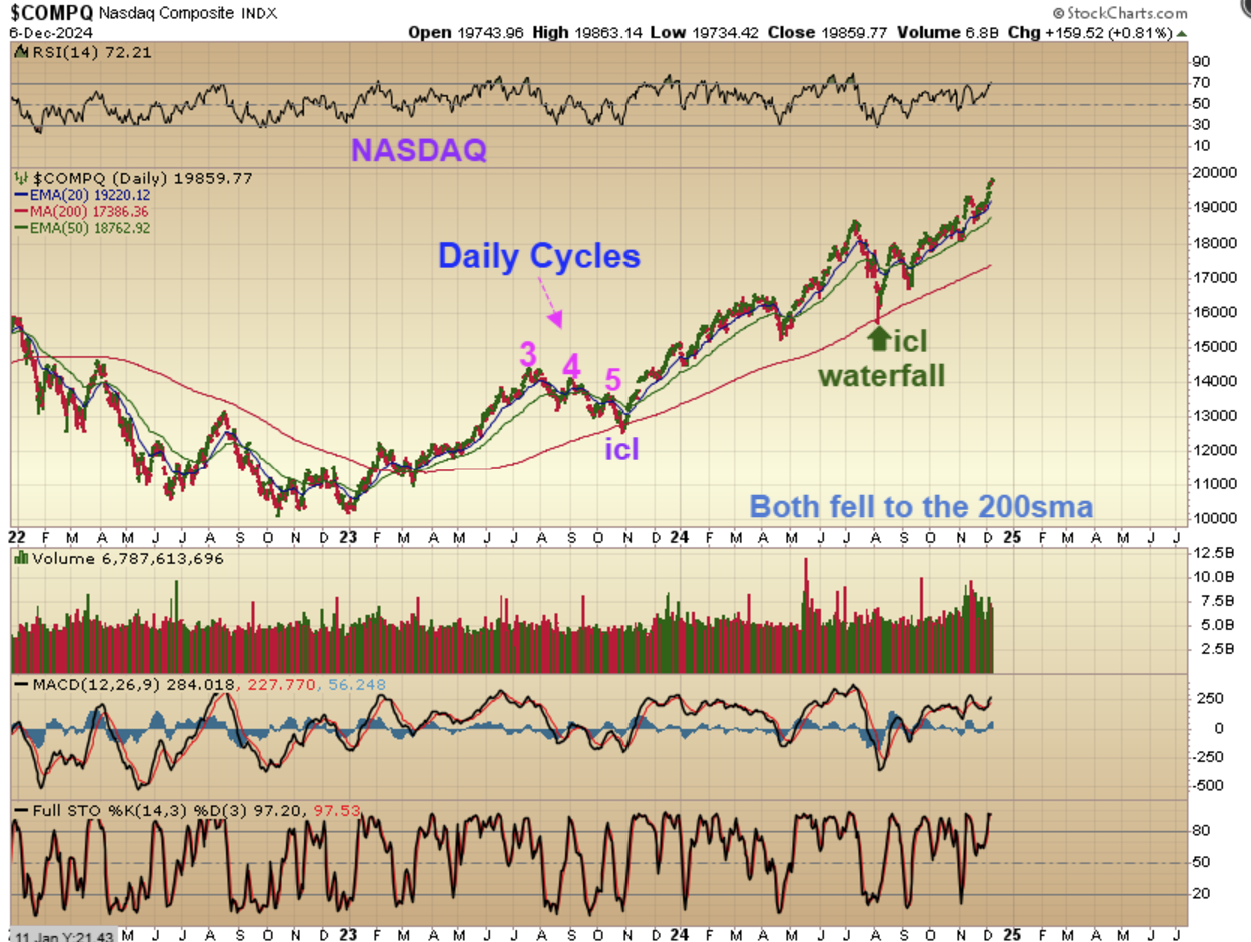
NASDAQ DAILY – The NASDAQ is also having a nice run after a bit of a choppier start out of that ICL. Notice that the last 2 ICLs dropped to the 200 sma and that was where we saw a good buying opportunity, so if that repeats in perhaps the spring of 2025, we can buy in that area. So the DOW, SPX, NASDAQ, and even the IWM are at all time highs. But the SOXX? The SOXX has had me wondering…
.
SOXX DAILY –
1. The SOXX is in a failed daily cycle and
2. It also broke and closed below the 50 & 200sma.
3. The SOXX has been unable to get back above those moving averages and it is also trapped under the downtrend line AND…
4. We are in the 3rd daily cycle, but it peaked in the 2nd daily cycle and gave us a H&S Pattern. This is not likely to recover during this intermediate cycle and therefore could have some serious downside in the 4th daily cycle. This may sell off sharply after the Fed Mtg or the start of 2025.
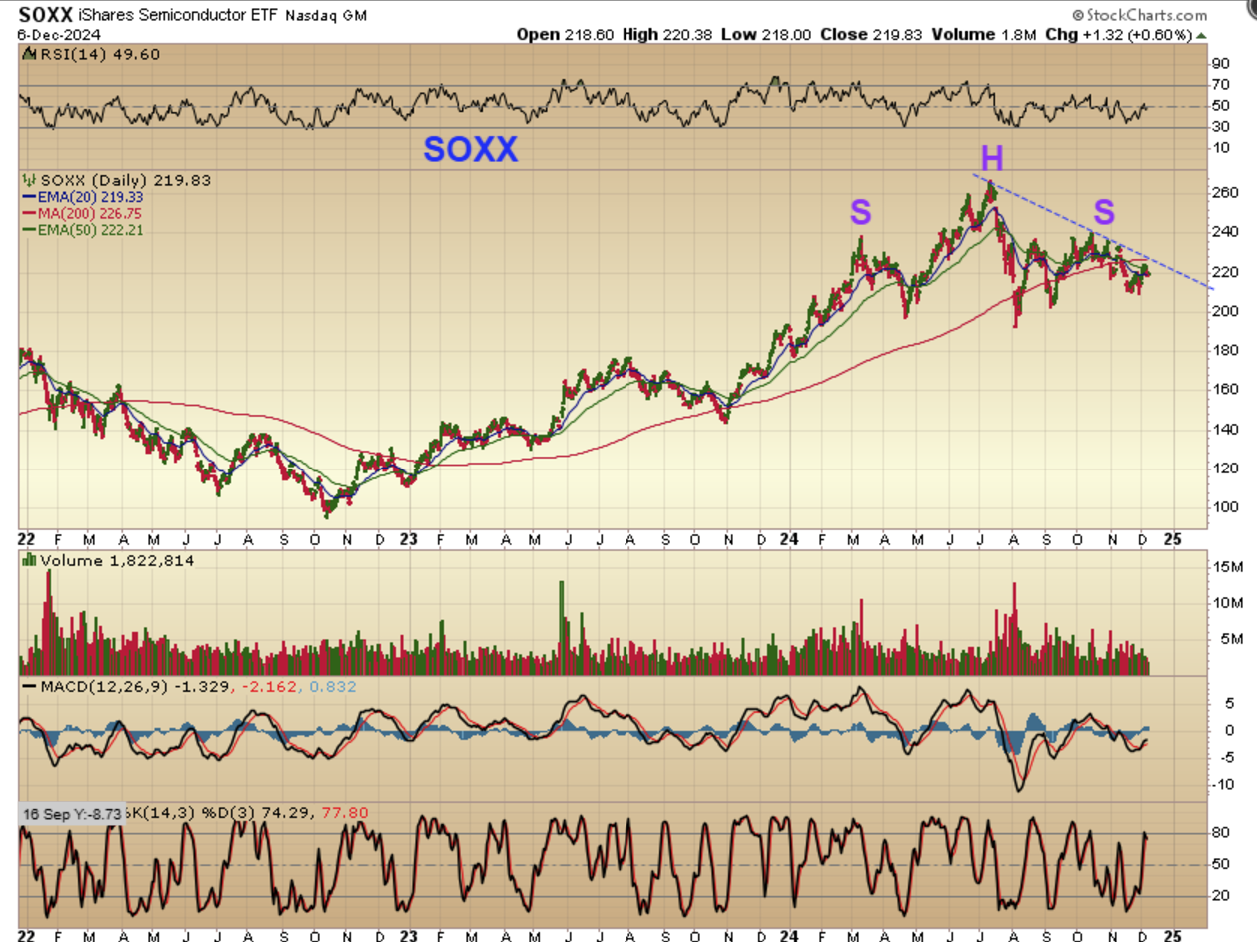
The SOXX may sell off sharply after the Fed Mtg or the start of 2025. WILL IT DRAG THE OTHERS DOWN MORE THAN USUAL? Well, they will be due for a dip into their ICLs too, but so far they are at all-time highs, so it is something that I’ll be watching for. I may buy SOXS as we drop into the end of the 3rd daily cycle, or maybe I’ll wait for the bounce out of that dcl and short the 4th daily cycle.
.
Sidenote: When the Transports drop ($TRAN) and the DJIA rises, that is called the ‘Dow Theory’ and it calls for a pullback soon. That is also happening this week.
.
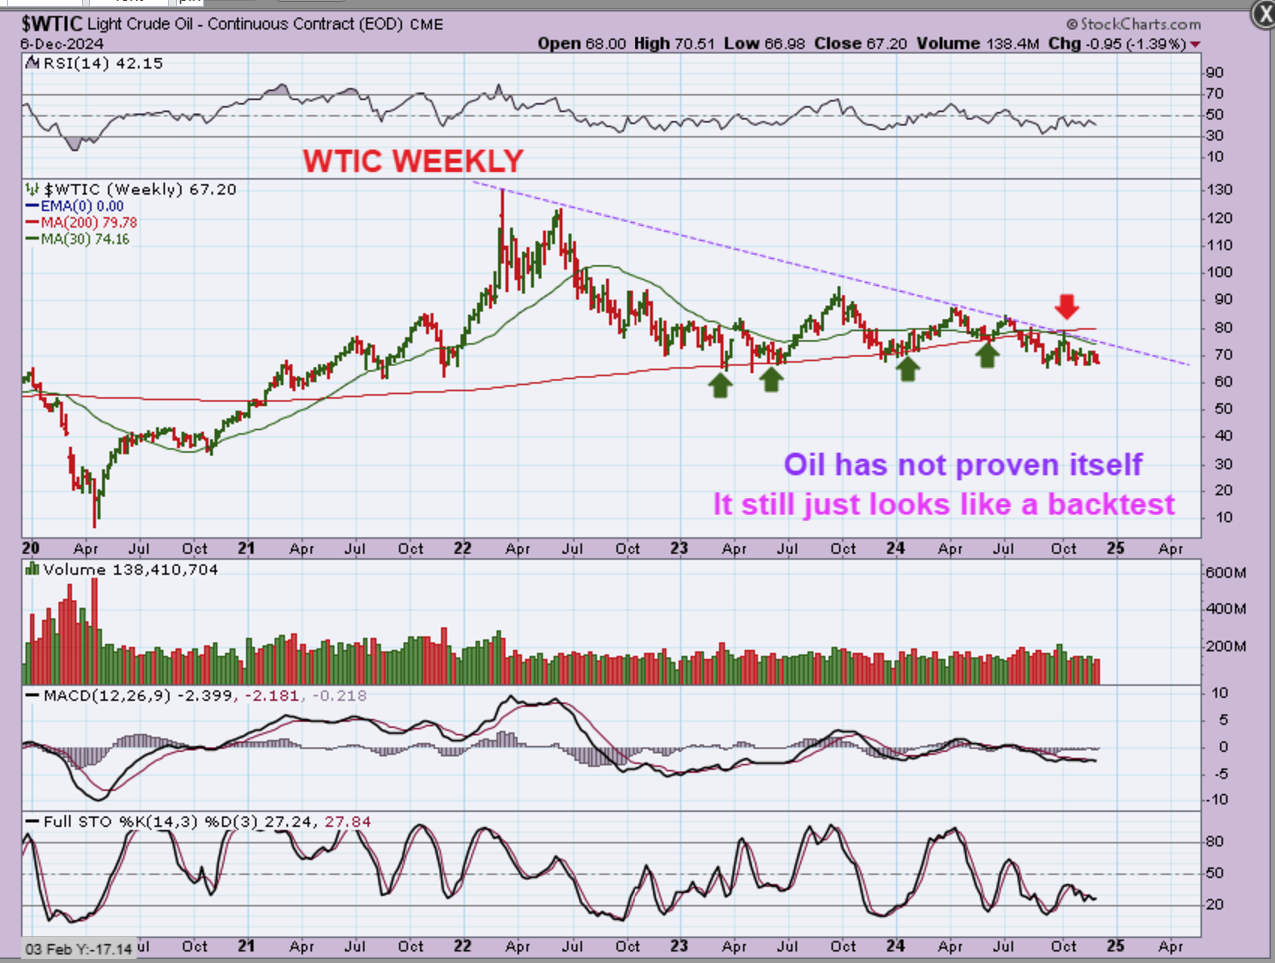
WTIC WEEKLY – I know that short term Oil looks to have bottomed, but the first daily cycle has simply chopped sideways, so now when I look at the big picture and see that, I see that there has been no improvement in Oil. In fact, I see a break below the support of the red 200 week ma, and this daily cycle was simply a back-test of that break down (Red arrow). So…
.
So until Oil breaks above the purple downtrend or gets back above the 200week ma, it is questionable, right? It could even just chop sideways again for another daily cycle and then sell off for a 3rd & 4th. So when I saw this current set up, I wondered, “What about those Oil stocks that appeared to rally in this daily cycle while oil chopped sideways? Are they leading the way higher or what?”
.
So when I saw that current set up in Oil as having no improvement, I wondered, “What about those Oil stocks that appeared to rally in this daily cycle while oil chopped sideways? Are they leading the way?”
.
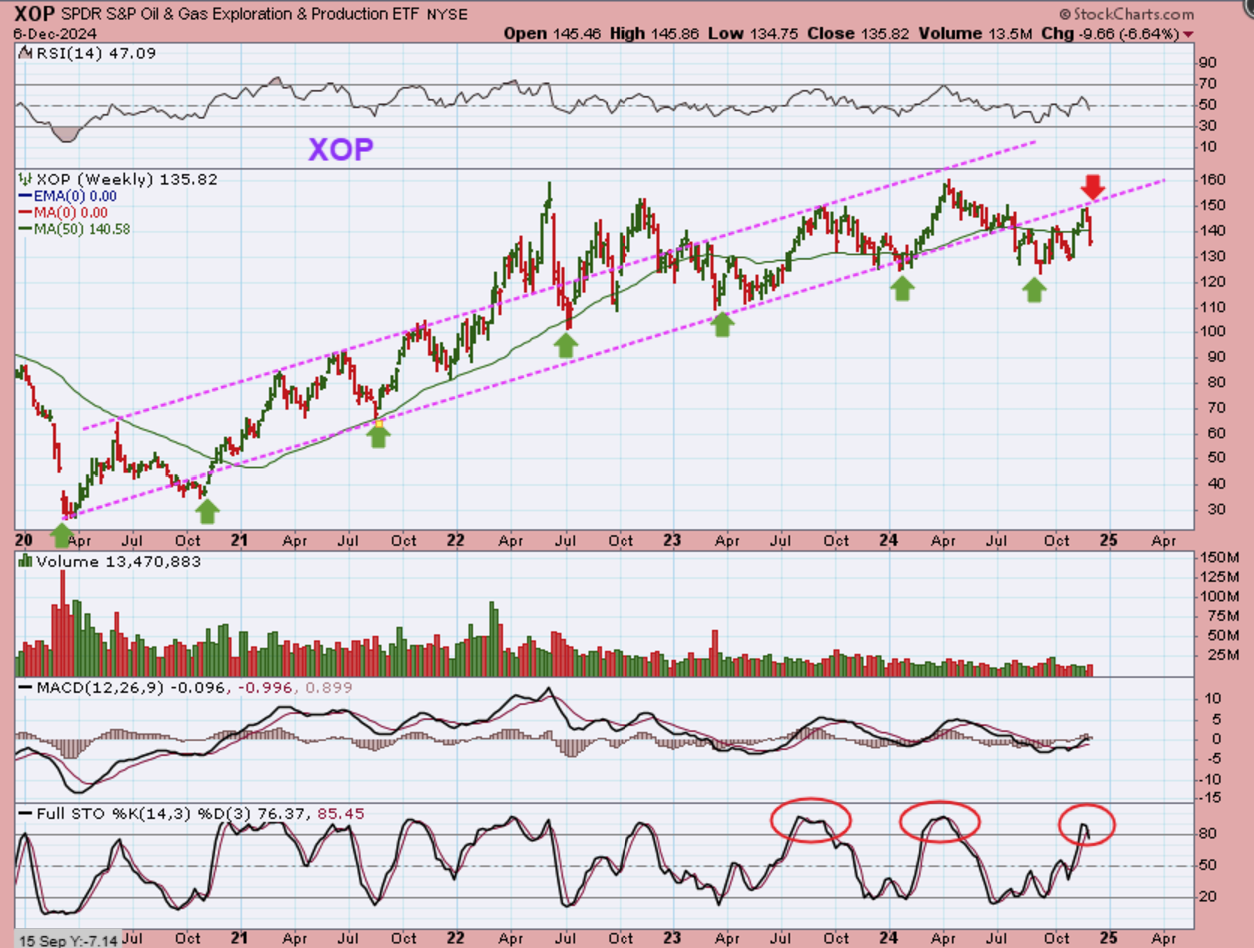
XOP WEEKLY -Uh Oh! It seems that they only rallied up to back test their last break down too. Add to that the 6.64% drop last week after the back test and we now have Oil looking like a breakdown that is chopping sideways after a back-test, and Oil stocks that rallied up to a back test, but couldn’t recover yet either. LET ME NOW SHOW YOU WHAT TO WATCH FOR ON THE XOP…
.
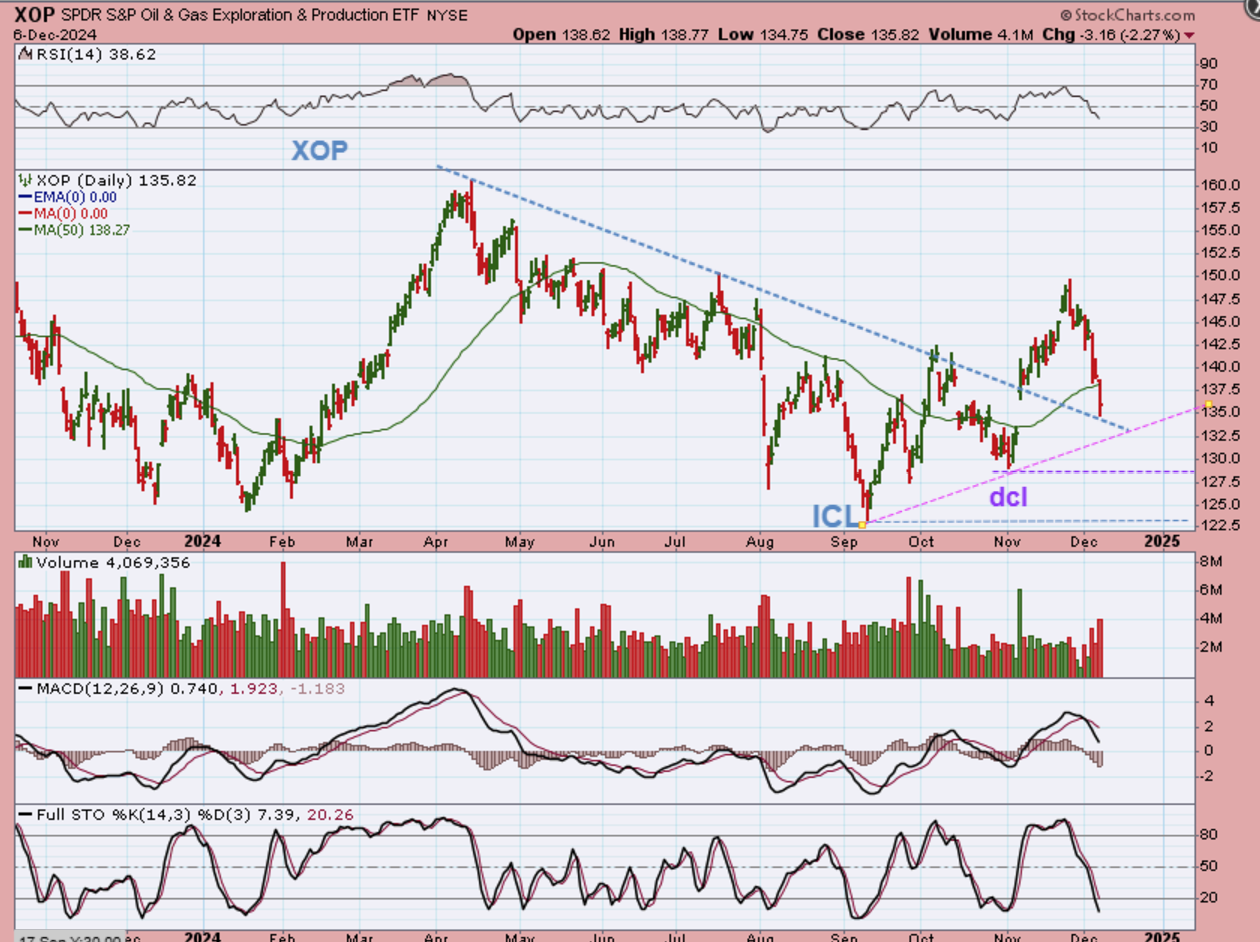
LET ME NOW SHOW YOU WHAT TO WATCH FOR ON THE XOP Using The Daily Chart:
Right now this was a decent rally, and it looks like a 2nd daily cycle for the XOP. It back-tested the breakout, so this may be o.k., but it Cannot remain healthy if it breaks below that dcl. It lost the 50sma and that is bad news if it can’t recover quickly, so if this is just a back test of the trendline and recovery, that is good. If it remains weak down here while Oil chops around, this could threaten to break below that dcl, and then the weekly chart tells the real story (see above weekly chart).
.
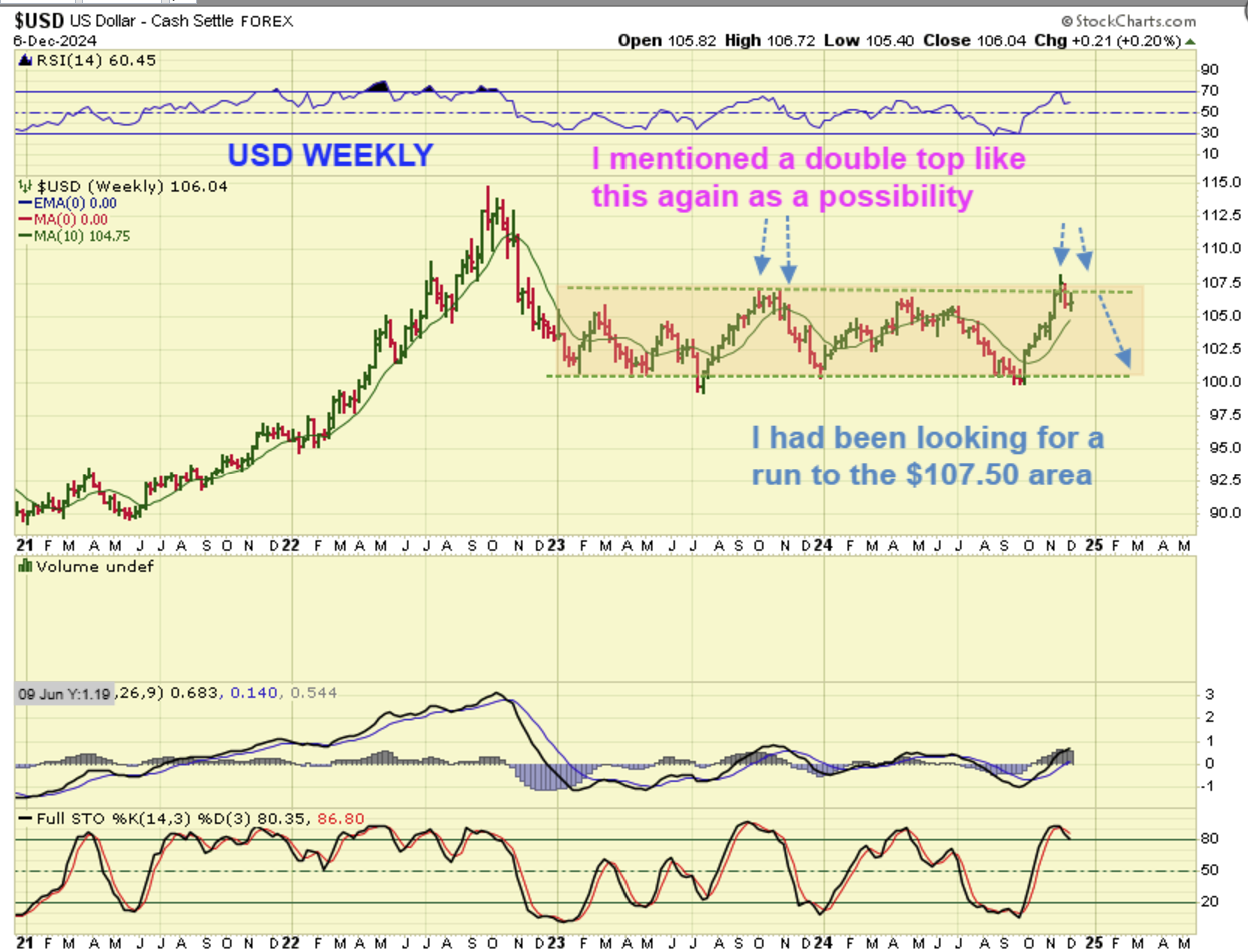
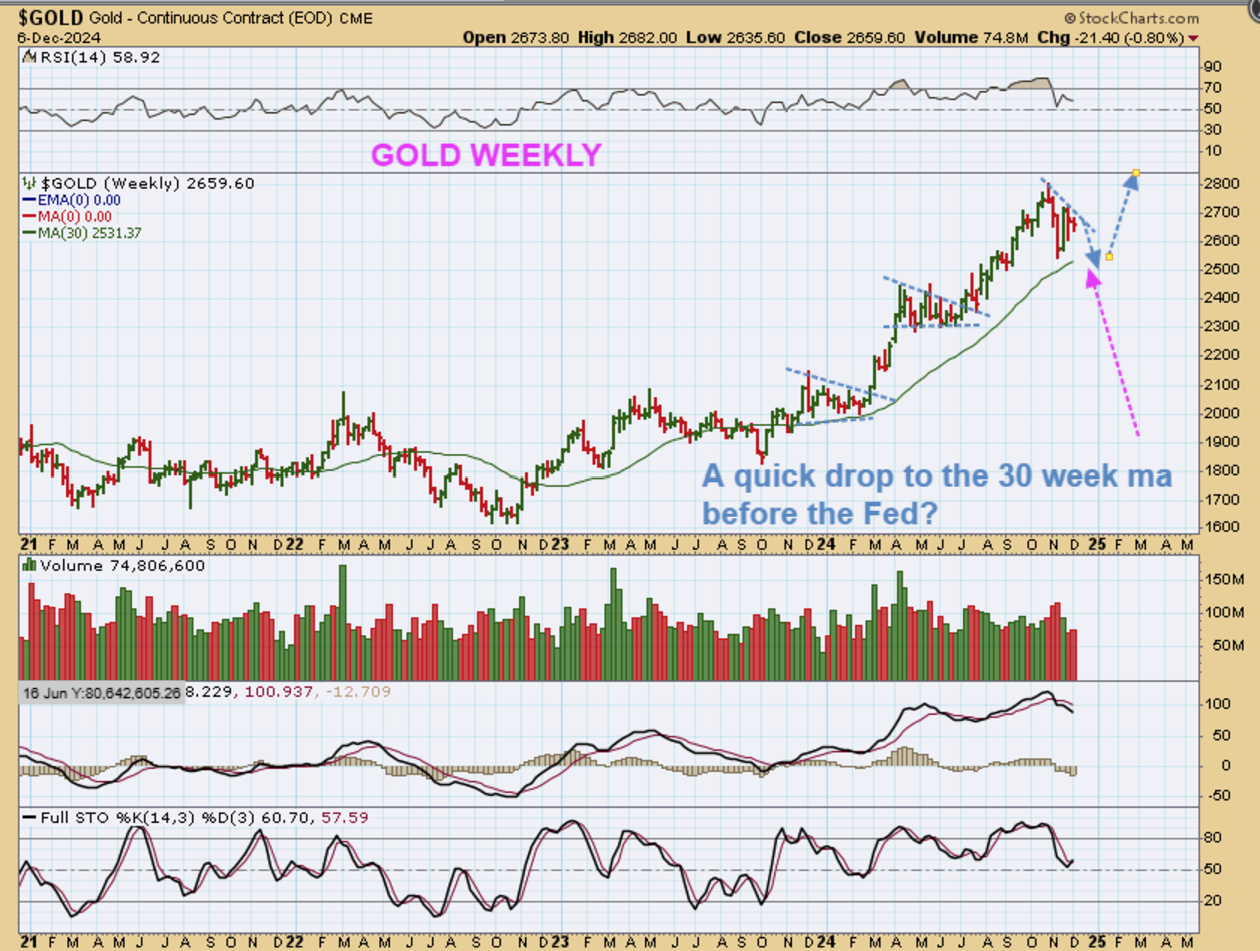
USD WEEKLY – The USD ran to that $107.50 area ( a little higher) and then dropped down. It does have ‘time’ to dip lower and then double top, and that would fit Gold rallying higher after an ICL. It was a strong run in the USD though, but it also did NOT affect Golds rally as it moved higher.
.
GOLD WEEKLY – One more drop into the FED MTG for an ICL? Gold is on day 16 on Spot, so it could bottom around the Fed Mtg on Dec 18.
.
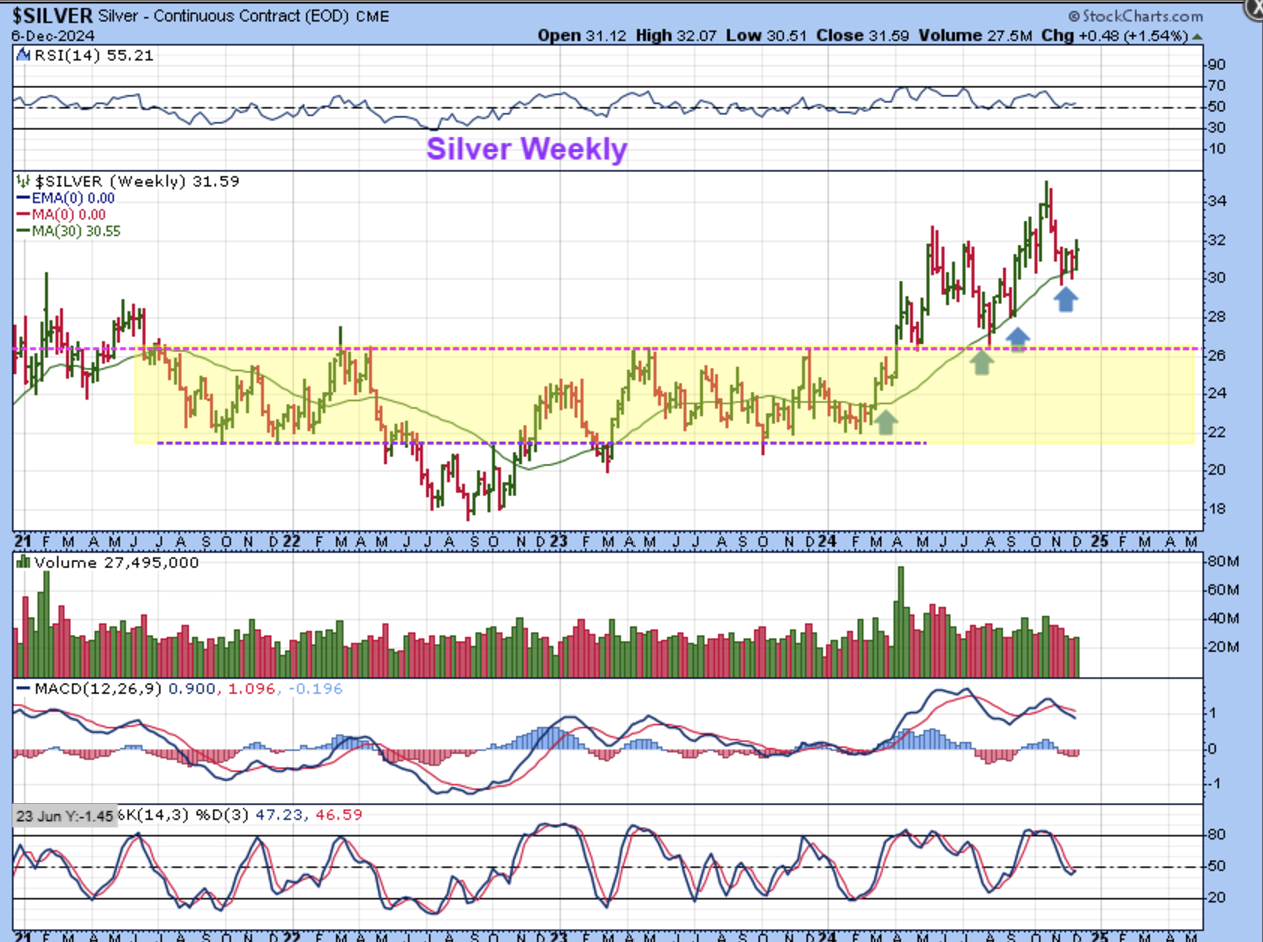
SILVER WEEKLY – This weekly chart actually looks bullish. I was hoping that it would sync up with Gold and drop into an ICL at the same time, and it still might, but Silver reversing higher above the 30 week ma is a bullish set up.
.
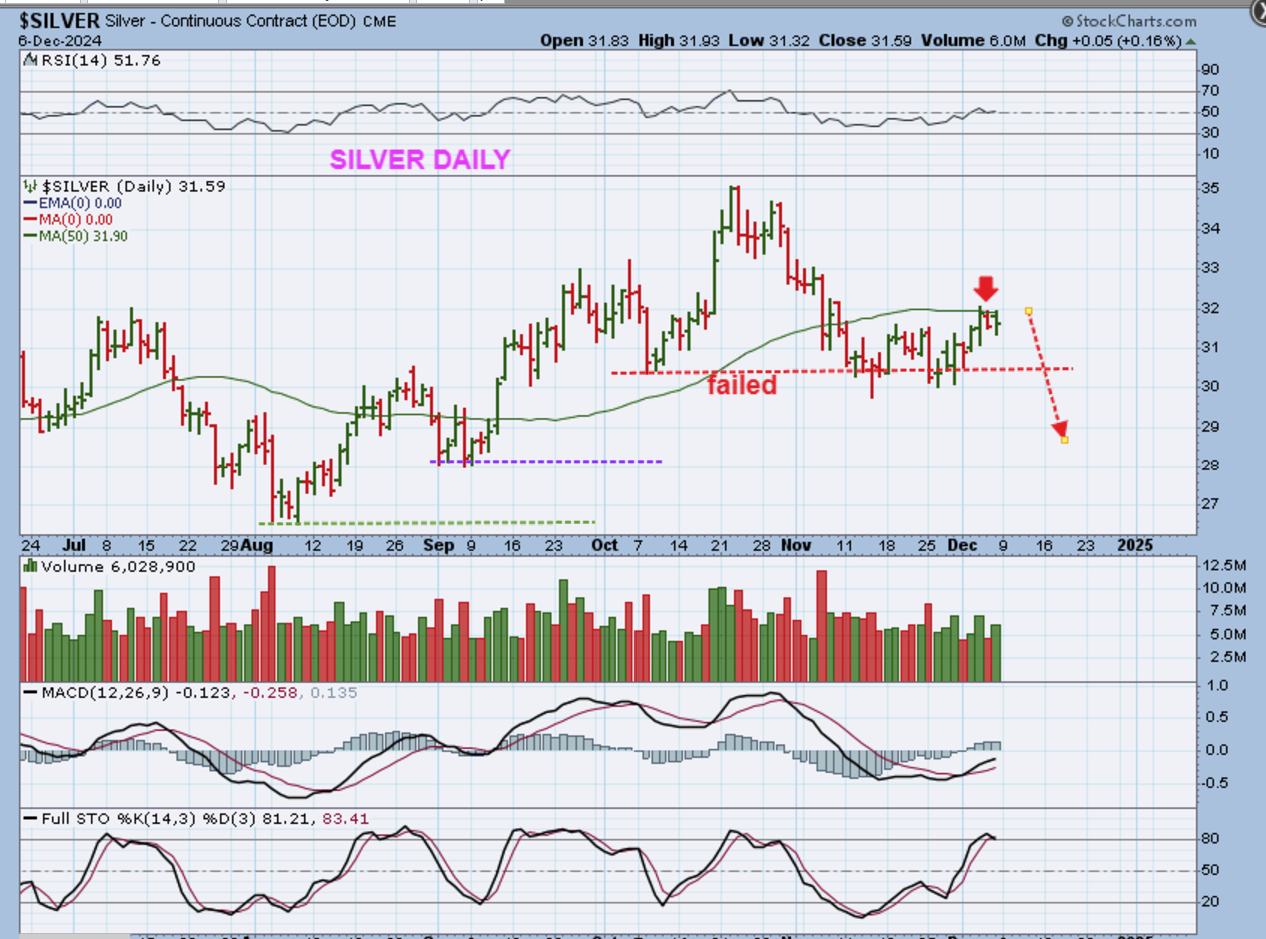
SILVER – Silver failed at the last dcl and then bounced and tagged the 50sma on that bounce. That said, AG, HL, EXK, FSM , etc did NOT bounce with Silver last week, they are actually close to their recent lows, likely indicating that Silver will roll over.
.
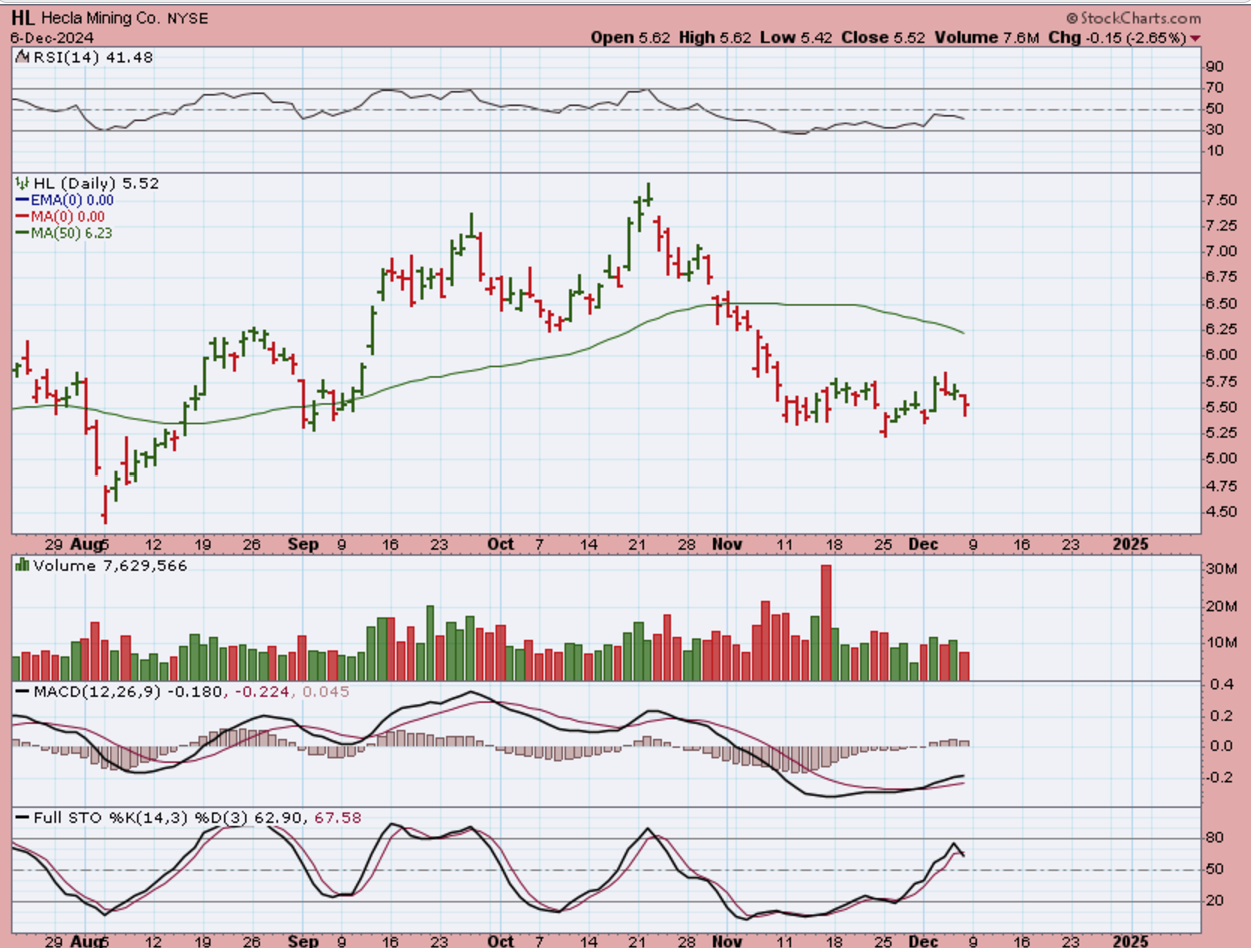
HL at the lows, not bouncing to the 50sma with Silver.
.
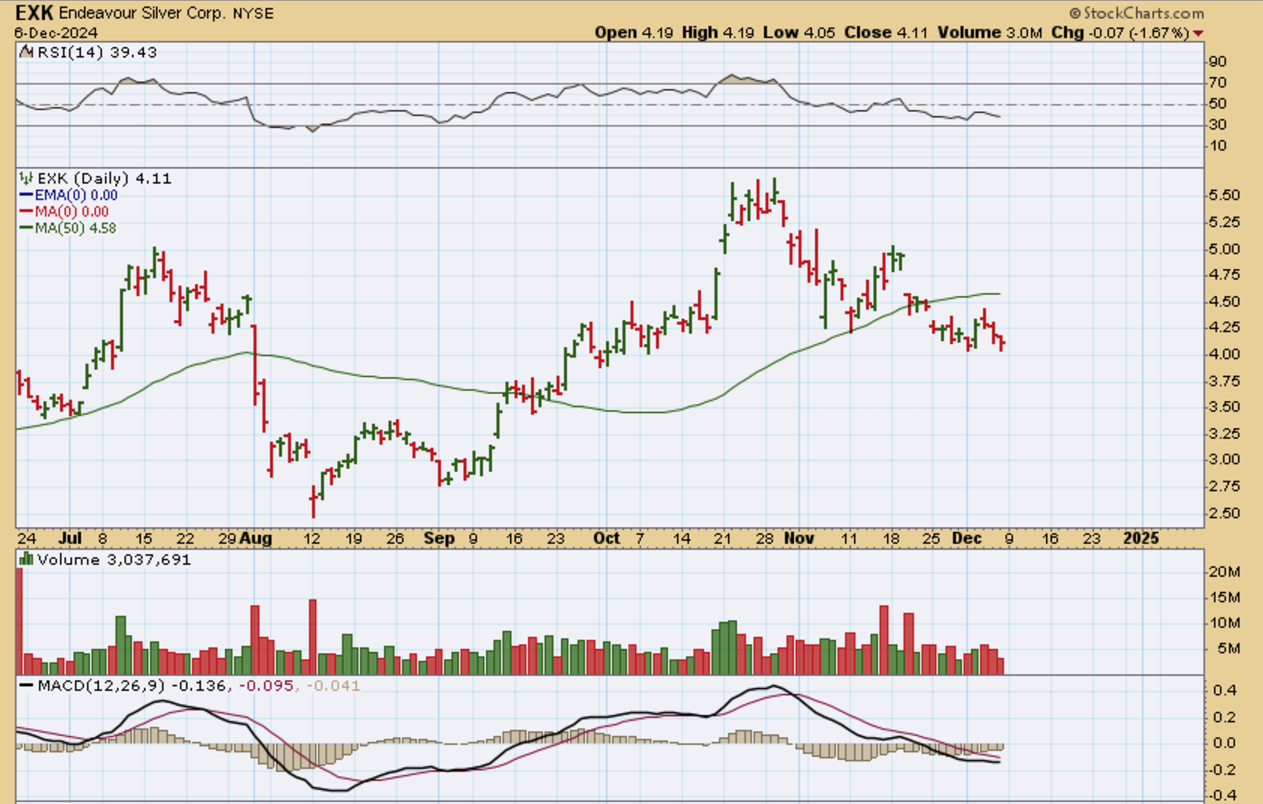
EXK: At the lows, not bouncing to the 50sma with Silver
.
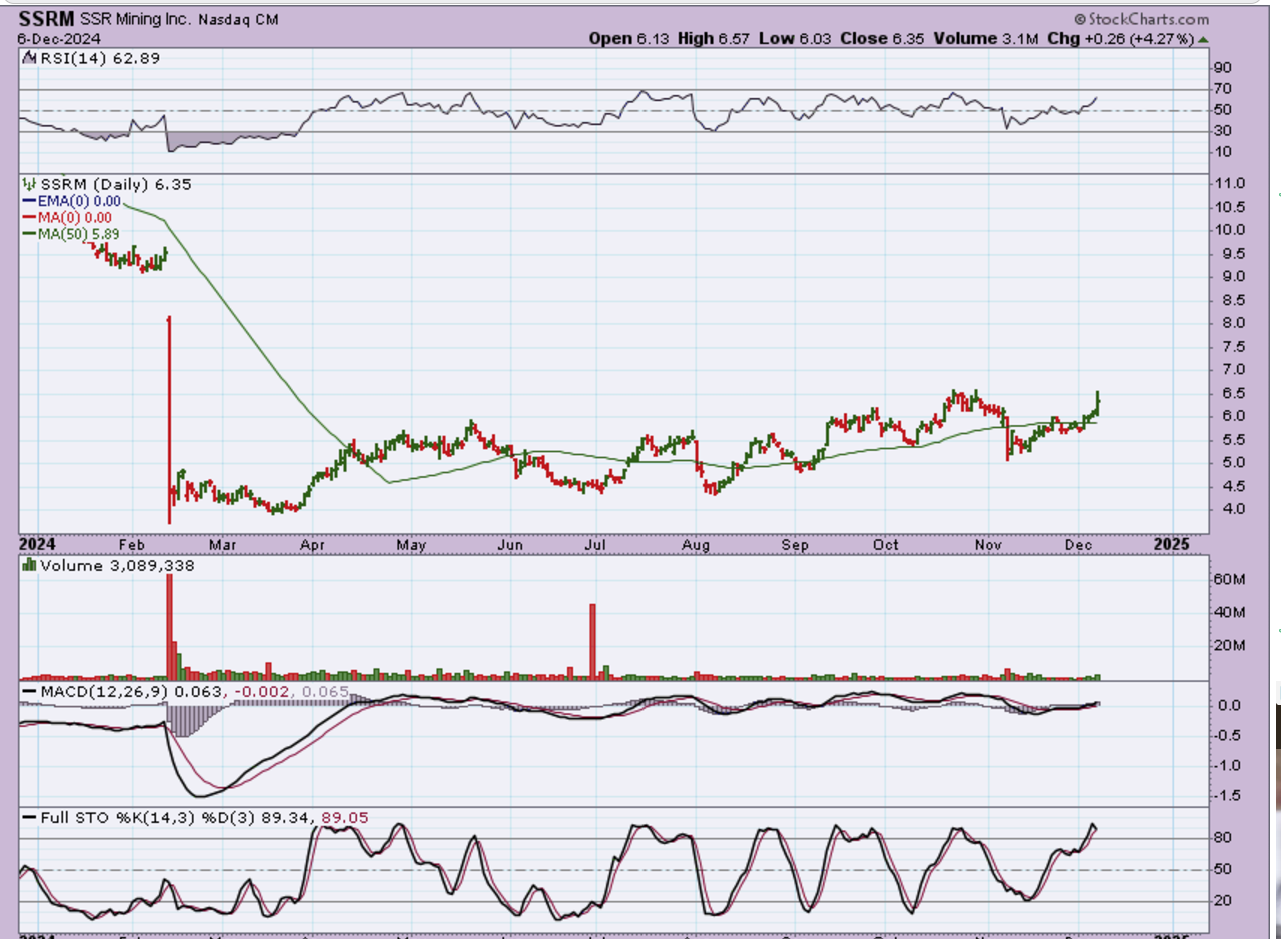
(SSRM certainly did though). This is running based on its’ own credit.
.
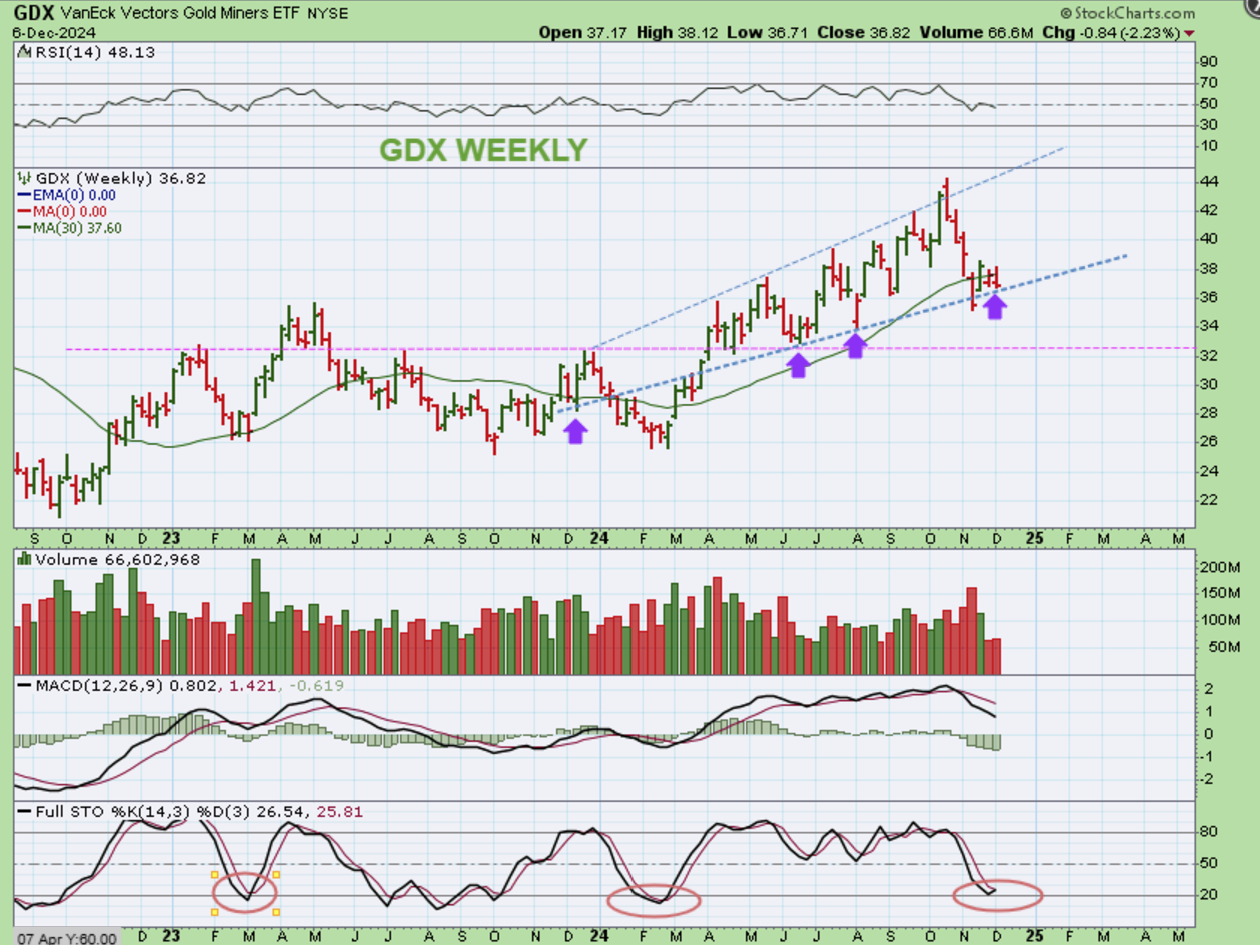
GDX WEEKLY – GDX dropped and looked like an ICL, but I don’t think it is if Golds ICL is ahead, so…
.
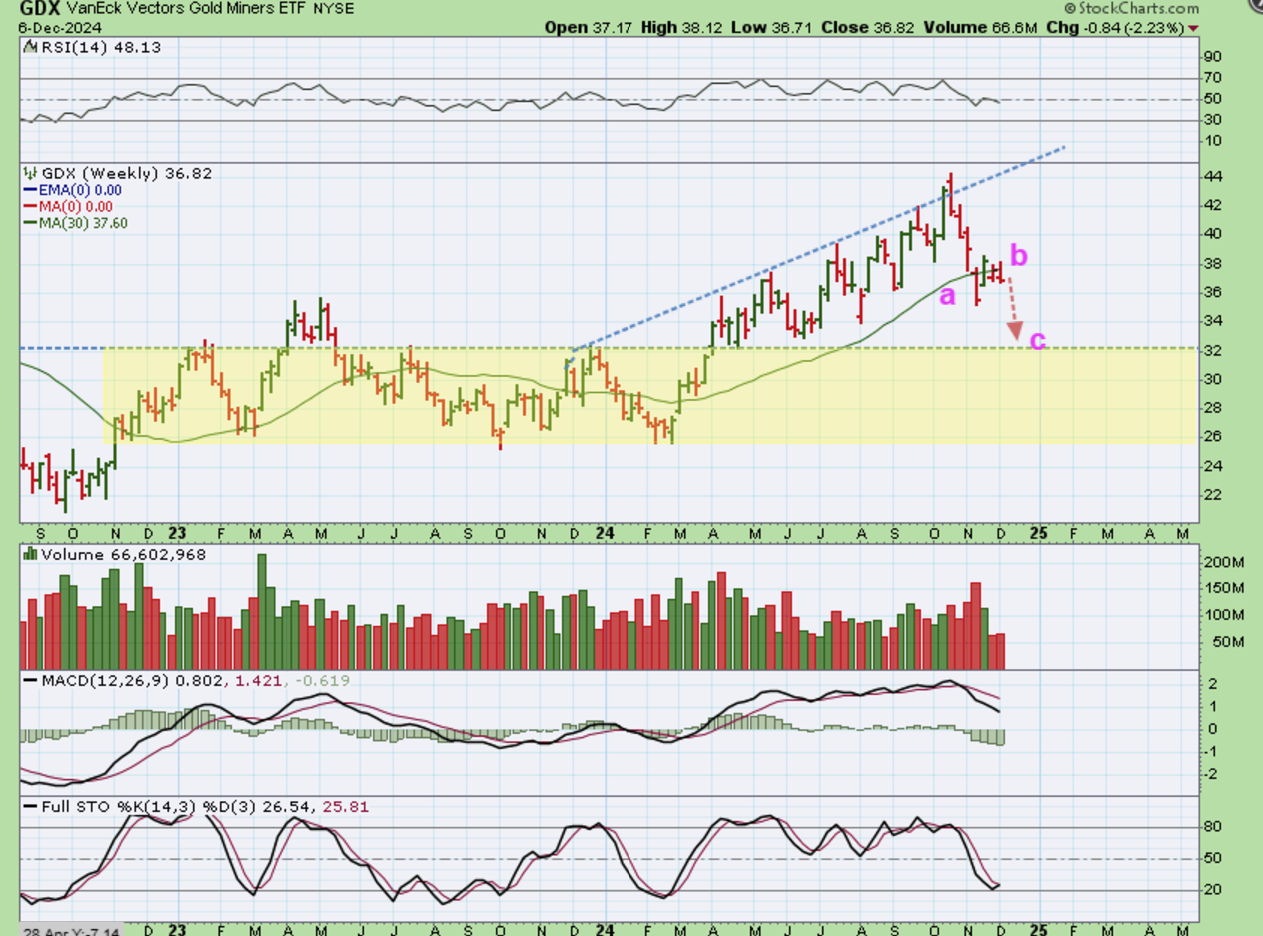
GDX WEEKLY – I would think that we get another drop to a new low that gives us an a-b-c down. Maybe down to support?
.
The Bullish General Markets are still running, but Oil is still just chopping and the Precious Metals are due to keep dropping, but likely for just a little while longer. The Fed Mtg is on December 18th, a week and a half away. And then there’s bitcoin, which broke $100,000 this week. I’ll discuss that below.
.
I hope that everyone is able to enjoy your weekend!
.
~ALEX
.
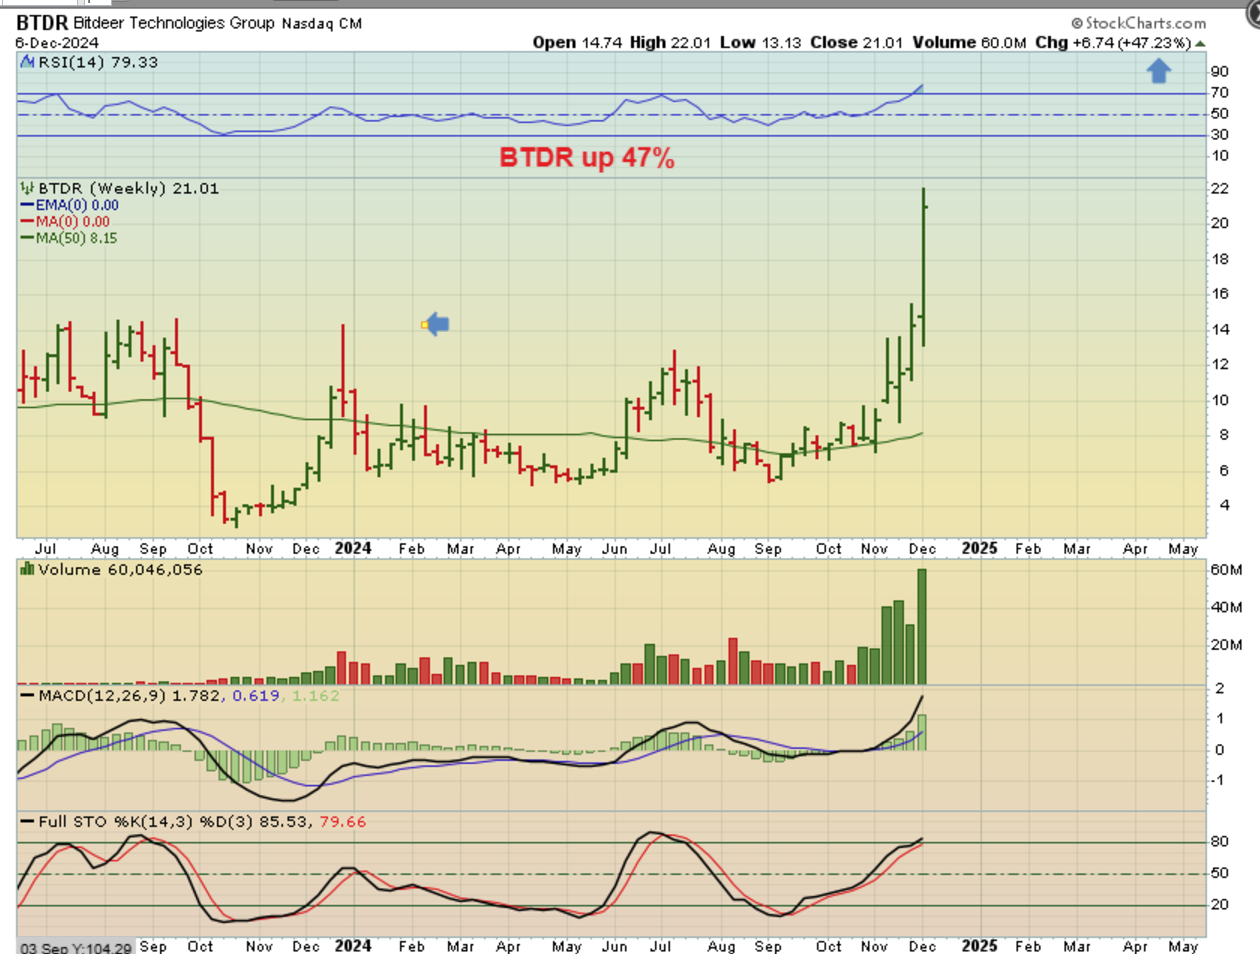
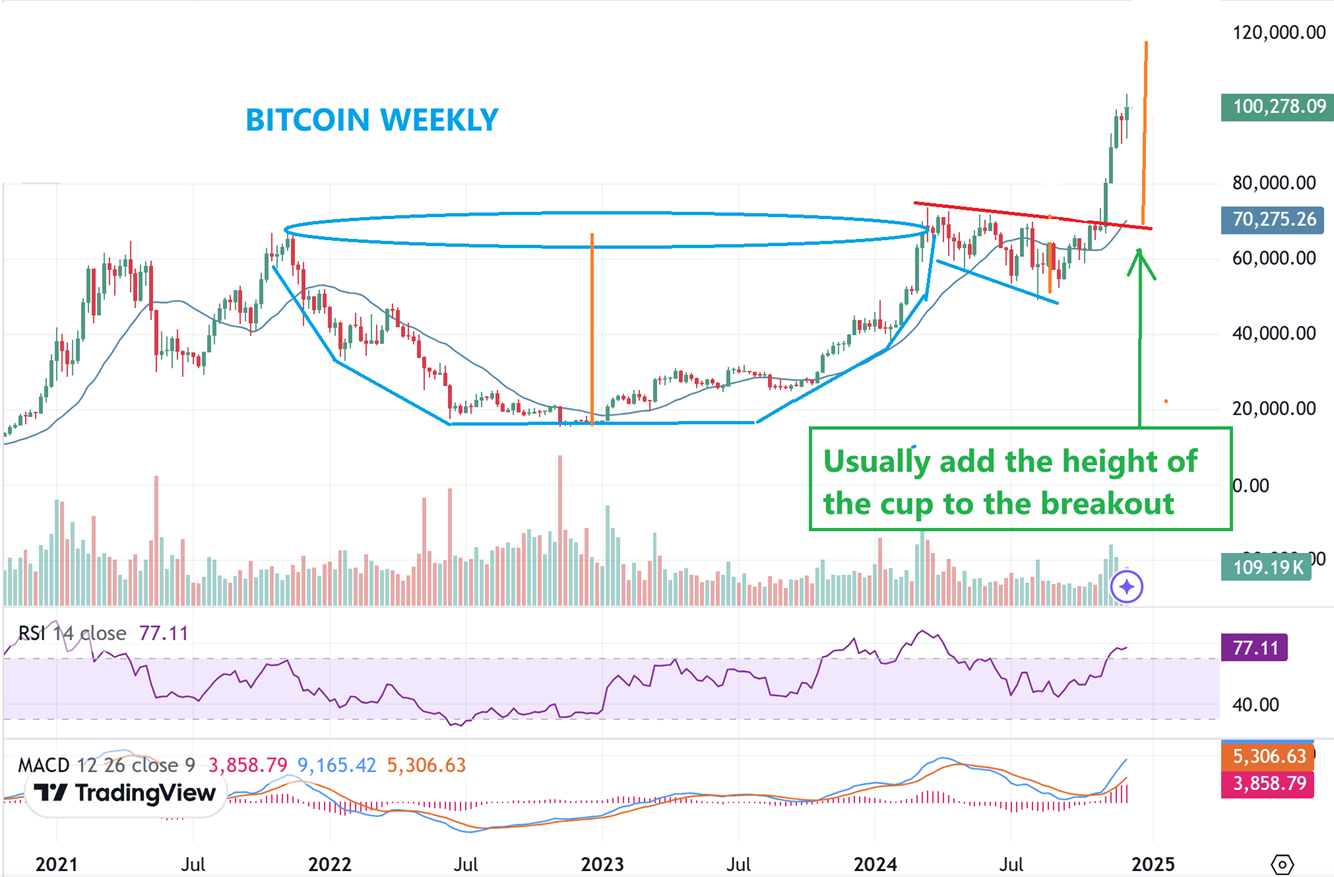
BITCOIN WEEKLY – When we get a cup and handle breakout, we usually measure the height of that cup and add that to the breakout (handle). It does not have to be in a straight line. We got a large doji this week, but this can still go higher. I pointed that out in Fridays report.
.
With that breakout over $100,000, some Crypto stocks had HUGE upside this week, while others popped and dropped and chopped.
.
BTDR and CAN up in almost 50% gains this week alone for example. Others like MARA, RIOT, HUT, IREN, CIFR, etc were up 3% to 13%. Hopefully they play catch up over time (that was a little confusing to see WULF, RIOT, and MARA only up 3% for the week).