December 14th Weekend Report
This weekend report will be just slightly different from past weekend reports.
Usually with the General Markets, I just look at the weekly charts, and we really do have some nice-looking weekly charts in a bull run! That said, wouldn’t it be good to look at the Bullish weekly charts , but also point out that we are moving later into the 3rd daily cycle, so it also would start to come due for a dcl soon (end of the year or fed mtg?), and then look at ICLs to see—when is it due? They come roughly every 6 months and honestly, they are the best ‘buy opportunity’ out there.
.
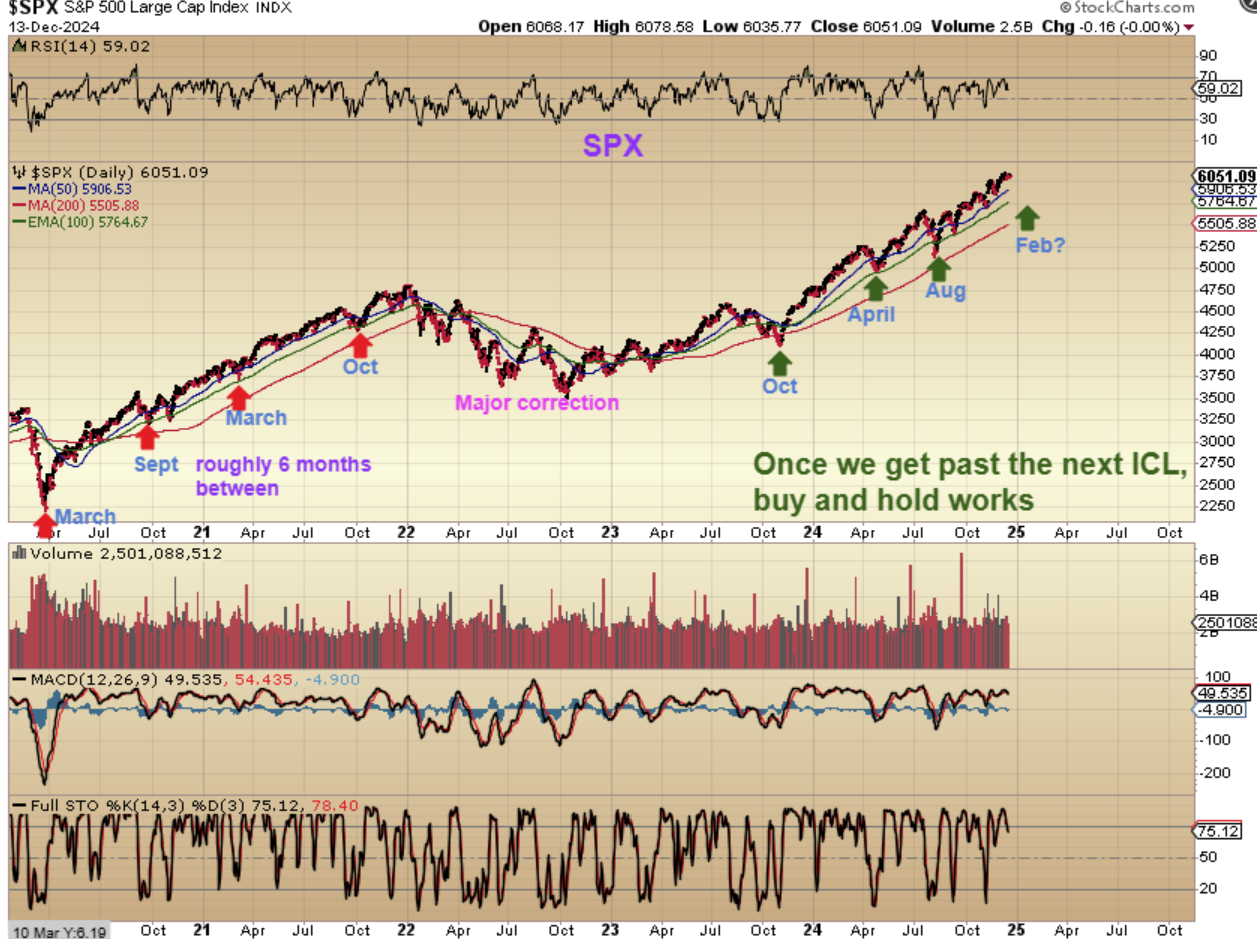
SPX DAILY– Look at the ICLS. They can just be somewhat steep or deep, but in this bull run they can also be fairly quick drops. I used a 100 week ma (green line), because some broke the 50sma and yet didn’t tag the 200sma, so we can keep that in mind. NOTICE THAT ICLs came roughly every 6 months or so, our last one was in August.
.
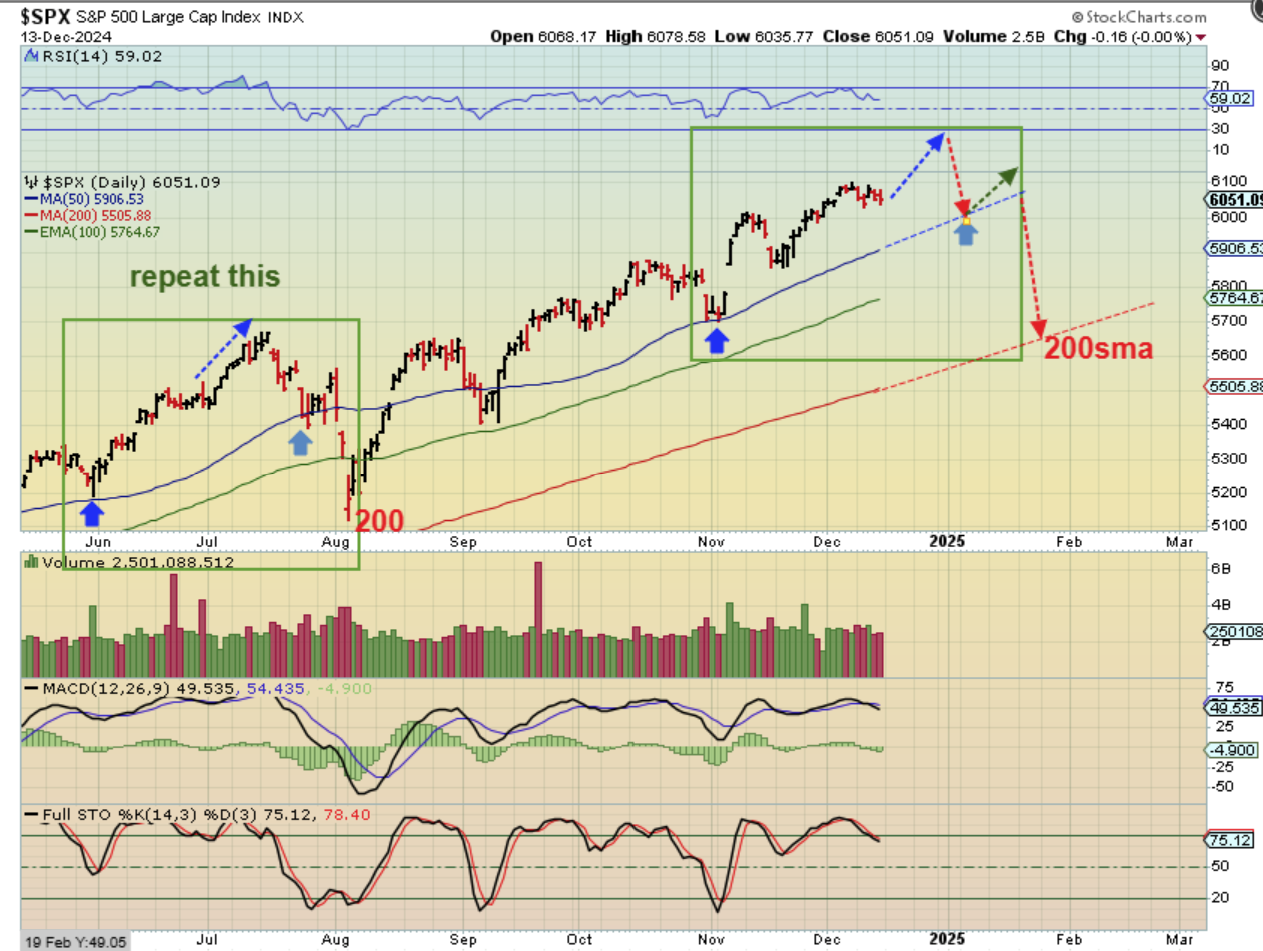
SPX – Now we zoom in and see that in this 3rd daily cycle there is ‘time’ for it to run if it repeats a run similar to that June-July-August time period into an ICL. I drew a continuing run into the end of the year (Santa rally), and eventually a drop toward the 200sma in early 2025.
.
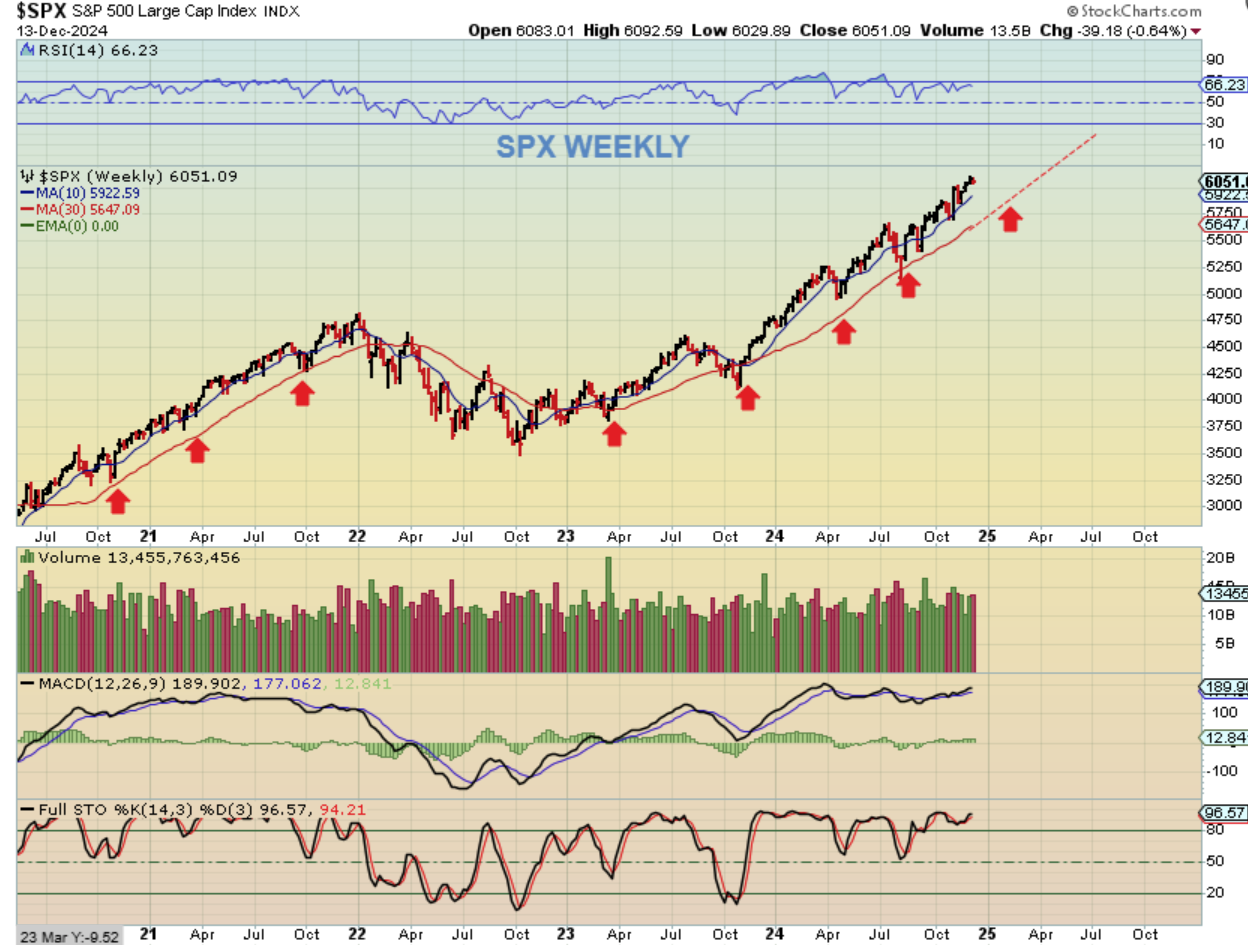
THE SPX WEEKLY shows that some ICLs were close to the 30wee ma, but others seemed stronger and didn’t drop that far. The next one may be stronger with the current environment after the US elections, but we’ll have to wait and see.
.
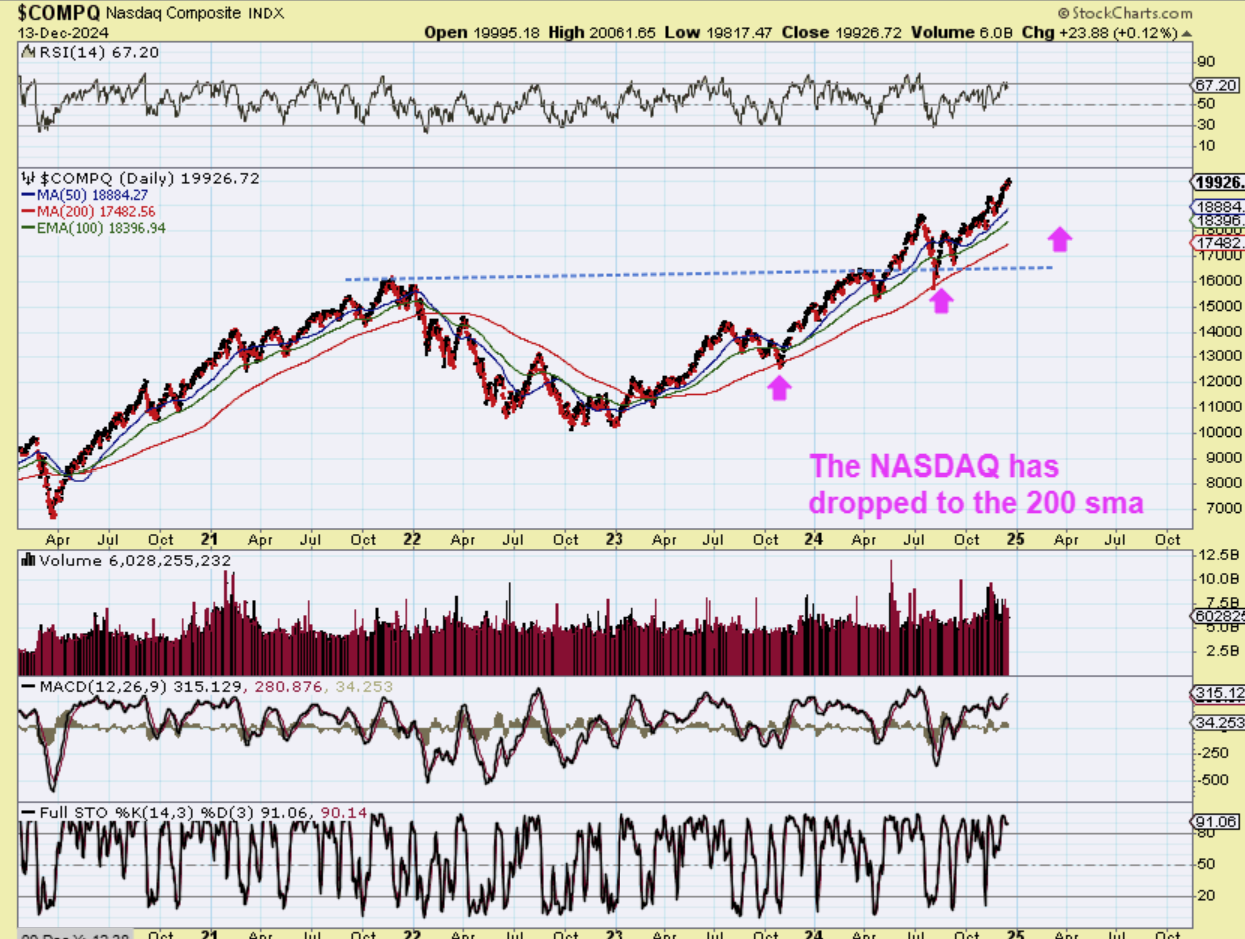
THE NASDAQ DAILY: The NASDAQ was choppy at the ICL area, but it has improved and strengthened lately. Notice that 2 ICLs for the NASDAQ did drop to the 200sma, but in 2020-2021 they dropped to the green 100sma, so we’ll keep that in mind (we could get either).
.
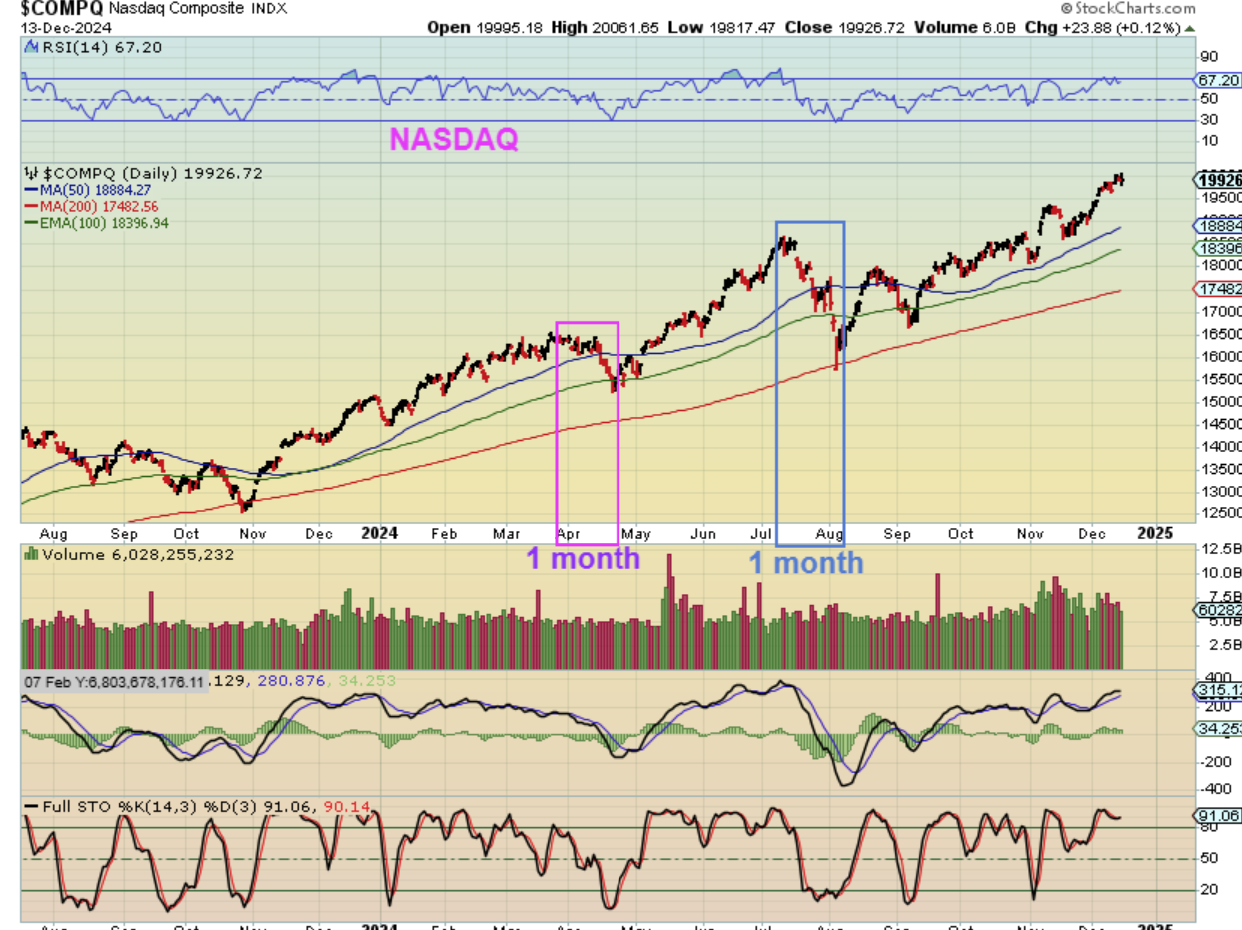
Zooming in for a close up, The NASDAQ just dropped in 1 month time-period. We saw SHARPER drops here, but it only lasted for 1 month each time, so we could get a sharp drop in early 2025 and then be right back on our way higher. WHEN WE GET THAT DROP, I want to look at a lot of the recent runners as possible buy and hold. Recently AAPL, IONQ, AAOI, NFLX, GOOG, DDOG, etc made good runs.
.
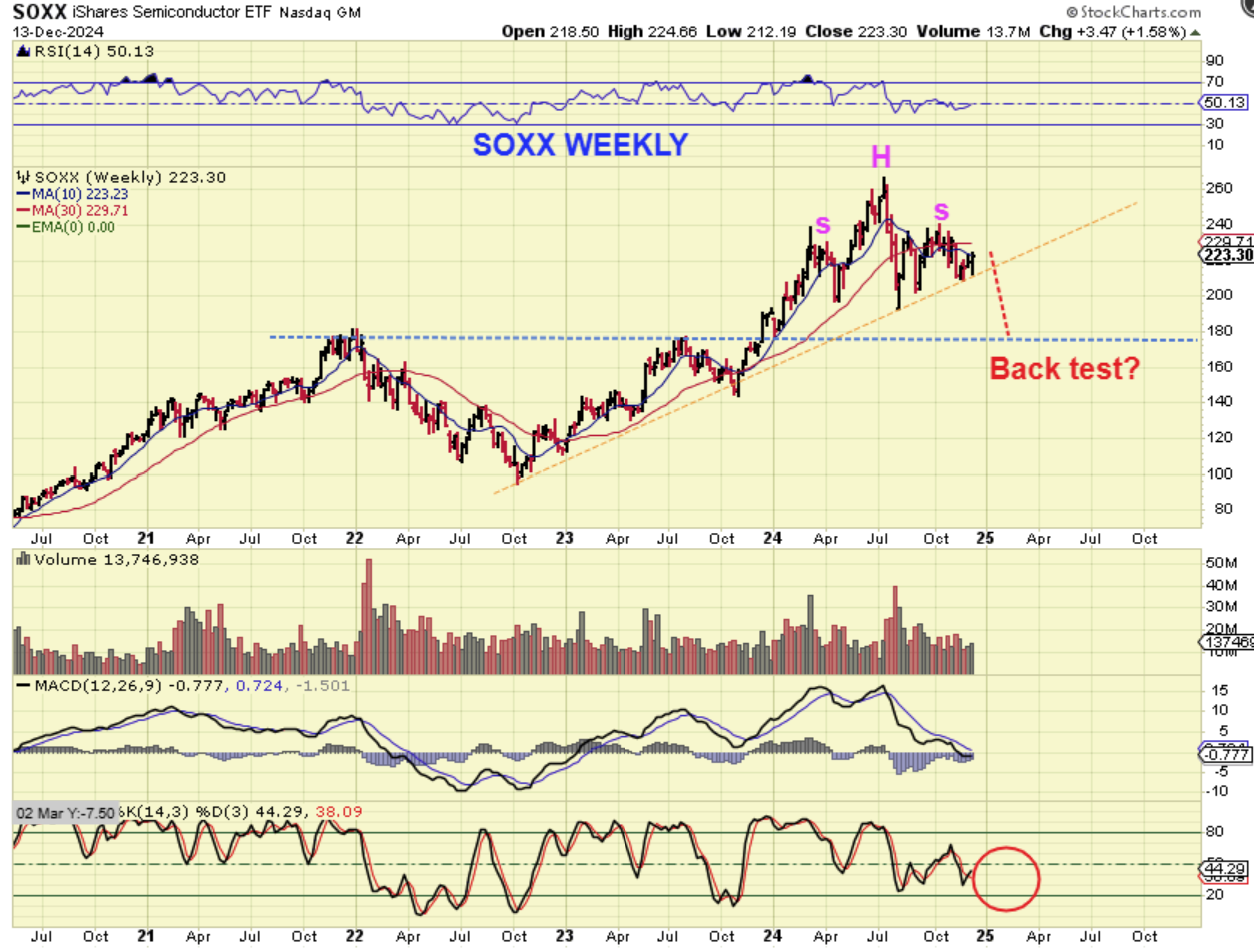
And then we have what became a concern of mine, The SOXX:
.
The SOXX WEEKLY looks like a H&S formation with a fairly deep downside target area. This could start to drop at the end of this 3rd daily cycle and then bounce and really drop in the 4th daily cycle. That may line up with February.
.
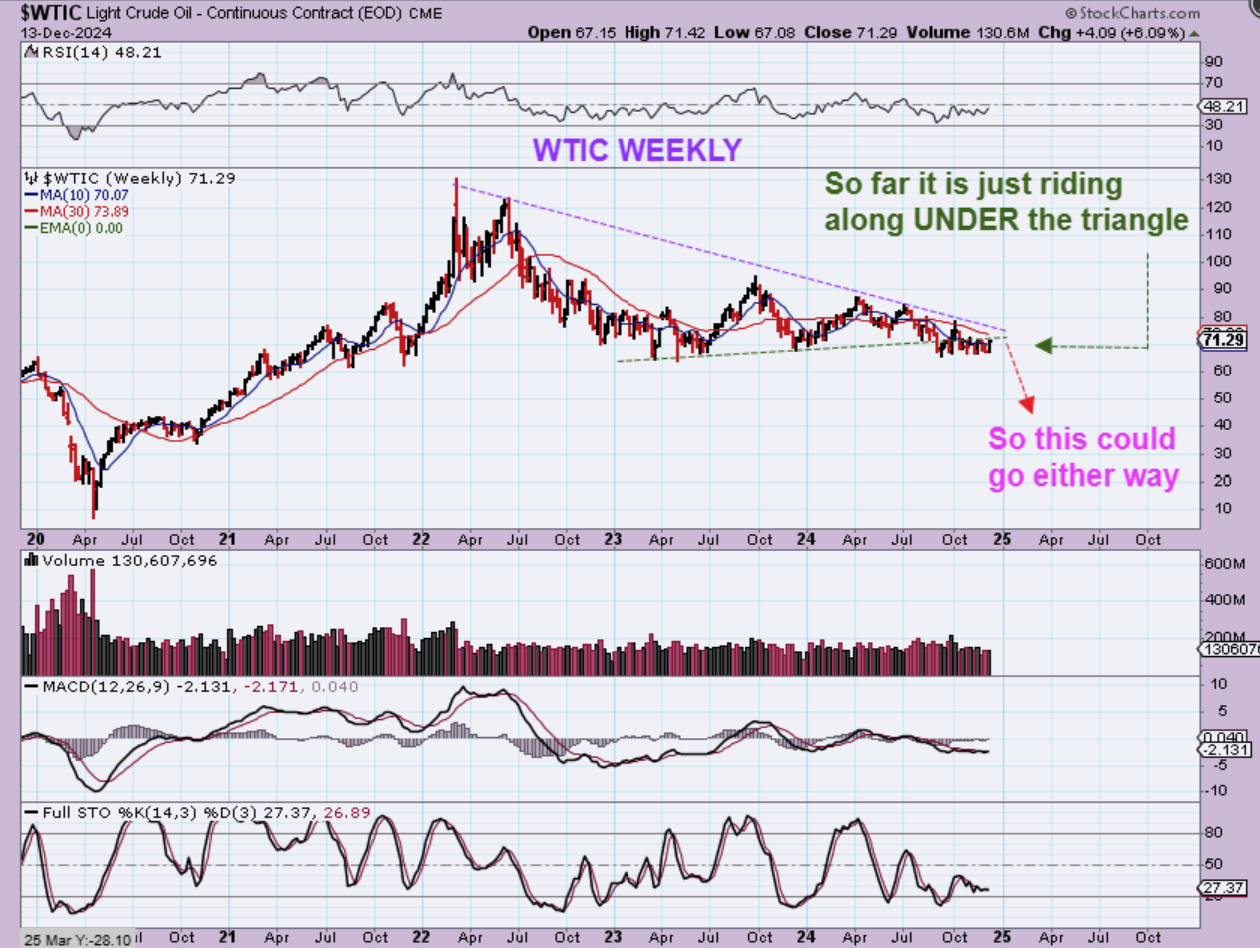
WTIC – Oil is very choppy and that even shows up on this weekly chart. Look at the price from September into December and you’ll see that it is just chopping sideways, so really this could break out higher or lower. The longer that it takes to choose a direction, the later in the Intermediate Cycle we get and it will weaken, not strengthen in the 3rd and 4th daily cycle. This needs to break out higher SOON, if it is going to.
.
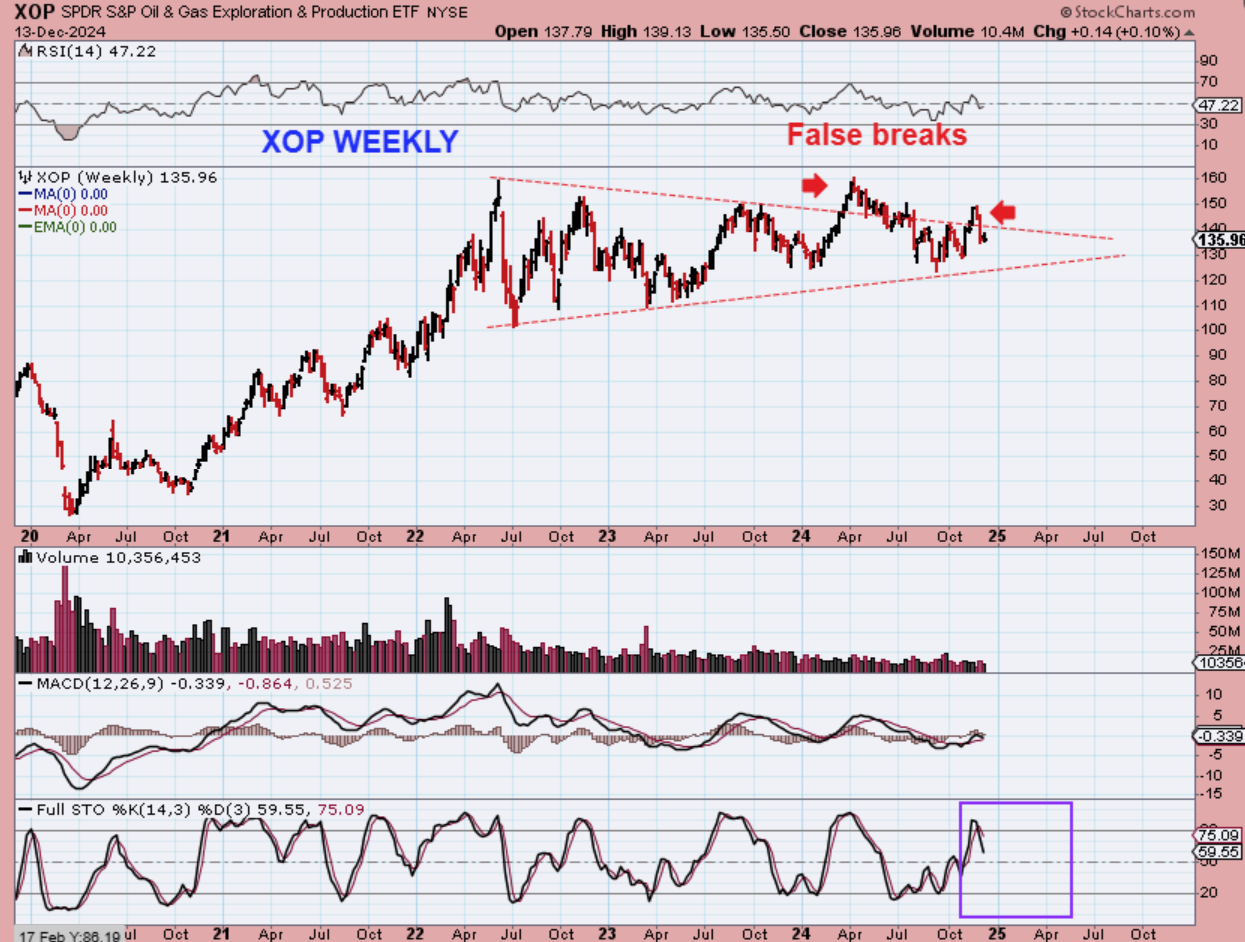
THE XOP broke out and then fell back down sharply a week ago when Oil dropped back toward its ICL Low. It is choppy and can remain that way until Oil picks a direction.
.
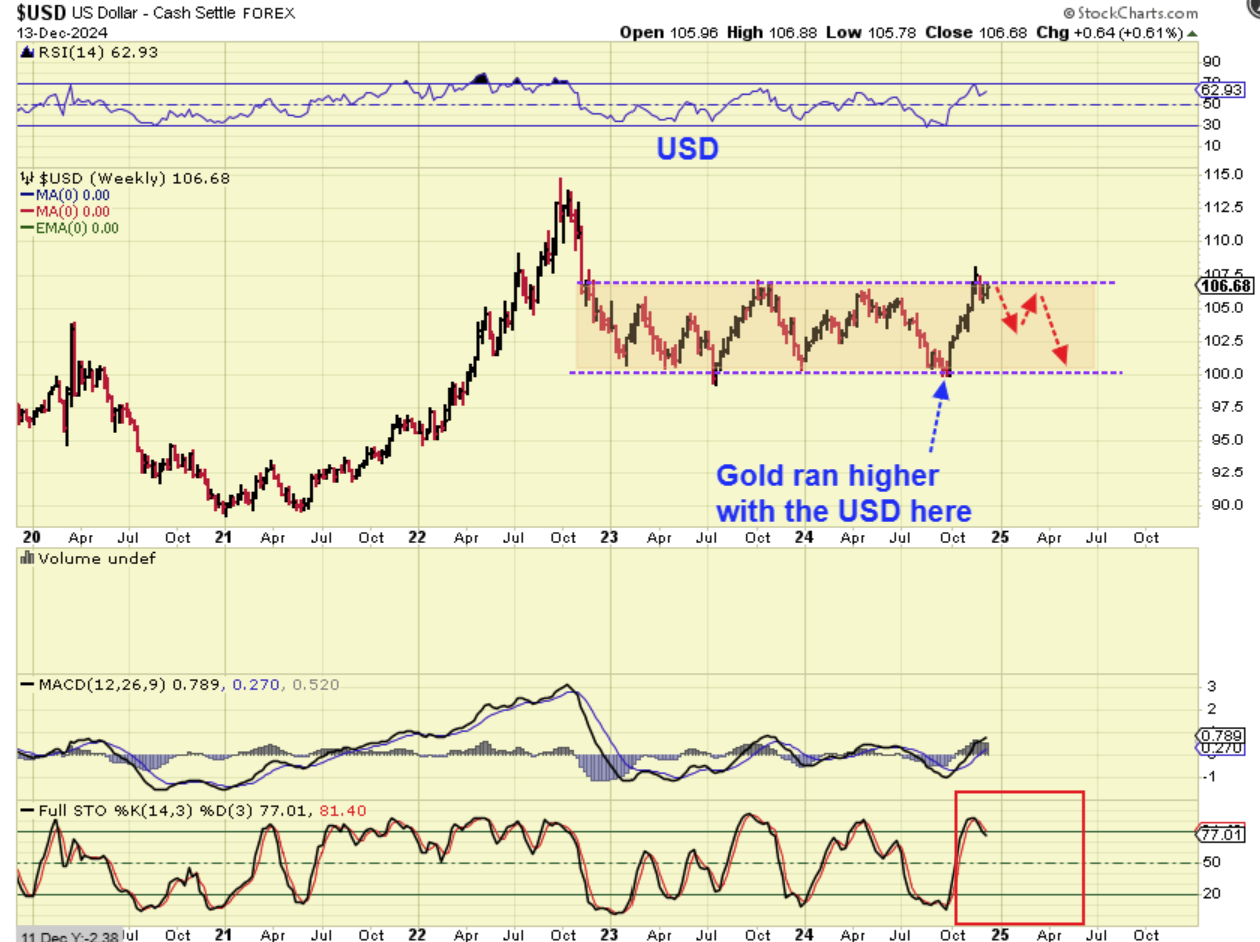
This past summer (June-July) I was expecting 2 daily cycles to take The USD from its ICL to the $107.50 area, and then I was thinking that it could roll over from there and head lower in the 3rd and 4th daily cycle. I thought that a ‘peak’ at $107.5 would time up with the ICL for Gold. The good news is that as the USD rallied, Gold did too, so what the USD does from here may or may not matter. I still think that it will roll over and drop as drawn here though.
.
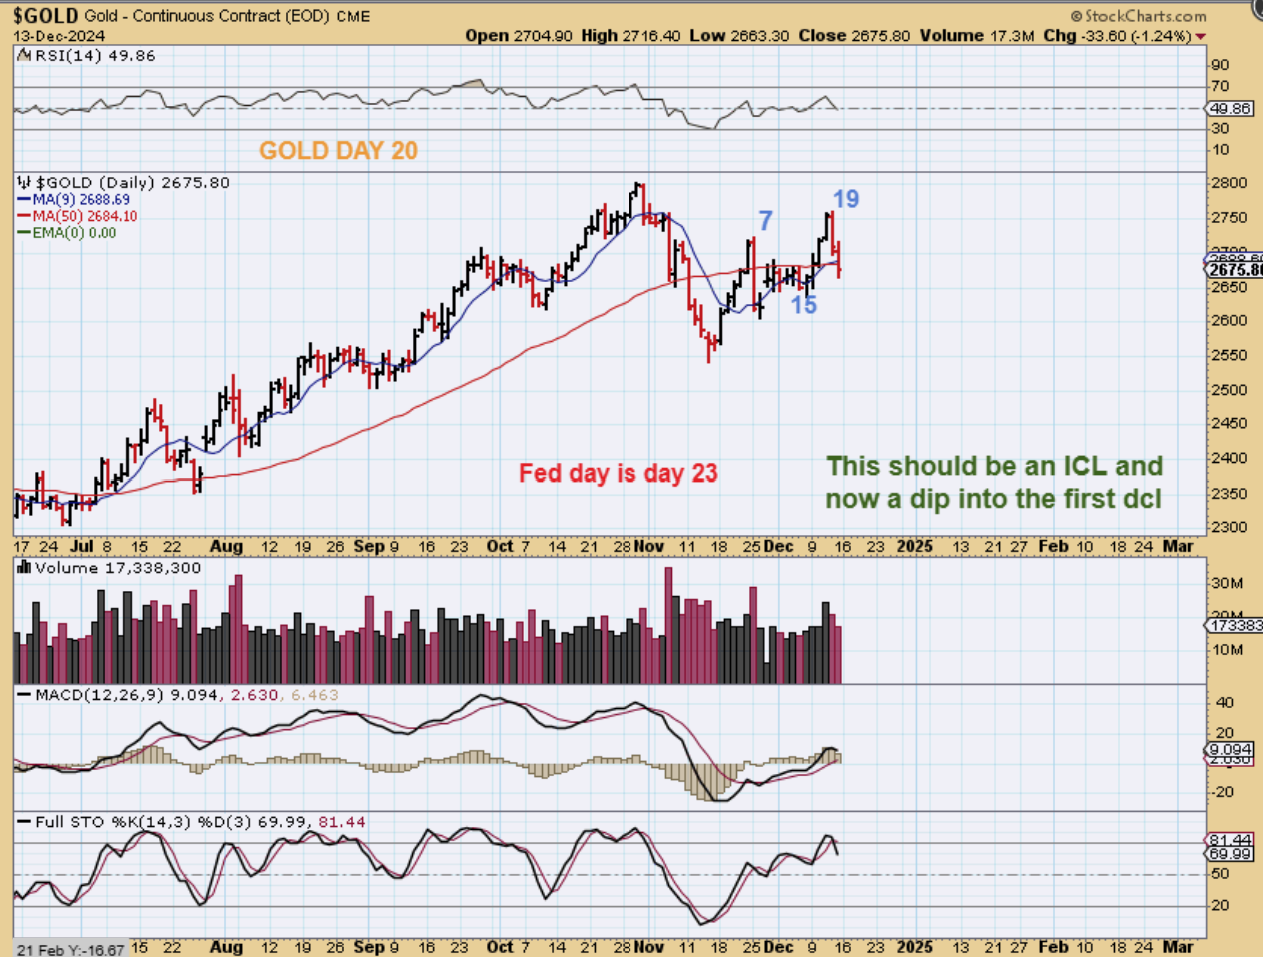
GOLD is acting very bullishly and rallied into a day 19 peak. Hmmm?
.
We were looking for a normal drop into an ICL. This is not normal, but why?
.
1. A ‘NORMAL’ drop comes with a L.T. daily cycle and we did not have a L.T. daily in Golds November drop, so a 5th weaker daily cycle would be expected.
2. Then GOLD rallied into day 7, crashed, and yet now it rallied and made a ‘higher high? It also gives us a R.T. peak at day 19, unless we drop into day 38?
3. THIS IS NOT NORMAL, but what part of this is the head fake? Was Gold so strong that it put in an ICL with that R.T. crash, even though it was short and R.T.? (I do think that may be the case). Or will gold crash to a new low now as an ICL that needs to drop to day 38 to be L.T.? I actually think that we may dcl near the fomc mtg and run to new highs during the 2nd daily cycle.
.
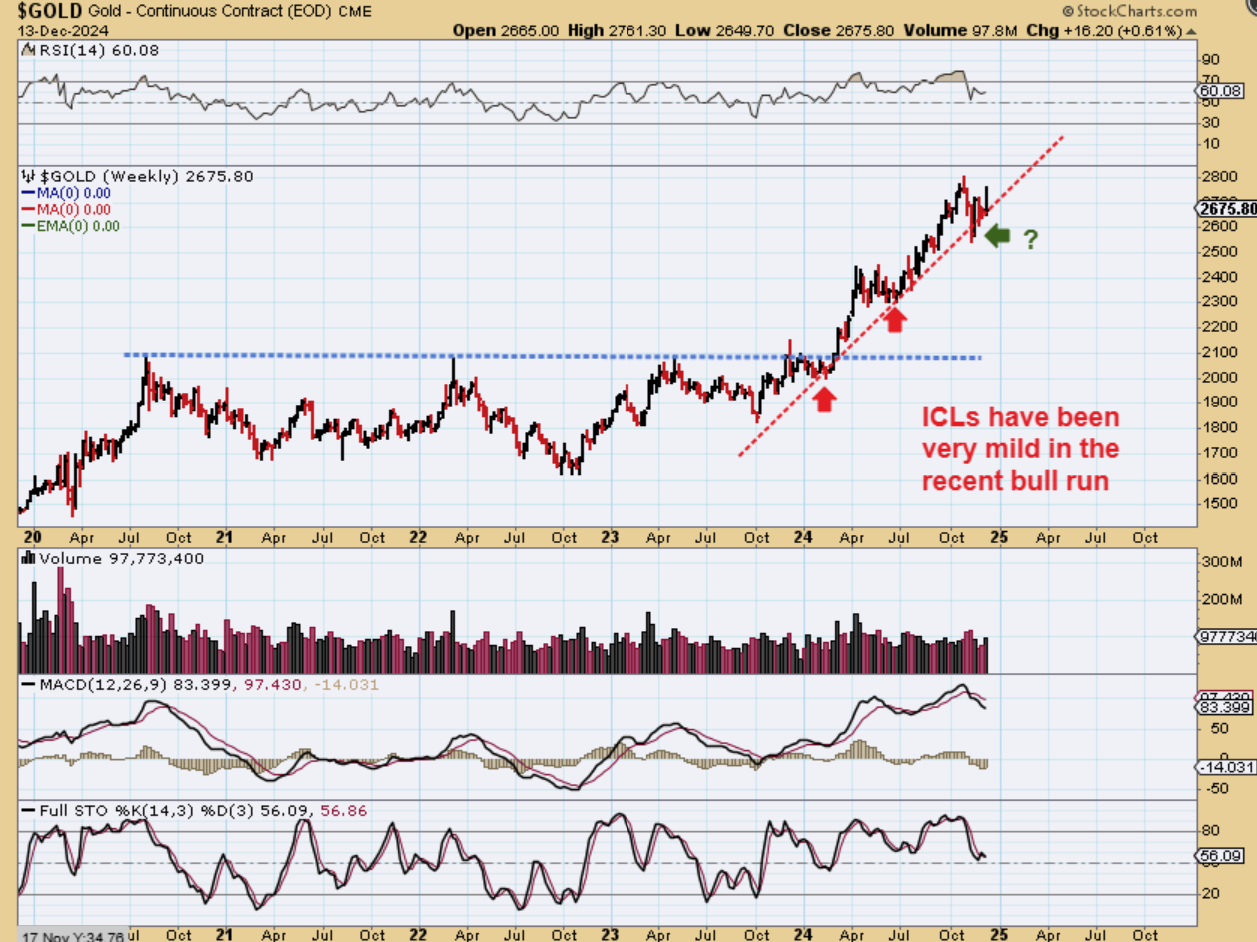
This does look like an ICL in a Bull Market
.
GOLD ICLs, as seen on a weekly chart, have simply been shallow and mild. The bull is strong, so we may now have an unorthodox ICL in place. I think we will know this week with the FOMC Rate Decision.
.
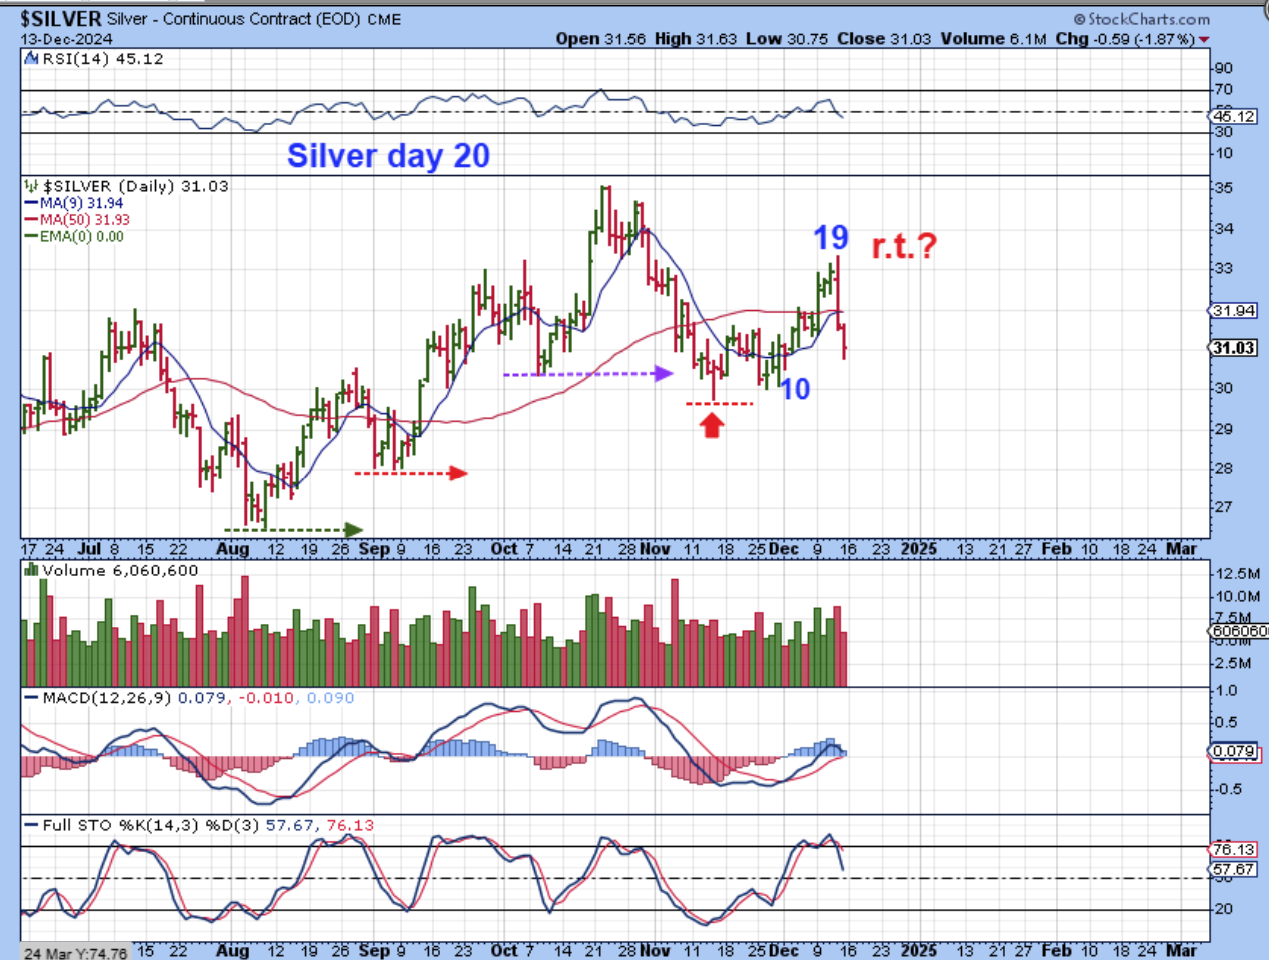
SILVER DAILY – We have the same scenario here, but it was only 3 daily cycles that developed out of the last ICL and suddenly we have a move to a day 19 peak. Again, if this next drop is going to be L.T., we need a 39+ day daily cycle. At day 20, we have to also realize that this could bottom as a smaller first daily cycle ( day 23 or so).
.
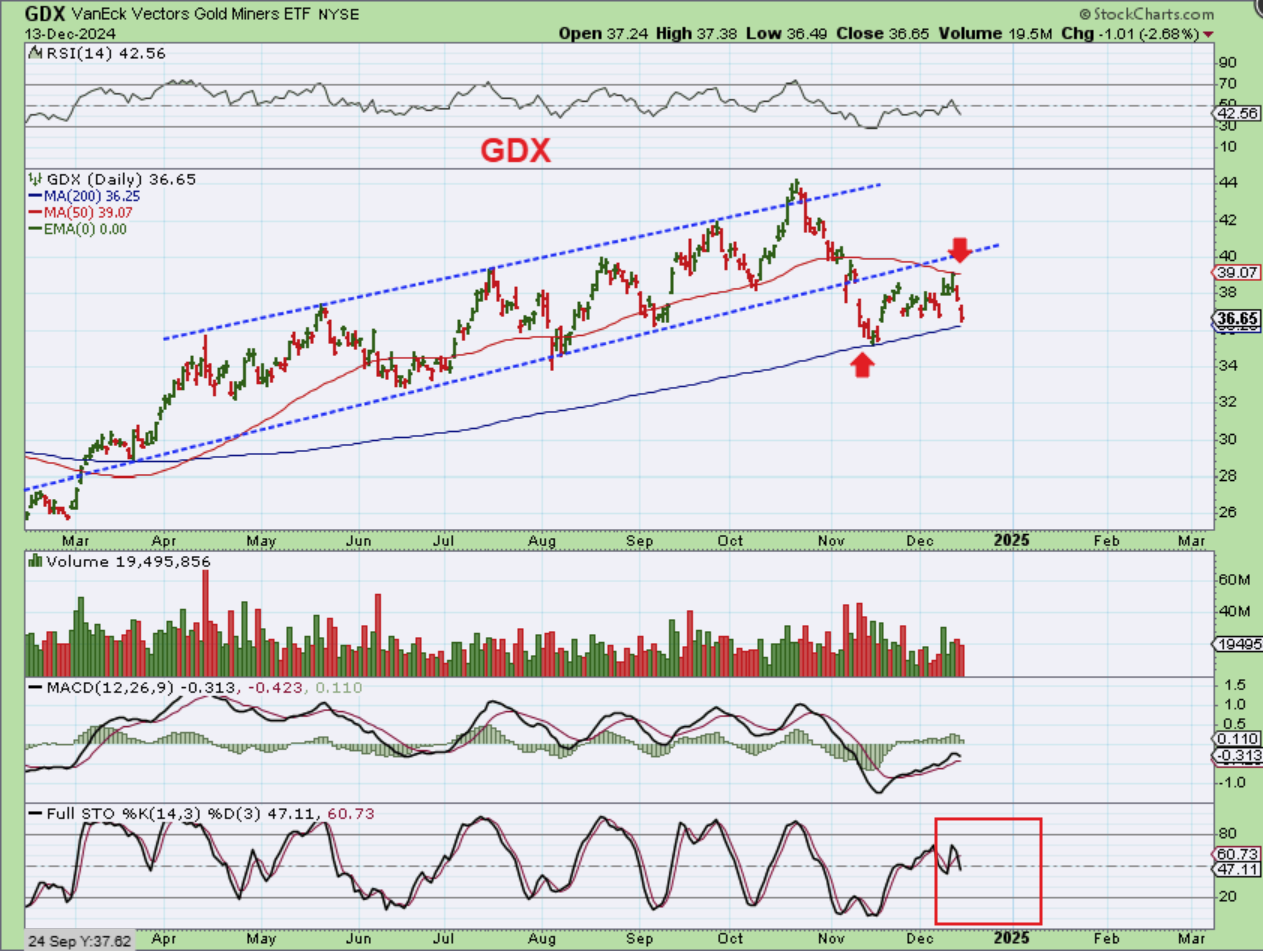
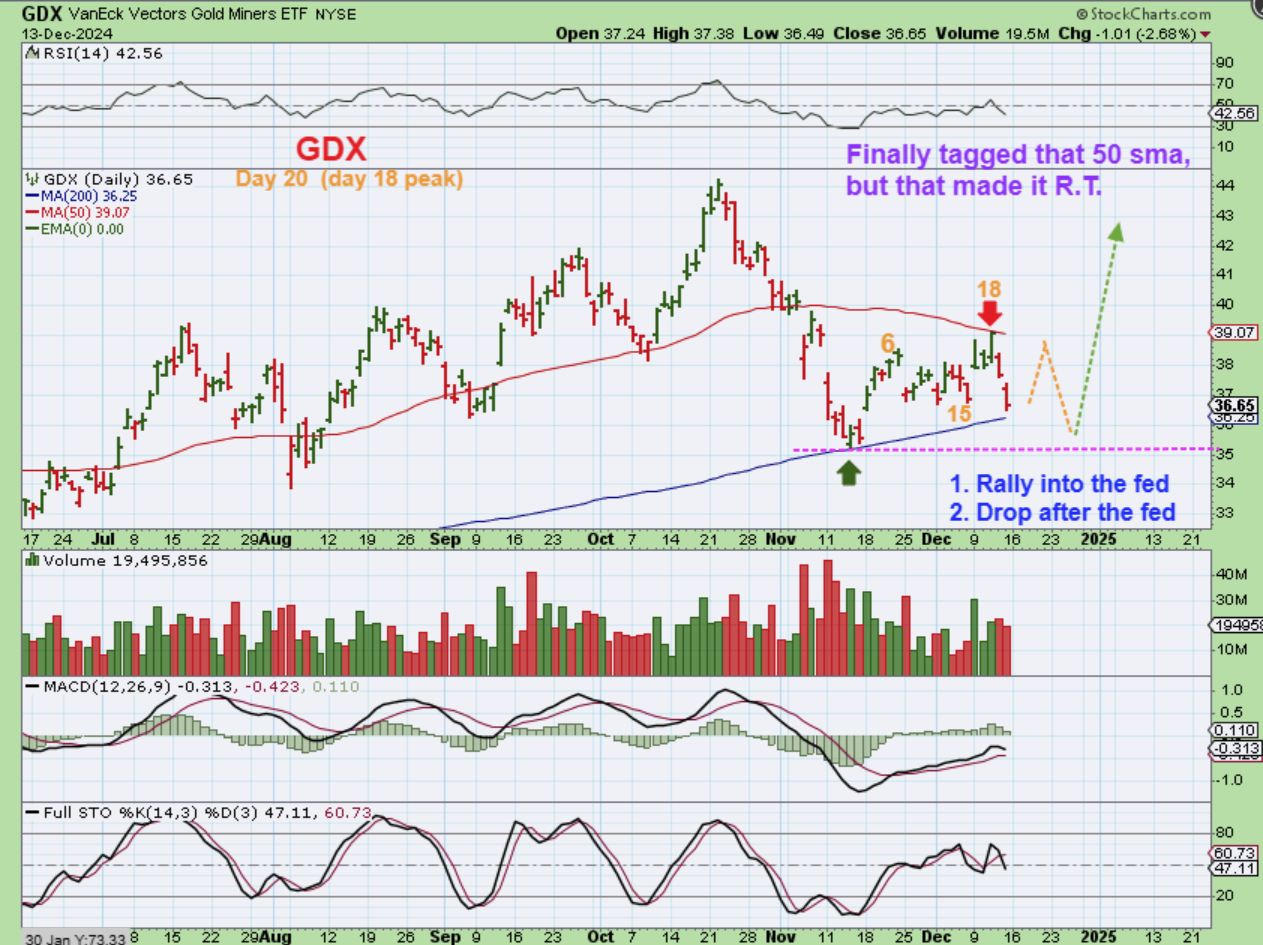
GDX DAILY – Well, we rallied to a new peak here too. Now they all (Gold, Silver, and GDX) have what should become a R.T. Daily cycle, but this still raises the same question:
– Did we have an ICL drop at the 200 sma and this is the first daily cycle, R.T., and will dcl around the fed mtg? Let’s zoom in…
.
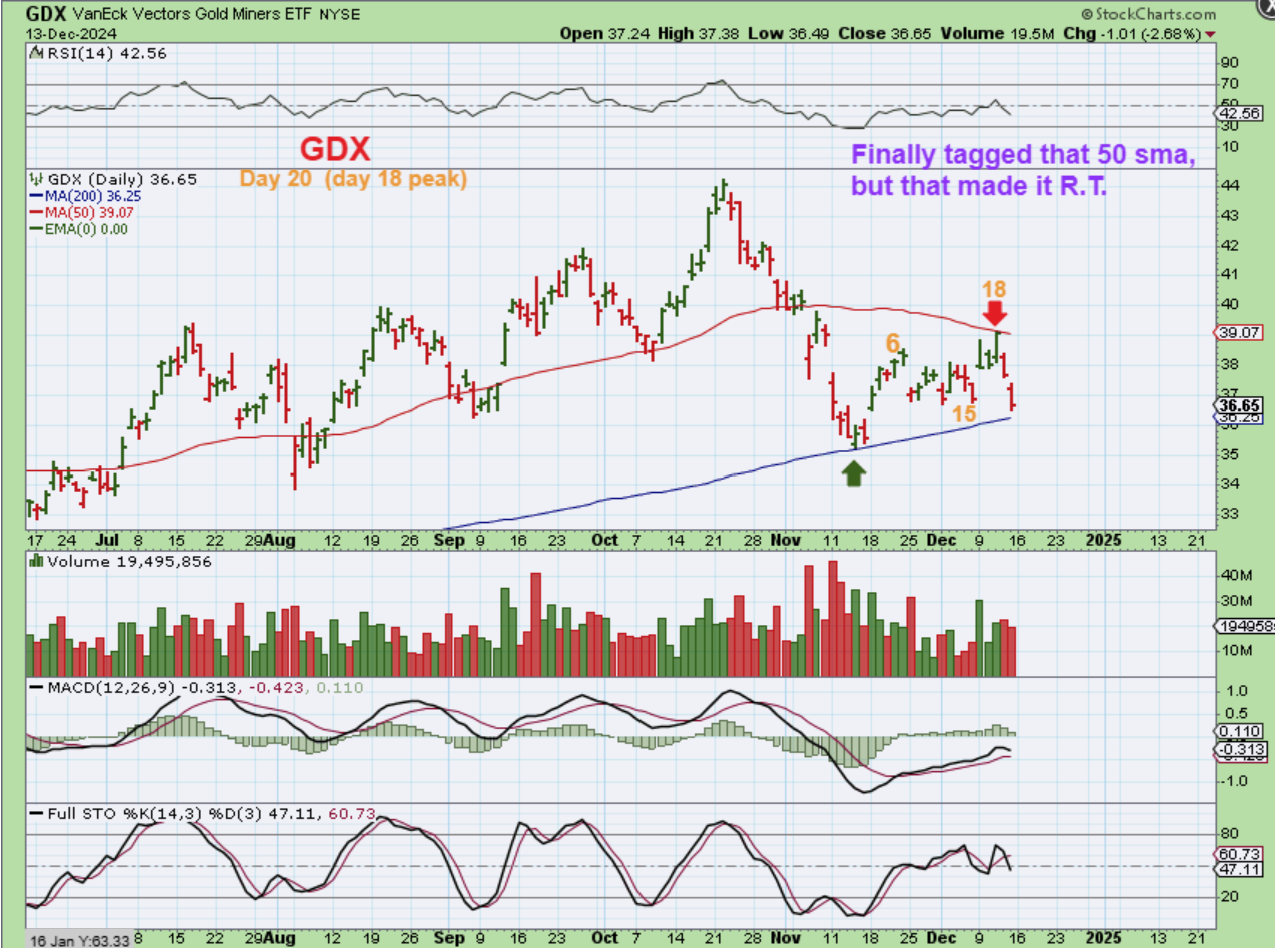
GDX tagged the 50sma on day 18 and rolled over into what should eventually become the next dcl. Well…
.
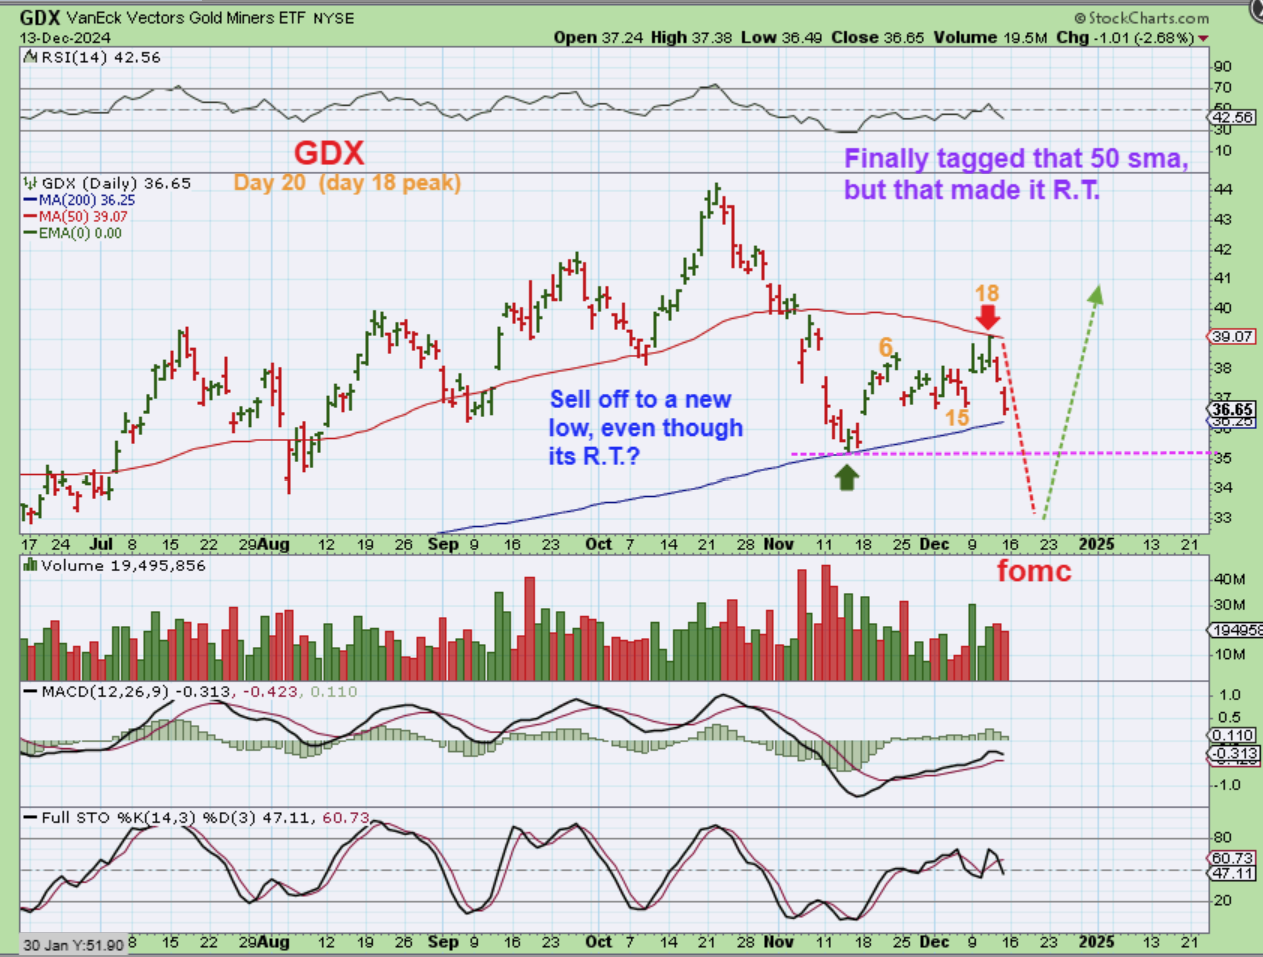
GDX could bounce into the Fed, drop after the fed to extend the cycle count. Or…
.
GDX could just sell off to a new low around the Fed Mtg and then move higher too.
.
Any way you look at it, the Precious Metals Sector is really acting stronger than normal. Throughout the rallying phase, we did not get 32+ day daily cycles anymore, like we used to. When Gold broke to new all-time highs, we eventually started having shorter daily cycles that only measured roughly 24-26 or so days in length. That is what happens when we go from a bear market “bail out and dump your miners’ to a Bull run in Gold with a new ‘Buy that dip’ mentality. And now, as we anticipated dropping into an ICL with a L.T. 5th daily cycle in Gold, we got a rally out of the 4th daily cycle sell off that has a new ‘peak’ at day 19.
.
The General Markets remained bullish and we are in the 3rd daily cycle at a point that can still run higher before dropping into a dcl. The next daily cycle is the 4th and could be the one that peaks and drops us into an ICL. They come every 6 months or so, and the last one was in August. They also can be somewhat ‘Mild’ when we are in a bull run, and after that correction at the very low point, the rally has been bullish and steady.
.
In 2022, The General Markets had a sell off into a very choppy low (cup) and the first ICL after that was a bit prolonged and choppy in Oct 2023. After that the bull is running stronger and the next ICL’s seem a bit milder, so now we could get another milder ICL, maybe sometime in February. That is an estimate for now, but as usual. we’ll know it when we see it. That should be a great buy opportunity.
.
I’ll discuss Bitcoin below, but also an interesting ‘perspective’ that we all may be able to learn from, so you may want to read to the end of the report, even if you don’t trade Bitcoin or crypto. Enjoy your weekend!
..
~ALEX
.
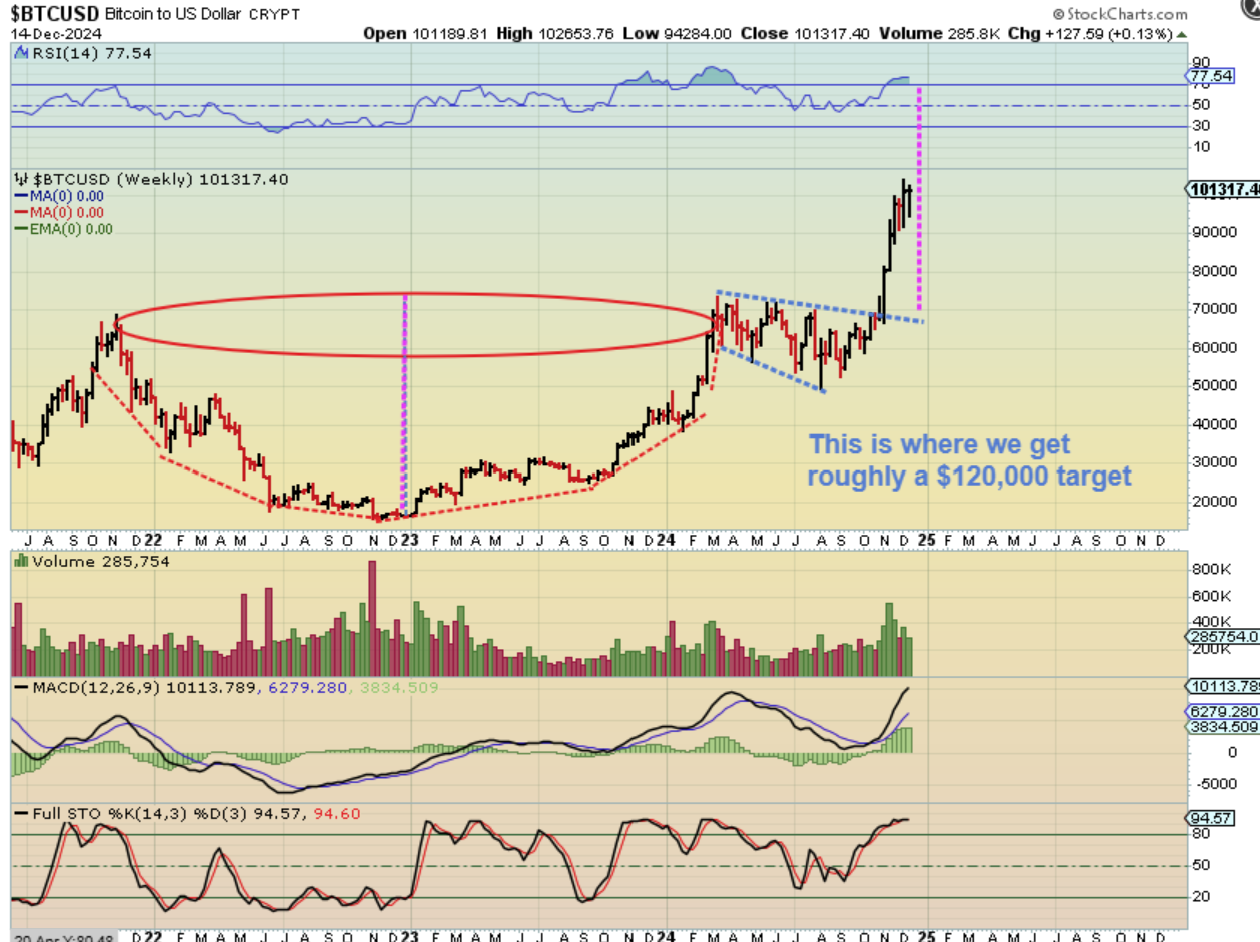
BITCOIN broke from the Cup and I do have an upside target of $120,000, but it doesn’t have to get there all in one run. It COULD do that, but it may be after a smaller choppy period plays out.
.
I was thinking about and wondering about the choppiness in Crypto stocks. Is it possible that they are making gains, but are just very choppy in an attempt to consolidate the rapid way that they make their gains? It is possible. I am fully on board with anyone that is screaming, “Bitcoin is at all time highs over $100,000, why aren’t crypto stocks at the highs!!” I totally get that, and I feel that way too, but they are not and I’d like to understand why. They are also kind of doing their own thing, so I just wanted to present an idea here – just something to think about.
.
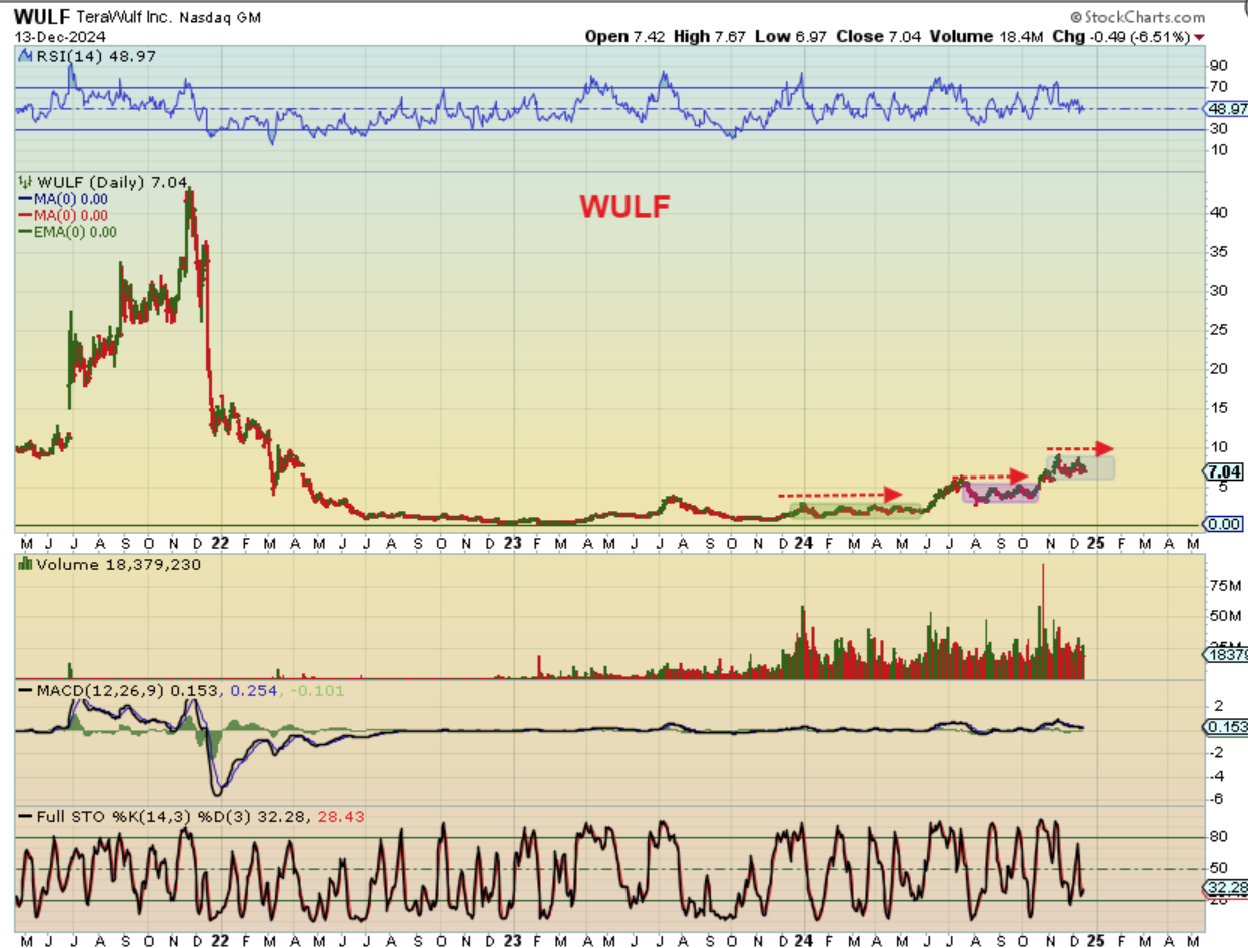
Take WULF for example: It is coming out of a base and makes gains, consolidates, makes gains, consolidates, etc. That may continue until finally buyers just overwhelm it and EVERYONE wants Crypto stocks. Then, at that time, this may get steeper and run higher much more quickly. Anyone that bought and held WULF down at $1 now is holding it at $7. Over time they may be holding it at $20. So that is the BUY & HOLD during good times and bad viewpoint. So let’s take a look at another view point.
.
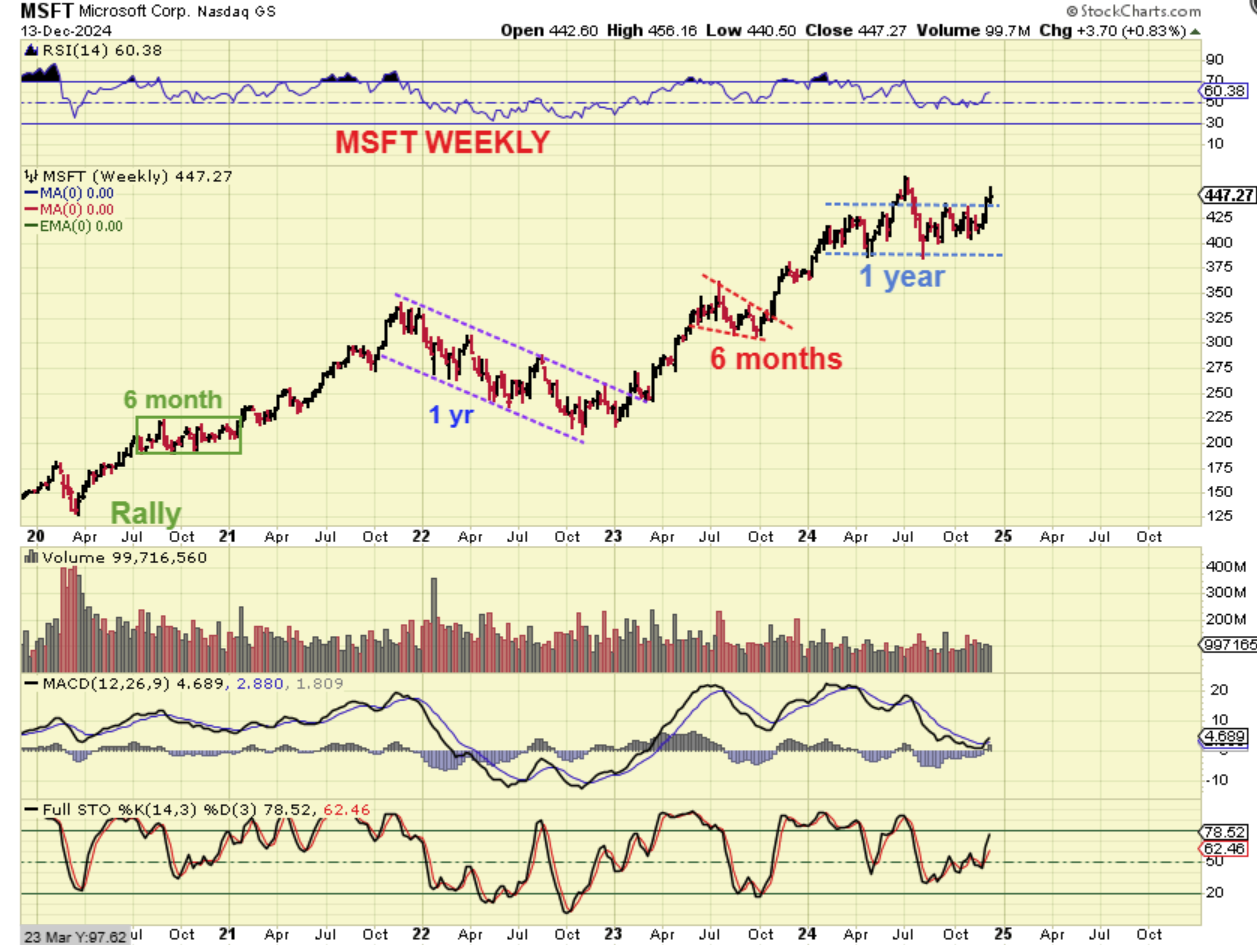
So let’s take a look at another view point. We all watch MSFT, AAPL, GOOG, NVDA, etc run and we feel that they always run straight up, and they double and triple. Do they? No they don’t, but it is that ‘buy and hold’ for 5-10 years that pays off, despite choppiness.
.
MSFT 5 year weekly – Even on the weekly chart it is easy to see that MSFT ran from $125 in 2020 and is almost $500 4 years later, Awesome gains!!…BUT…was it straight up? Was it easy to hold every week?
– Look at 2022 to 2023 when it dropped from $335 to about $200, chopping lower all-year-long.
– Even 2024 wasn’t great for MSFT, right? We are in a general market bull run, and MSFT chops from $400 to $450 sideways all year long? Also…
.
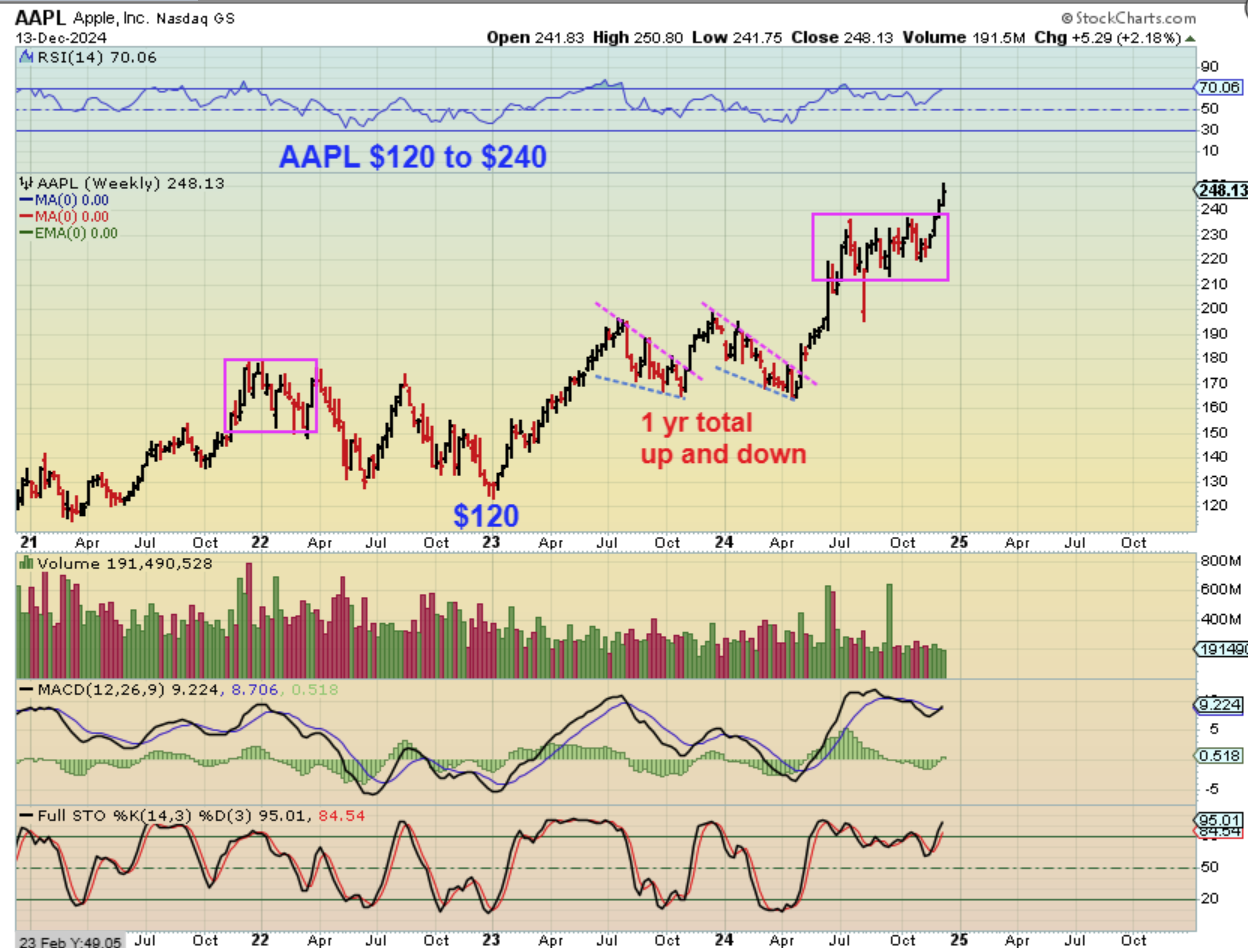
AAPL 4 year weekly –
– AAPL ran from $120 to $180 and back to $120 in 2 year (no gains 2021-2022).
Now it is running again, but
– look at the end of 2023 into early this year, it chopped and dropped for 1 year total. that means again, No gains from April 2023 to April 2024. None for 1 year again.
– Then a rally April to July 2023, more chop and now new highs. So my question is…
.
So my question is: If MSFT, AAPL, NVDA, GOOG, and all of those other great stocks had choppy non-gaining months and even years, but then they find buyers and run on to make new highs again and again over time, Will RIOT, MARA, WULF, HUT, etc do that too.
.
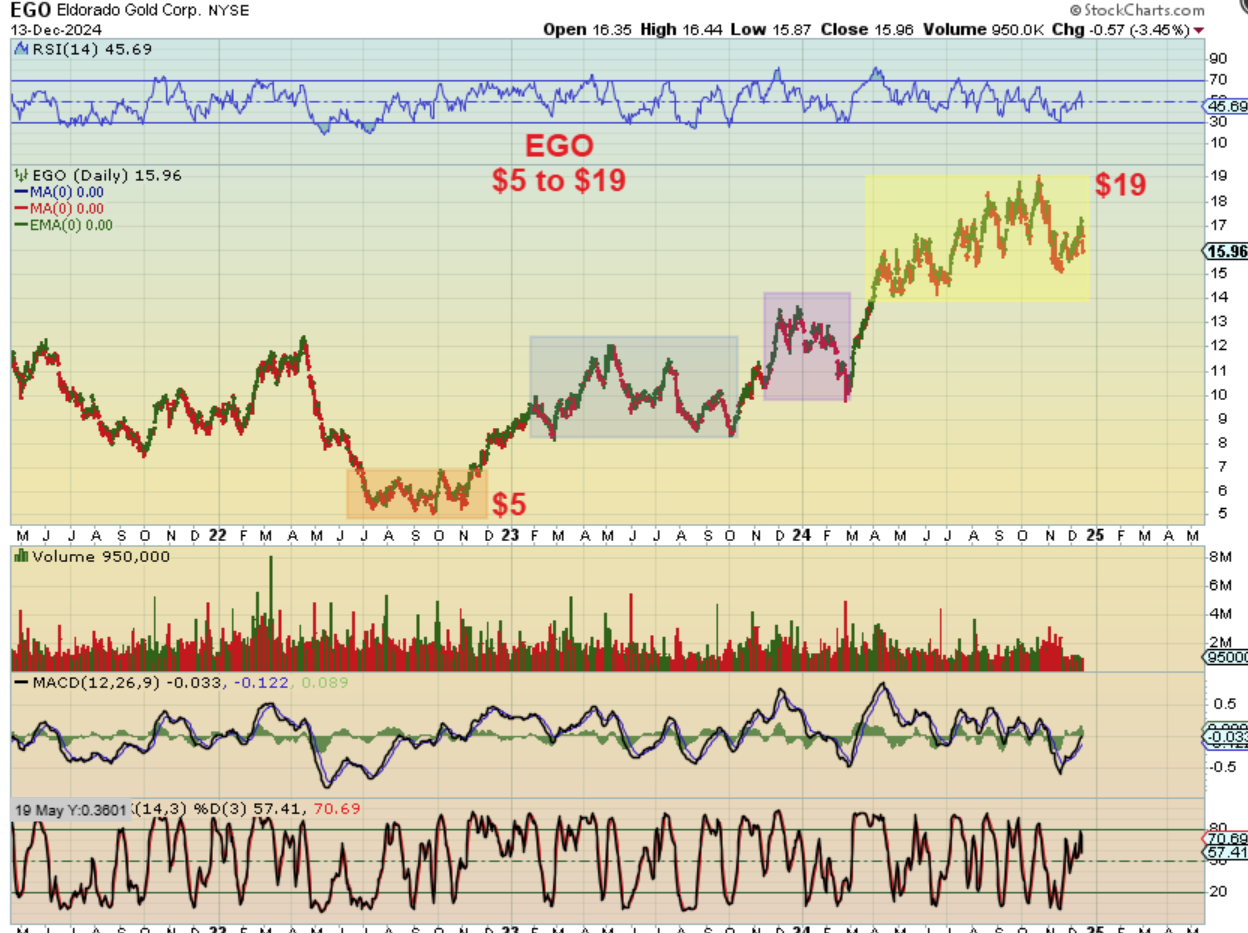
We know that EGO, AEM, AU, HMY, KGC, etc. etc. also used to drive us crazy with the constant choppiness in between rallies, but look at the gains over time. For EGO, $5 to almost $20 is 300% Oct 2023 to Oct 2024, but that choppiness is aggressive here too.