Wednesday November 20th
DATA – Today is Wednesday and I just wanted to start todays report with the Data that is scheduled to be released this week over the next 3 days. Today seems rather uneventful.
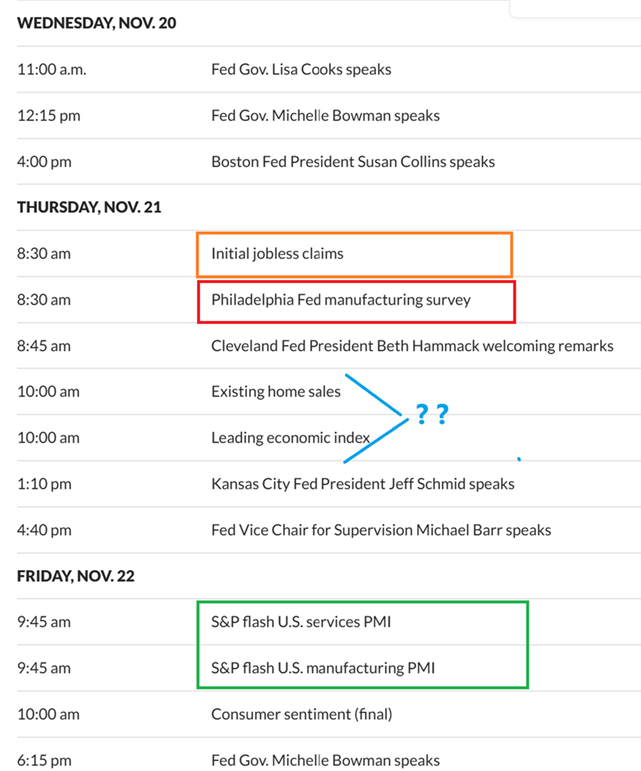
.
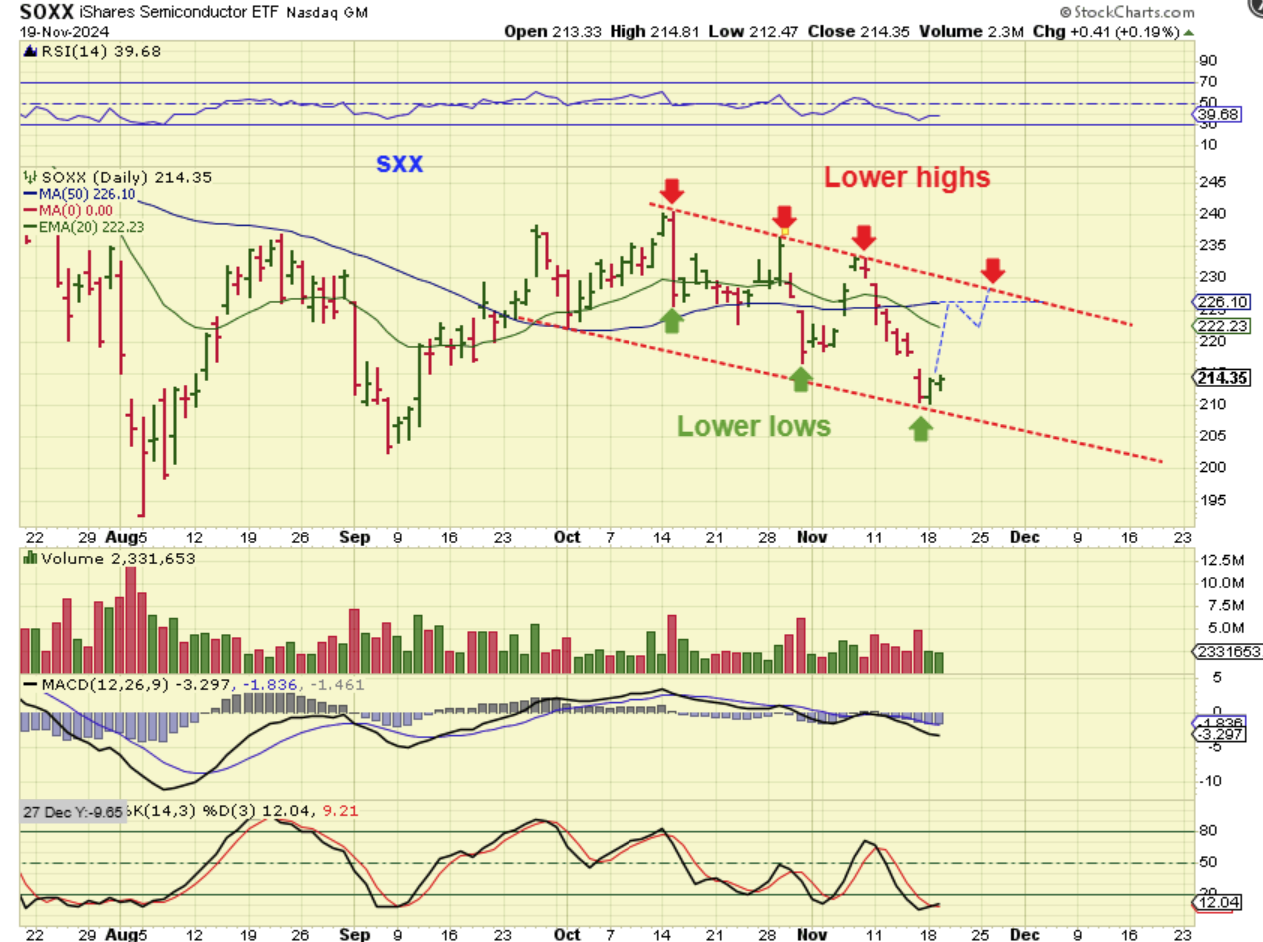
SPX – After Fridays gap down sell off, we had a reversal higher this week at the 20 ema. The SPX & NASDAQ do not look bad, but the SOXX has been a concern…
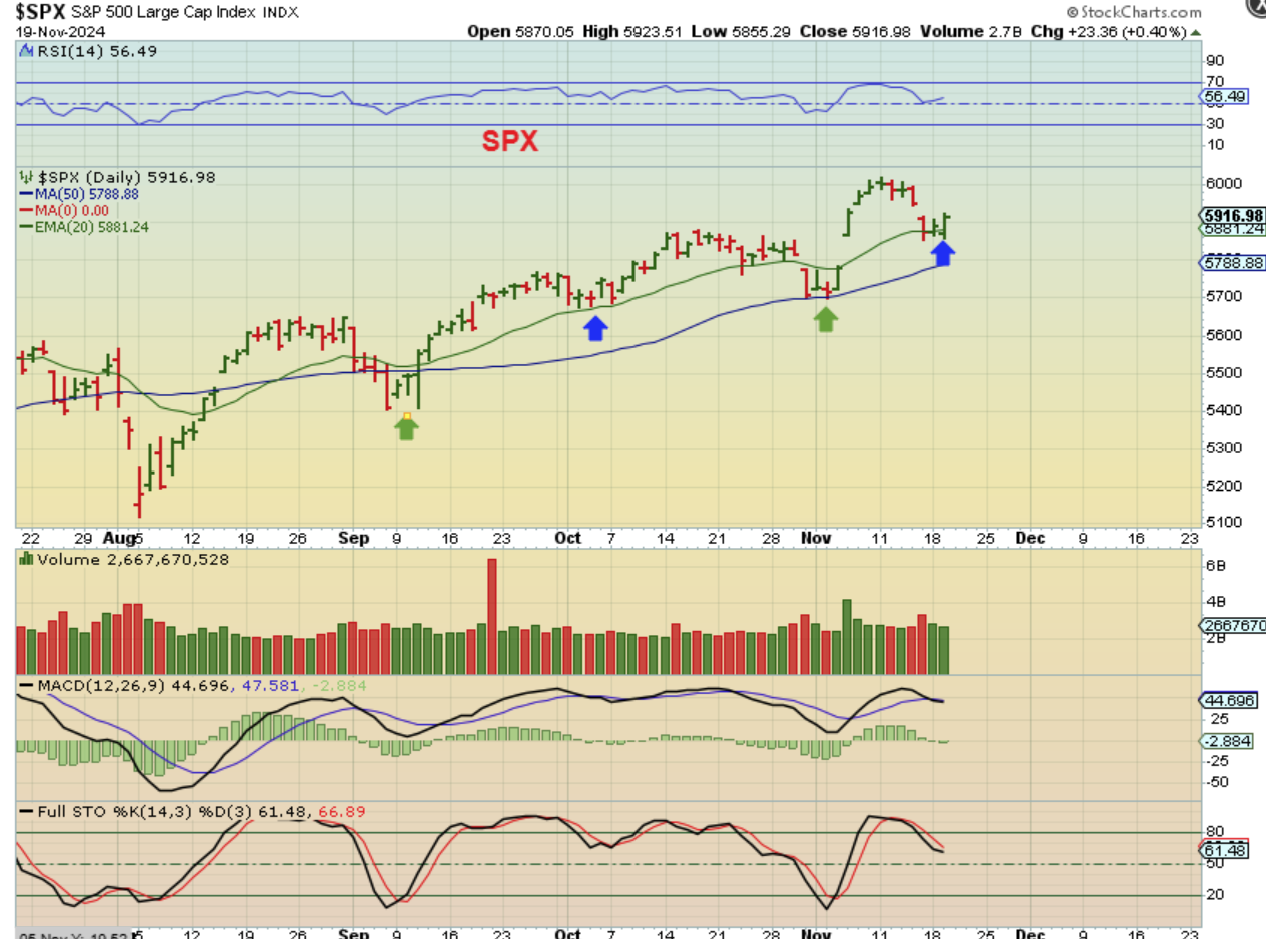
.
From Yesterdays report:
THE SOXX – This reversed higher too, but is this now bullish? Not at all. It is oversold so a bounce can play out, but as mentioned in the weekend report- we have a failed DCL and lower highs and lower lows. It is very hard for me to see that this will repair itself. THIS BOUNCE SHOWS A POSSIBLE 226 AT THE 50 SMA.
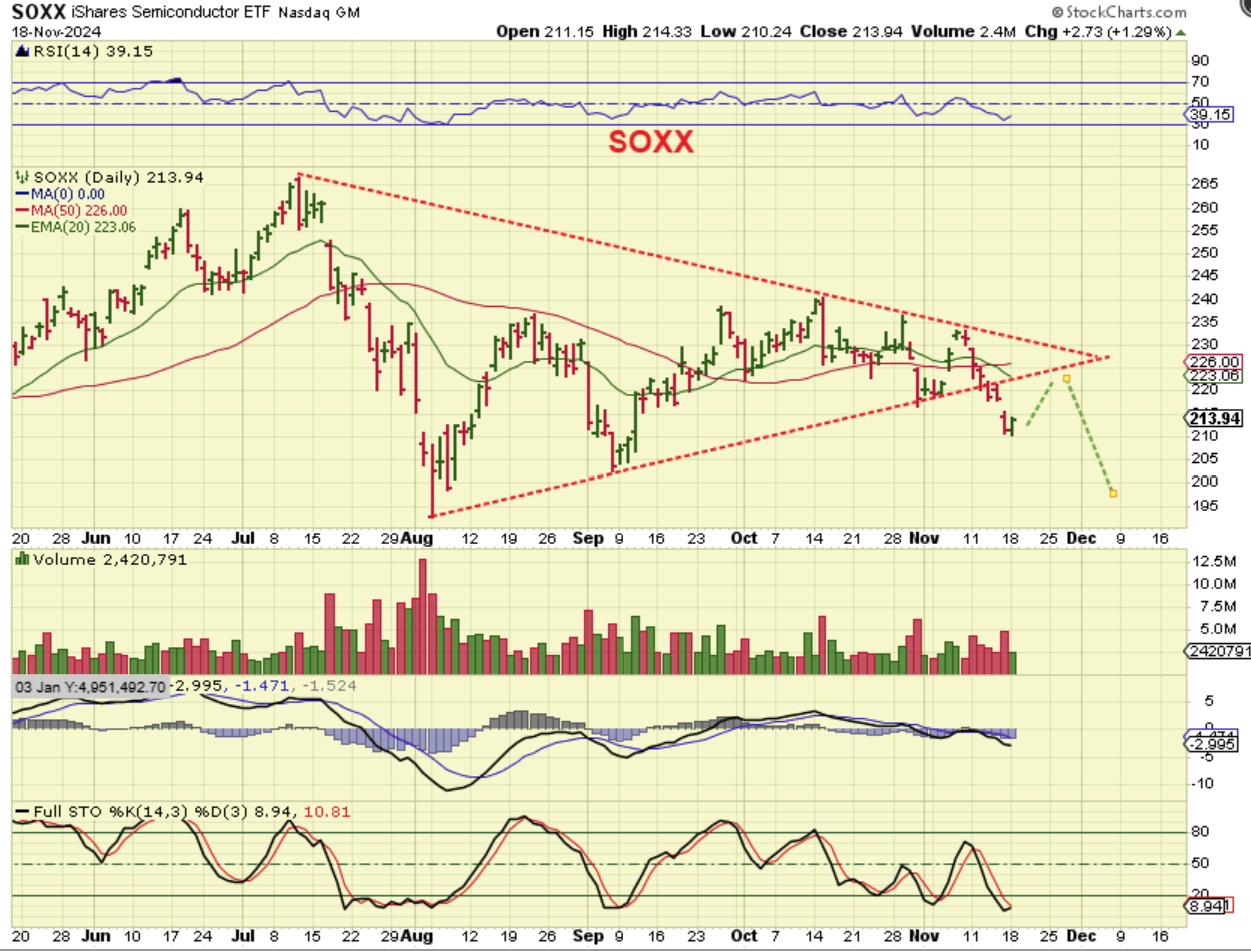
.
The SOXX can continue to bounce to that 226 (50 sma) area, but I do NOT expect a higher high.
.
ON TUESDAY I SAID:
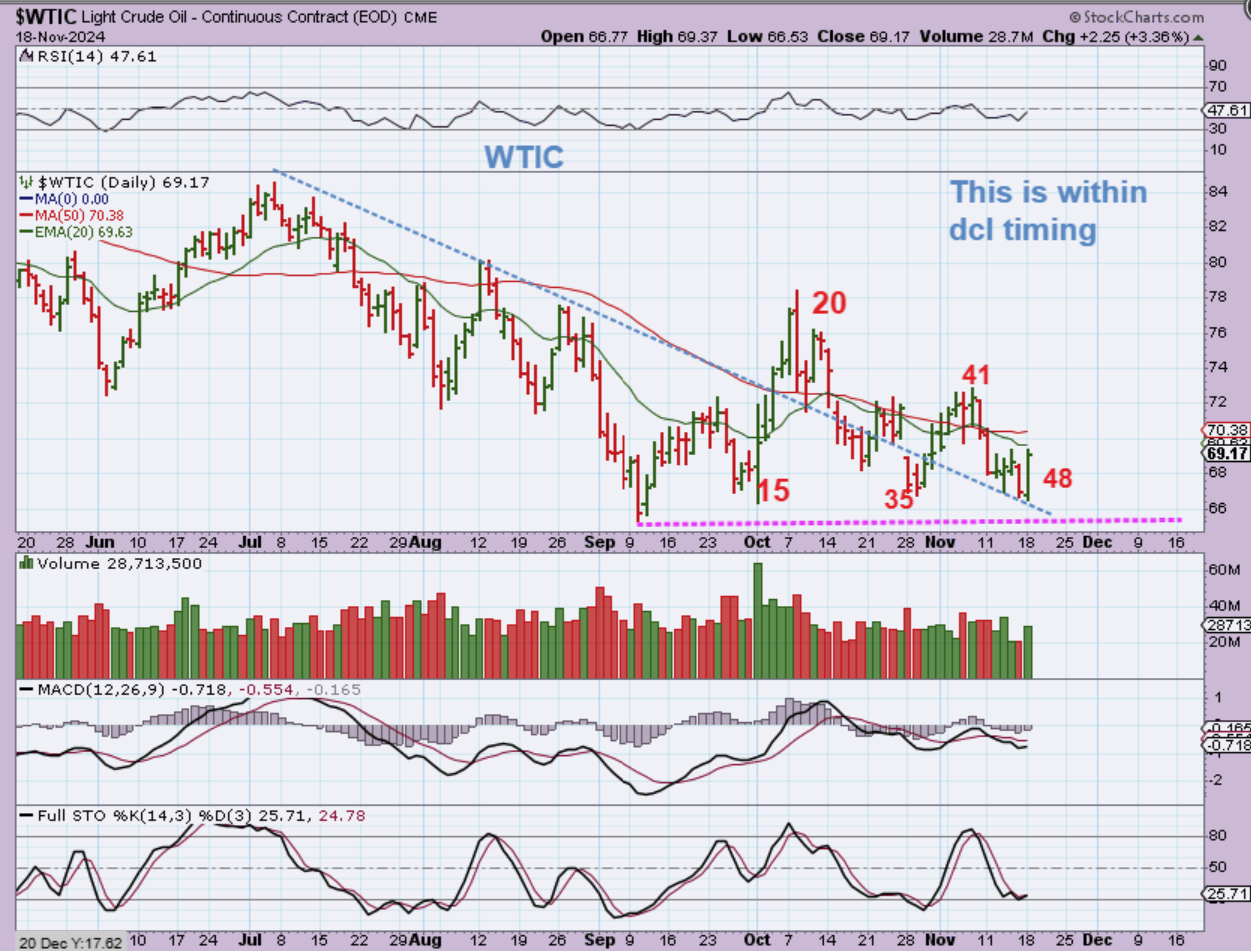
WTIC – Day 48, is this our dcl? If we have a dcl here at day 48, which is very much within the timing for a dcl, then that indicates that we do have an ICL in September. That also lines up with the OIL stocks. As pointed out in past reports, many oil Stocks and the XOP/XLE have become Bullish and didn’t follow Oil to the lows.
.
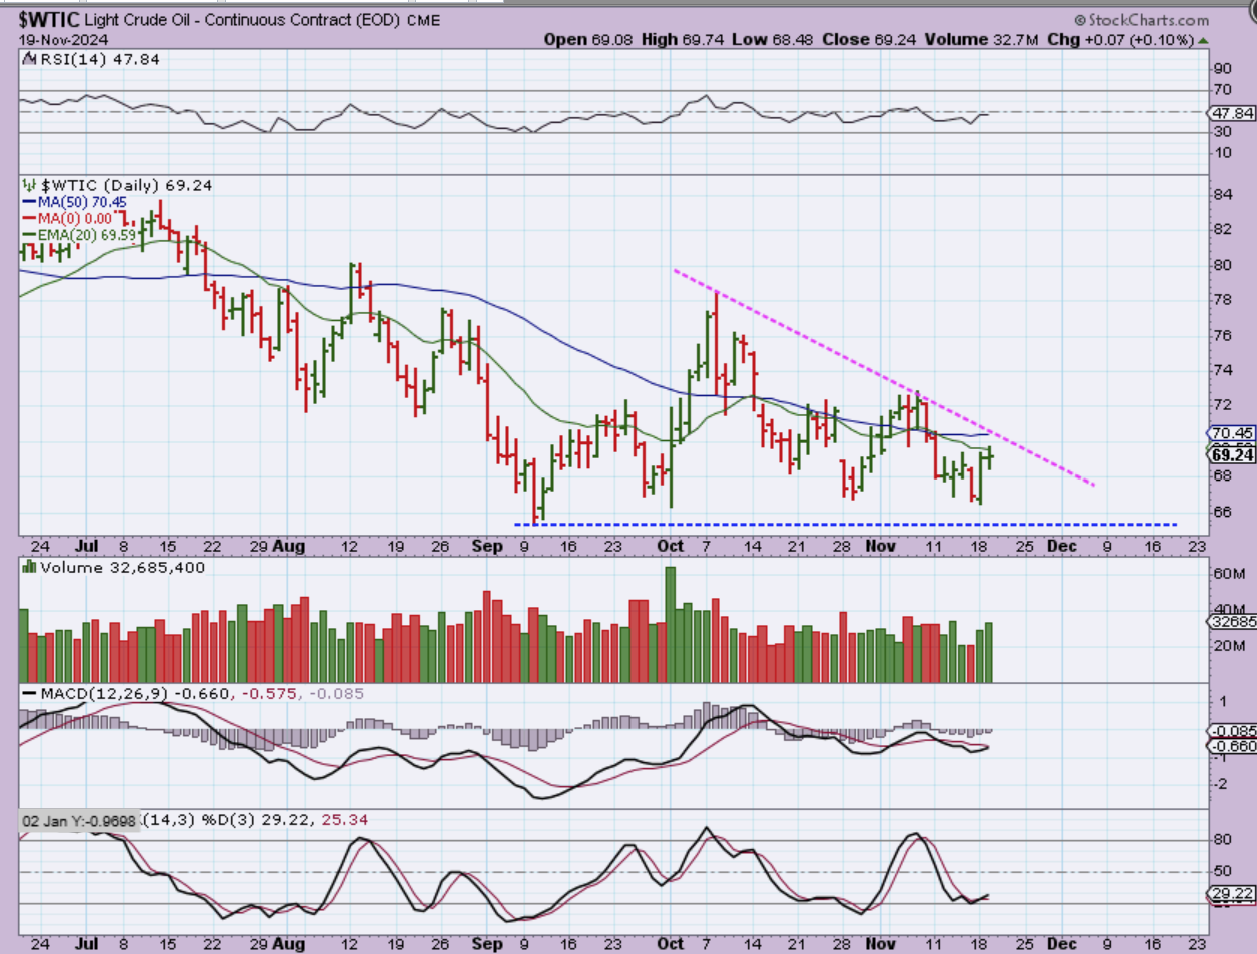
WTIC – Oil stalled at the 20 ema, so far, but this still might be day 1 after a dcl. Time will tell, but the Oil stocks remain more bullish that Oil.
.
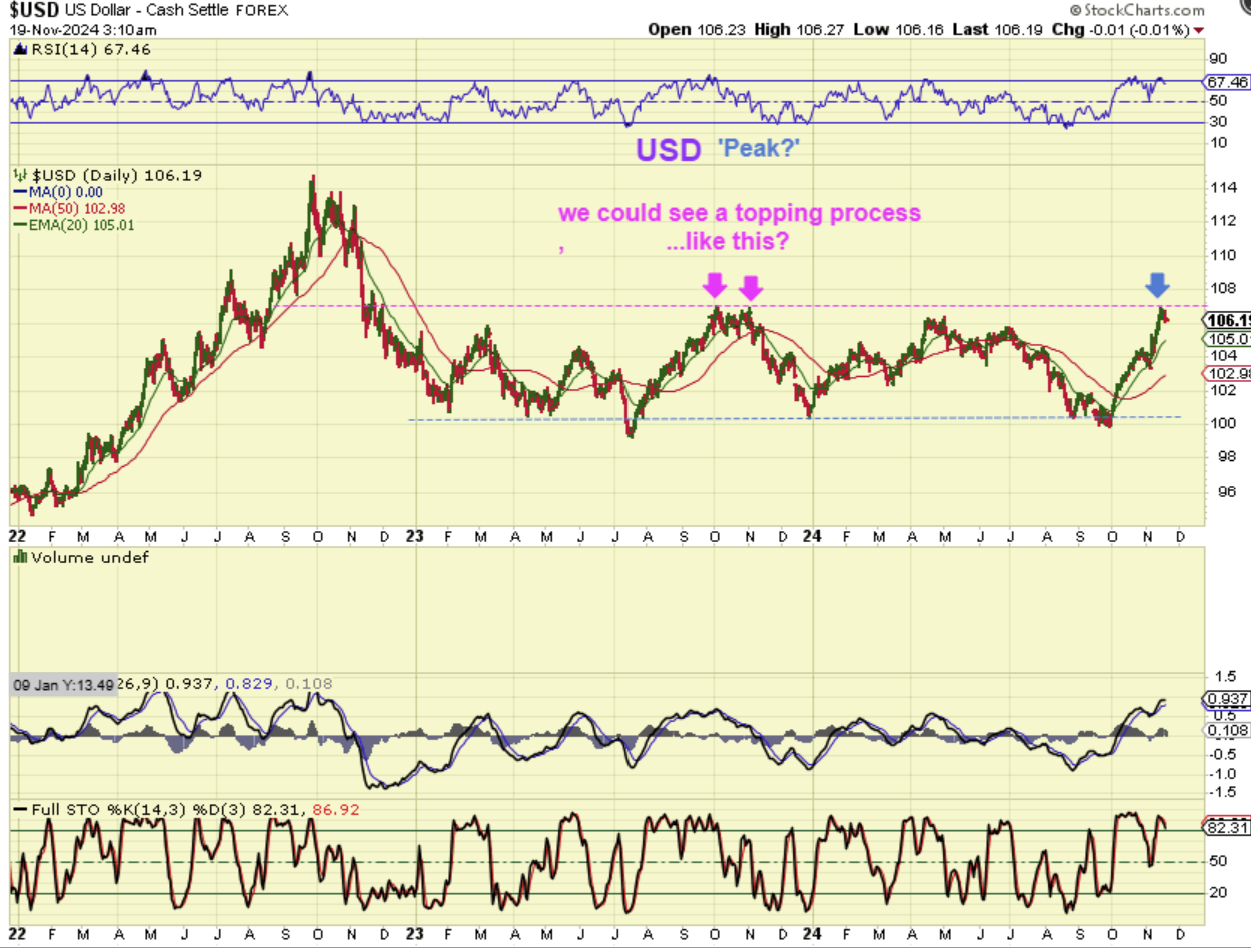
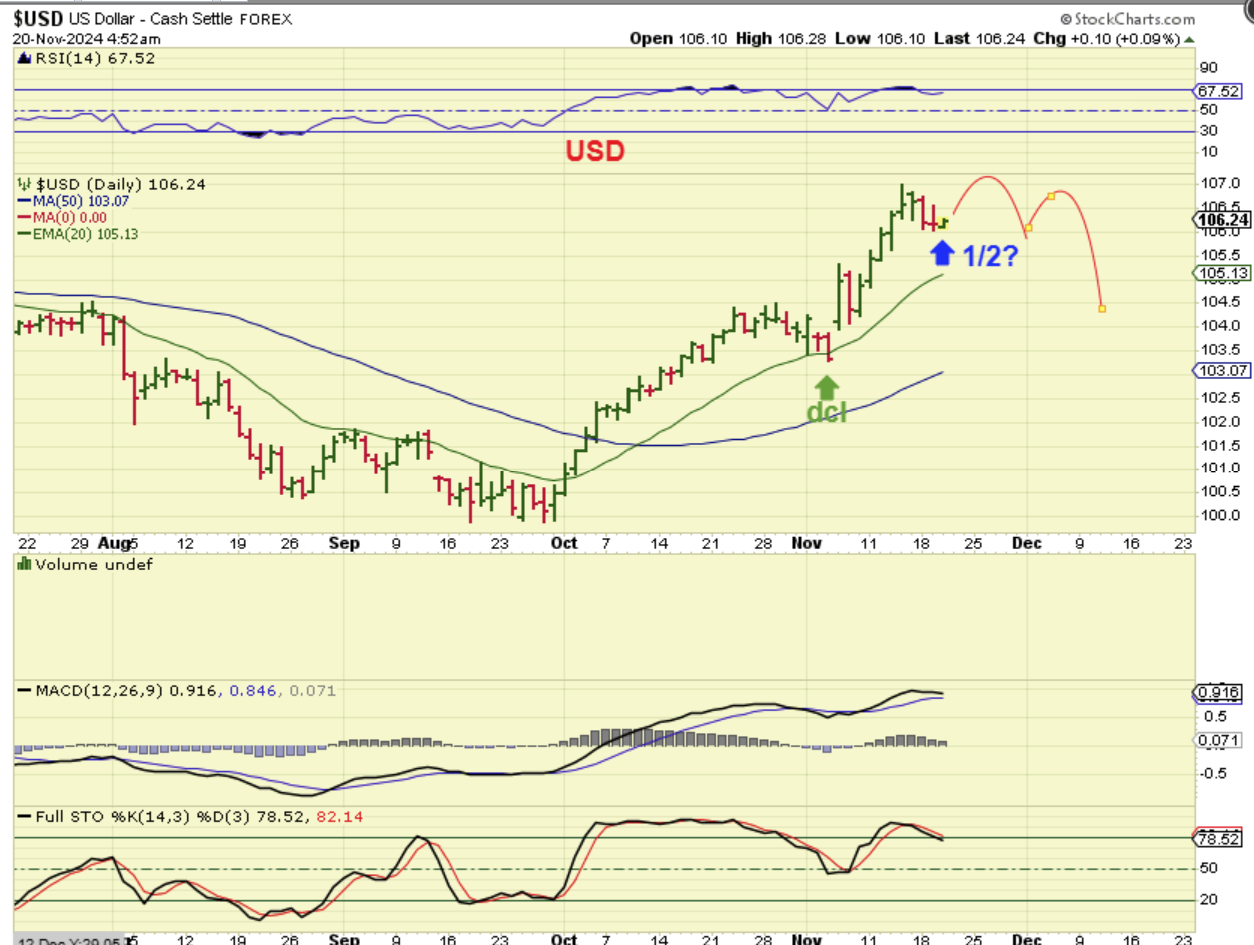
THE USD reached a resistance point and started to pull back. It is possible that this becomes the peak at resistance, but we may see a ‘topping process’ in this area that allows Gold to put in an ICL. Read the chart.
.
So The USD dipped lower , but that may just be a half cycle dip or pause. This can go higher or start that topping process that I pointed out.
.
GOLD has a day 14 peak, of a 25 day daily cycle. So with this being a R.T. Daily cycle, it doesn’t really match the criteria for a drop into an ICL. Therefore…
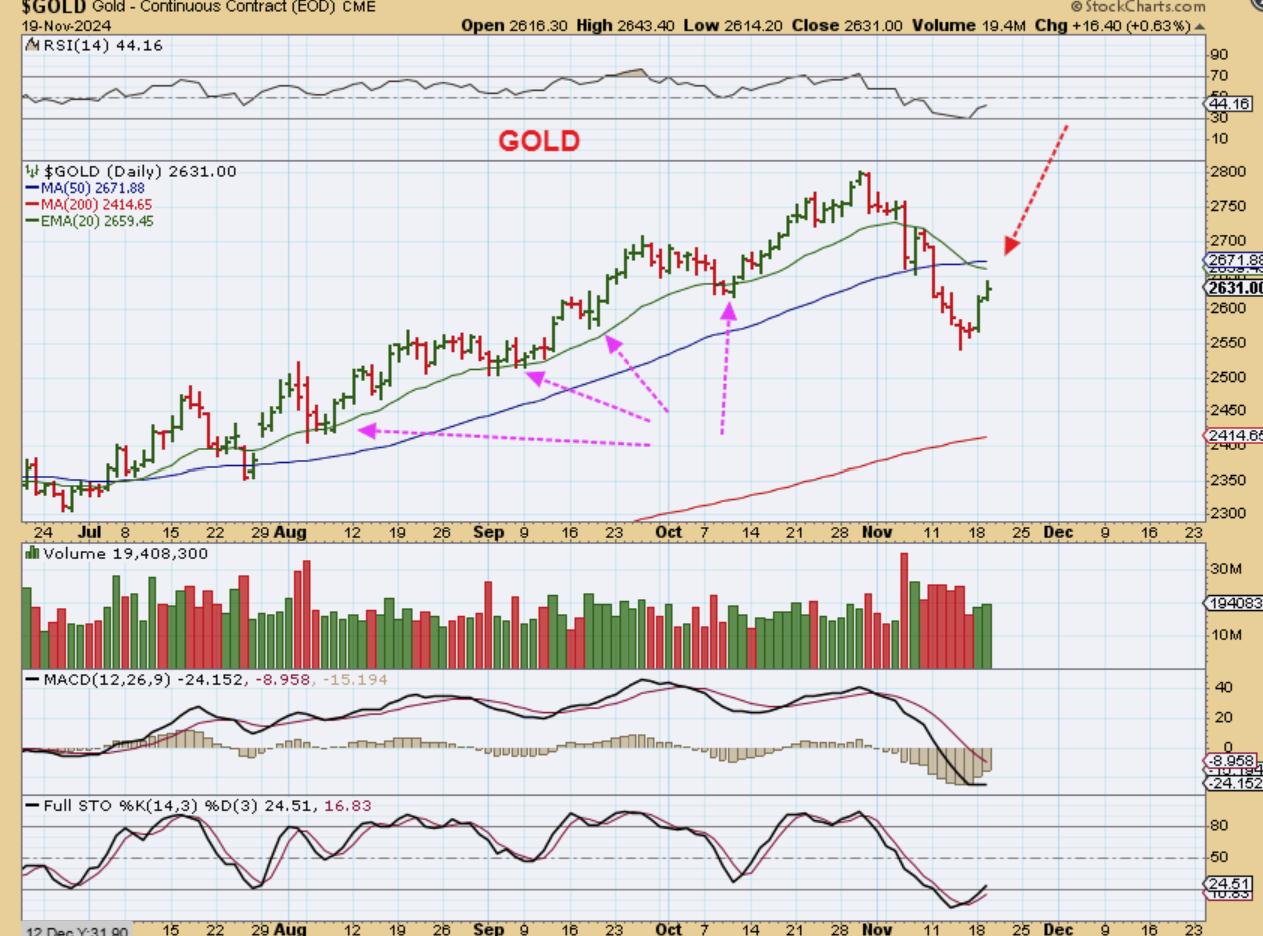
.
I MENTIONED THIS IN THE WEEKEND REPORT:
An ICL often forms from an a-b-c type of a drop, so 1 more daily cycle could look something like this on the weekly chart.
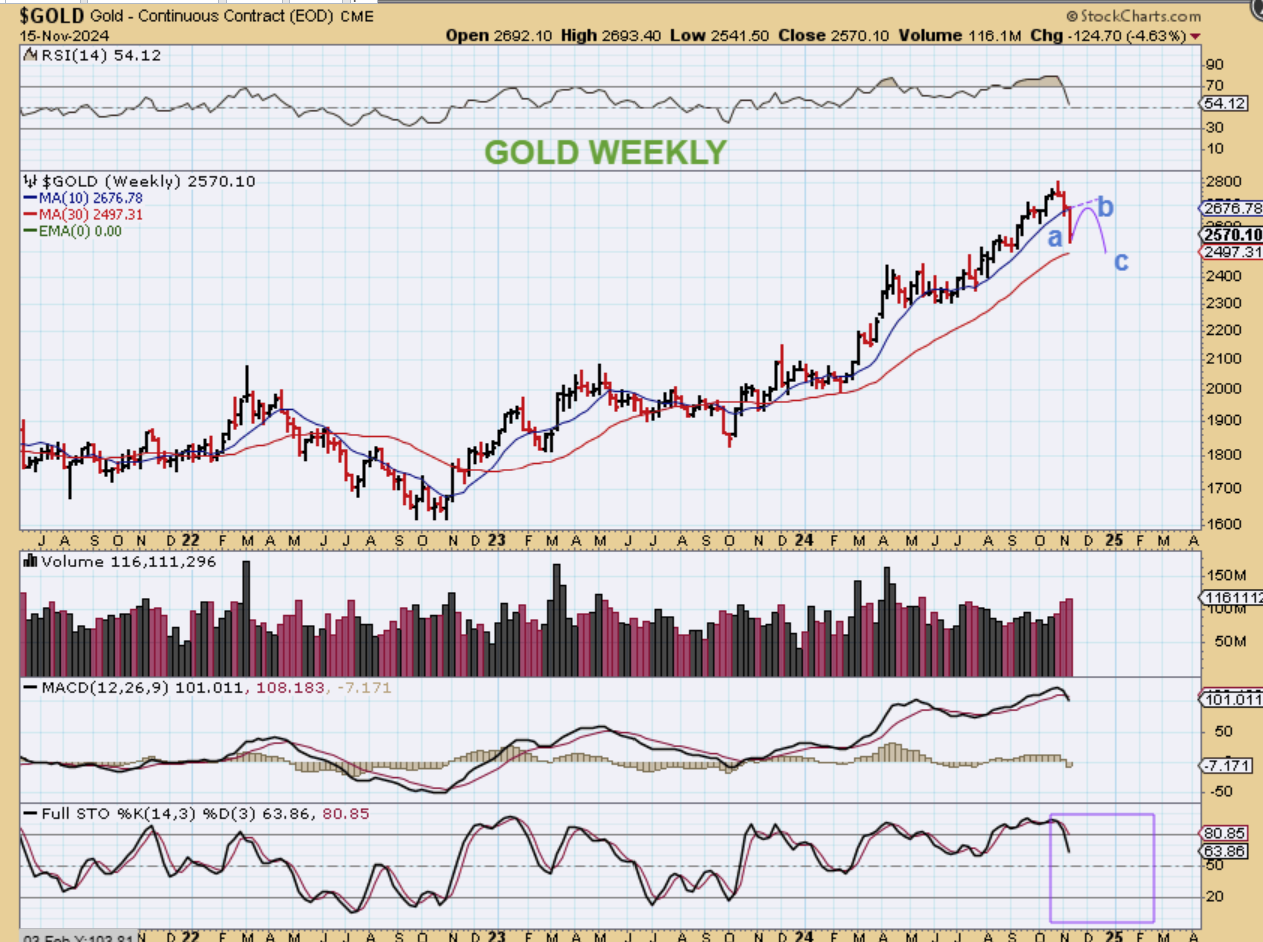
.
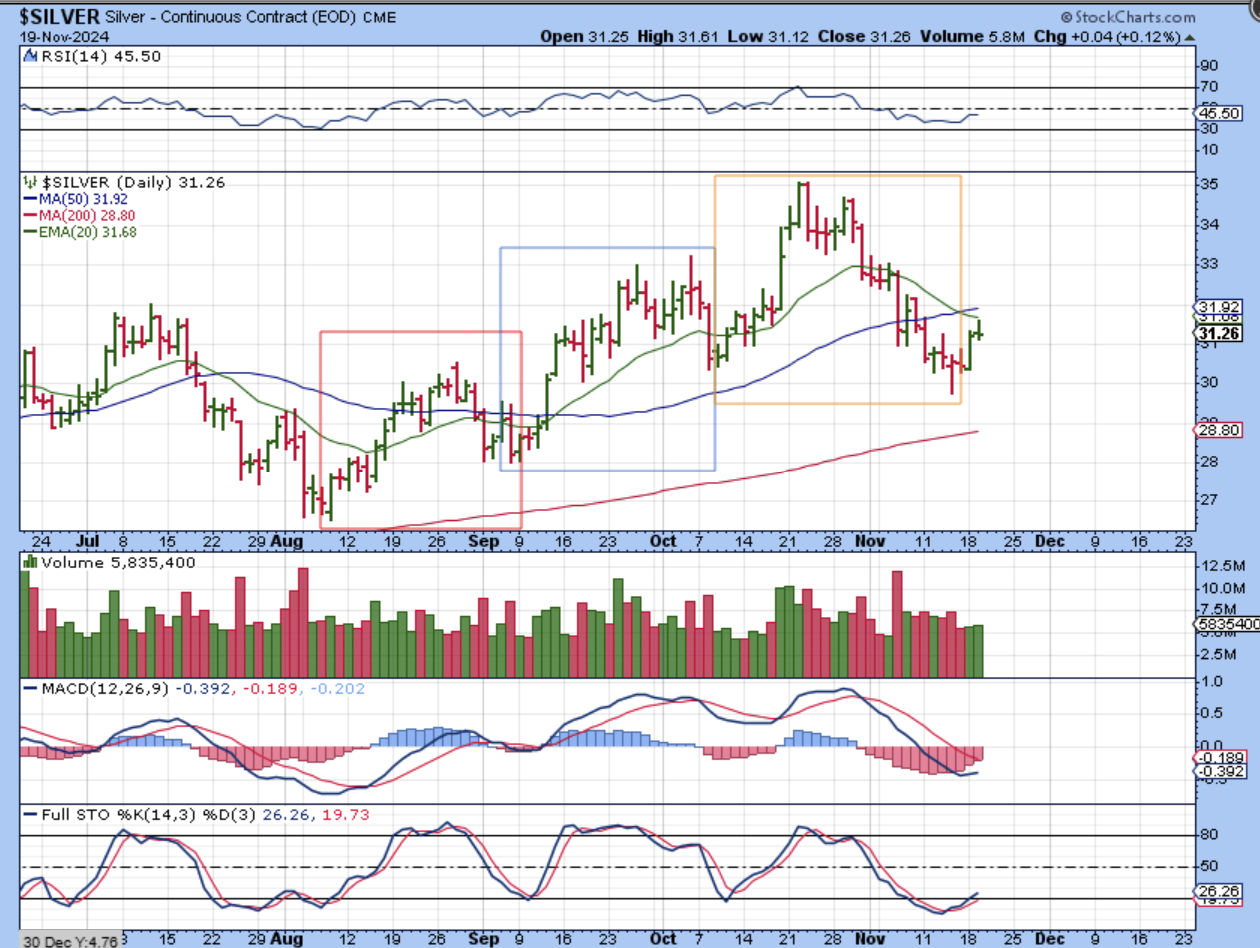
SILVER did a pop & drop yesterday. This is L.T., but it was only the 3rd daily cycle out of the lows, so it seems more than likely that we will at least get a 4th L.T. Daily Cycle.
.
From Yesterdays report:
The GDX reversed after a steep sell off too. Notice this…
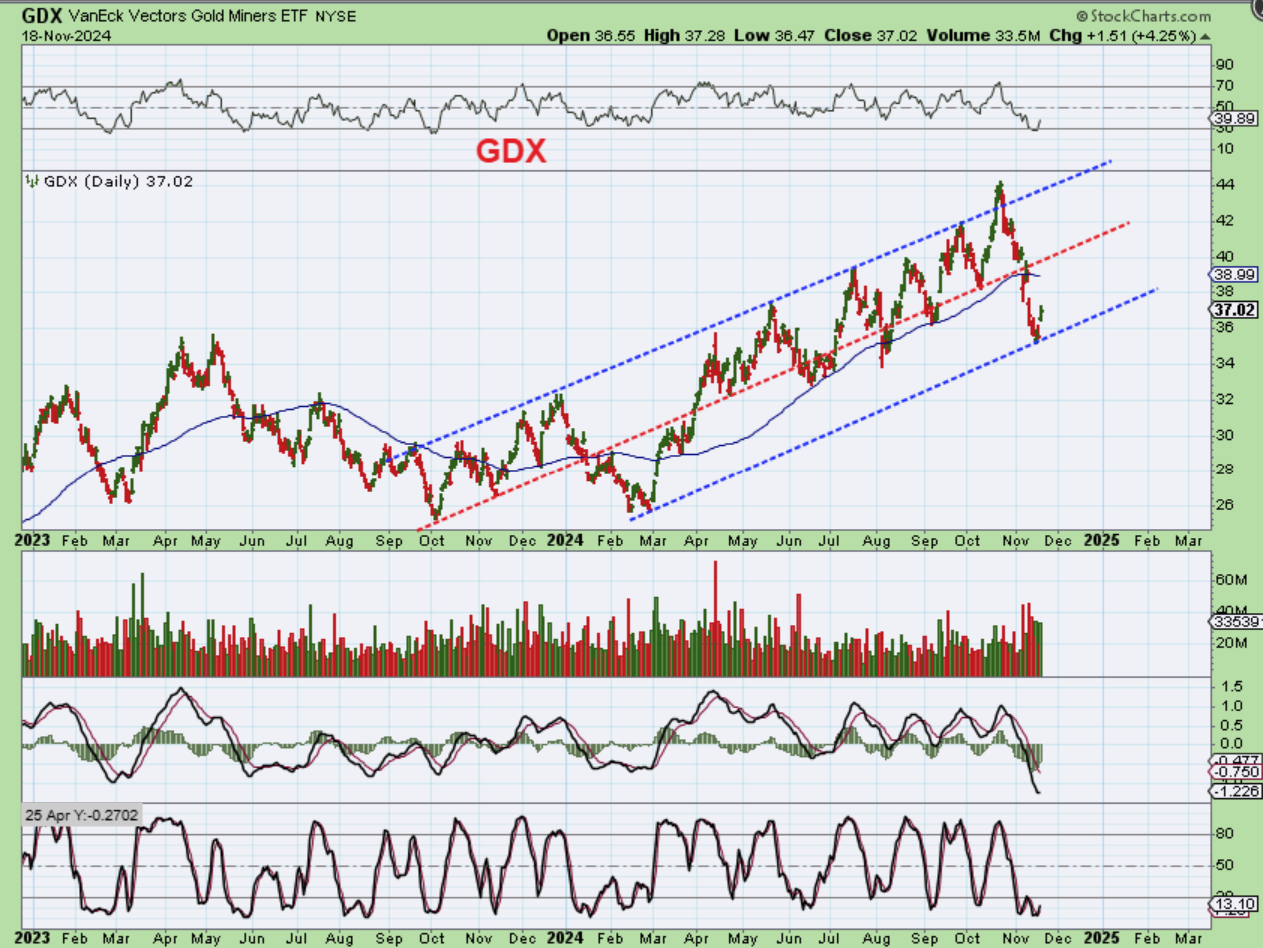
.
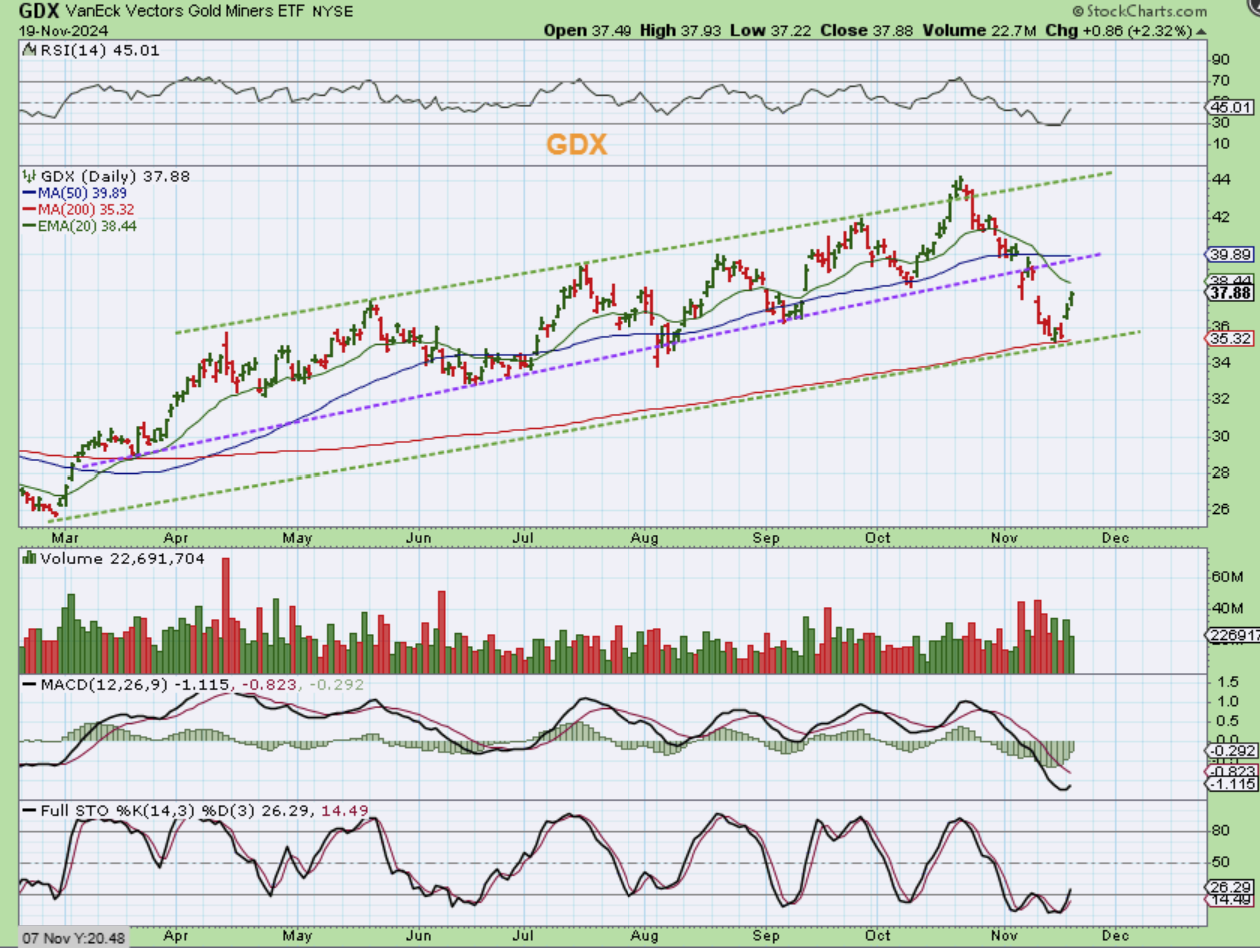
Notice that The GDX reversed right at the 200sma.
This really looks like an ICL drop to me, and it was L.T. with a peak on day 9 too, but with Gold and Silver not looking like an ICL, I have to expect a good bounce and then a little more selling for the Miners before the next rally takes place. Maybe we’ll just see a double bottom at the 200sma? I mentioned that you can buy the reversal at the 200sma, but we may see price come back down here.
.
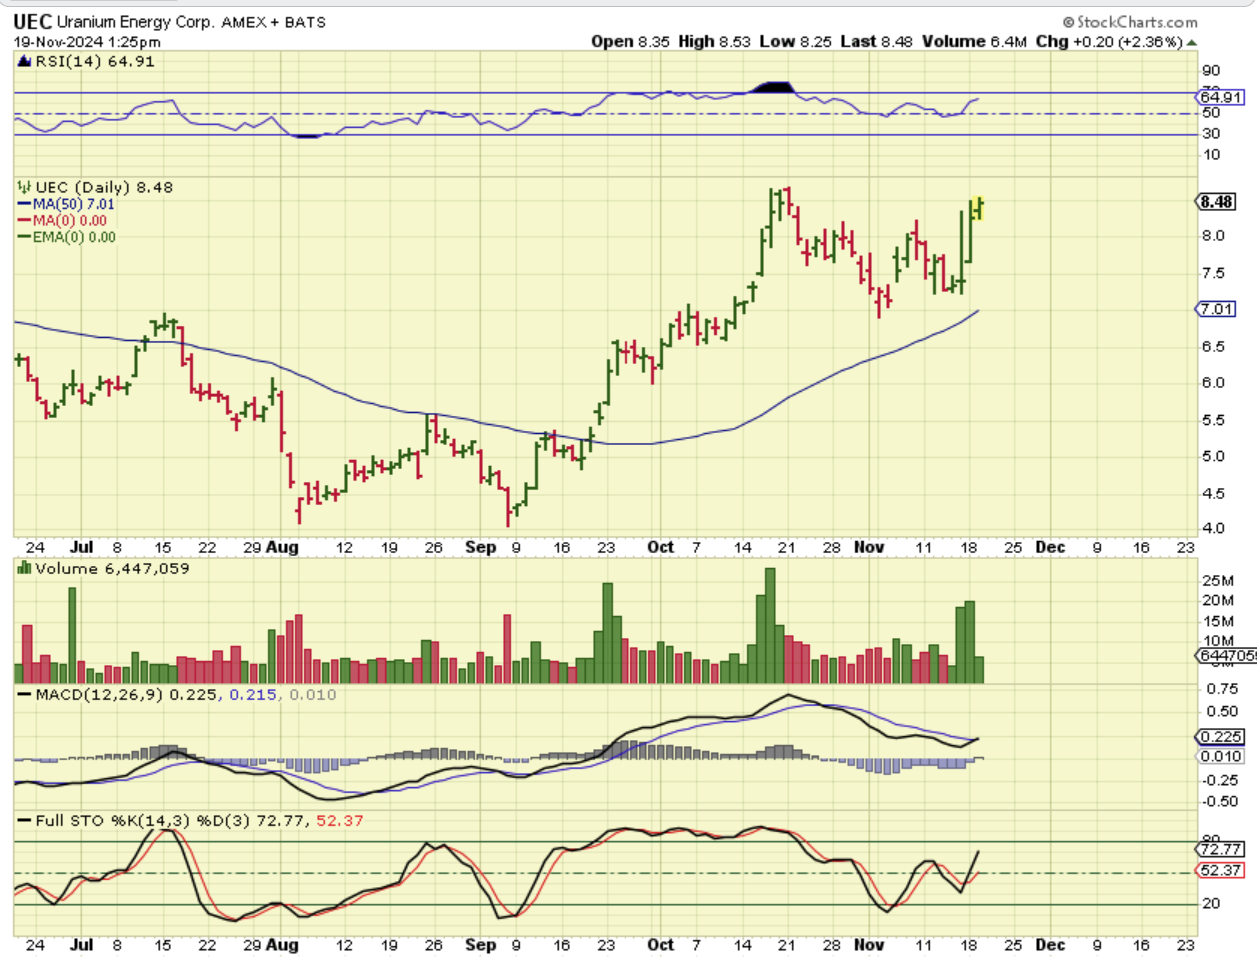
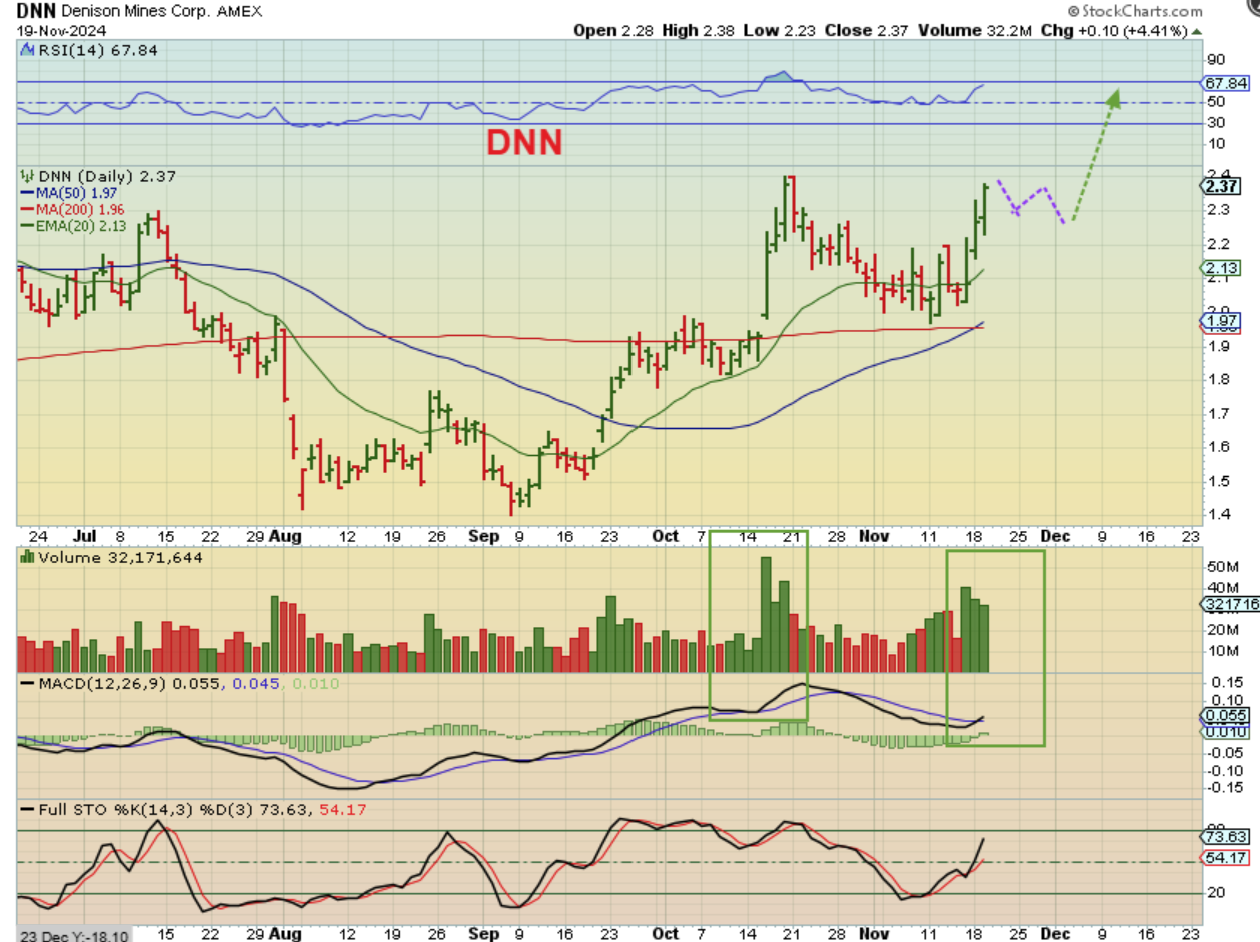
UEC I just wanted to point out the bullish set up on Uranium Stocks. Many have a similar pattern to UEC (DNN, UUUU, CCJ, NXE, etc). After a strong run up out of the September lows, they consolidated and UEC formed a cup-like pattern. THEY ALL LOOK LIKE THIS AND THEY MAY BREAK OUT AND RUN AGAIN.
.
DNN – They all have this pattern, with volume increasing on the recent run up.
.
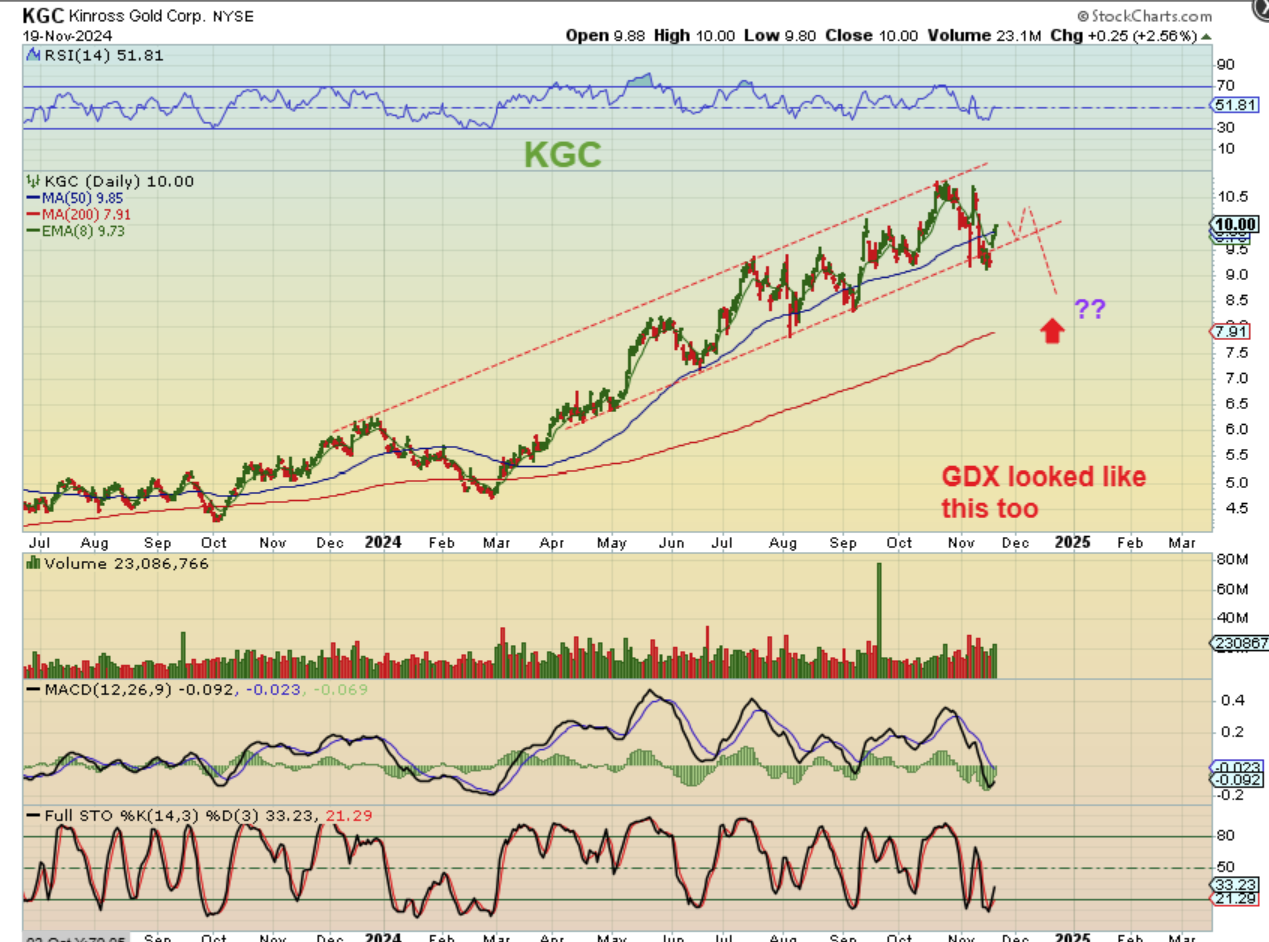
Keep in mind that during a sell off like we have seen in the Precious metals, it gets boring, but this is always a good time to watch your favorite miners with expectations as to where they may land. We could see a bounce now, but stocks like IAG, KGC, HMY, AU, AEM, etc have made very good gains. A dip may offer a nice entry in December, so we’ll discuss that over time too. For example:
Recently we watched GDX dropped to the 200sma after it formed a steady channel higher. Could others follow?
.
Could others like KGC follow? This looks very similar to what The GDX ETF looked like recently. This is what we’ll be looking for when the ICL develops. KGC is currently at $10, but a nice entry would be at the 200sma around $8.
Also Silver miners may set up very nicely when an ICL comes into play. Today, Bitcoin is actually trying to break to new all-time highs again, but the crypto stocks just seem to be consolidating the recent run up. Maybe they’ll push higher now that many are closer to their 10 sma again. We’ll see. I’ll discuss Bitcoin below, enjoy your Wednesday trading.
.
~ALEX
.
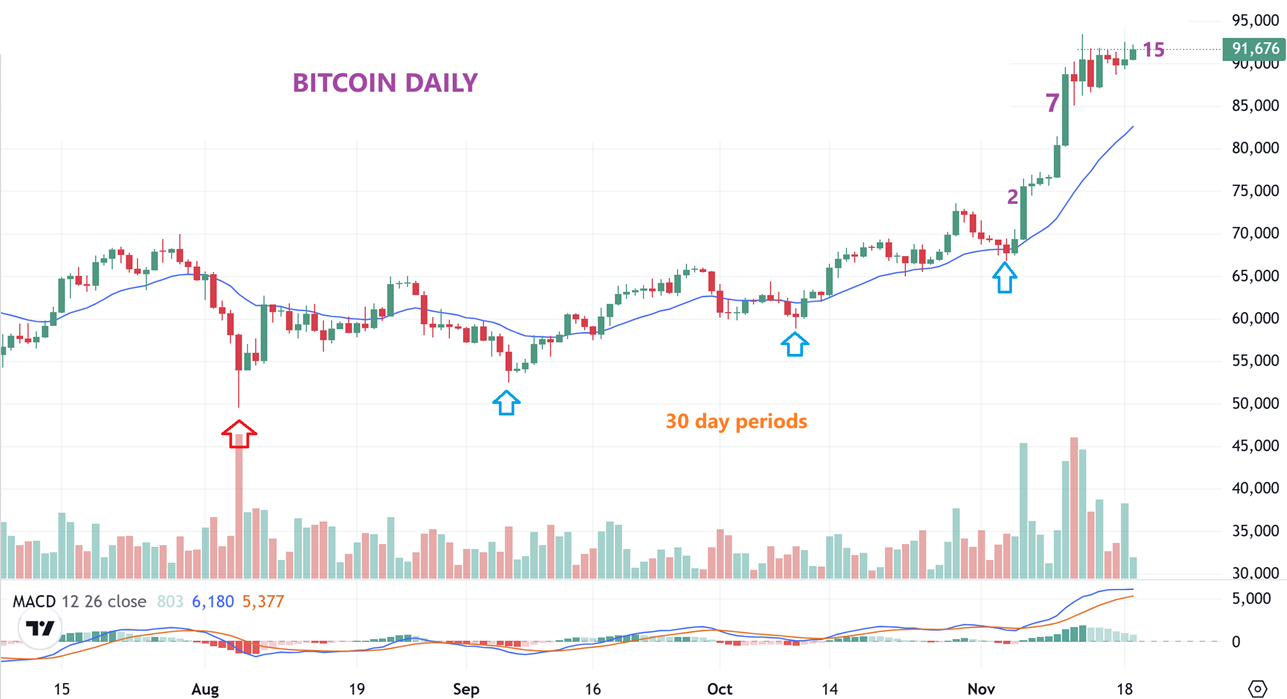
YESTERDAYS REPORT GAVE US THE CYCLE COUNT FOR BITCOIN: I said…
.
I have simply turned to a 30 day count for Bitcoin after that sharp capitulation low. We are now 15 days forward from the last low, so Bitcoin can climb higher, even if it were to pull back for a couple of days first. Right now it looks to be churning sideways and could continue to do that until it reaches the 20 ema too. It also looks like a bullish triangle, pennant, or flat top wedge. Bitcoin looks bullish. As you can see, Bitcoin did a pop and drop yesterday (that last candle is todays/ this morning).
.
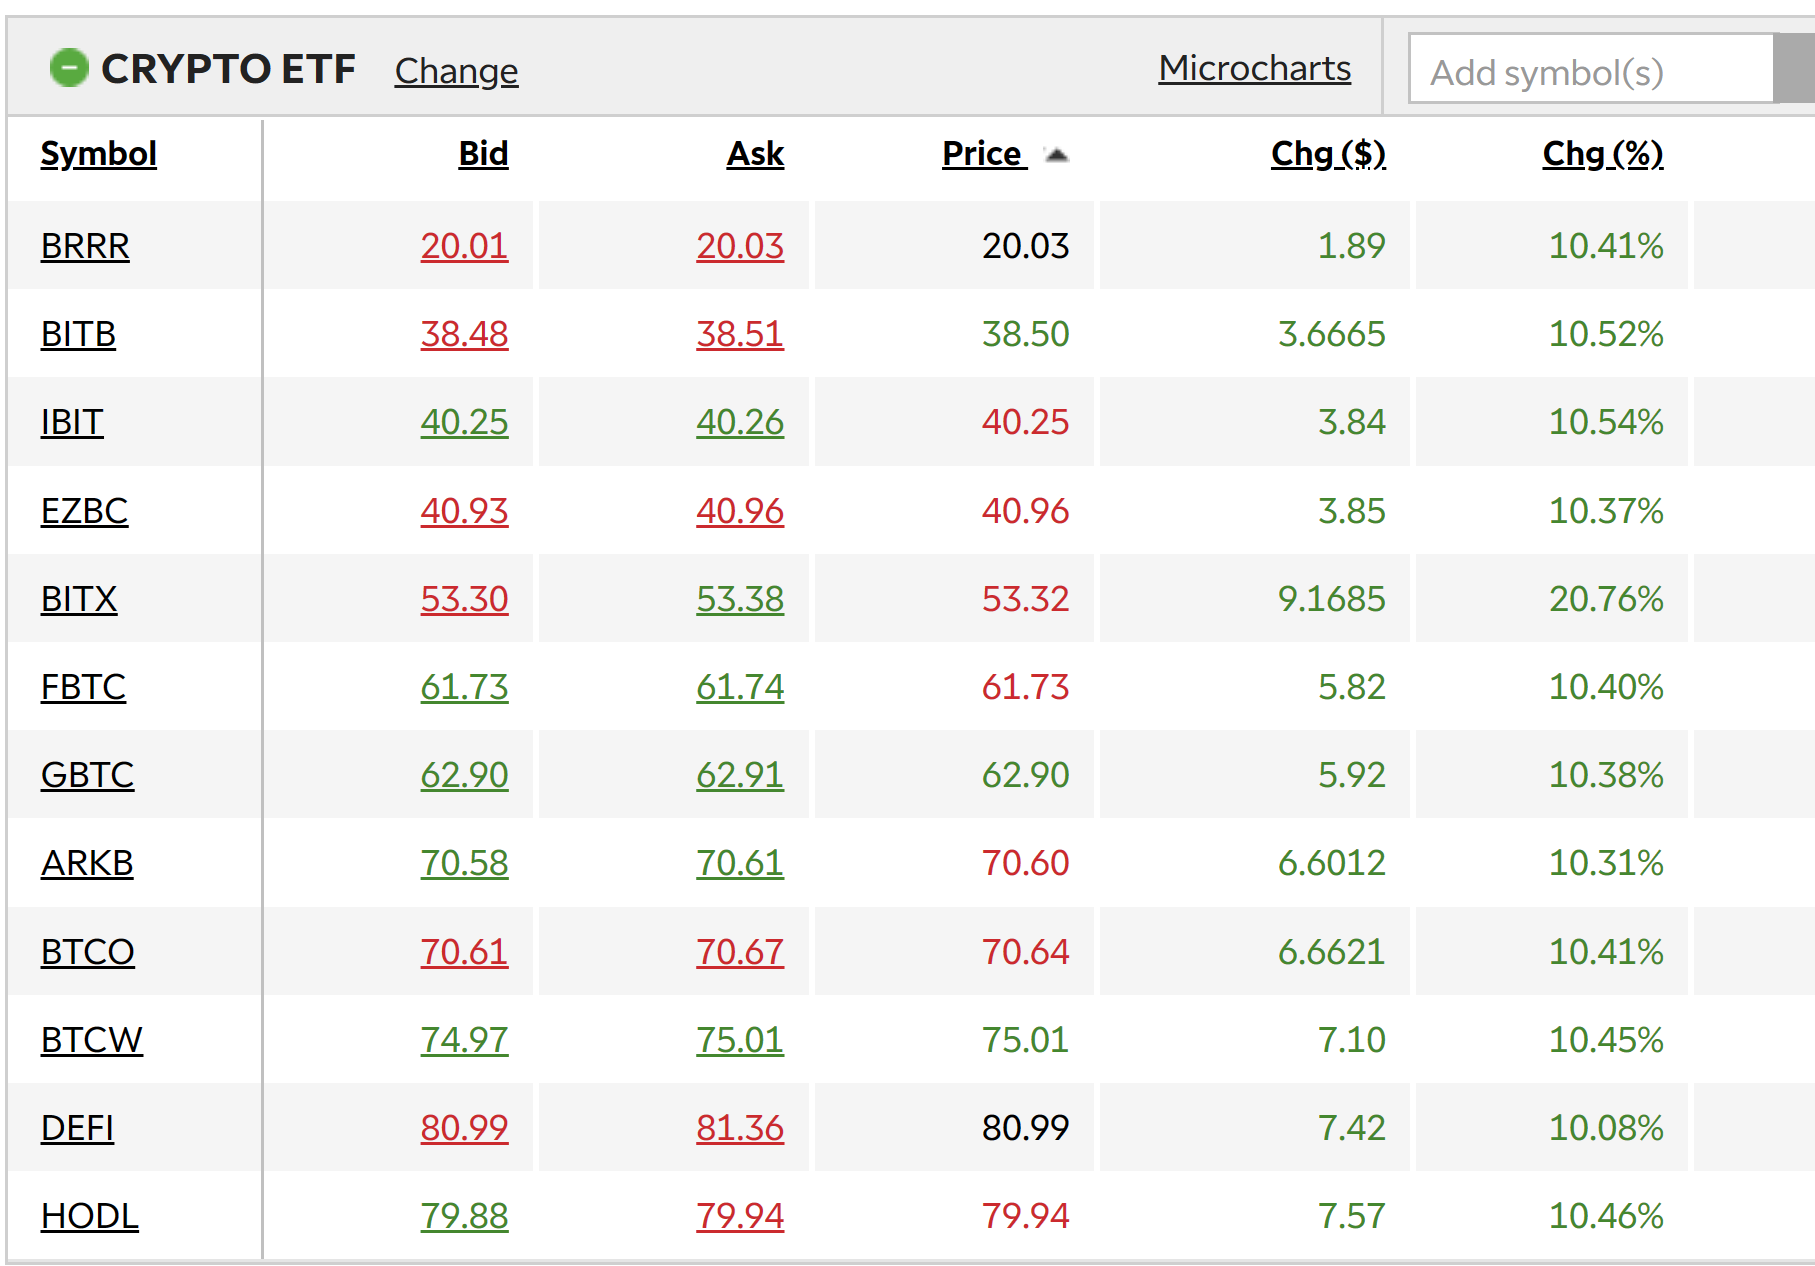
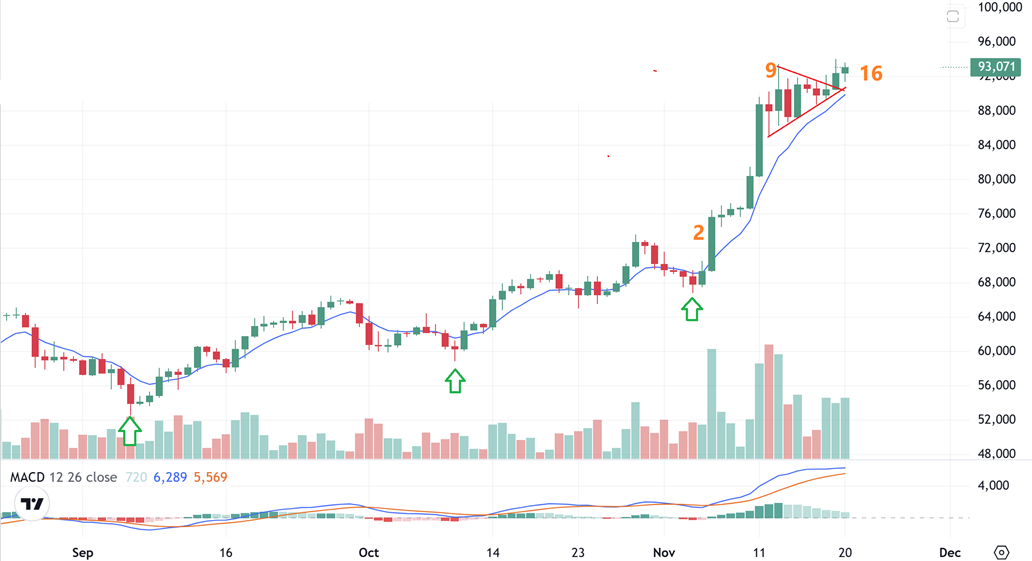
BITCOIN – On day 16 of a possible 30 day cycle count, Bitcoin slowly pushes higher and this honestly looks very good or bullish, but the crypto stocks need to play catch up. Most Crypto stocks seem to be in more of a consolidation phase as they chop around daily, but they are not alt new highs like Bitcoin. MSTR is a leader and CORZ, HUT, and a few others do look good, but most are not at new highs like Bitcoin, and that is a bit disappointing. The ETFs are steadier.
.
This is an old screen shot, so the prices aren’t here anymore, but it gives you a list of ETfs.