Tuesday November 12th – Wash-Rinse-Repeat
Some of our market sectors are rocketing higher, others are pulling back, but this is not anything new to us. We know that pull backs in a Bull Market usually become excellent buying opportunities, like we have seen with Precious Metals Miners and Crypto Miners in 2024, so we will discuss how the markets price action is really just more of the same, or ‘wash-rinse-repeat’. With Bull Markets, more buying opportunities will be ahead.
.
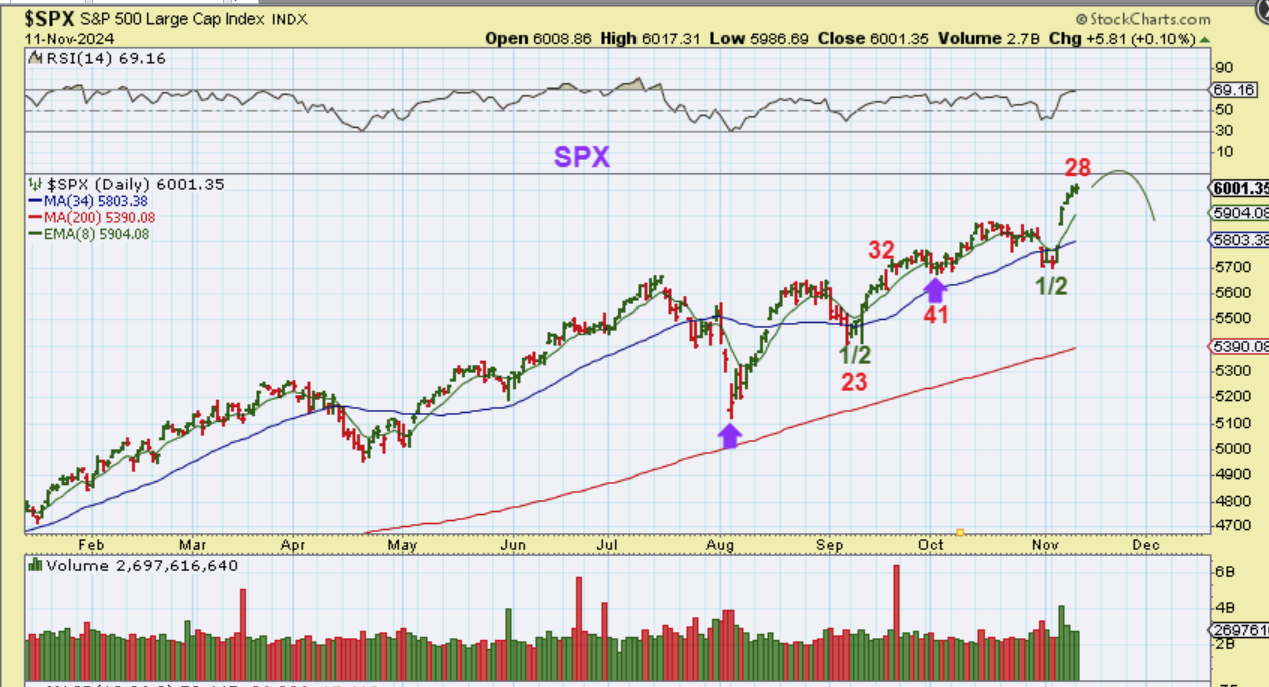
The SPX is in a bit of a runaway move out of the 1/2 cycle dip, and that started with the election results and the rate cut last week. The run out of the first daily cycle peaked at about day 38 with slow choppy price action.
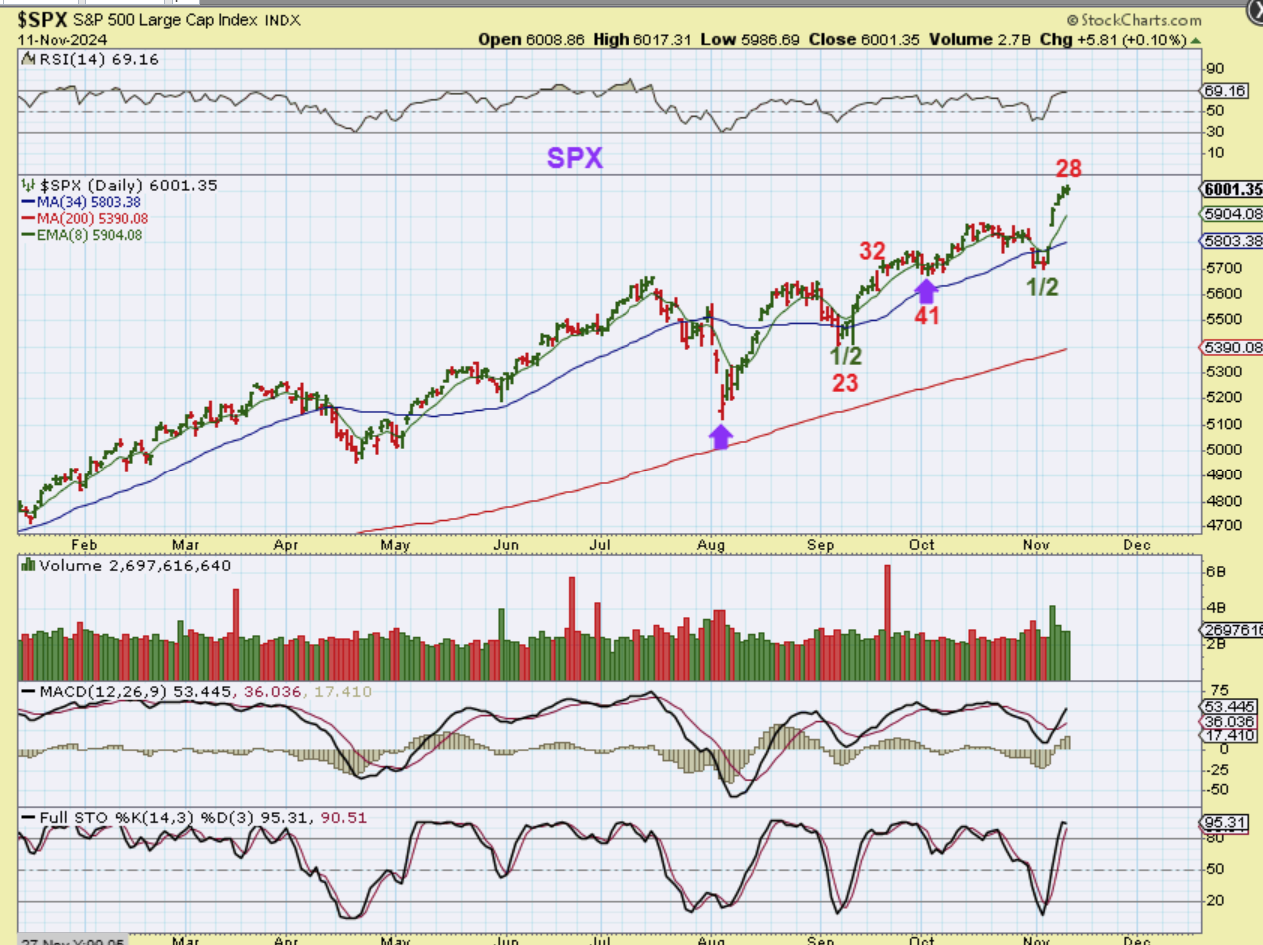
If the SPX plays out similar to that first daily cycle, it may look a little like this, and a dcl can land on the blue 34 or the 50sma..
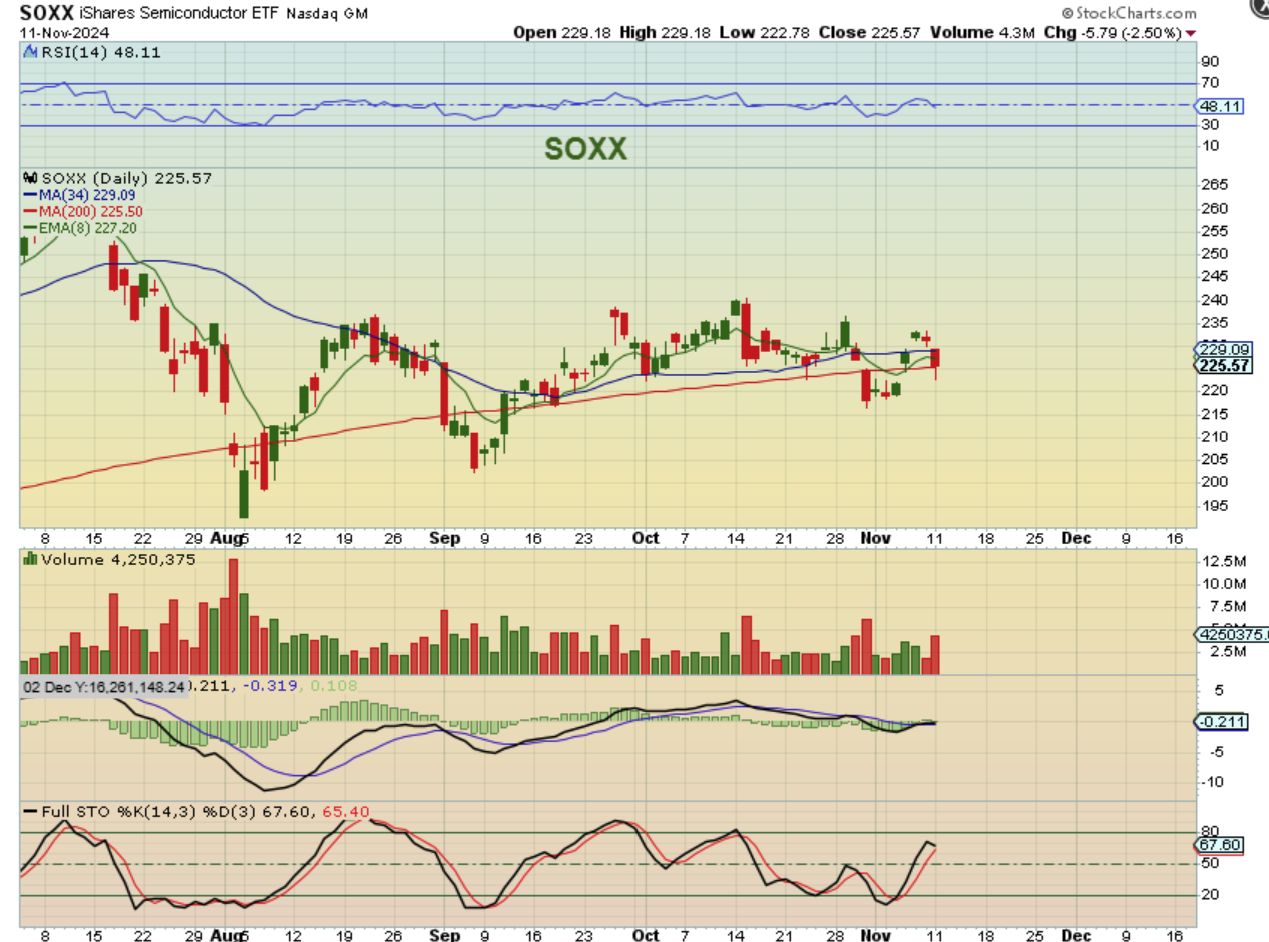
THE SOXX is still struggling though, and this may be concerning, because Semiconductors often reveal the health of the tech markets.
,
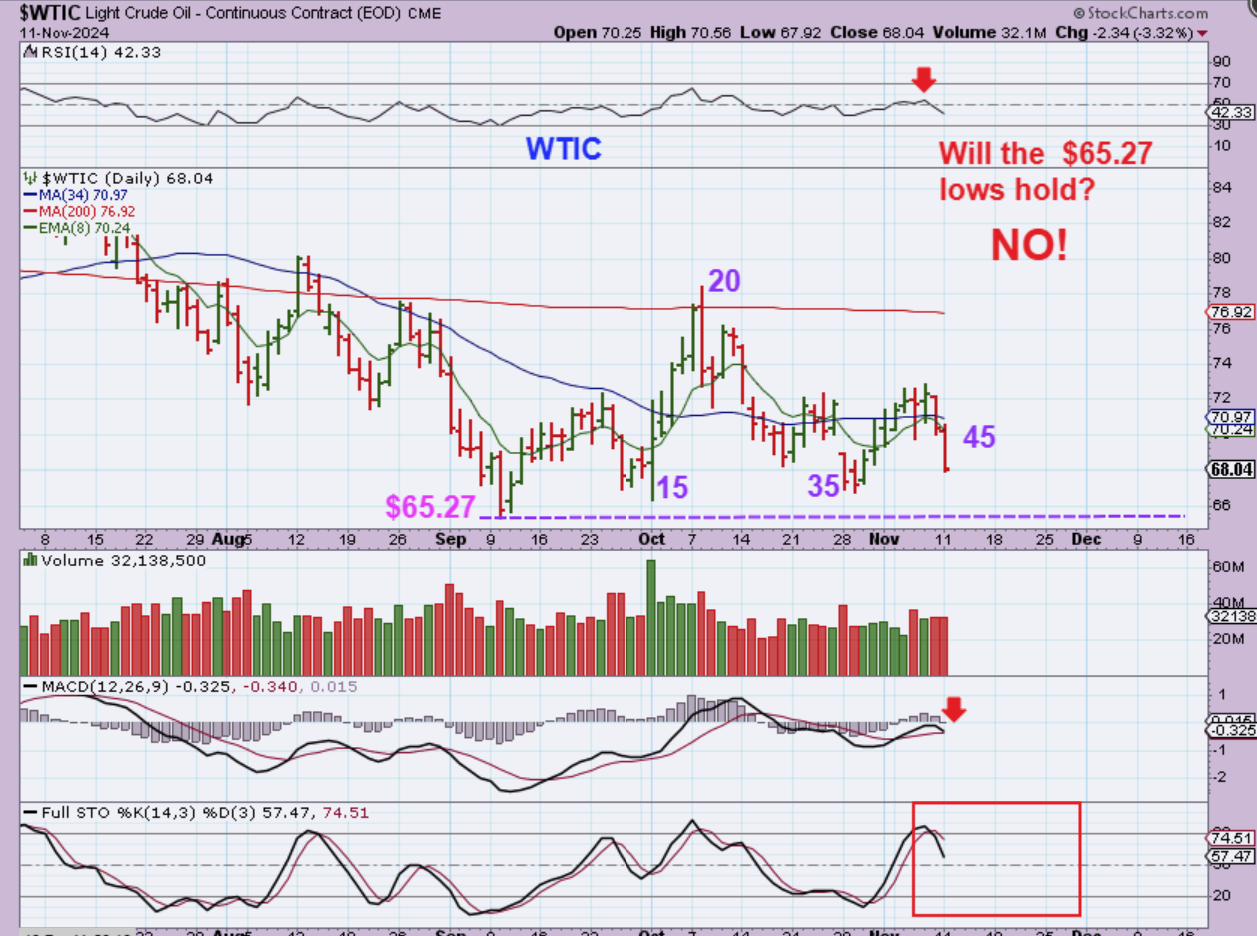
WTIC – oil dropped on day 45 and I do not think that the lows will hold up for a few reasons, but VLO, MRO, APA, OKE, etc look pretty bullish. I am thinking that this may break the Sept lows of $65.27 because e are already L.T. and the stochastics has room to drop. It may just be a quick shake out, based on what the Oil stocks look like.
m
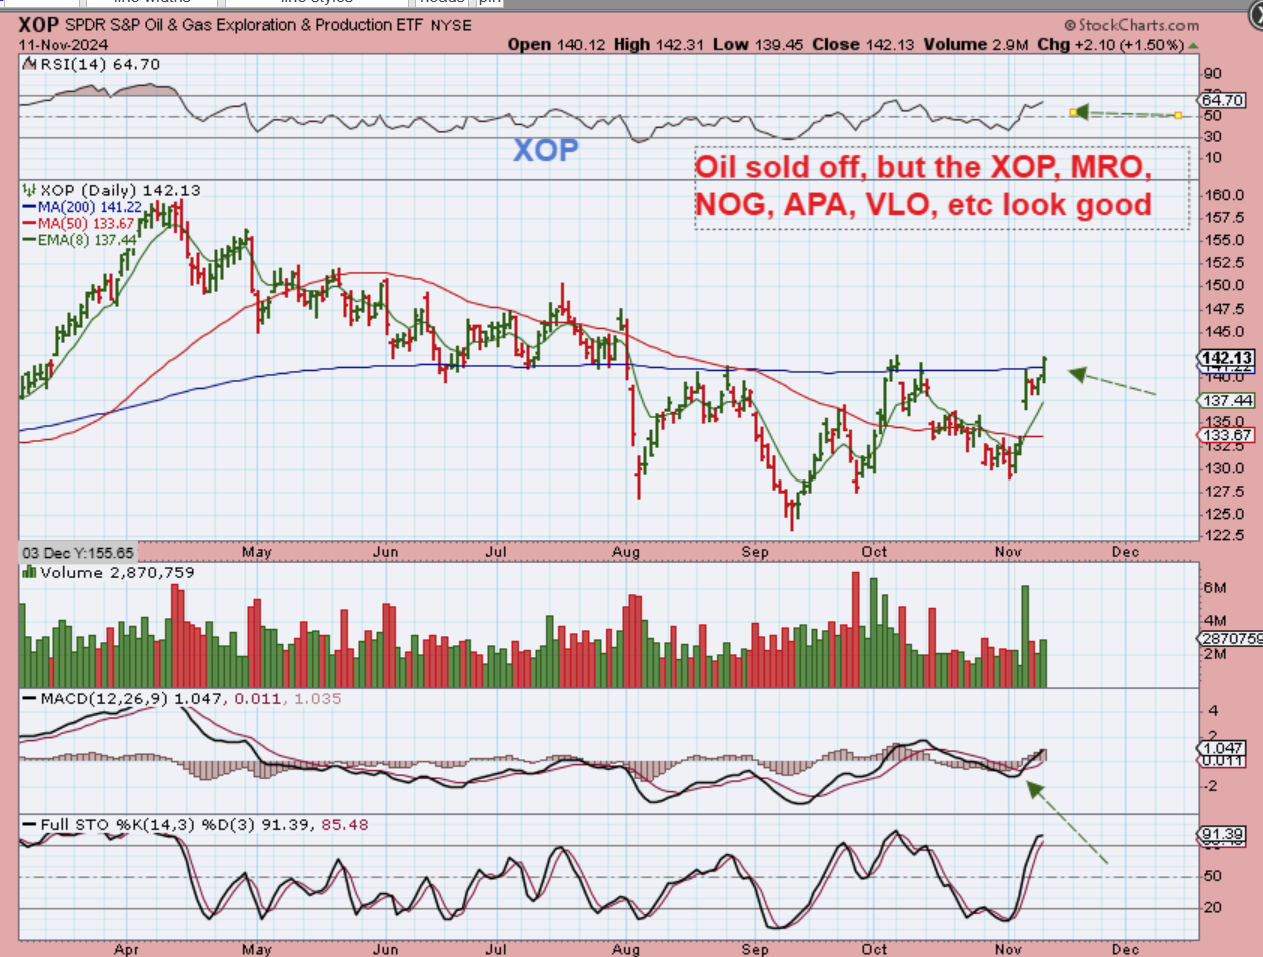
XOP – With oil dropping, the Oil stocks look more bullish…
,
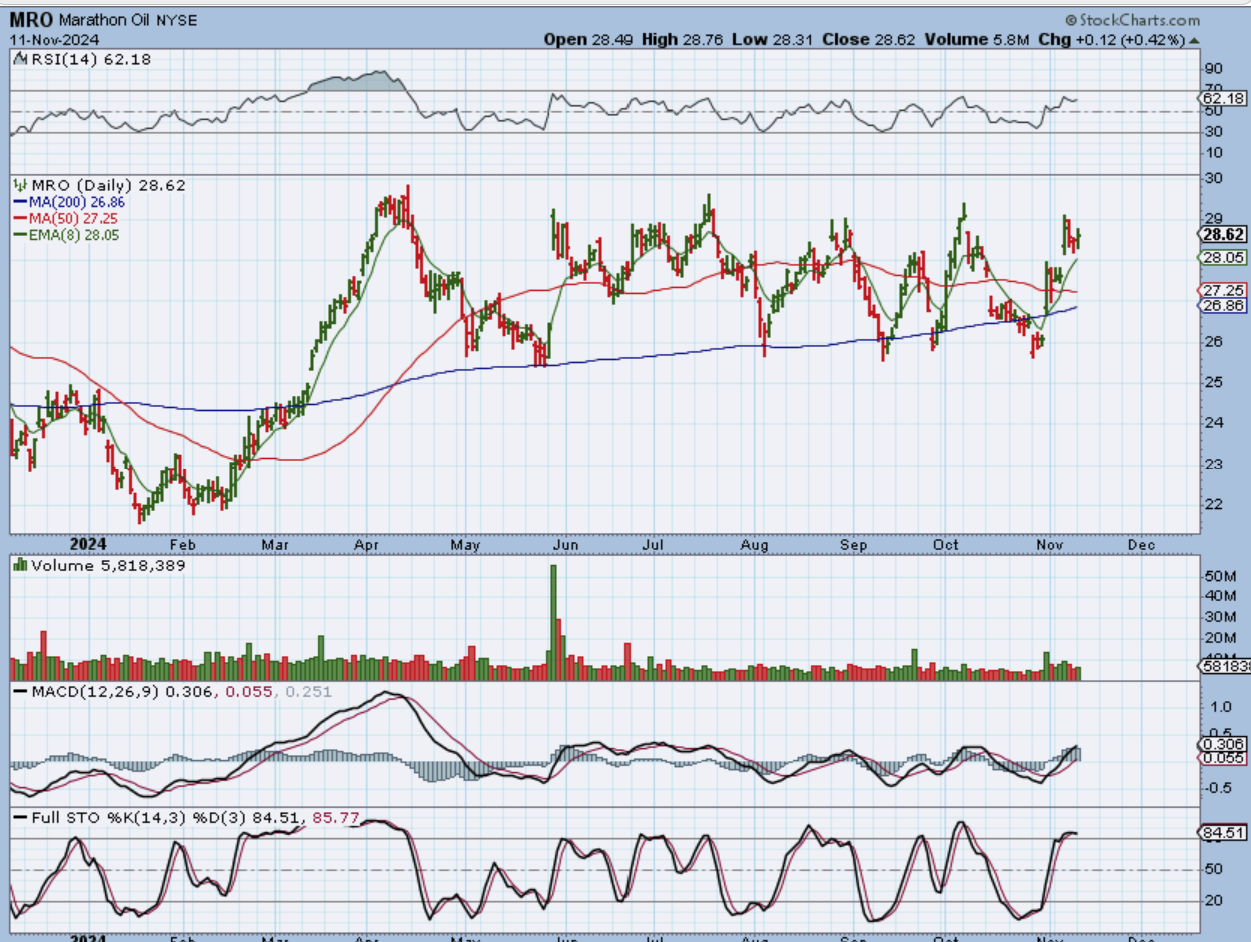
MRO is near the recent highs, for example.
.
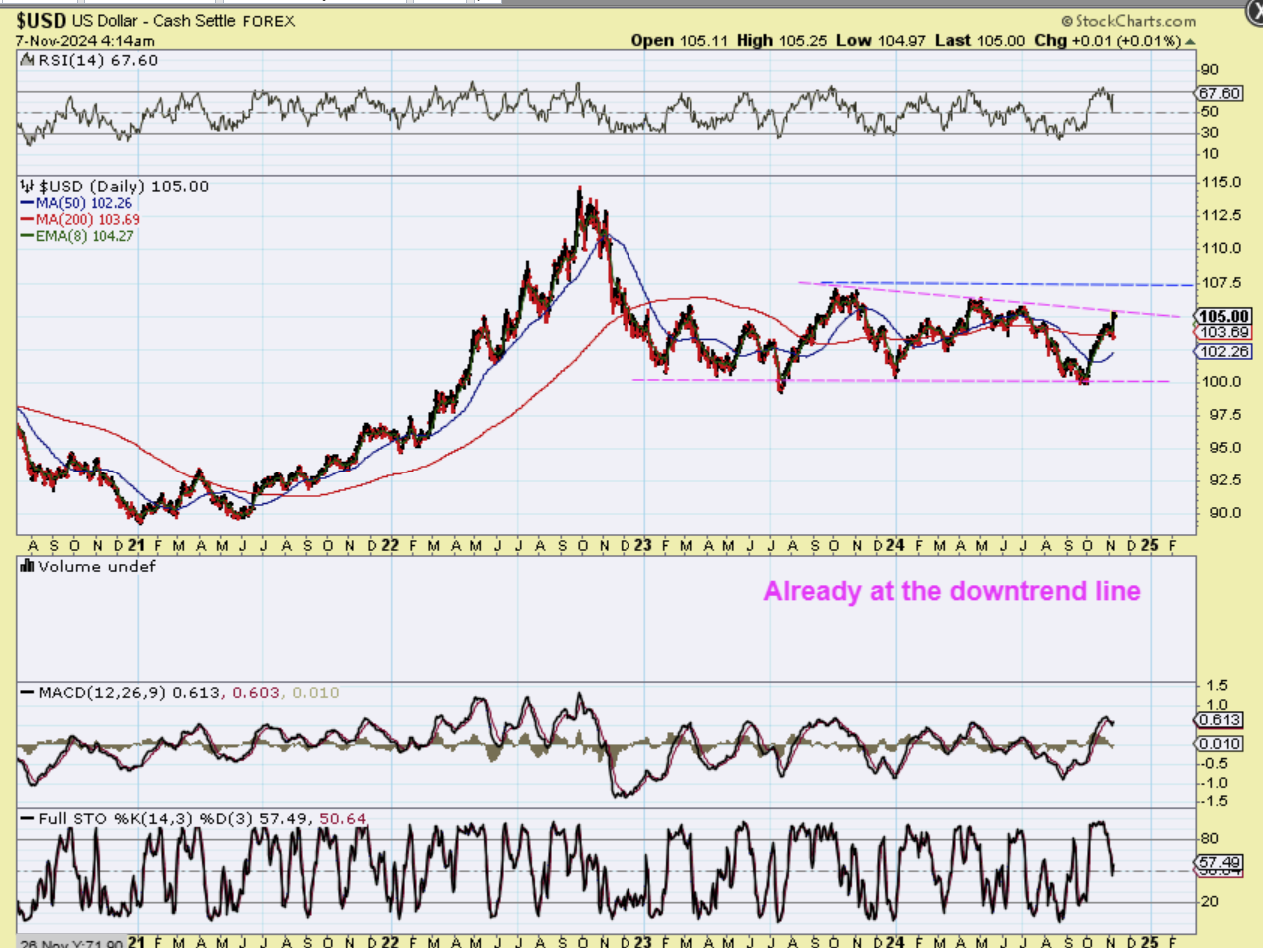
The USD appears to be on day 4 after a shake out at the 200sma took place. I have mentioned $107.50 as a possible target…
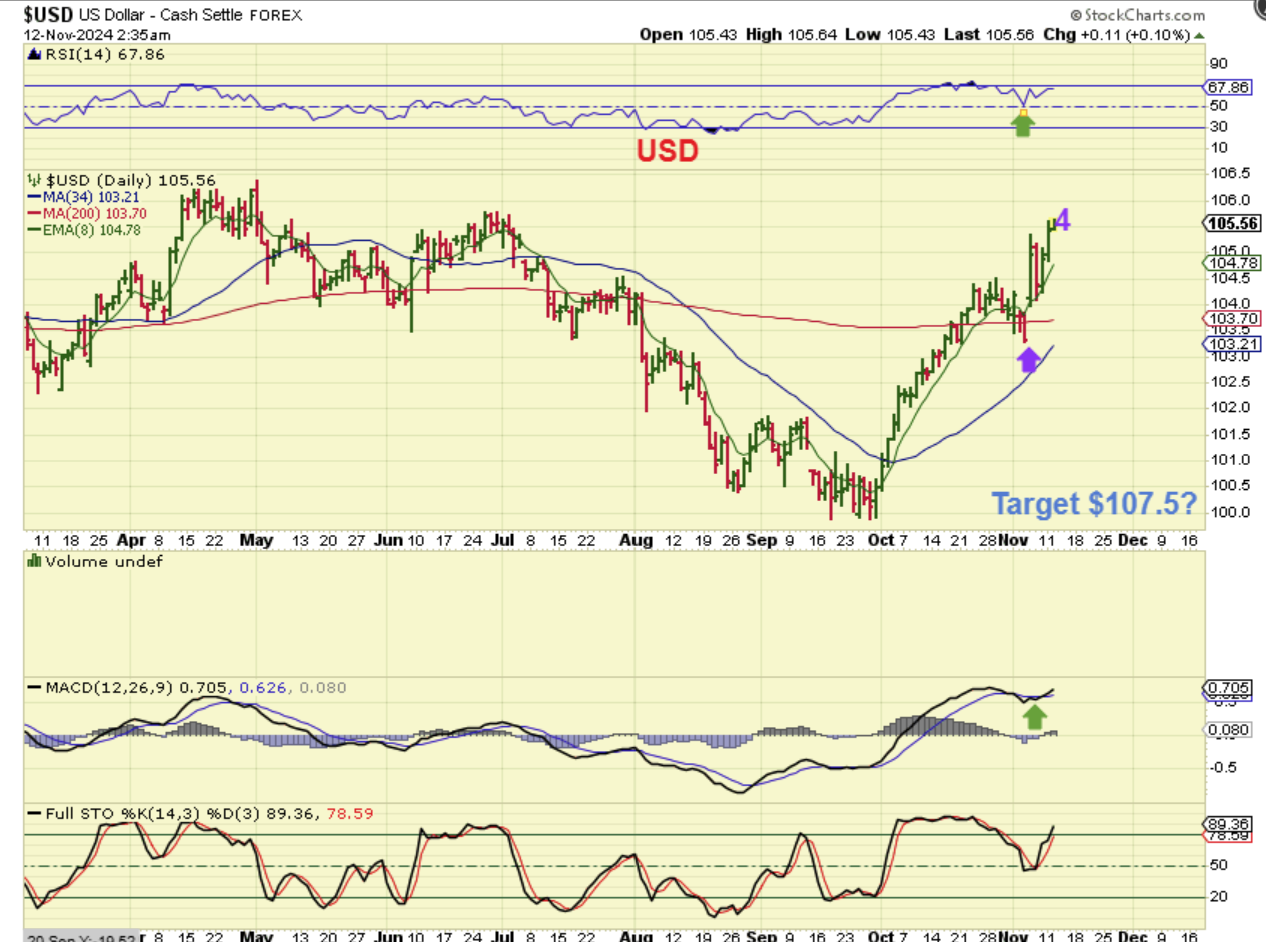
FRIDAY I SHOWED THE $107.50 AREA WITH THIS CHART AND THE BLUE LINE.
.
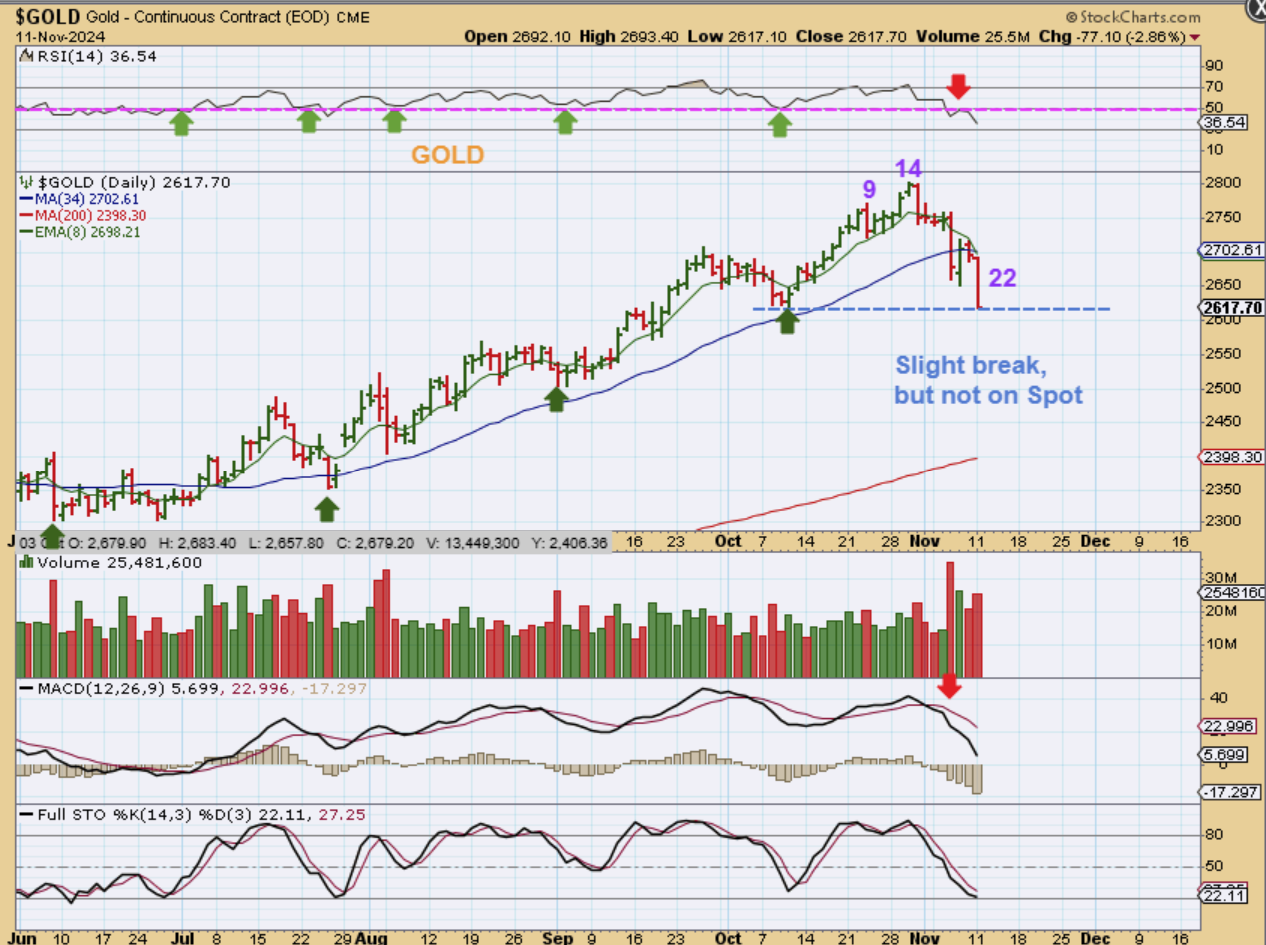
I have been discussing the idea that Gold is due for a dip into an ICL In November or December.
.
GOLD sold off sharply for the first time in a long time last Wednesday after the election results came out.
1. Monday saw another larger drop, so our symmetrical climb is now showing a different look to it, with these deeper sell offs breaking below the 34 sma.
2. The RSI has changed too, trading well below the 50% line for the first time in months.
3. This is day 22 and it broke the dcl. Even though the daily cycles have been shorter lately, we really need to wait for a swing low to form in a L.T. Daily Cycle for an ICL to develop. Note: This is not L.T. yet and…
.
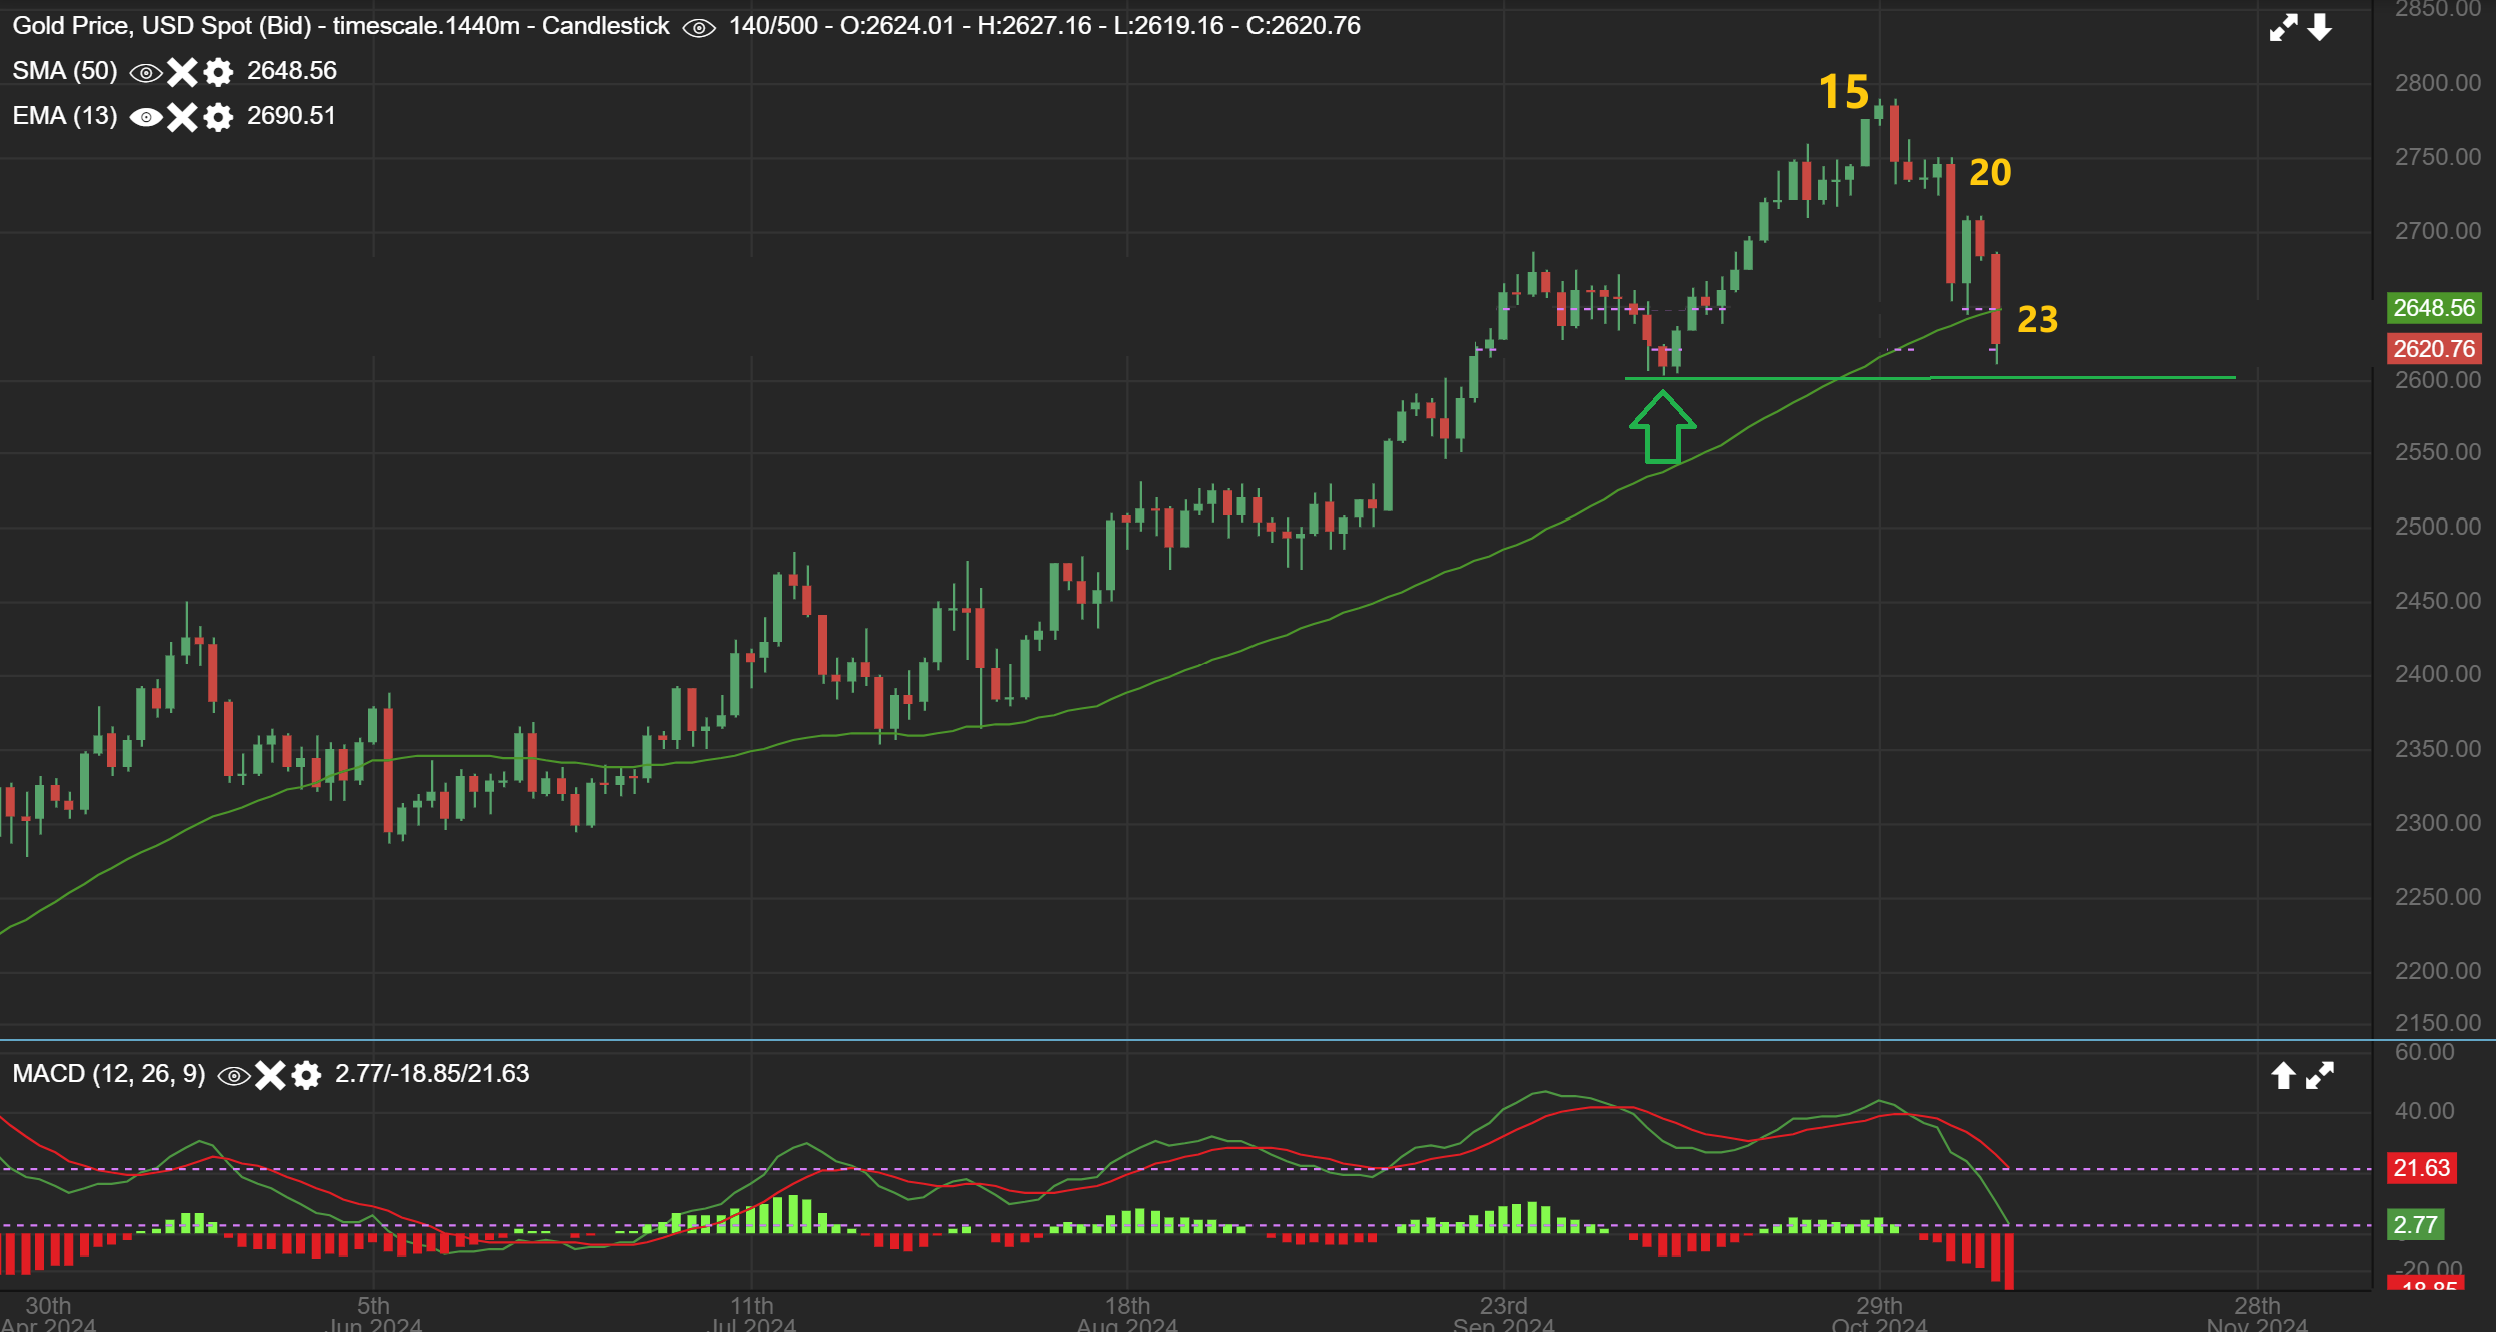
The cycle count is 1 day different with Spot, likely due to a holiday that doesn’t show up on Stockcharts, but shows up with Spot.
1. This count is not L.T. either.
2. We really should expect another daily cycle to give us more of an a-b-c down into an ICL as the USD runs toward 107.50, but it is possible that this daily cycle becomes L.T. and forms an a-b-c right here too.
3. So basically, Gold needs more time to sell off into an ICL, but it doesn’t have to be a deep sell off, it can be choppier.
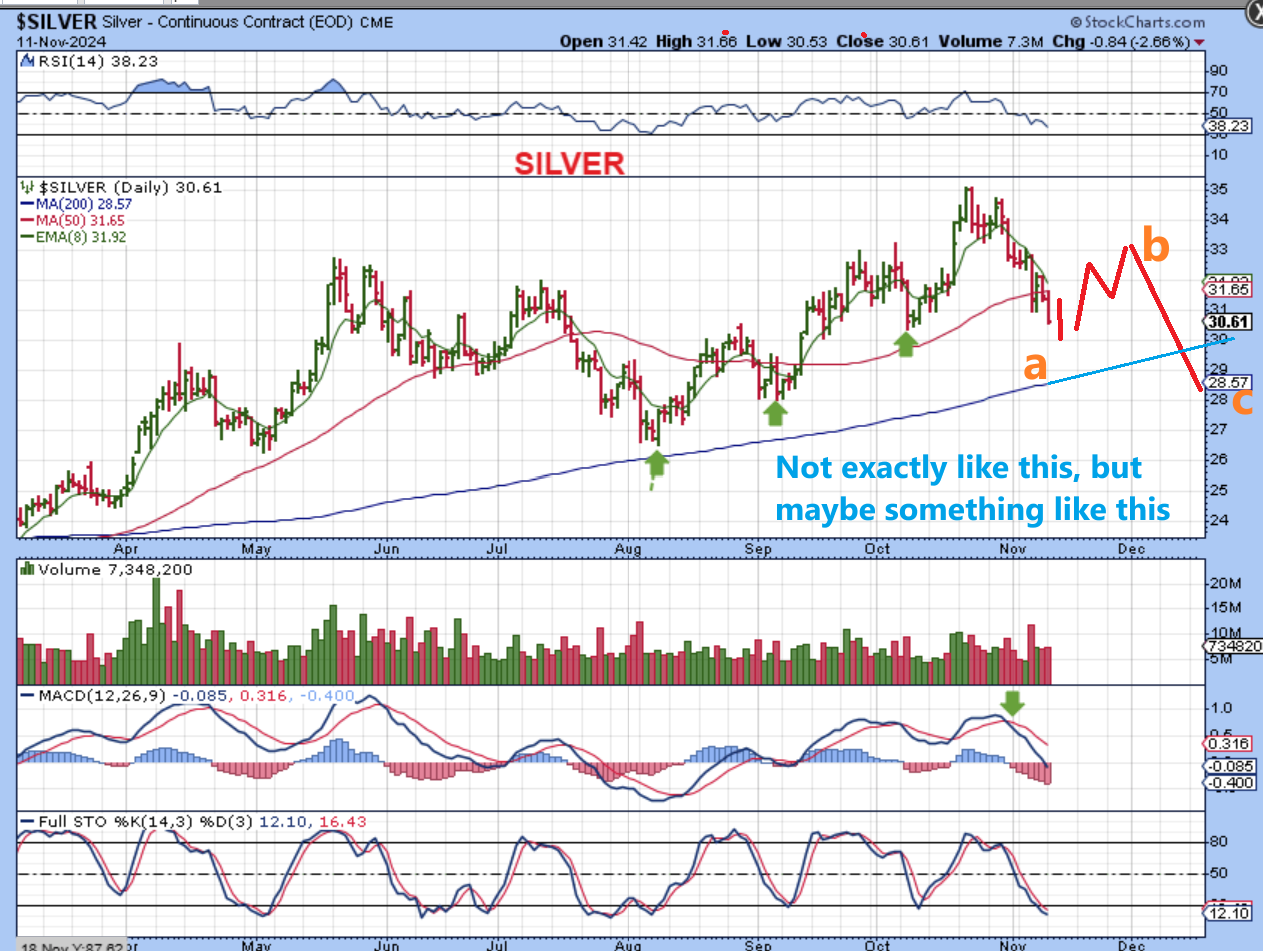
SILVER broke below the 50sma and this drop into a dcl is also a bit deeper than the last two.
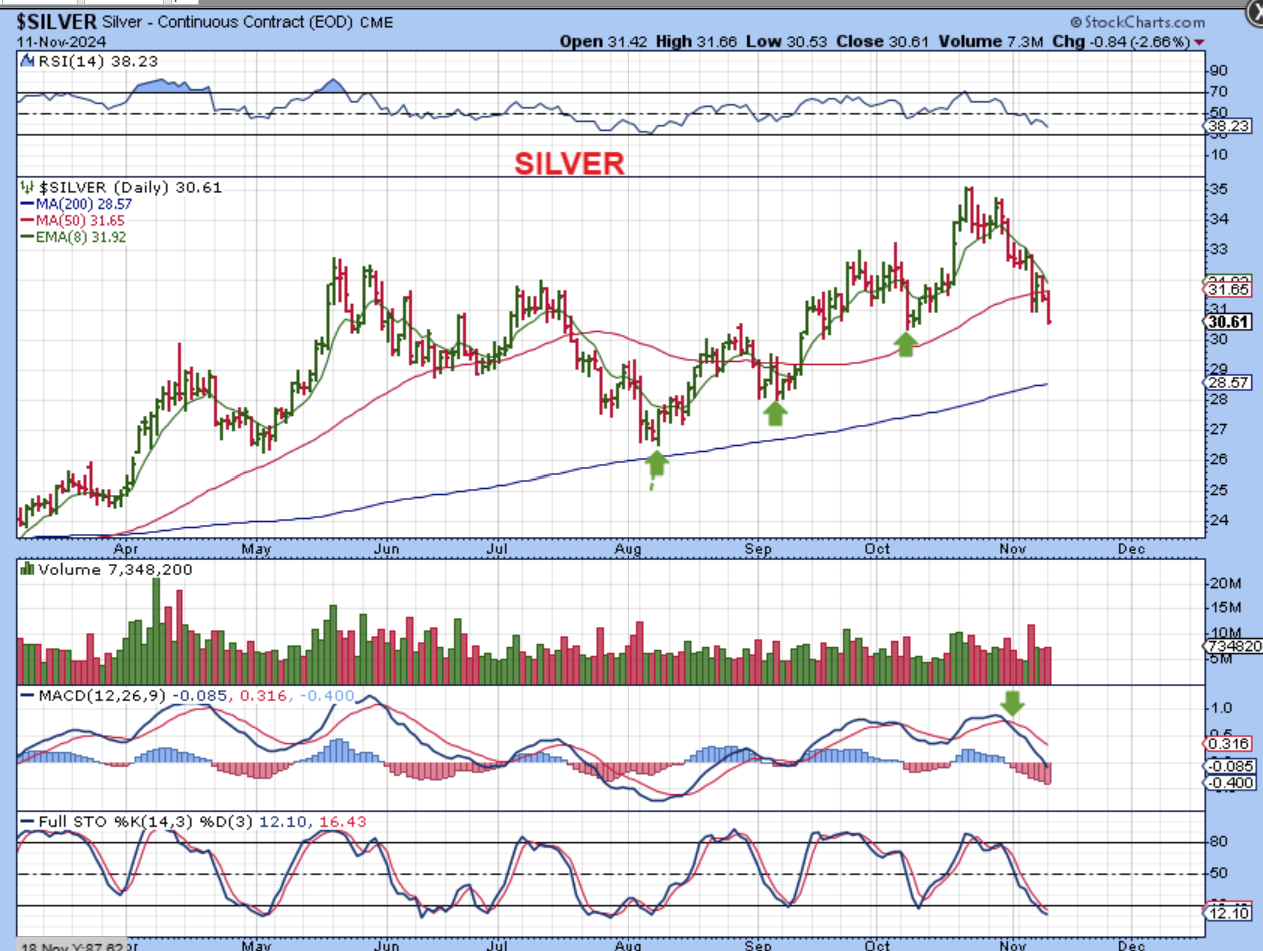
SILVER – Another daily cycle into an ICL could look something like this for Gold and Silver, giving us more of an A-B-C drop toward the 200sma. Take a look at July into August, and that is what we had last summer.
.
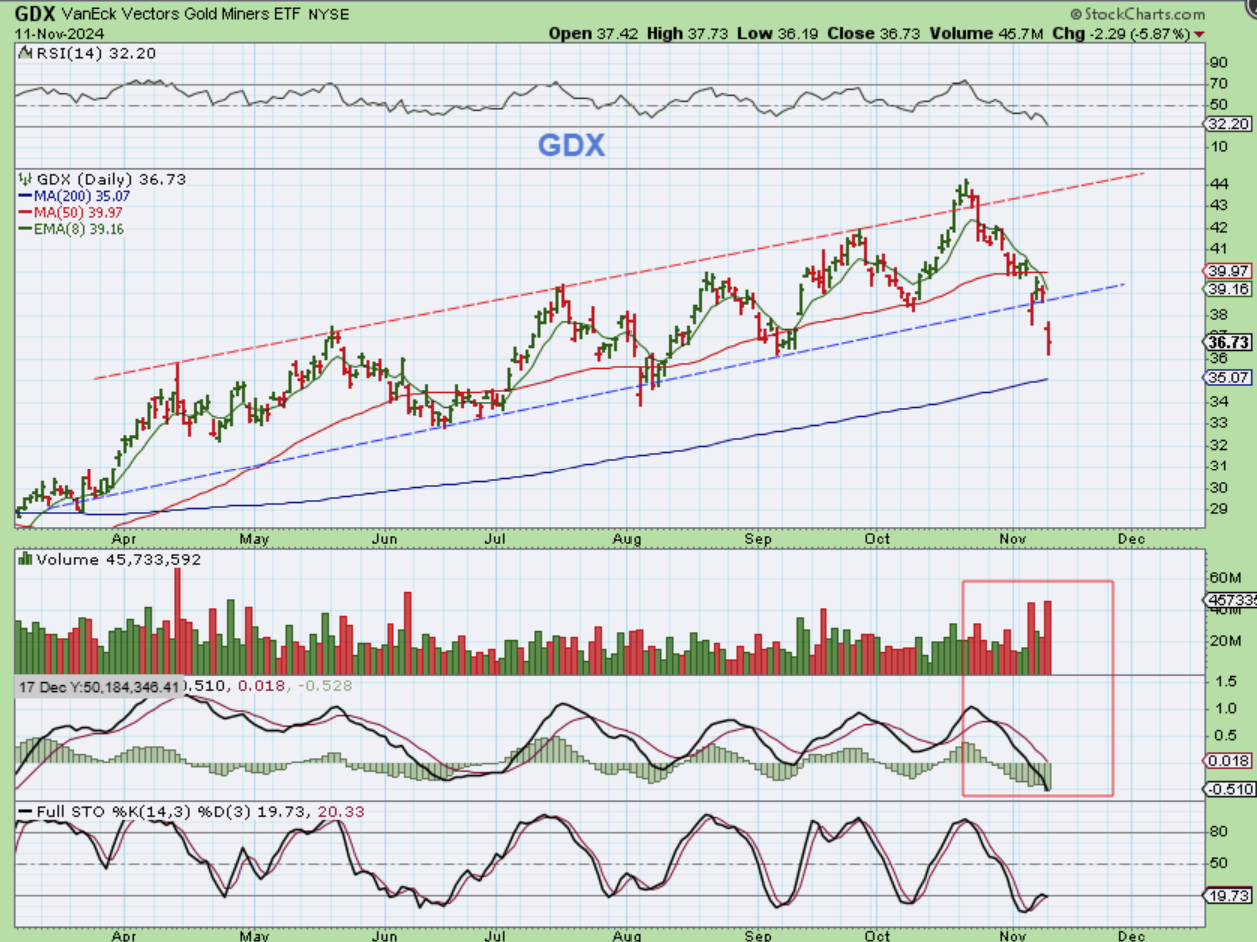
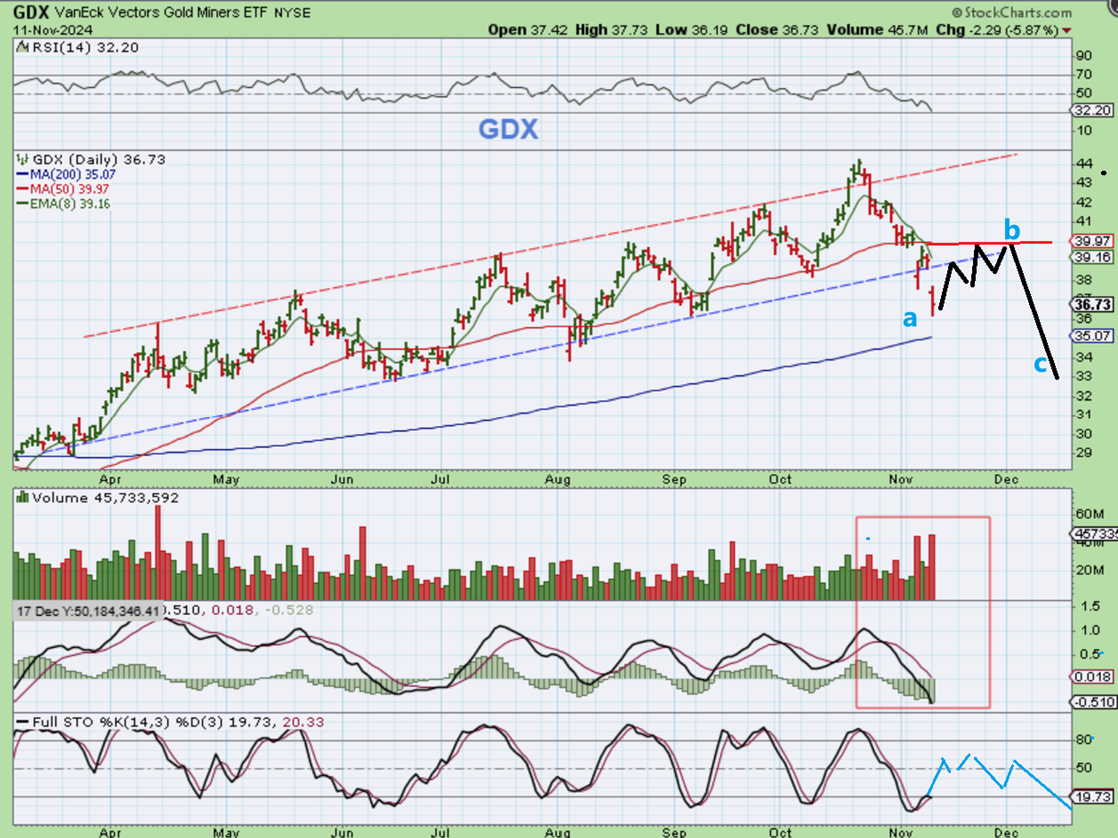
GDX – The Miners had a nice symmetrical look to it too, but you can see that the pattern of smaller sell offs has now been broken too. We can get a dcl at any time, but we should keep in mind that the final low (an ICL)may not come about until December…
.
We just want to keep in mind that the final low (an ICL) may not come about until we ride another L.T. Daily Cycle into December. This is just an idea of how that could play out. CAN YOU BUY THE NEXT DCL/SWING LOW? Some like to buy it just in case it takes off higher as the ICL, but if you see weakness and maybe resistance at the red 50sma, it is likely a final daily cycle.
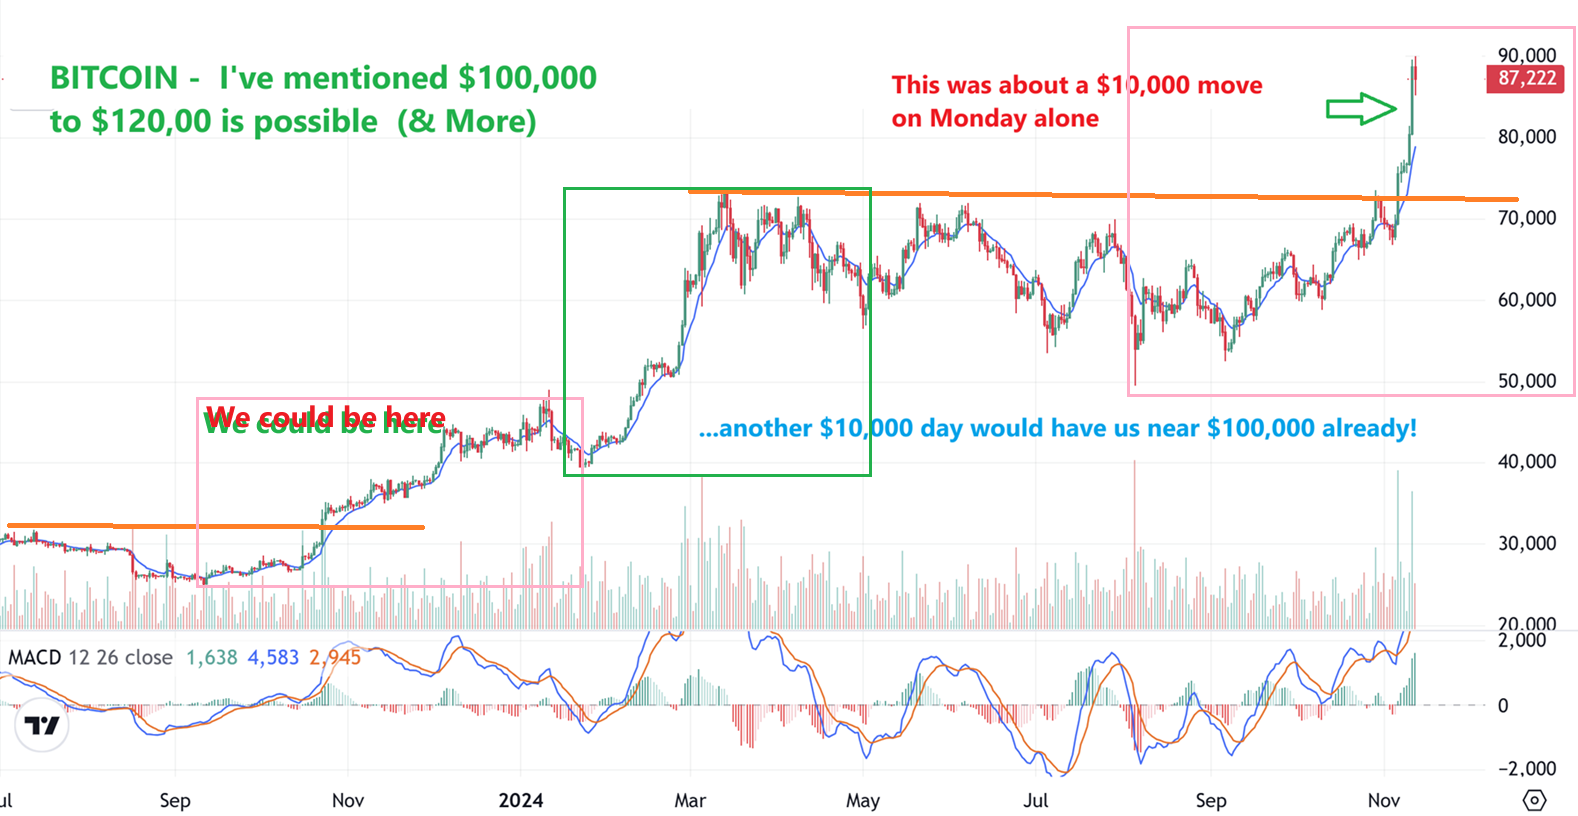
So we are watching the General Markets continue higher while Oil and the Precious Metals are selling down into the dcl, possible ICL. Oil stocks are holding up well, so Oils drop may be down into the final lows too. Bitcoin really accelerated its blast off above the breakout, so I’ll discuss that below.
In the commenting area, I pointed out a good looking set up and its playing out nicely, so I’ll post it here.
.
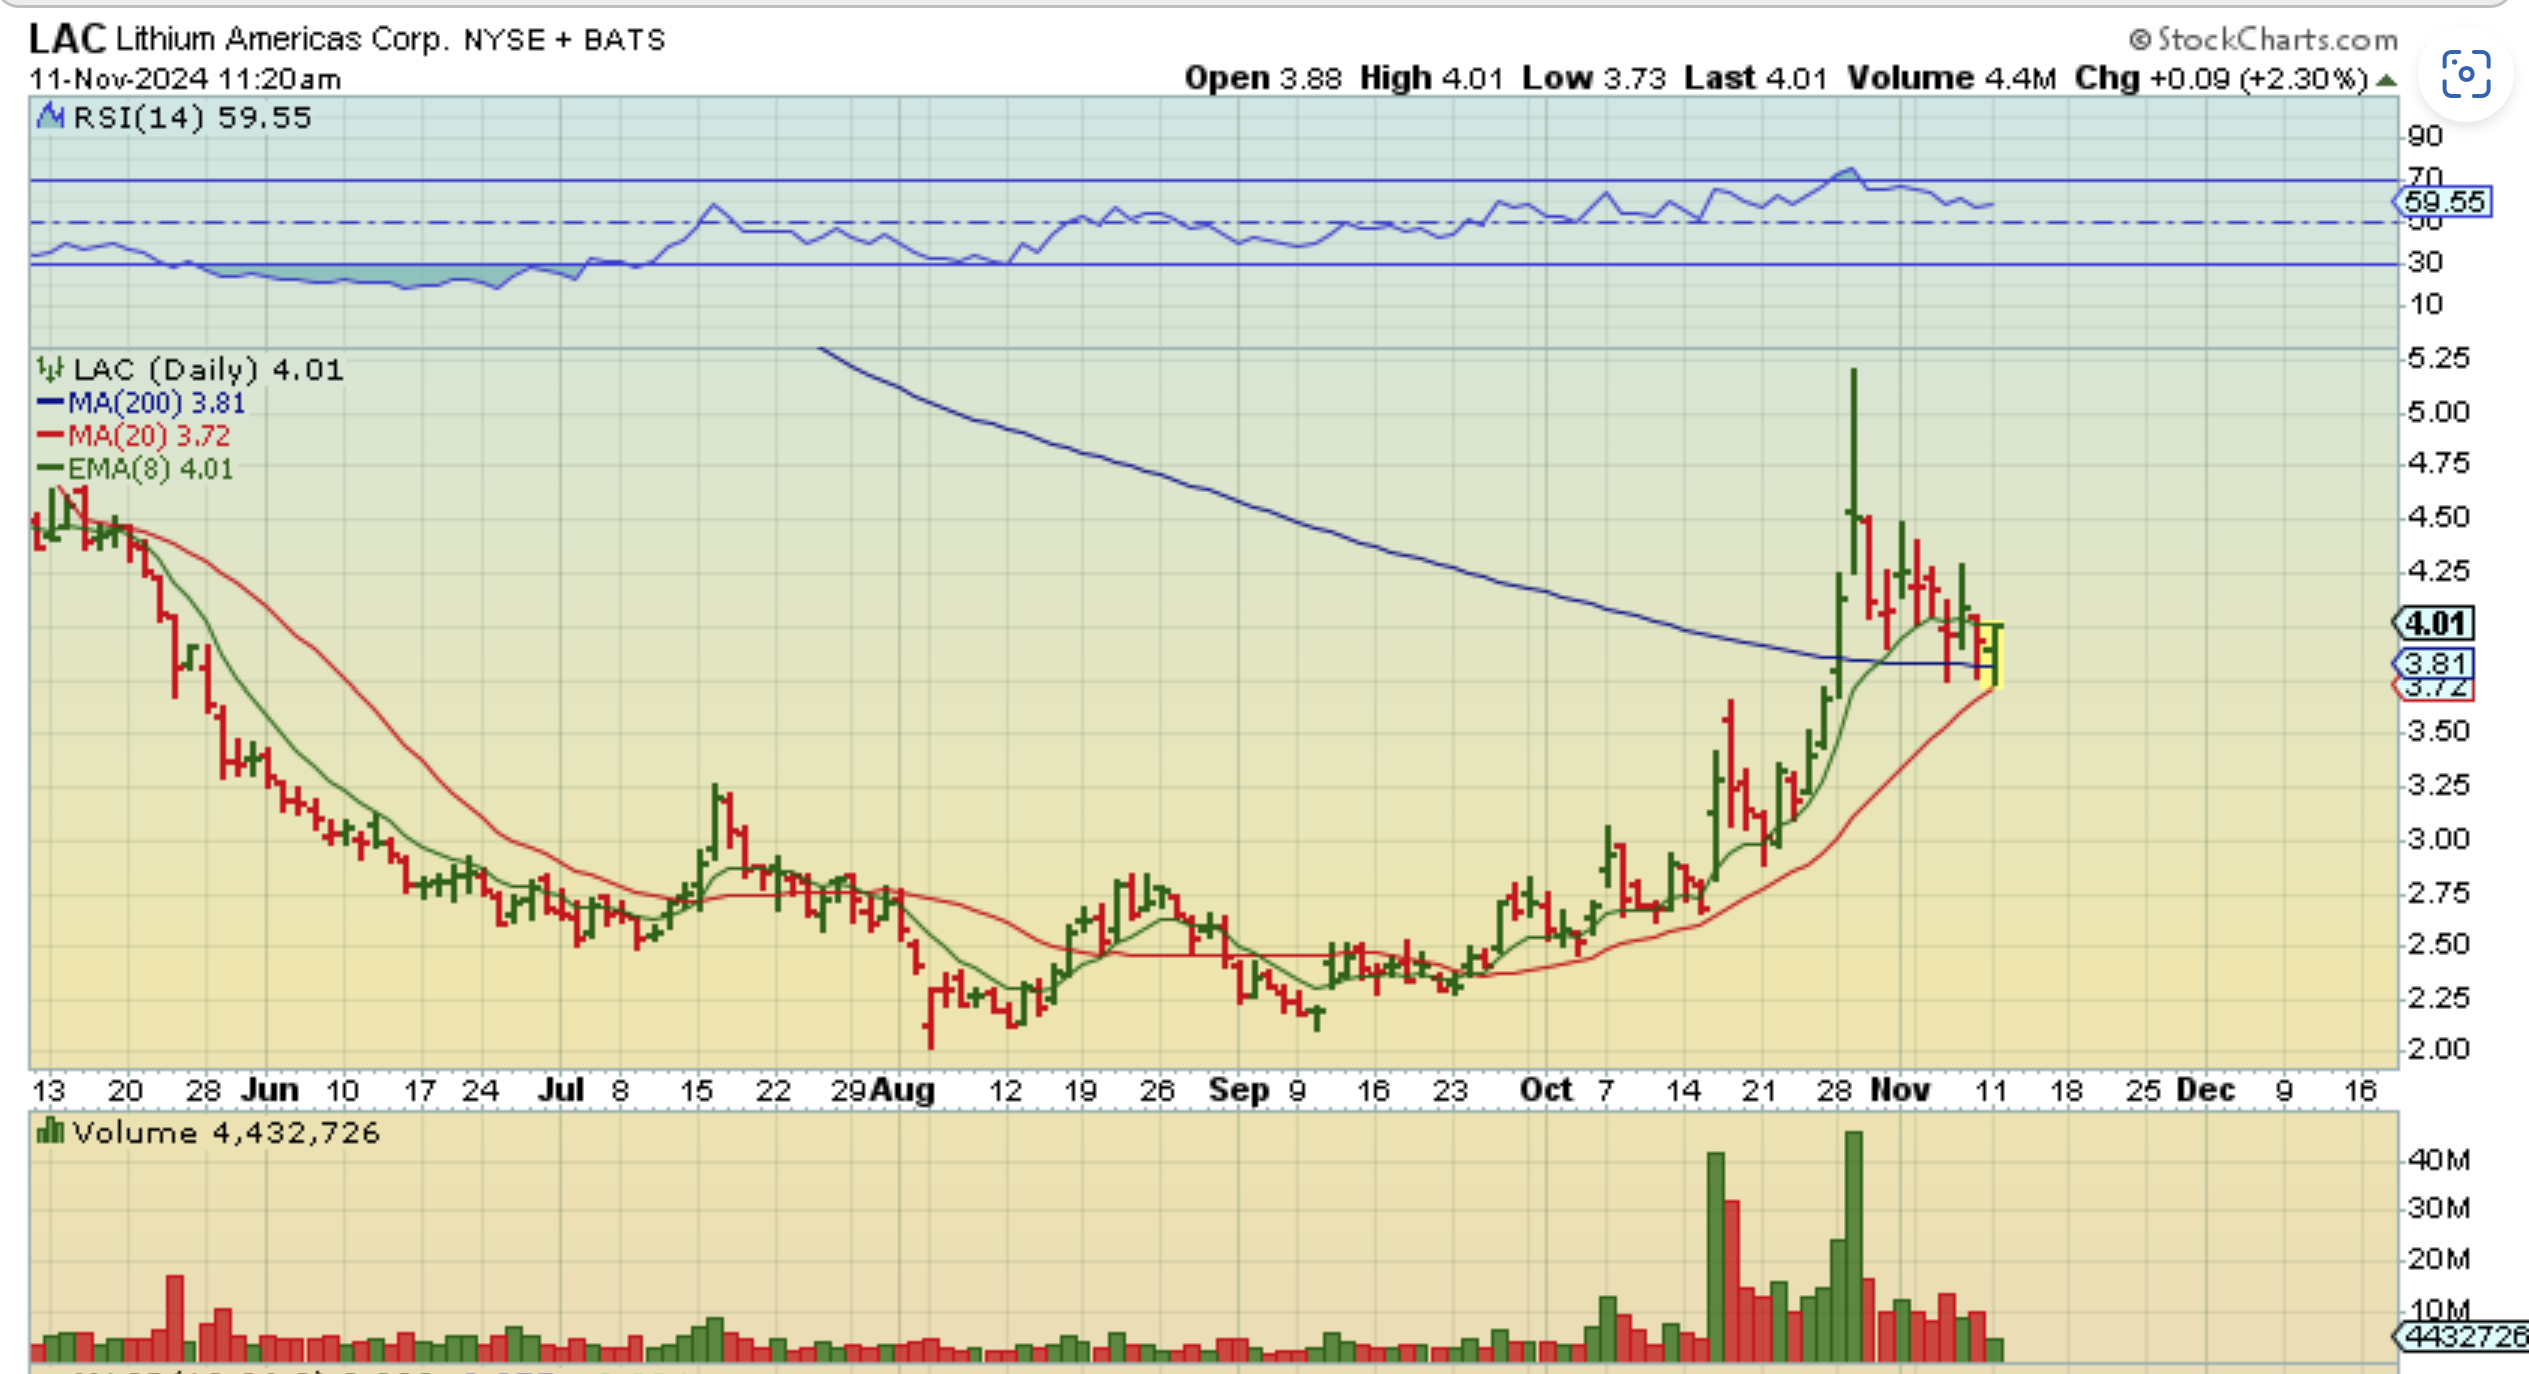
I pointed out this set up was with LAC reversing at support. Note: LAC, PLL, and SGML (lithium stocks? look pretty good. I saw this set up and mentioned it as a buy and took that buy because these often put in 7-10% days.
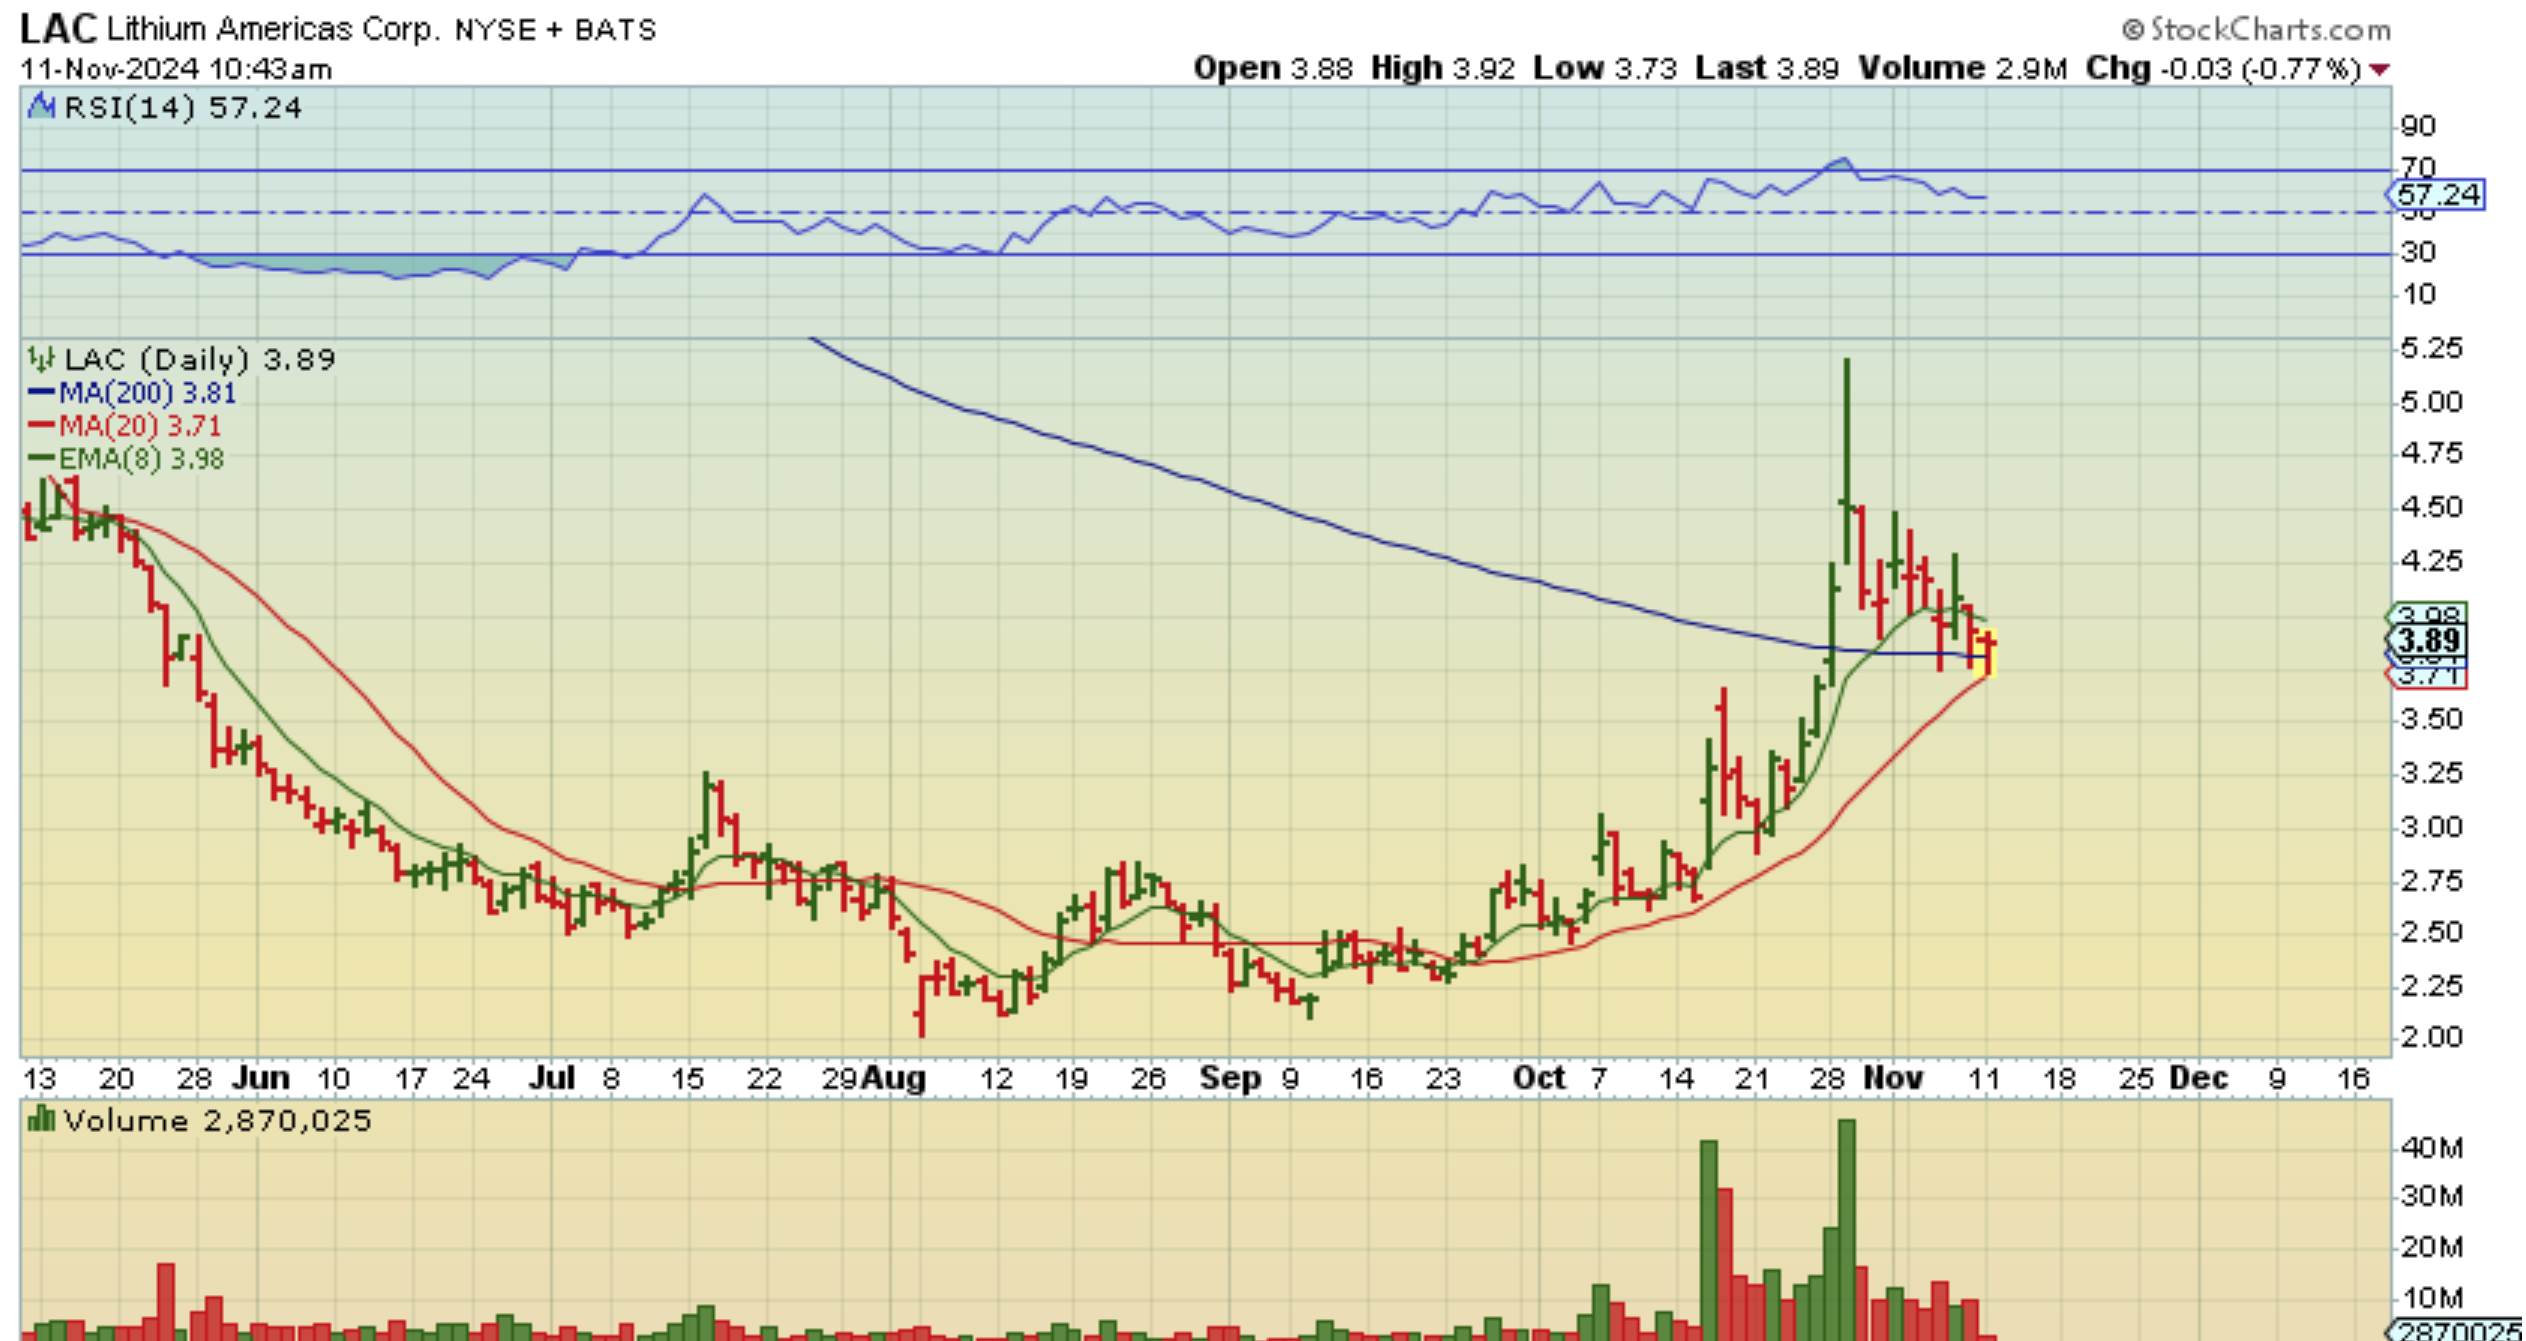
LAC – The trade was working, so I posted this chart showing it going from red to ‘up 2% now’.
.
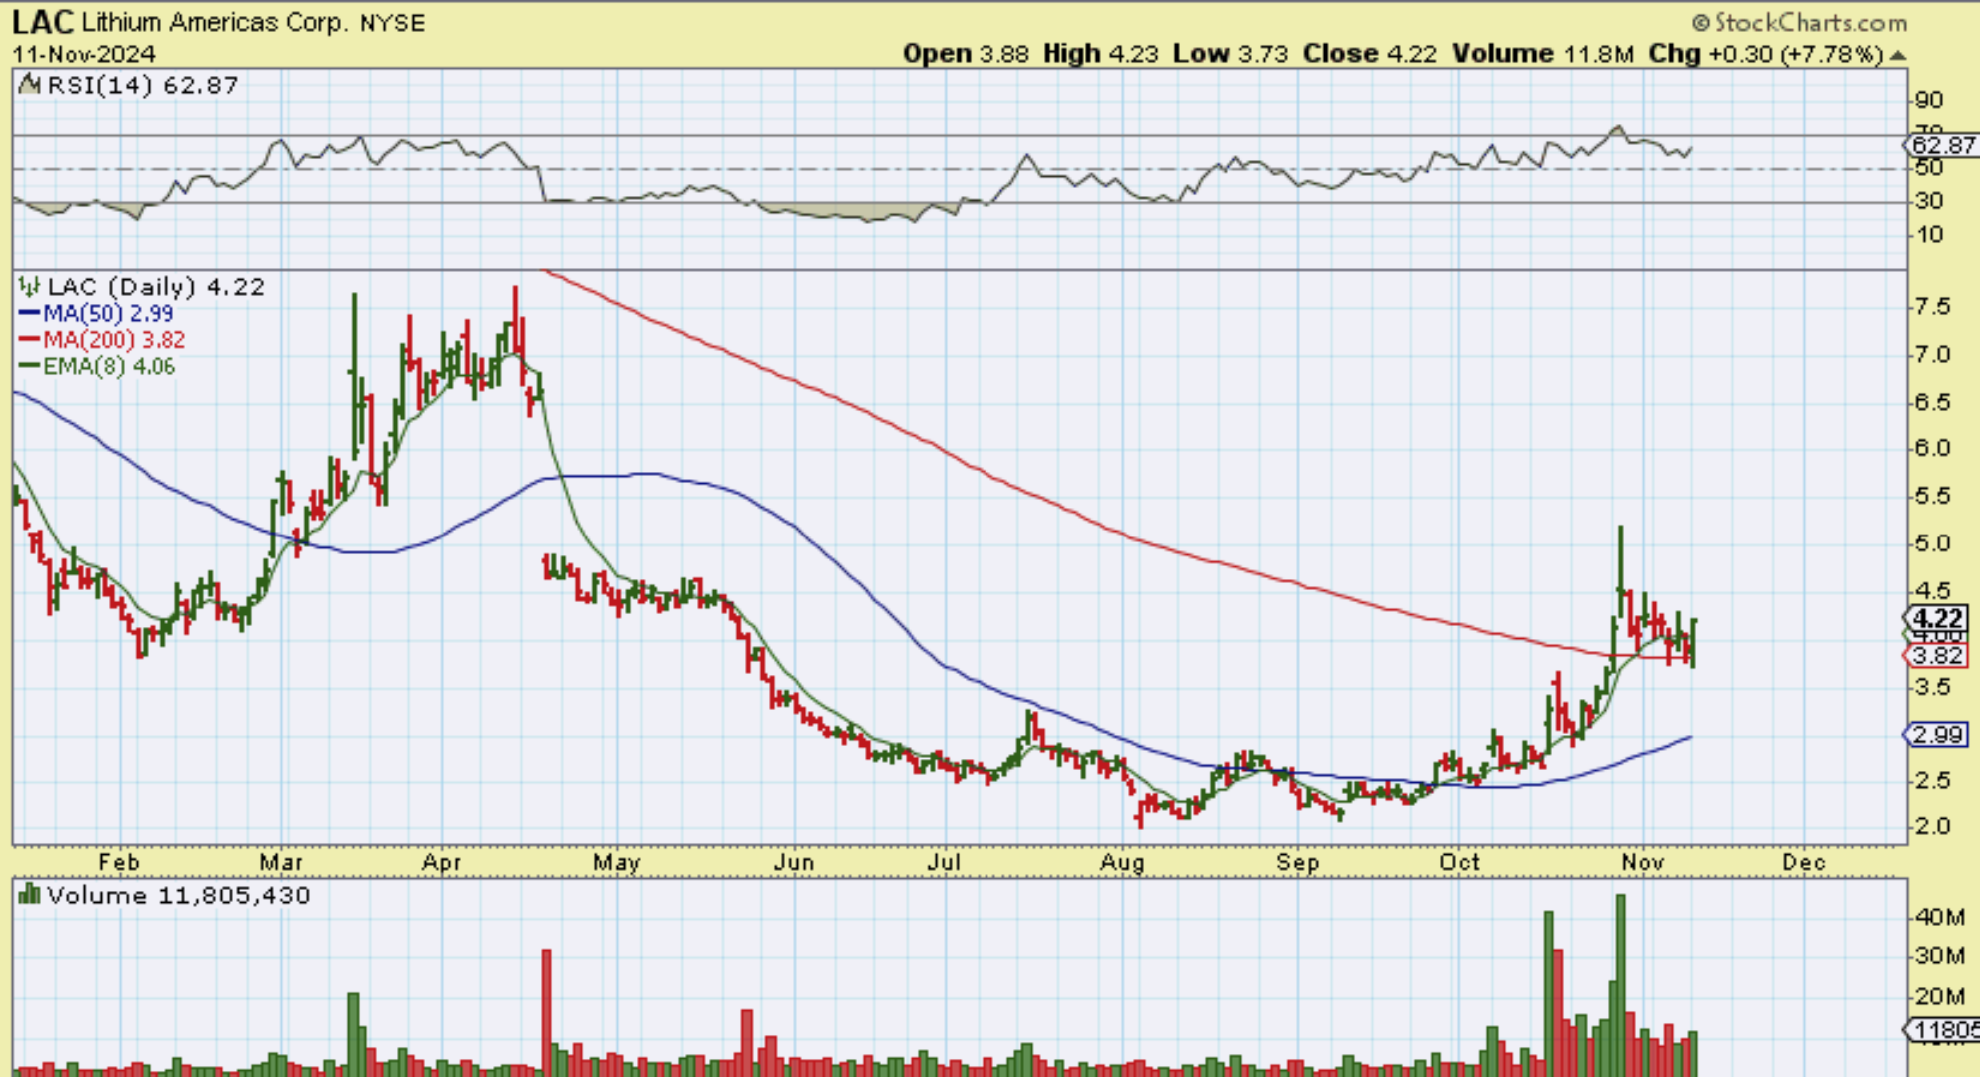
LAC – Closing up almost 8% means that our trade gave us over 8%. This can continue higher or it could continue to consolidate along that 200sma, but yesterdays buy can become a buy and hold with a stop now too. Also…
.
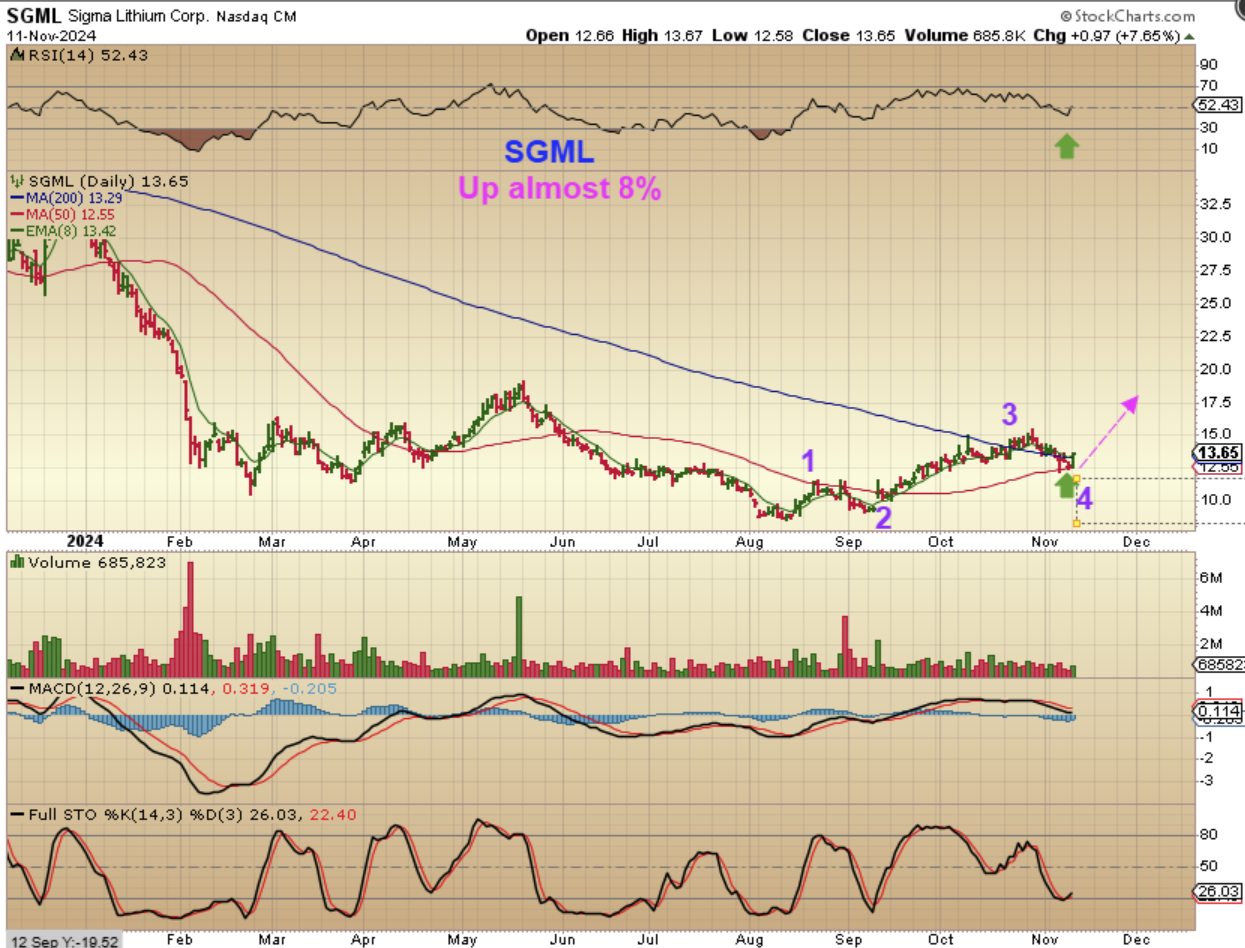
SGML – This set up is very similar to LAC yesterday. It reversed at support and recovered that 200sma, closing up 8%. I think that these Lithium Stocks can be ‘Buy & hold’ even though they may be a little choppy at times. This is a huge base with good upside potential. SGML rallied from under $10 to $15. Earnings Thursday, but the last earnings report started this rally.
.
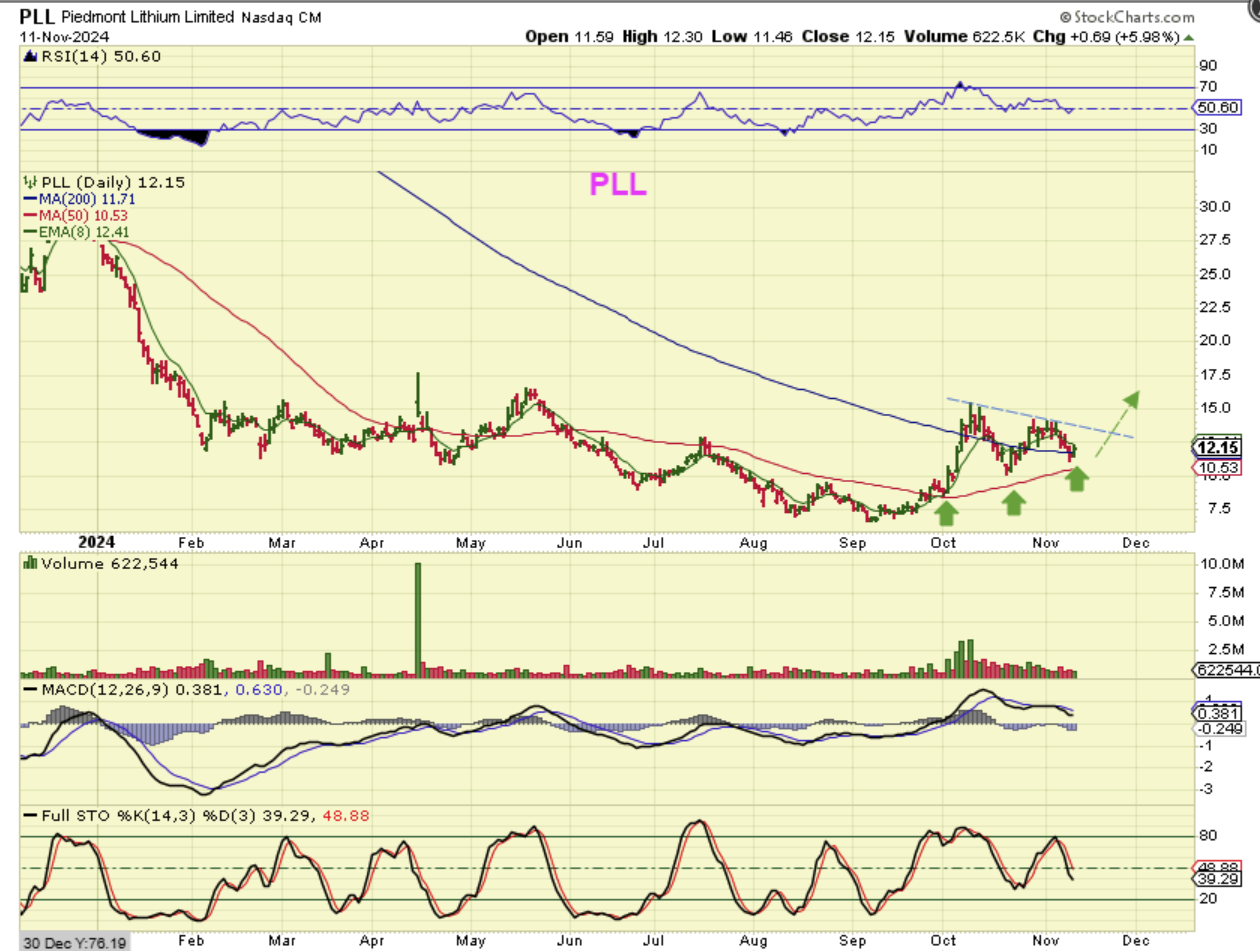
PLL is a little choppier than LAC and SGML, but it seems to be forming a loose bullish triangle pattern. It is also reversing at the 200sma, it formed a large base and has good upside potential too. For example, this triangle formed when it rallied form $7 to $15 and then chopped between $10 & $15. Big moves could come over time.
.
Enjoy your Tuesday trading!
.
~ALEX
.
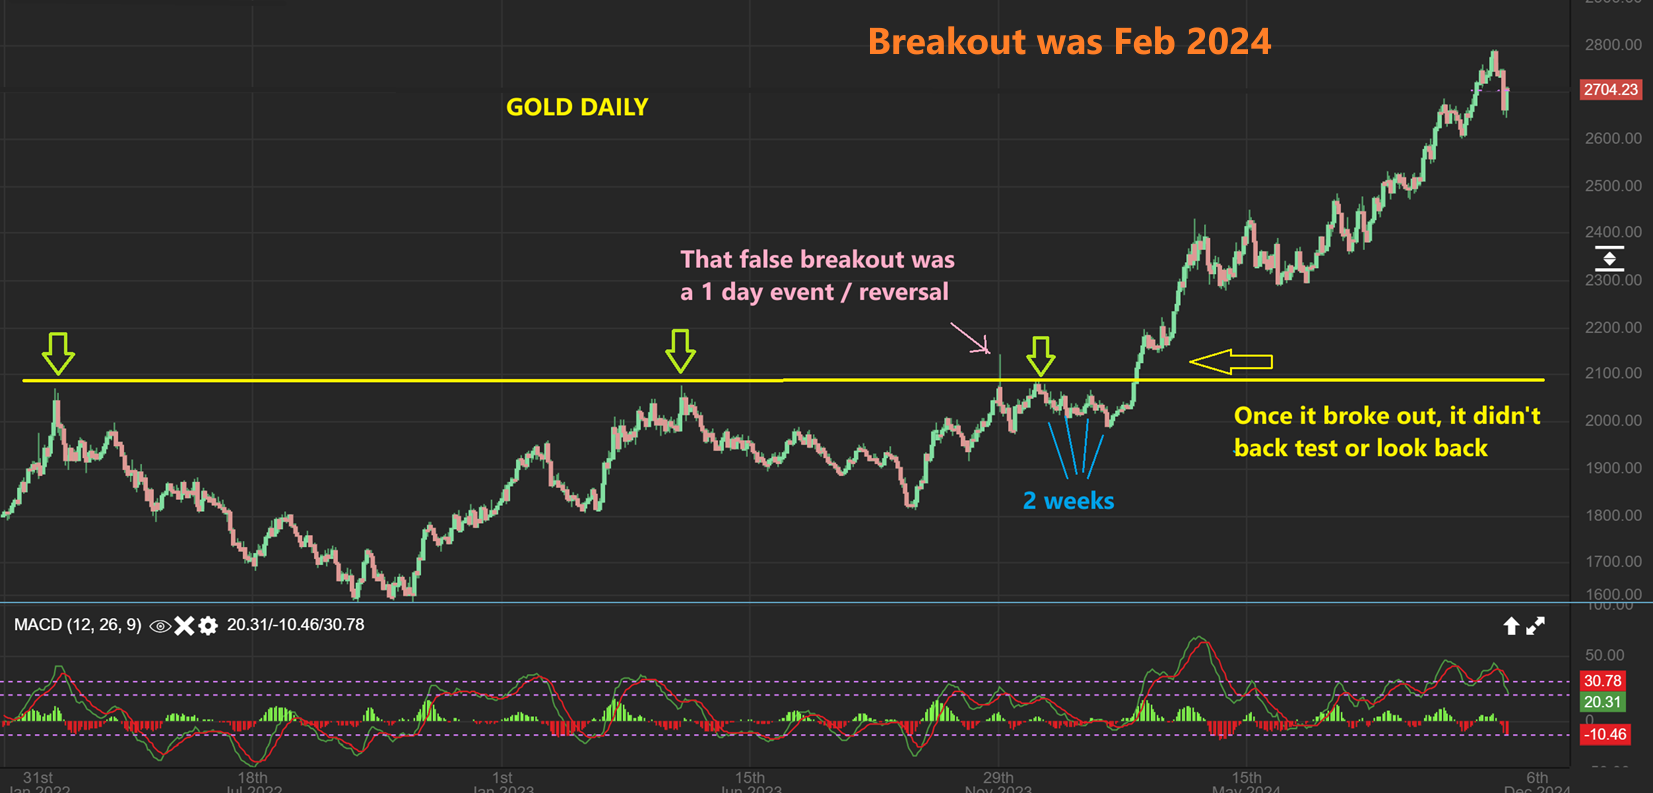
Last week I wanted to show this chart of Gold as Bitcoin broke out.
.
I pointed out that once Gold broke out, it did NOT make a back-test due to the strength of the coming move. So with this chart I am simply saying that Bitcoin may back-test on the next dcl, but it also may not. It could just put in a bull flag or a pennant and then keep going. With this breakout of Gold to new all-time highs in February 2024, I showed that the Miners also ran up and never pulled back, so that breakout was the lowest entry for Miners since February.
And that was a timely chart, because we can now see that with Bitcoin, we may not see a back-test either. The Crypto stocks took off higher too, many were 20-30% last week and 20-30% Yesterday. It’s hard to say where bitcoin goes from here, but think about this…
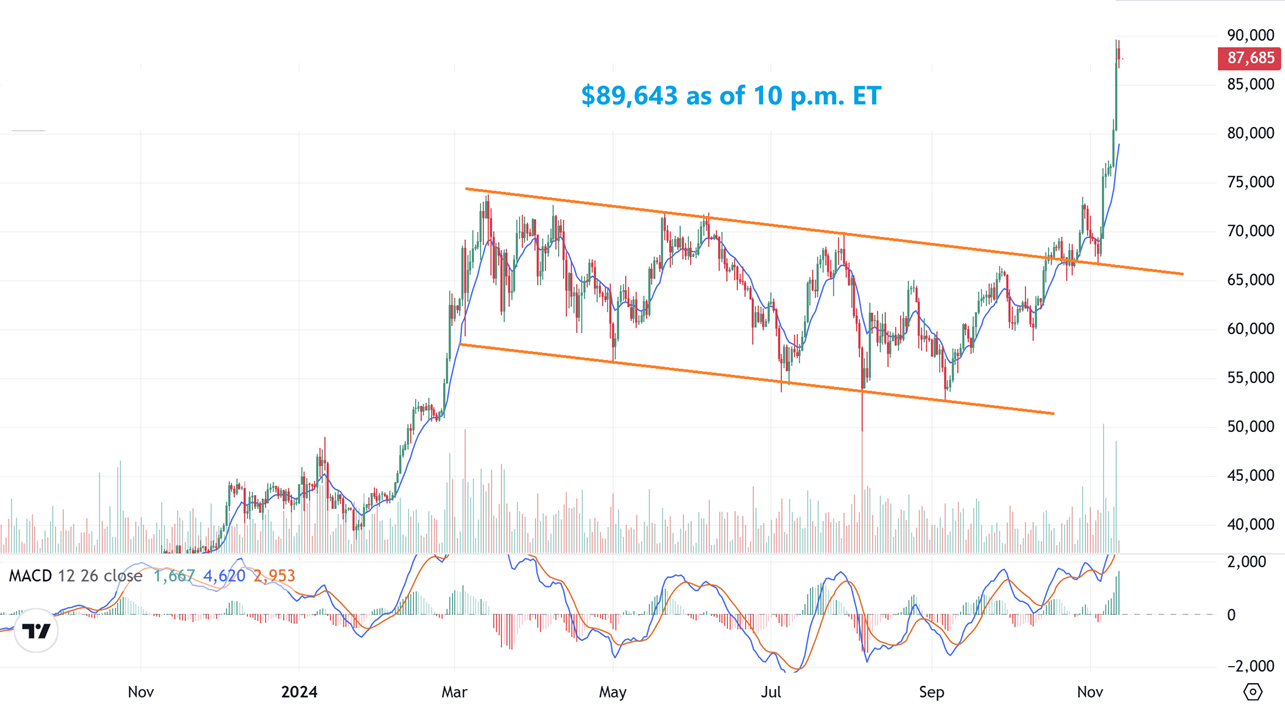
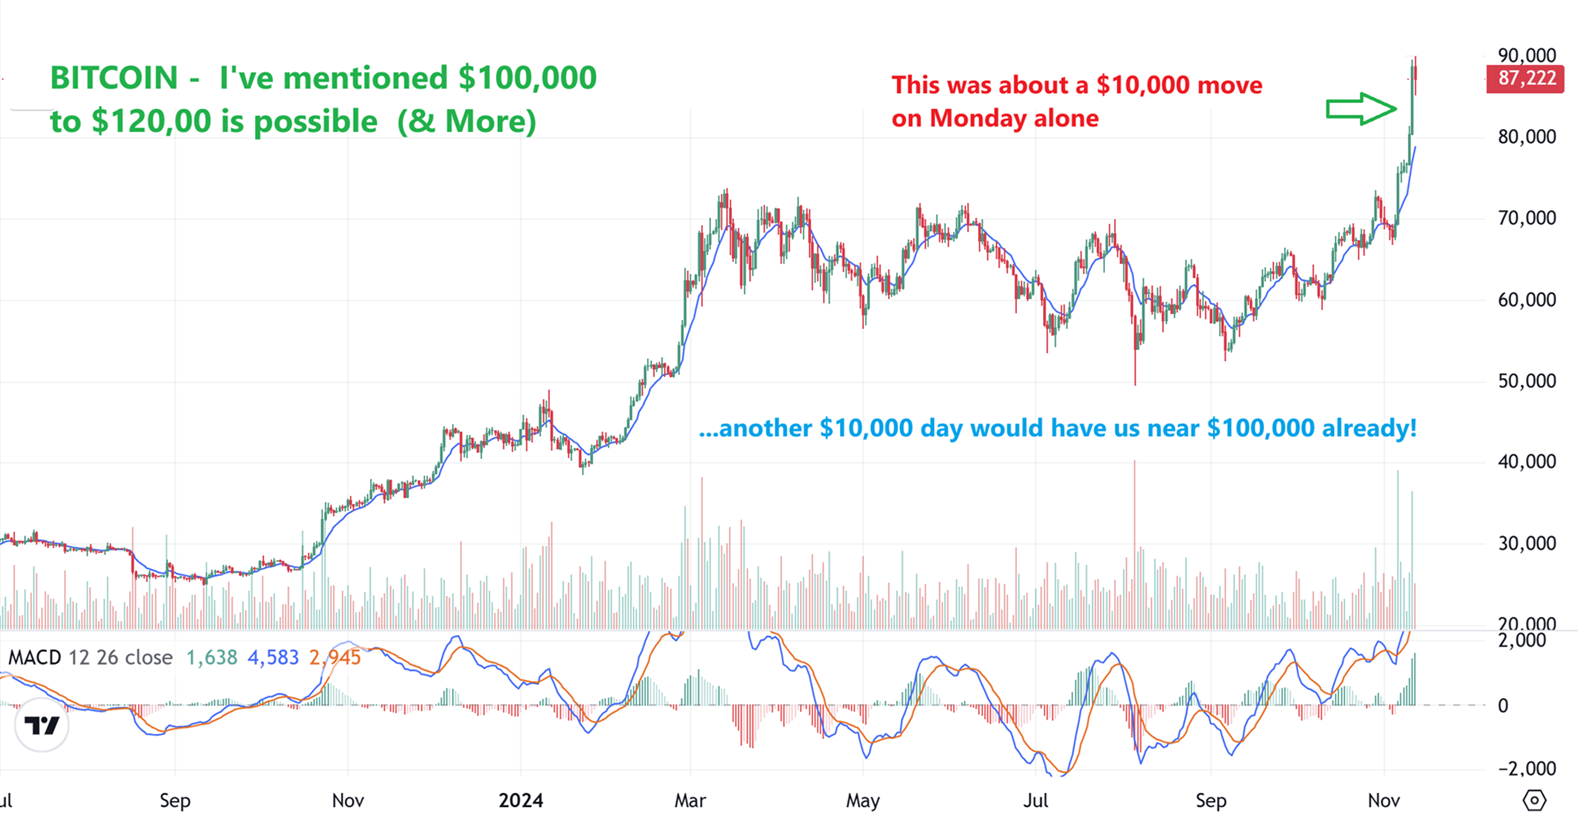
Bitcoin: I honestly prefer a slower run of $2,000/ day, since it is sustainable over time, but we are seeing a move that was almost a $10,000 day gainer. It becomes unsustainable, unless it chops sideways and puts on a bull flag. Please read the chart. This means that the move becomes less predictable, but it does match the kind of move that we saw leading into the consolidation.
.
I was asked in an email if we already could be at a ‘blow off top’?
.
Bitcoin: I really don’t think that we are in a blow off top, due to the timing of the larger yearly cycles. We may just be in the first box, it can still run even higher, and then after the next shorter consolidation & ICL, we could do another run. This is when the Crypto stocks have doubled, tripled, etc in the past.