
November 16th Weekend Review – The Winds of Change?
The winds of change may be blowing into the markets this week. Let’s go to the charts…
.
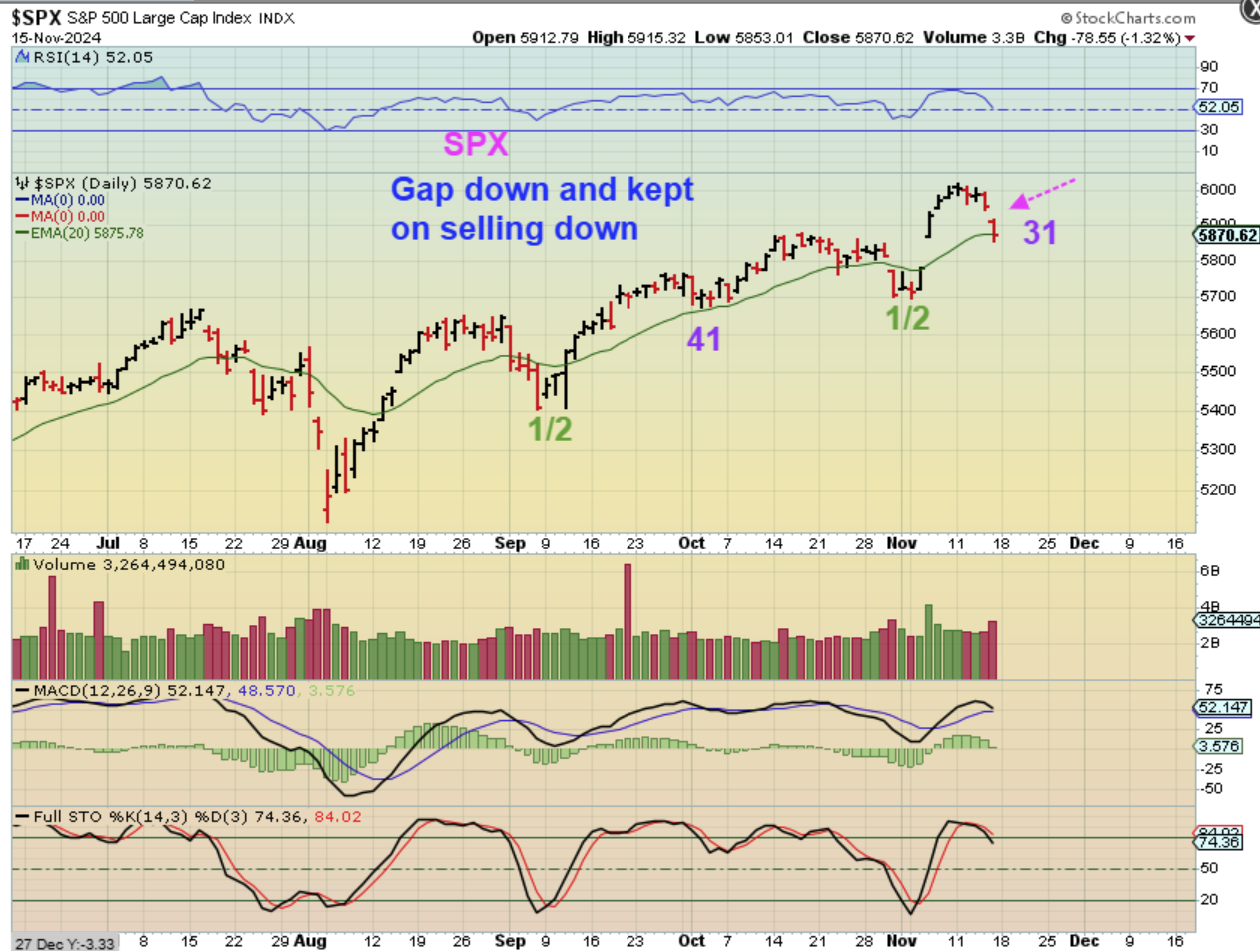
SPX DAILY – On Friday we saw the general markets gap open lower and close at the 20 ema. This does not make the chart look back on its own, however I have been warning about the SOXX looking not only weak, but broken. We’ll need to discuss that further in this report too.
.
SPX DAILY – This is the same chart, but I wanted to point out that we are on day 31 and the last daily cycle lasted 41 days, so this could potentially sell down for 2 more weeks (Or chop around).
.
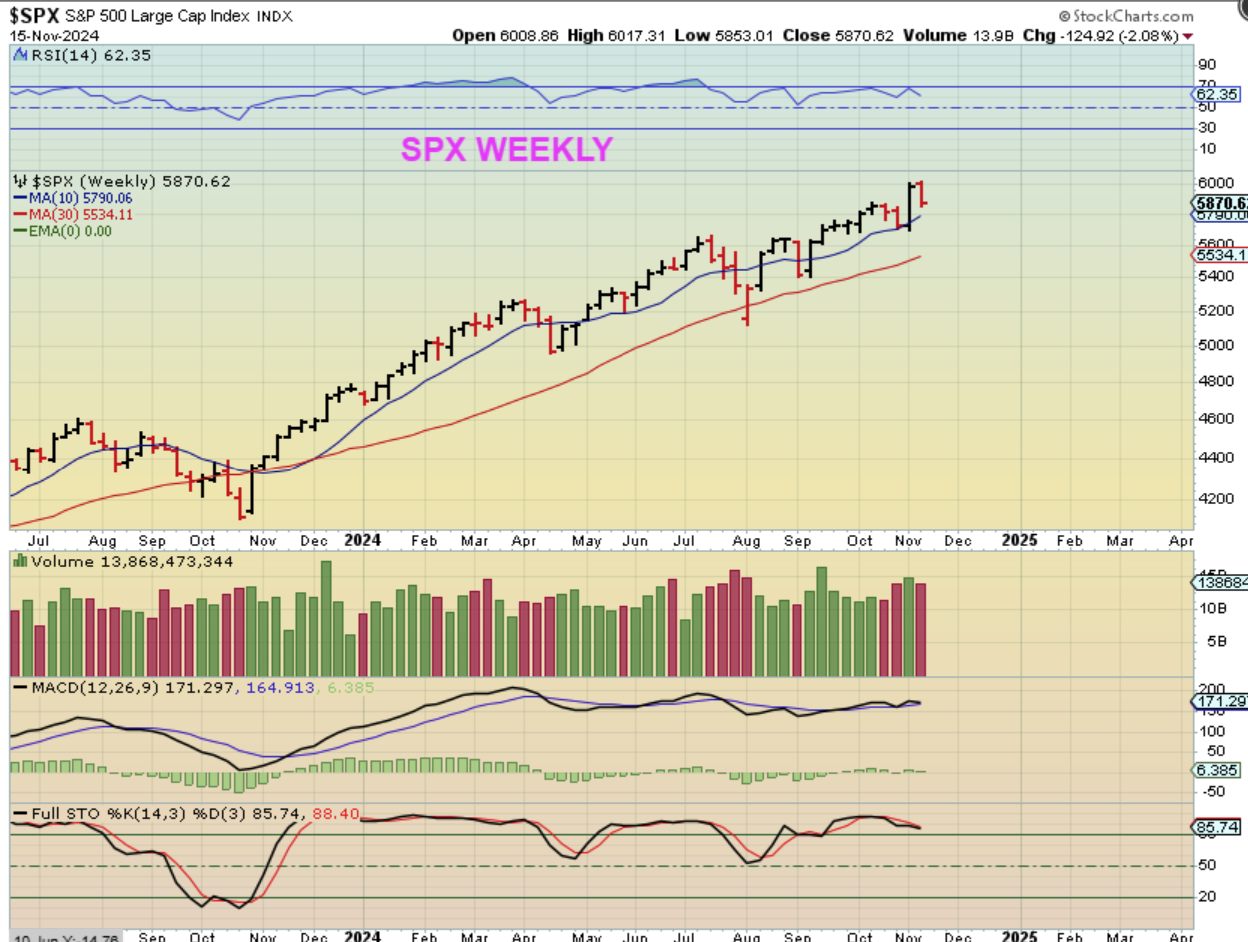
SPX WEEKLY -Again, this chart doesn’t look bad by itself, it actually hit new all-time highs this week, but it did close down 2% and the SOXX may be a warning sign.
.
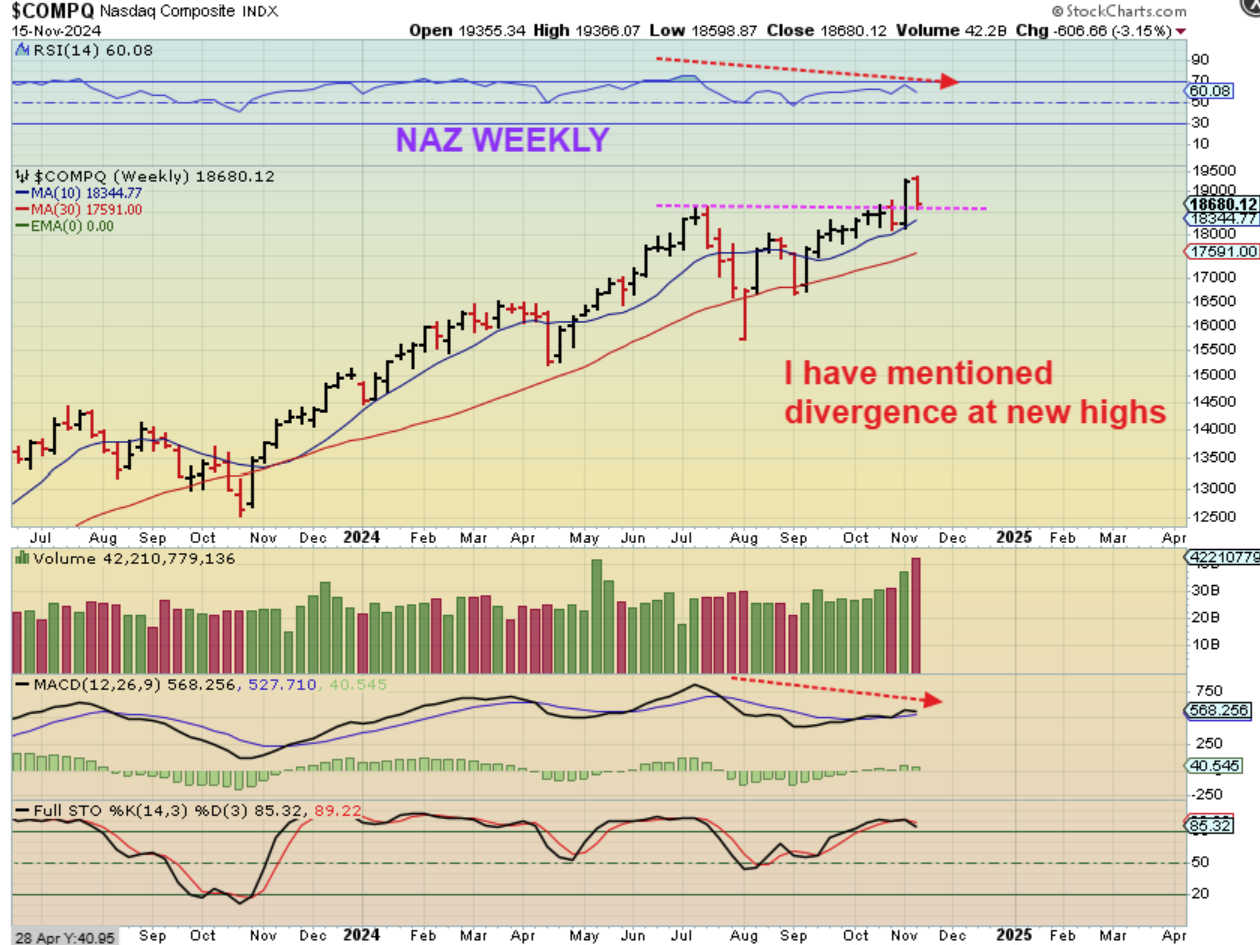
NASDAQ WEEKLY – The weekly Nasdaq chart closed down 3% and it also doesn’t look bad all by itself, but we do see weekly divergence at the highs and next we’ll discuss the SOXX.
.
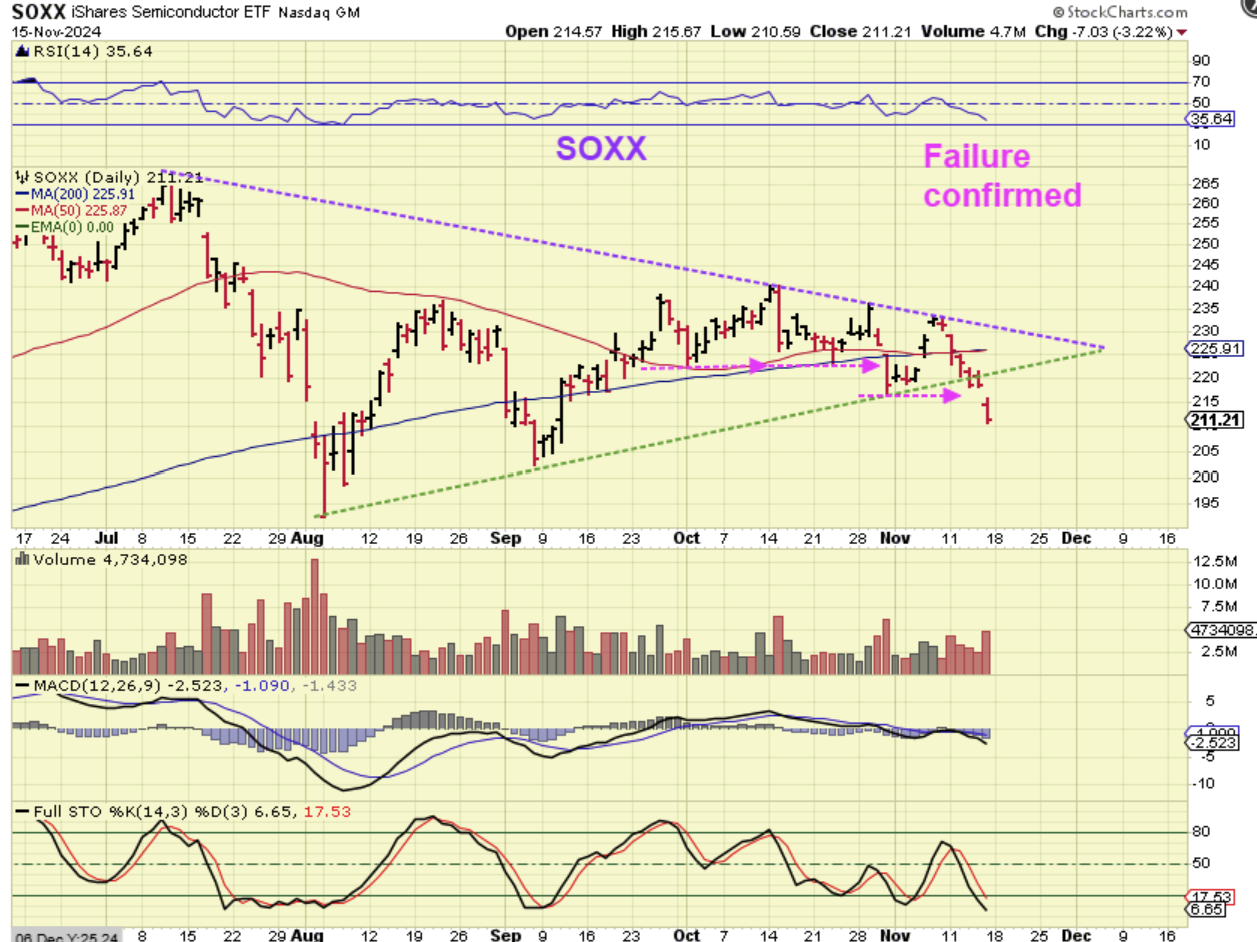
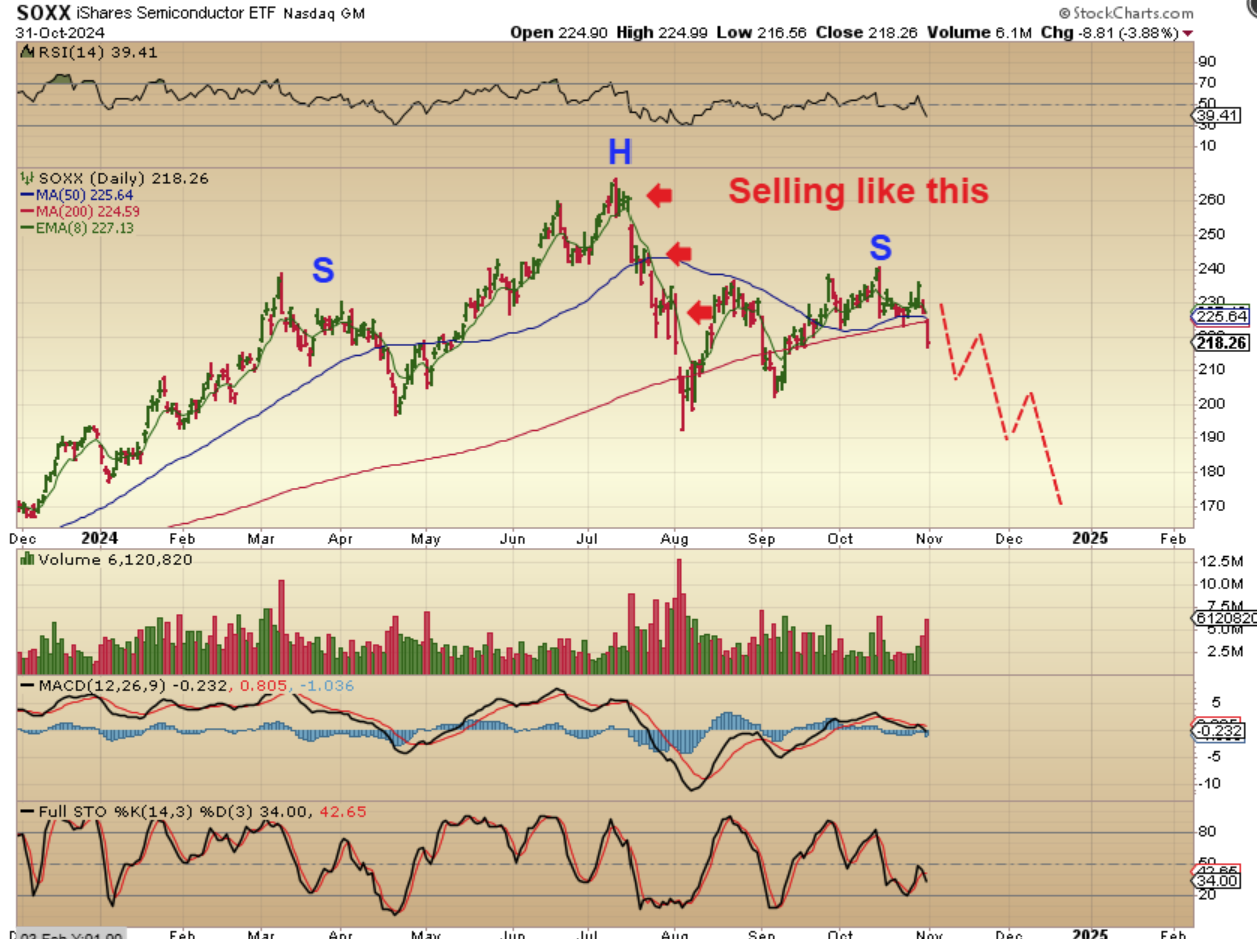
SOXX DAILY – The SOXX failed a while ago when it broke below the daily cycle low. I pointed that ‘failure’ out as a warning sign, and we did not see the SOXX break above that triangles downtrend since then. It DID break below the supportive uptrend line though, which was also the bottom of the triangle. I see lower highs and lower lows since October. This confirmed failure does not bode well for the markets, since it has happened during the 2nd daily cycle.
.
SOXX DAILY NOV 1st – 2 weeks ago I warned that the SOXX looked to be forming a large H&S pattern, and could bounce lower as drawn here…
.
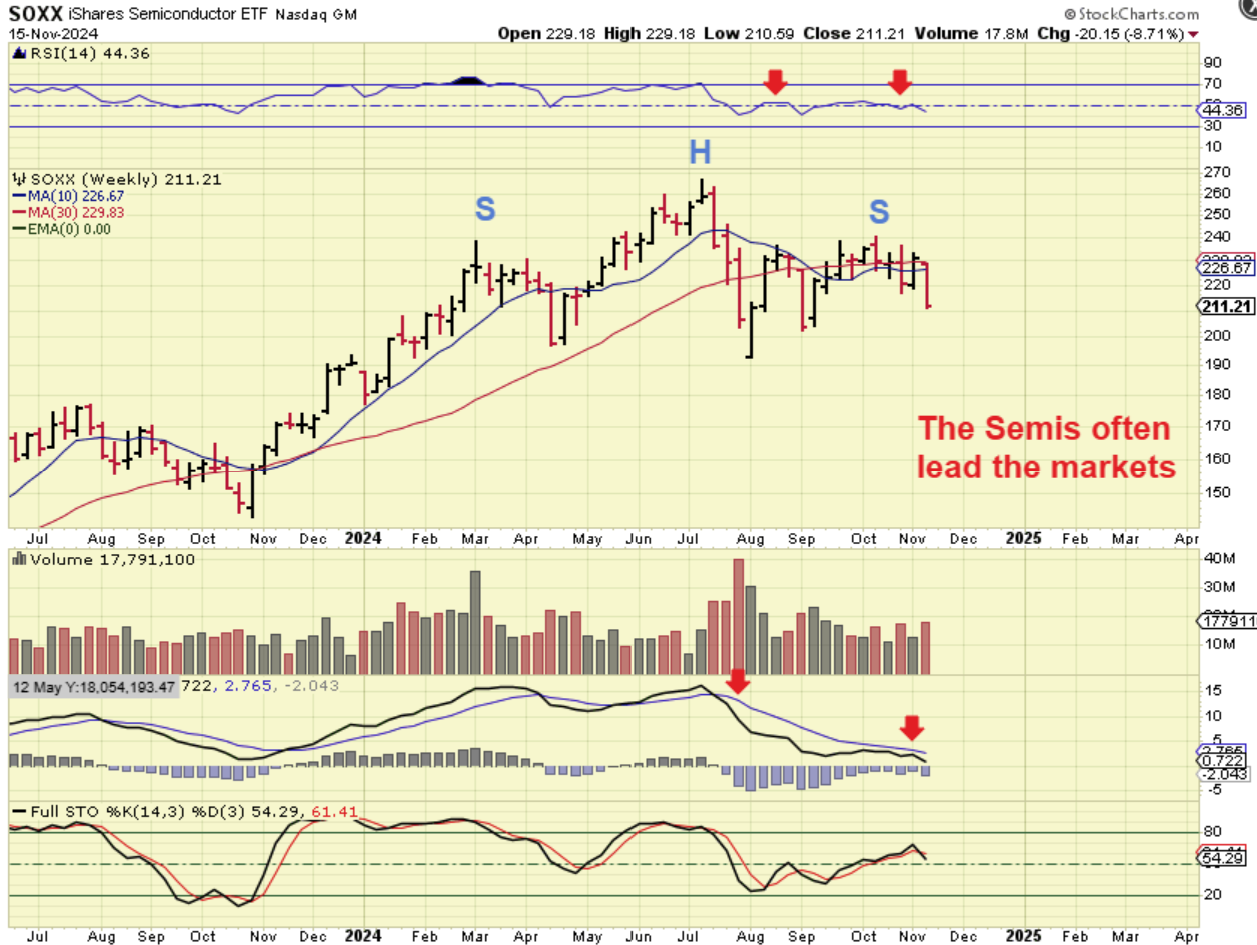
SOXX WEEKLY – The weekly chart now looks like a H&S has formed and we closed at last weeks lows. The SOXX lost the 10 & 30 week ma, and was down almost 9% for the week. THIS could lead the markets lower. The weekly MACD is a ‘weak’ MACD.
..
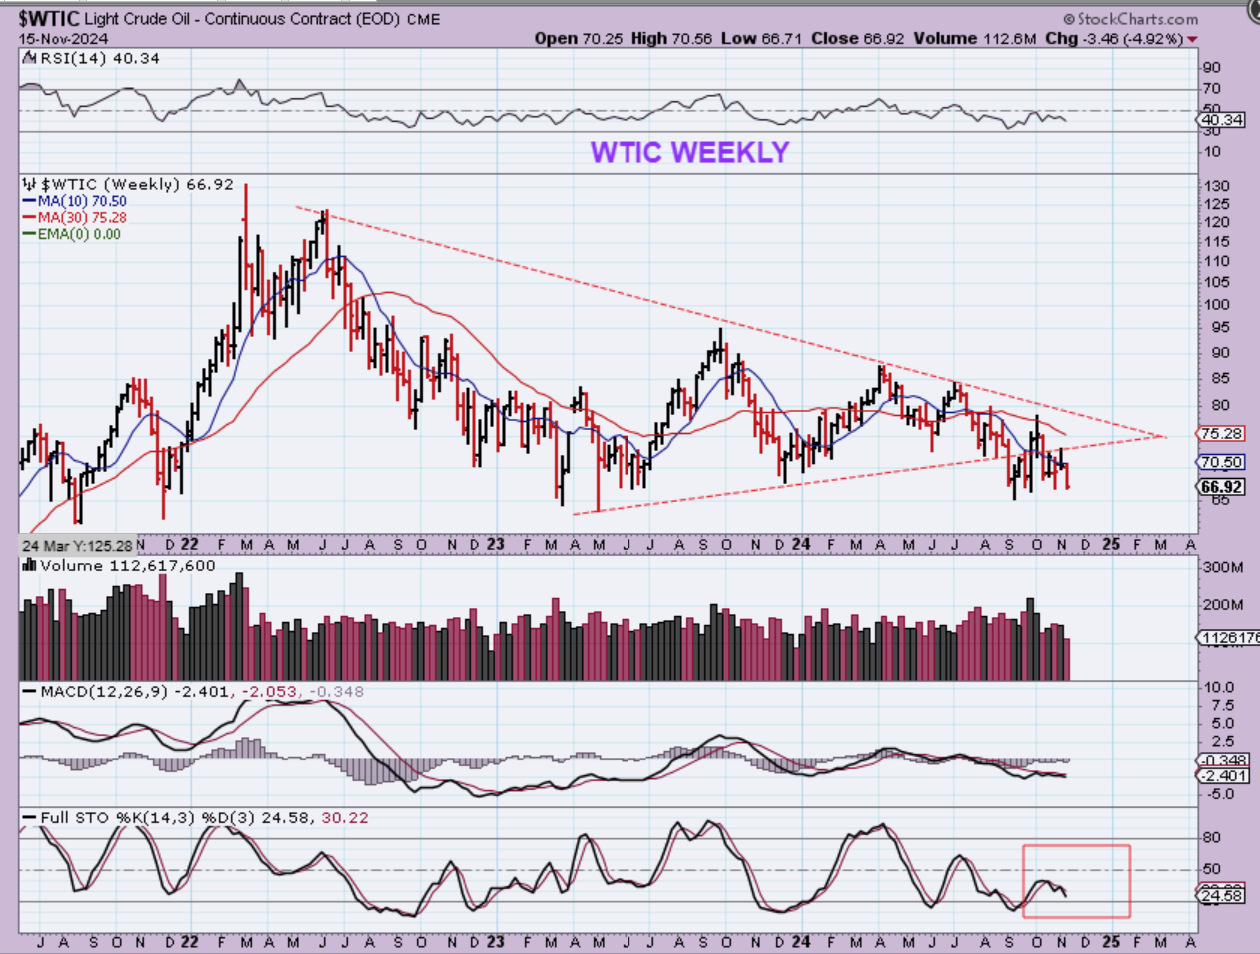
WTIC WEEKLY – Oil lost the large triangle a few weeks ago and closed at the lows this week, but it is near the timing for a dcl and we’ll see if it also forms an ICL. I felt that Oil could break down here and just continue lower after a while, but recently, as mentioned in the weekday reports, the Oil stocks do not look as bad as Oil does. They actually became bullish, so Oil may be close to bottoming out. We’ll see.
..
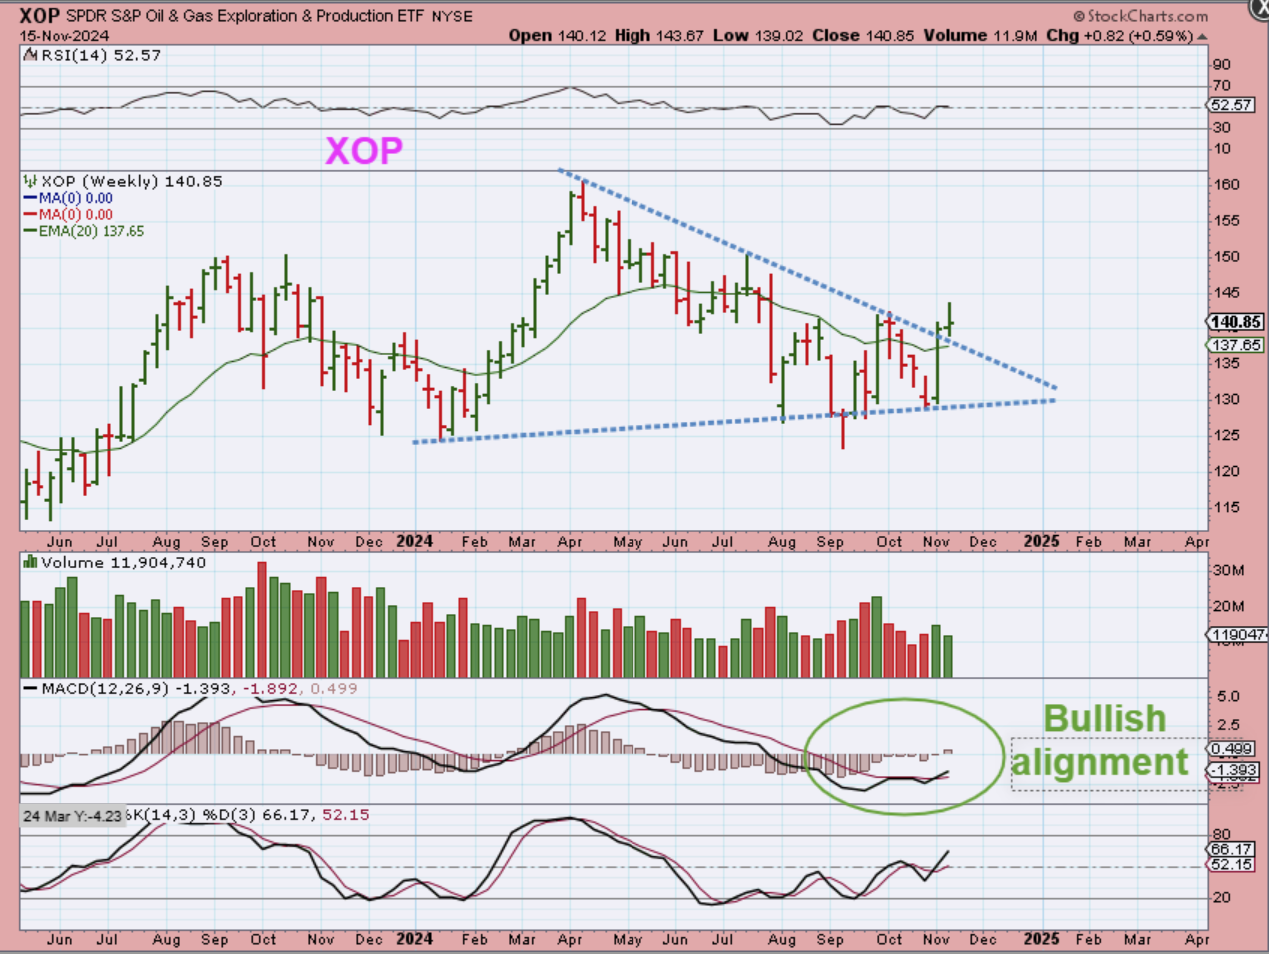
XOP WEEKLY -The Oil stocks did not drop to the lows like Oil itself did. In fact, The XOP was up 8% 1 week ago and broke the downtrend of a triangle and has more of a bullish MACD set up, so this makes it look as though Oil is at the lows and may be close to bottoming with an ICL.
.
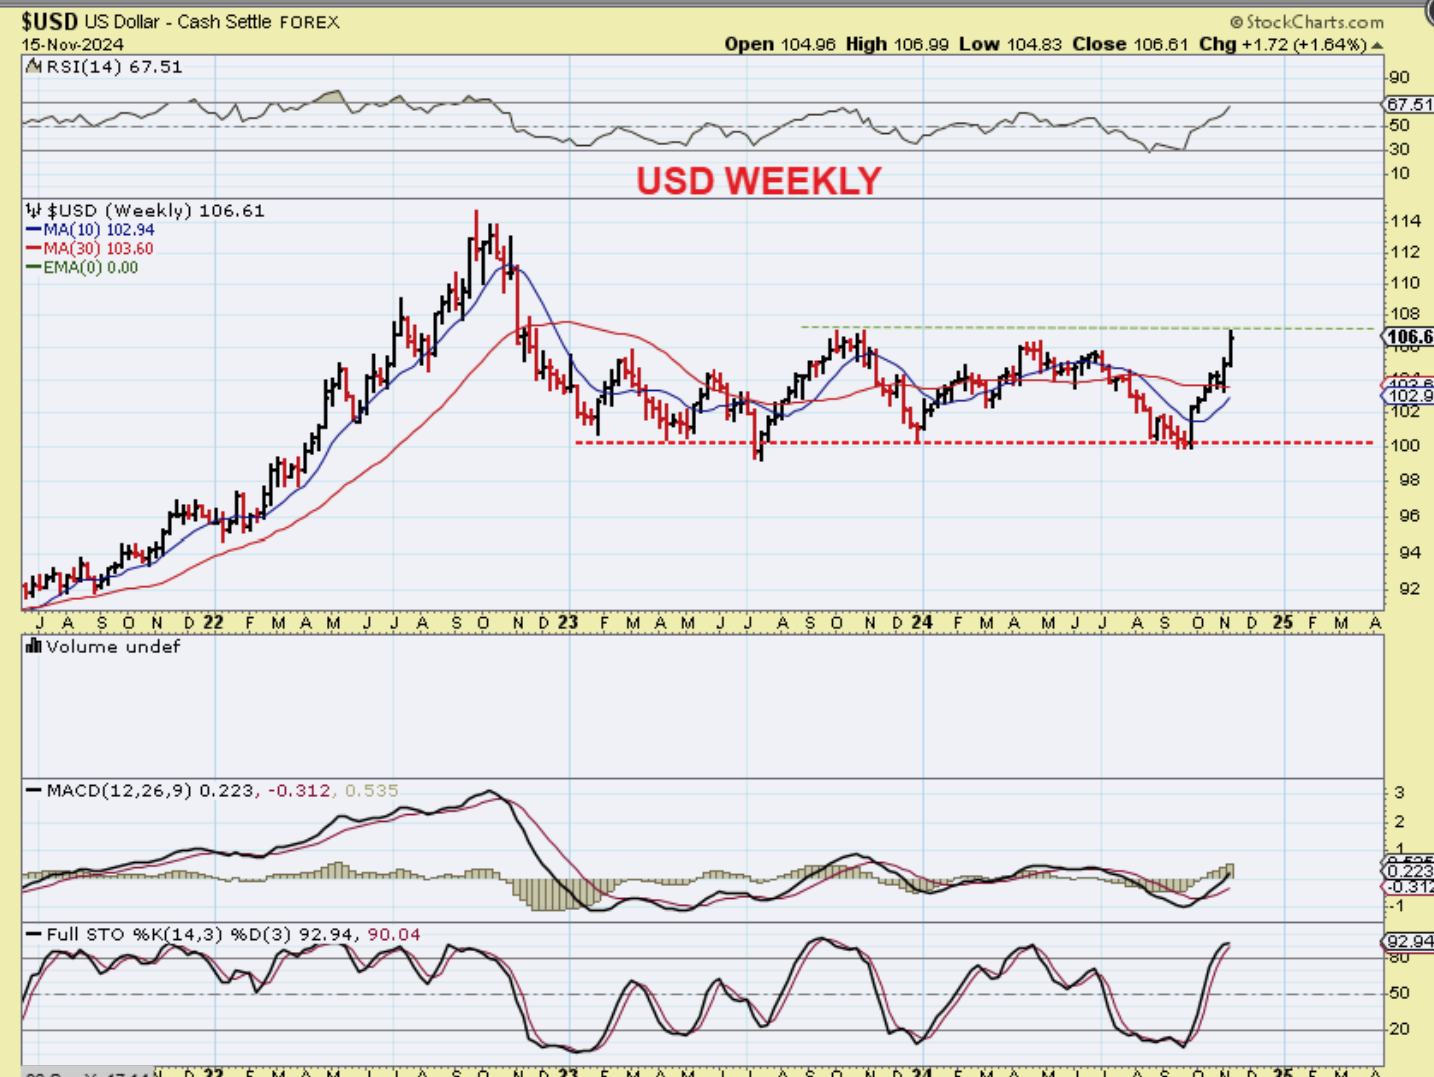
USD WEEKLY – The USD hit the $107 area last week and I have been looking for possibly a peak at $107.50. At the rate that this has been climbing, it may break that $107.50 area next week and go even higher? The USD has been climbing for 7 straight weeks and the good news is that Gold has NOT been dropping for the past 7 weeks, but it DID drop sharply last week as the USD rose sharply. Let’s take a look…
.
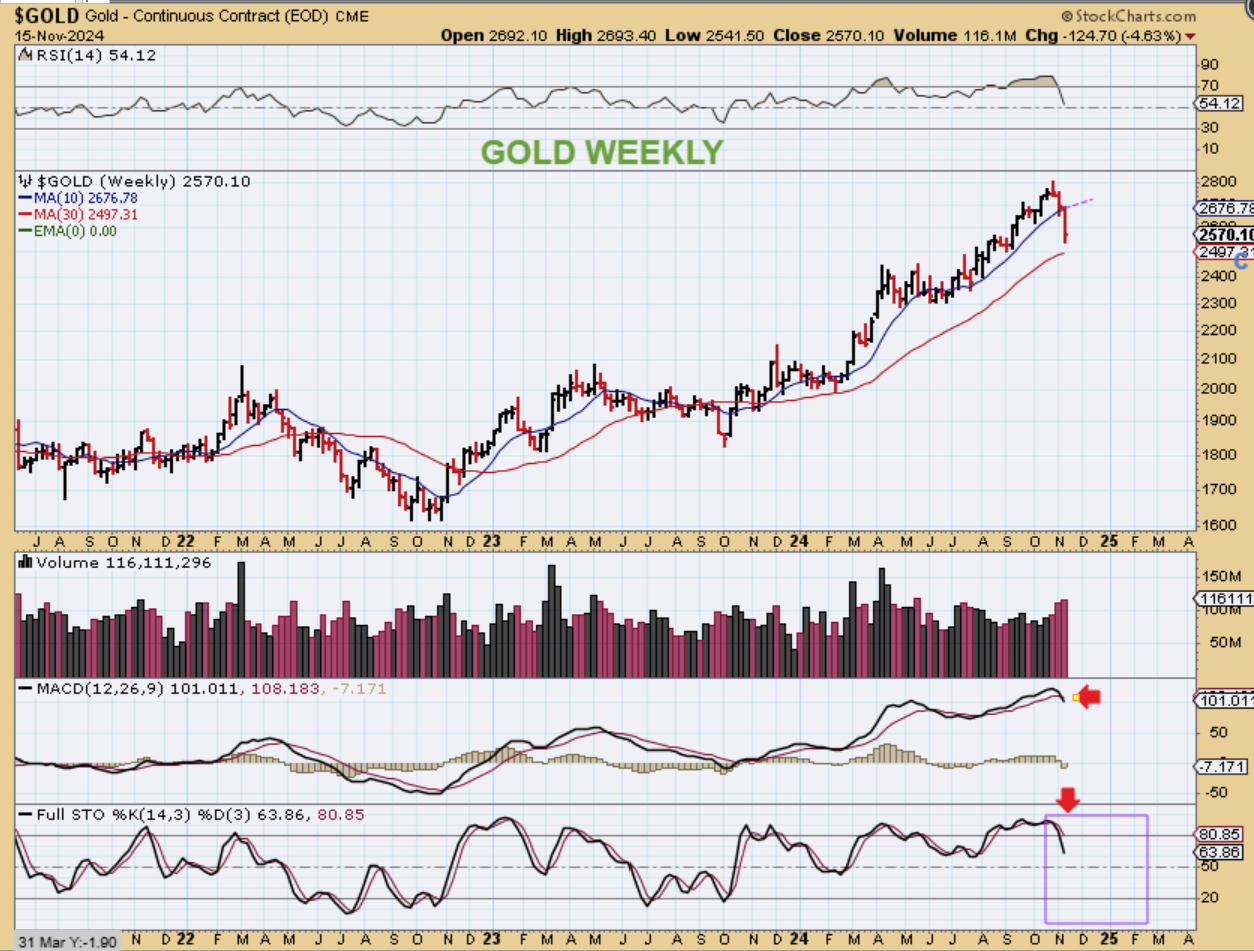
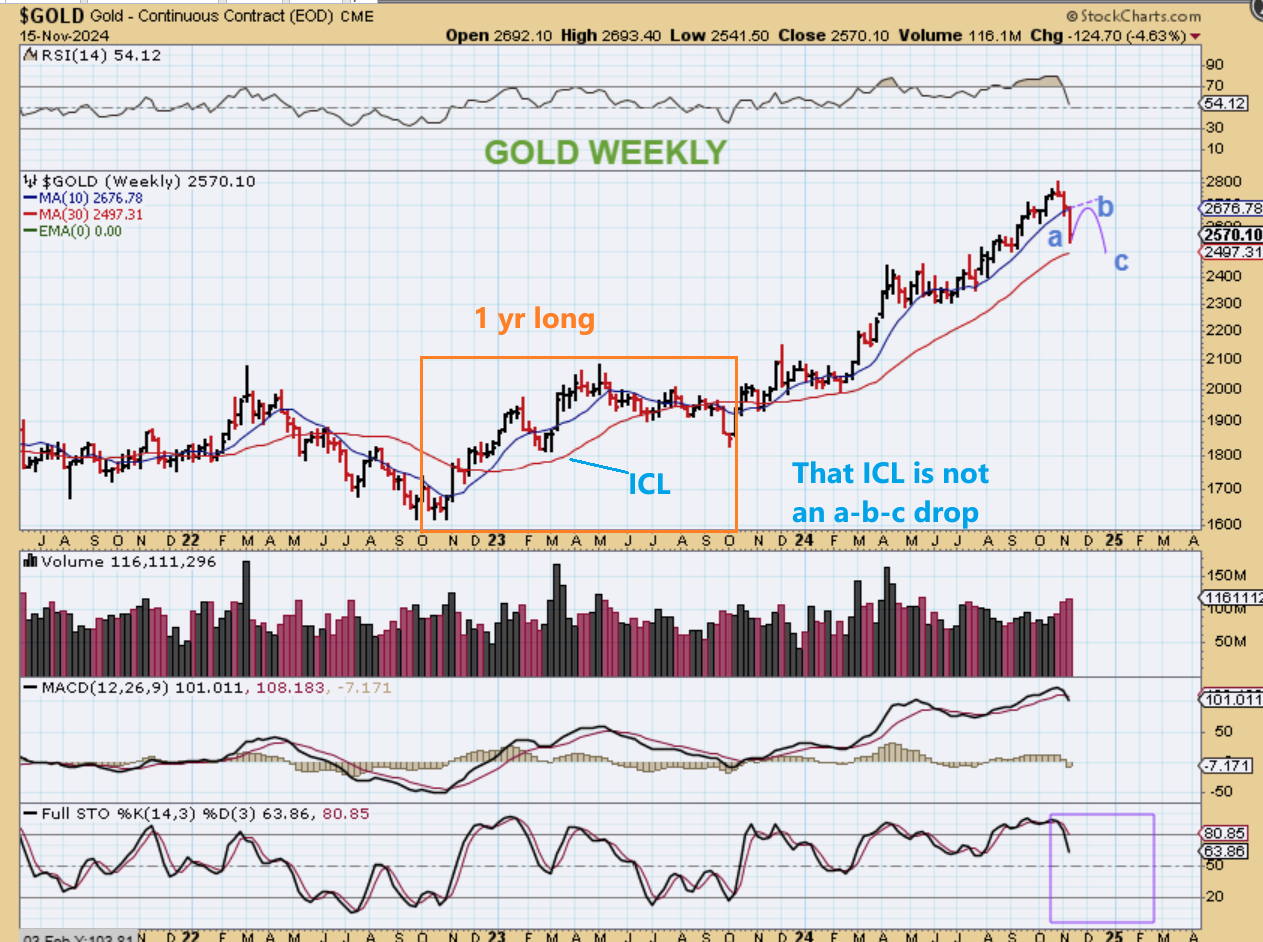
GOLD WEEKLY #1 – You can see that Gold only dropped over the last 2 weeks, so the 7 week rise of the USD did not affect Gold that much, but Gold did break down last week and it is due to drop into an ICL. That may happen after 1 more daily cycle develops, but that doesn’t mean that we drop straight down from here…
.
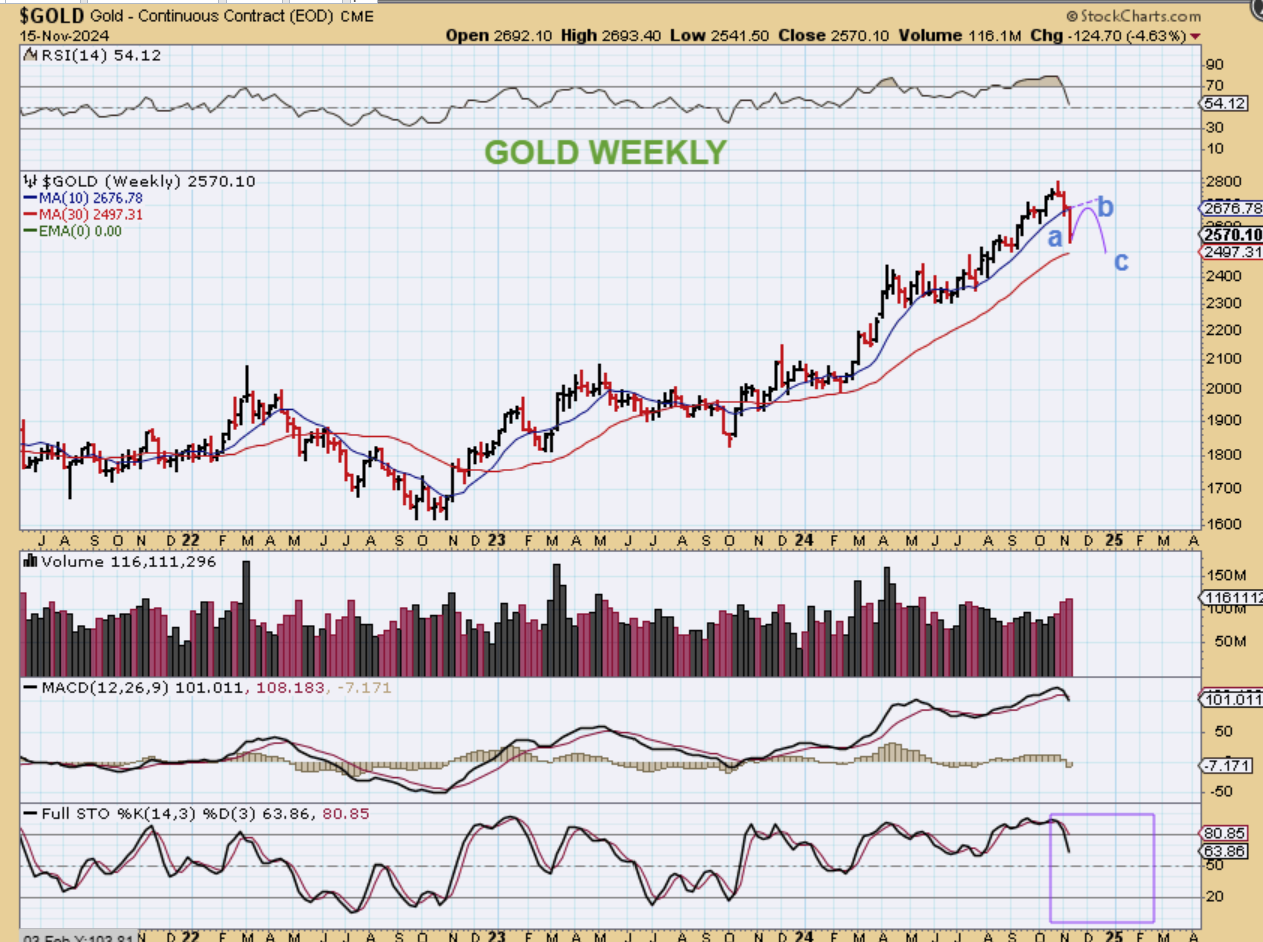
GOLD WEEKLY #2 – An ICL often forms from an a-b-c type of a drop, so 1 more daily cycle could look something like this.
.
I DO WANT TO POINT SOMETHING OUT HERE: IN A BULL MARKET Not all dips into an ICL develop as an ‘a-b-c’ on a weekly chart.
.
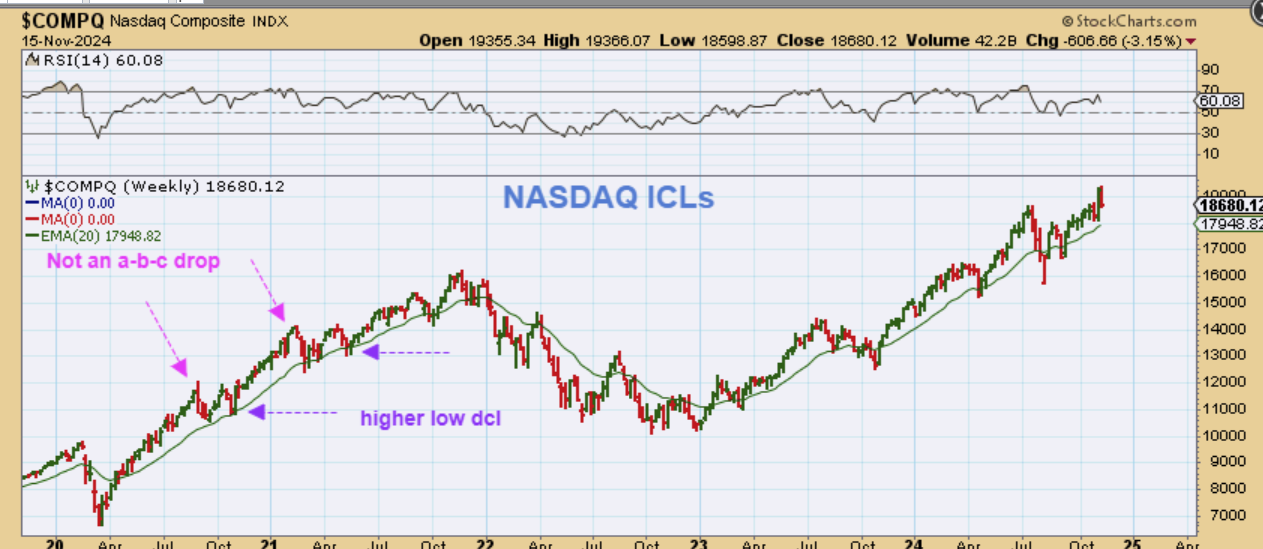
NASDAQ ICLs – Not all dips into an ICL develop as an a-b-c on a weekly chart. When the NASDAQ was in a strong bull phase, you can see that it simply dropped for 3 or 4 weeks and then that was it-the selling stopped there, and the Bull run then continued. Could this happen with Gold? It could.
.
GOLD WEEKLY #3 – So now take a look at that quick sharp drop that we saw with Gold in March 2023.
I drew a box that is 1 year long, from an Oct ICL to the next Oct ICL. Since ICLs often come in roughly around every 6 months, that was a quick drop into an ICL in March, but it was not an a-b-c style dip.
.
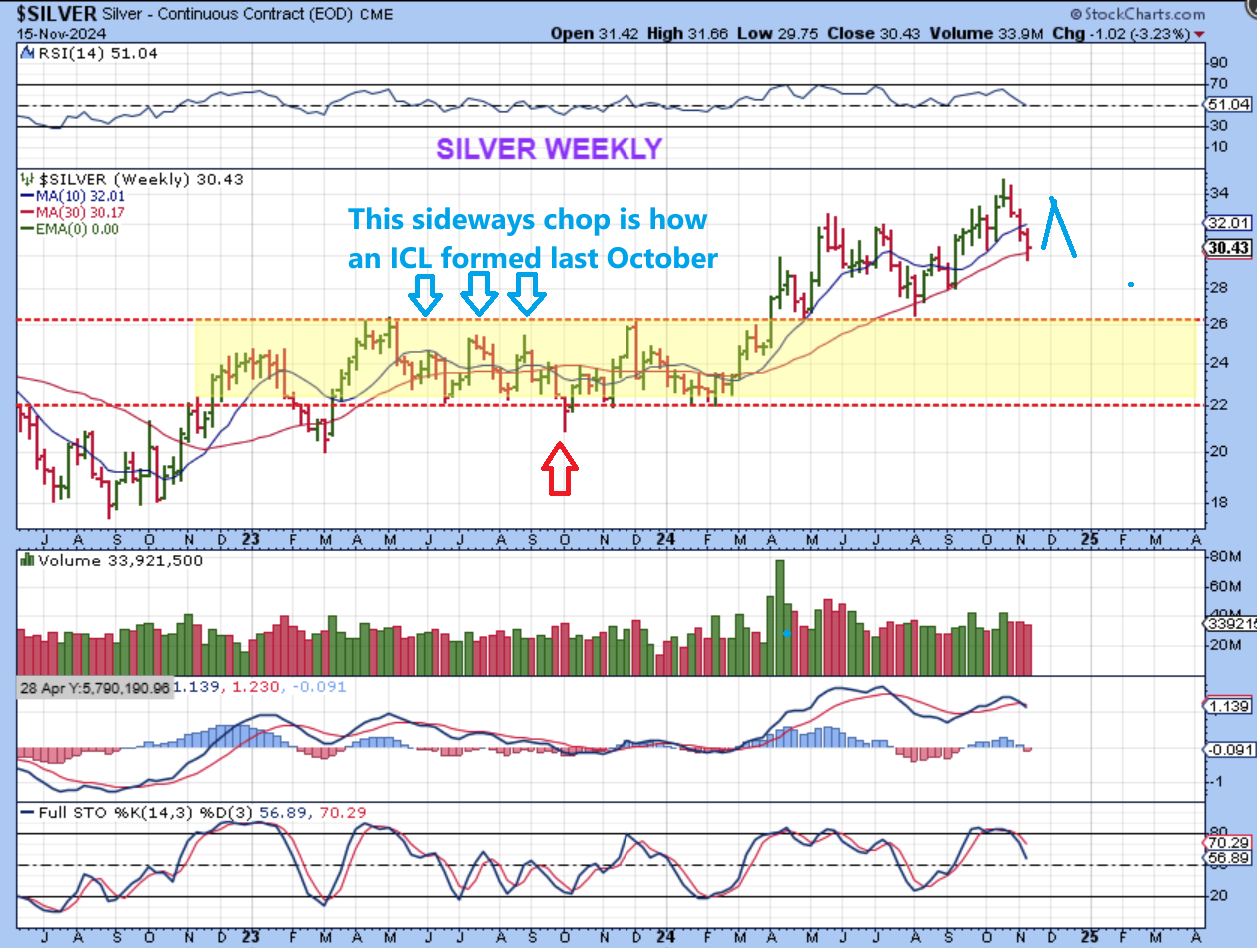
SILVER WEEKLY – I thought that it was interesting to see how the ICL formed last October with Silver. It simply spiked down and recovered after a couple of months of sideways choppy daily cycle. So right now Silver is on the 30 week ma and it may be ready to start another daily cycle, so we may again see sideways chop and the final low (ICL) may not be a drop to $26 support, but instead may just be a drop back to the 30 week ma.
.
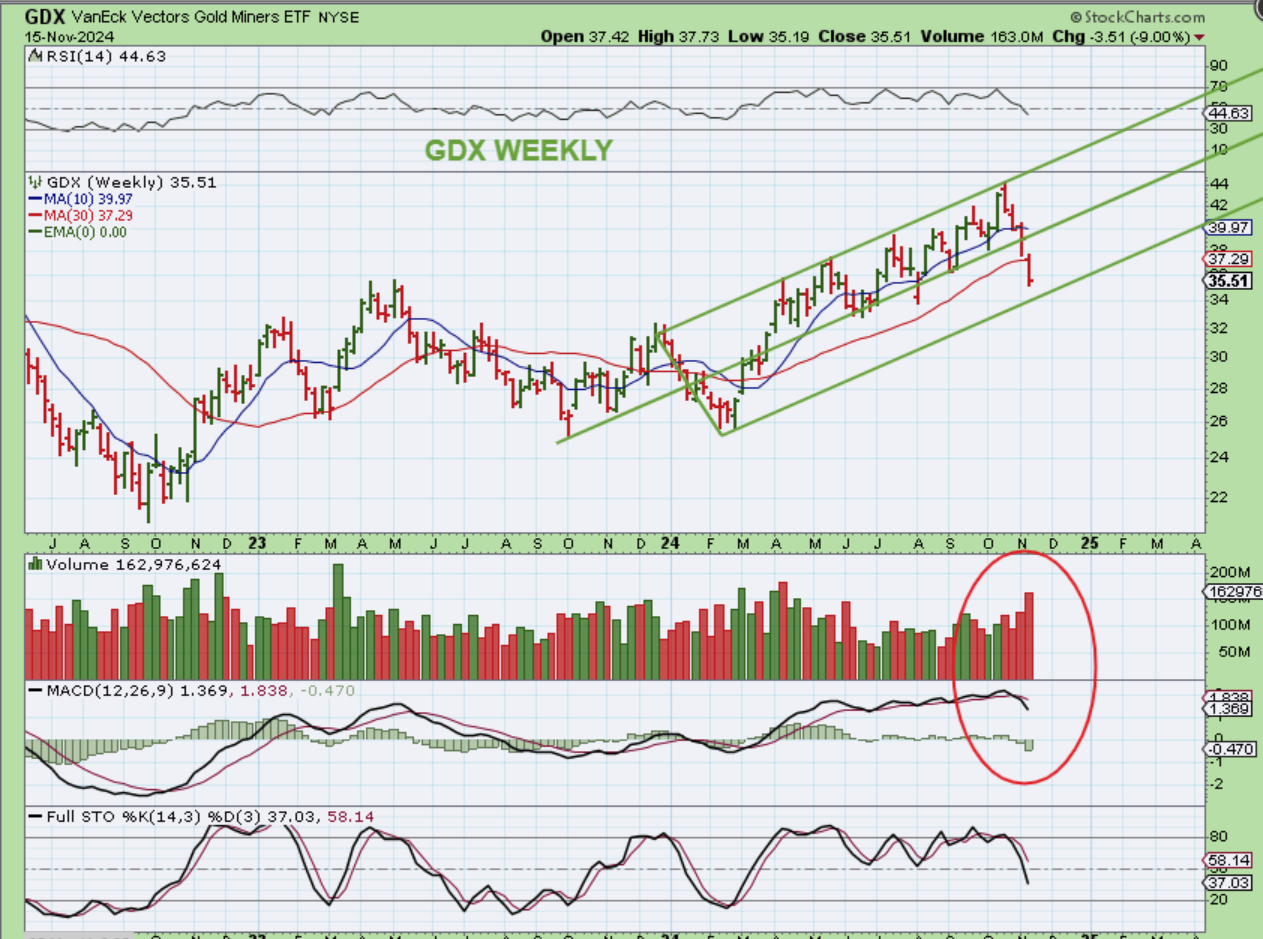
GDX WEEKLY – Using Andrews Pitchfork, we see that the GDX lost the upper channel and also broke below the 30 week ma. Similar to Gold and Silver, GDX is dropping into an ICL, but may need 1 more daily cycle to complete the move / bottoming process. This does look similar to the drop in March of 2023, however, and that was simply a straight down 4-5 week drop.
.
The General Markets need to be monitored closely, because we are already seeing cracks appear. The SOXX broke down and the semis usually lead the markets, so some may want to think about shorting or using a short position as a hedge if they rode some stocks out of the ICL. Oil should bottom soon and Oil Stocks look good, as long as they don’t get caught up in any selling if or when the General markets sell down. The USD has been very strong and is in a 2nd daily cycle. Gold, Silver, and the Miners are dropping down into a dcl. That dcl may become an ICL, but it does seem more likely that we’ll bounce and then drop 1 more time. You can play the bounce just in case it rallies from that low. Finally, Bitcoin. Bitcoin has been very bullish, but the Crypto stocks all dropped and pulled back when Bitcoin ramped up over $90,000. Was it just a normal pull back for the stocks or a disconnect that we saw earlier in 2024? I discussed that possibility in my reports, but it was interesting that on Friday, when the General Markets sold off all day long, Crypto stocks bounced and recovered to green. Many were up 3-4% and some were up even more than that, so I’ll discuss Bitcoin below.
.
Enjoy your weekend and thanks for being here with me!
.
~ALEX
.
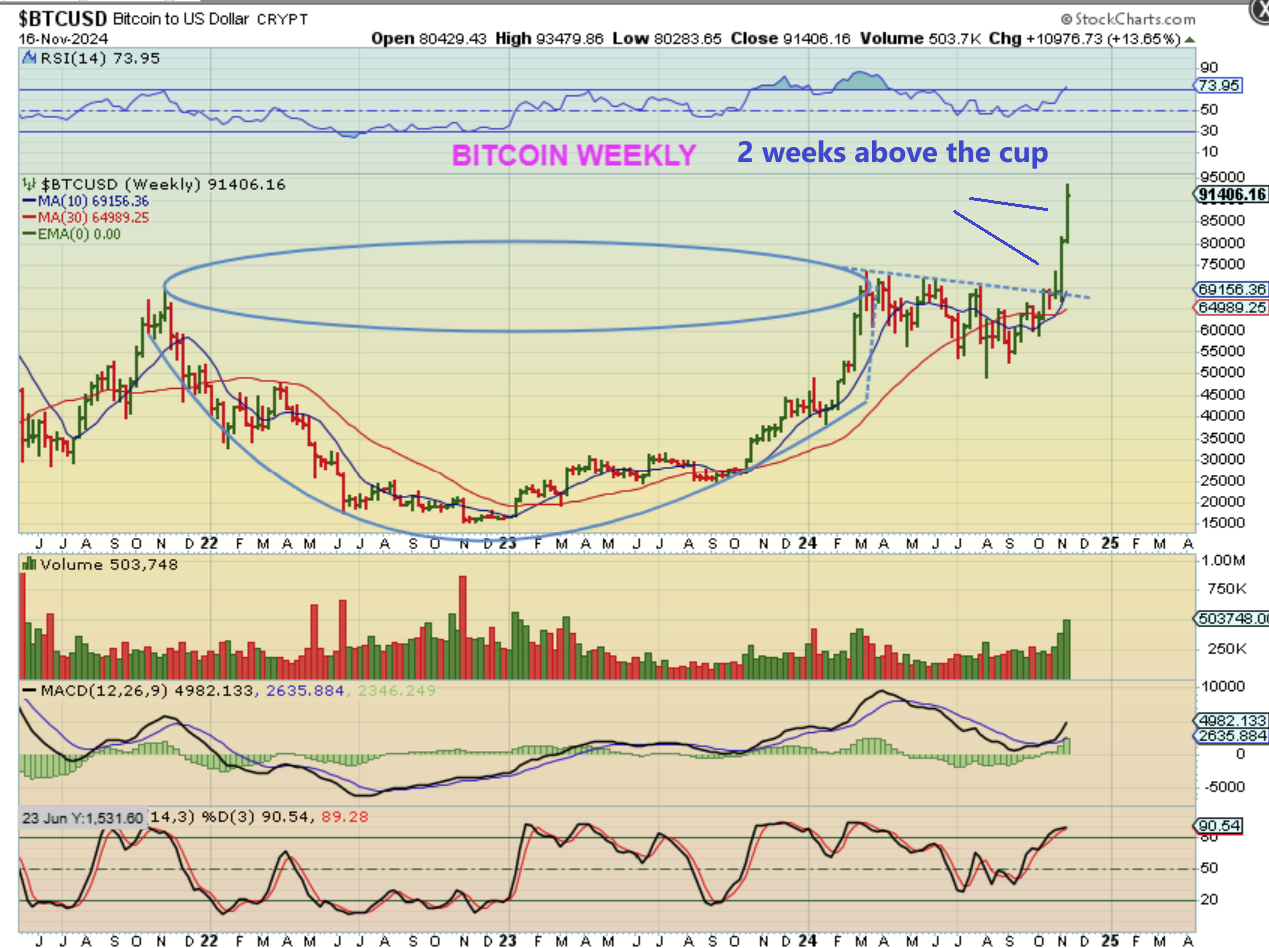
BITCOINS WEEKLY CUP: I wanted to start by taking a look at the cup and handle breakout. Bitcoin has had 2 very strong weeks higher, but can this surge higher last much longer?
.
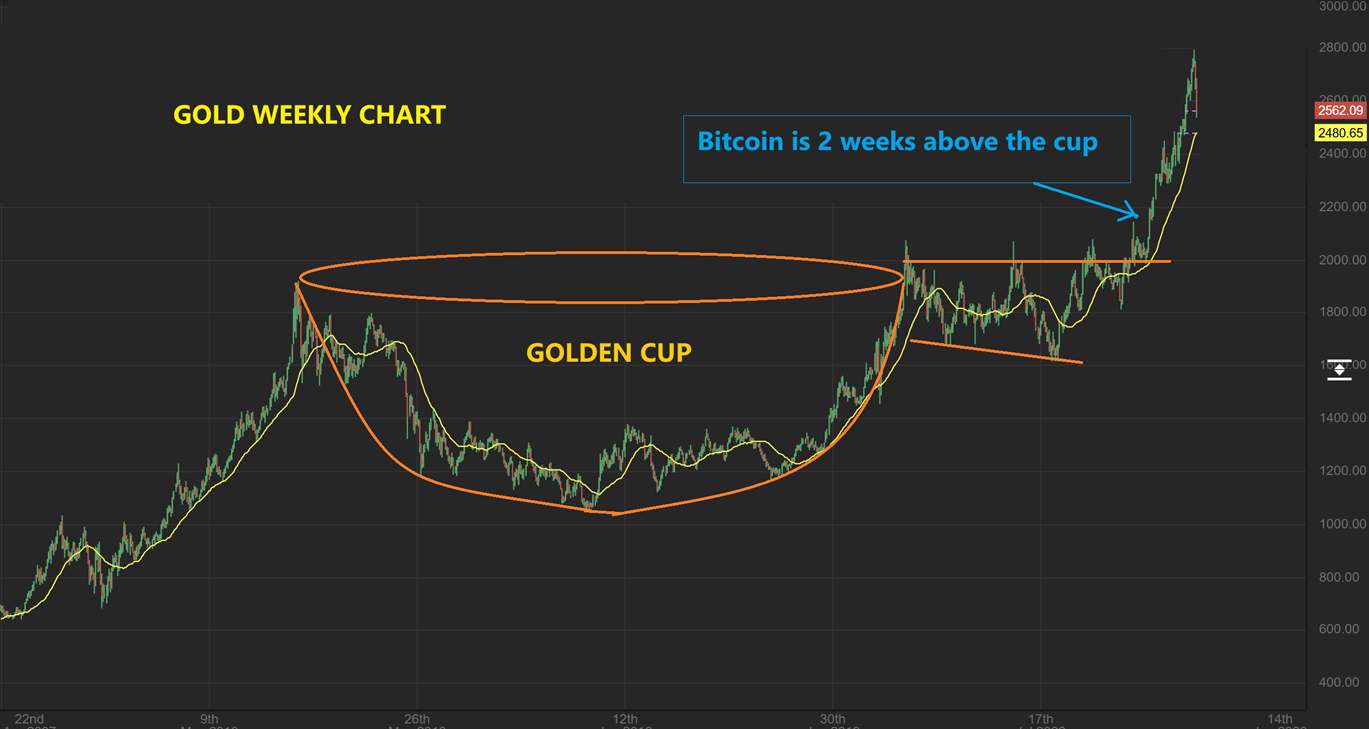
GOLD WEEKLY CUP: Take a look at Golds Weekly Cup. There were pauses along the way, but Bitcoin is only 2 weeks above the cup and here when Gold broke out in Feb 2024 it ramped up for a few weeks. It is still simply giving minimal pullbacks, so Bitcoin can run for a while (with dcls and dips along the way, of course).
.
I just wanted to point out what I mentioned in the wrap up of this report: Most Crypto stocks reversed at support when the General Markets were selling down on Friday. That seems like bullish price action on a down day for the markets.
.
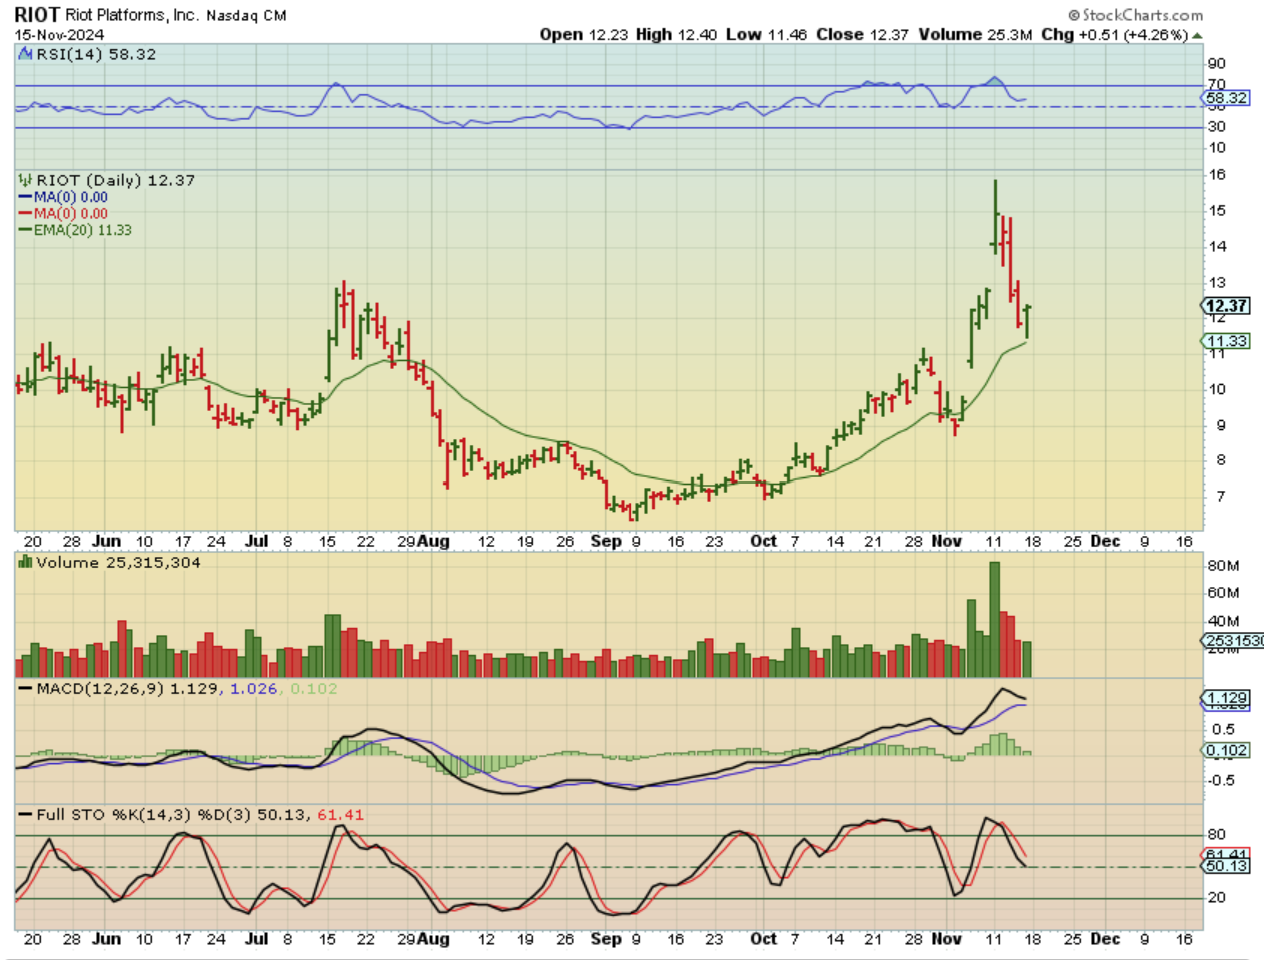
RIOT almost tagged the 20 ema on Fridays dip and then reversed higher as the markets sold off. RIOT closed up over 4% with the general Markets selling off.
.
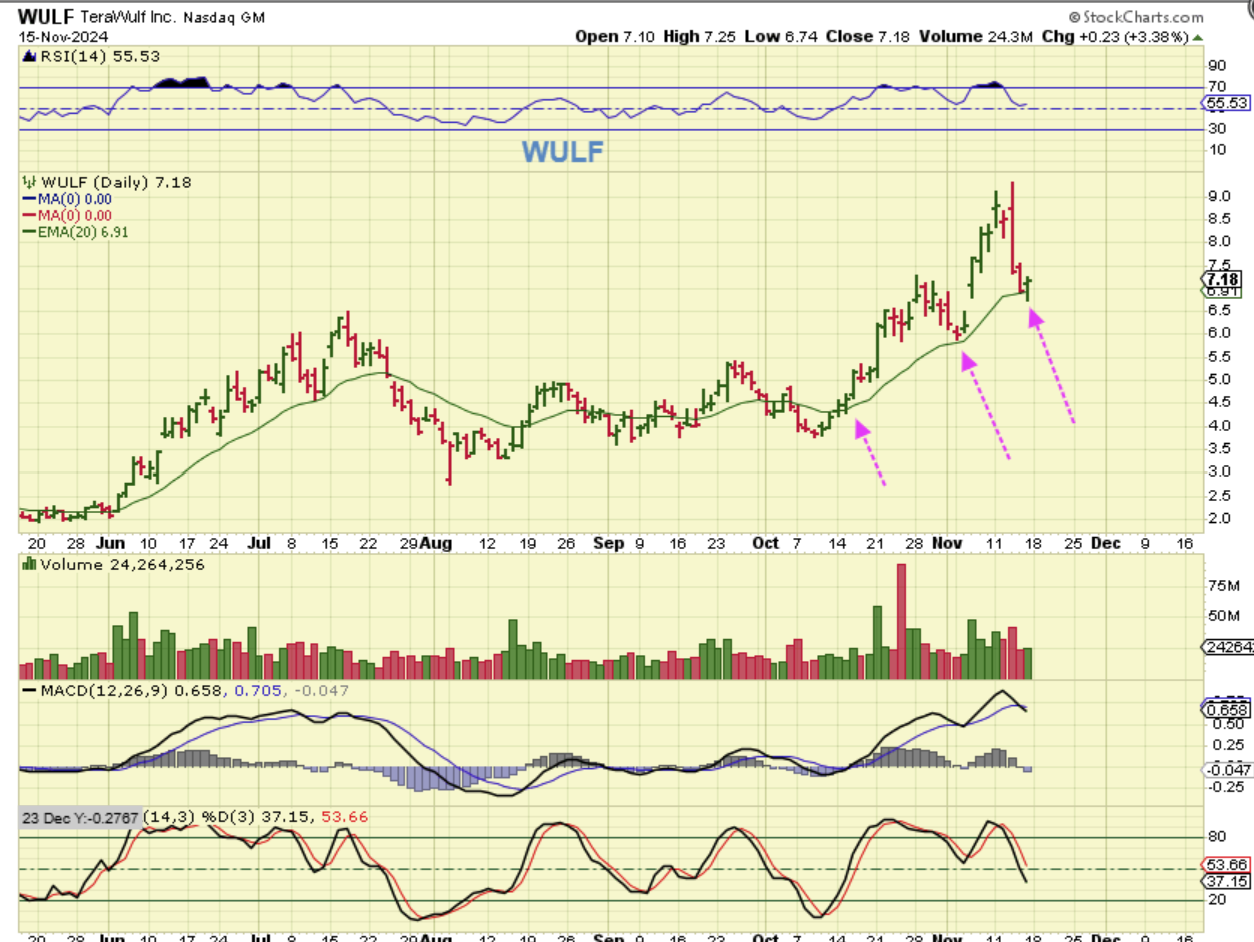
WULF DAILY – TeraWulf also reversed to green at the 20 ema, closing up over 3%.
.
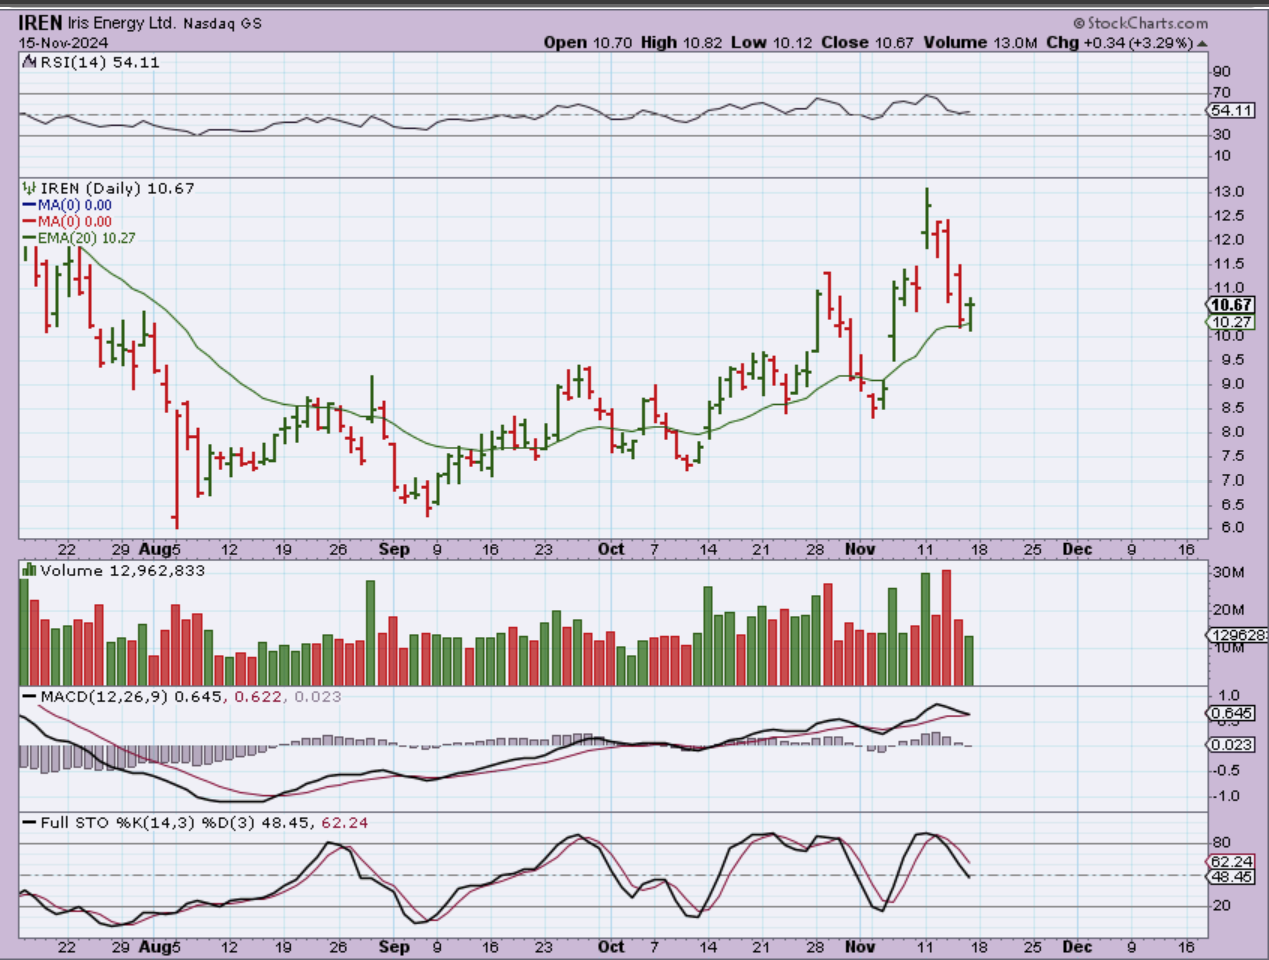
IREN DAILY – Iren also closed up over 3% after reversing at the 20 ema.
.
Many others did this too, so are these normal pull backs that will find buyers at support? At this point it does look that way. They can be bought with a stop under Fridays lows, but I would start small if you don’t already have a position or basket from the deeper lows in September.

