Friday November 8th – Choices
With Thursdays Jobs Report and The Fed Mtg later in the day, we got a quarter point rate cut and the markets continued to approve with more upside action.
.
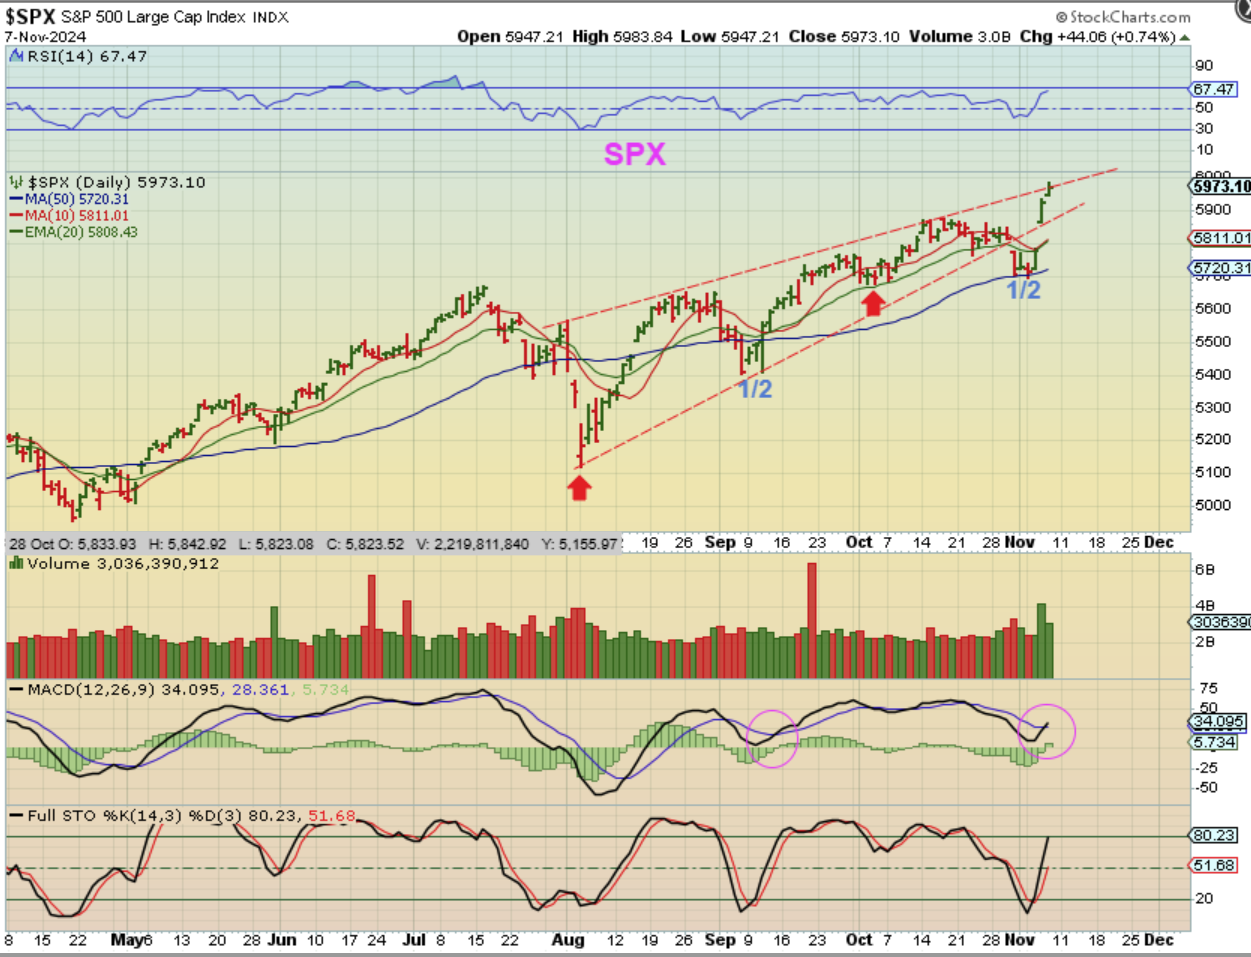
SPX – The markets had some follow through to that Pop that we saw after the election results were released. The gap open in the morning came in after the jobs report and then the Fed rate cut had a positive reaction too. So what about that SOXX chart?
.
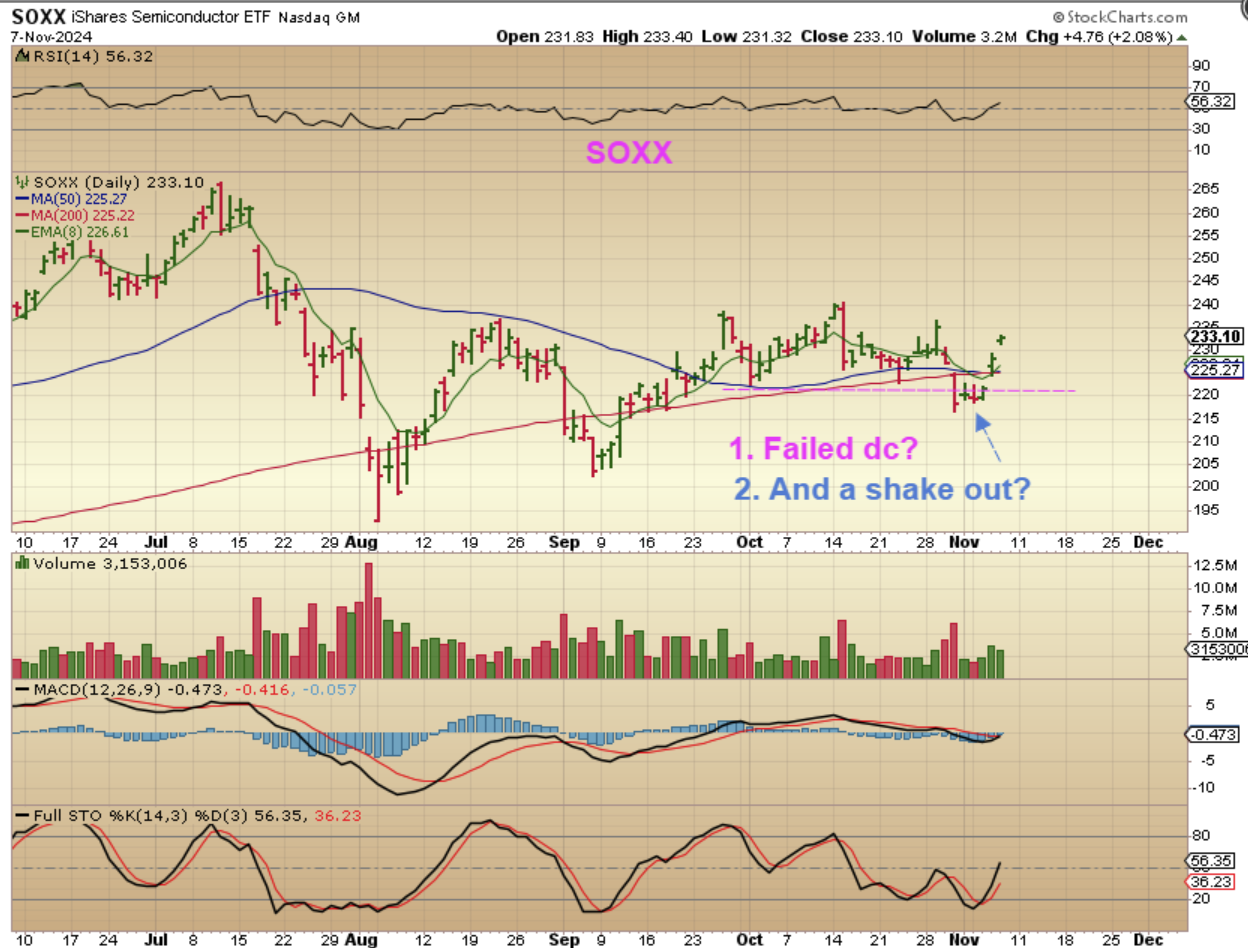
THE SOXX failed when it dropped below the dcl, but it also had a positive reaction to the elections, jobless claims, and the Rate Cute. It jumped back over the 50 & 200sma and looked like a shake out. I will also say that MSCI and AMD are trying to move higher, but NVDA and INTC Look excellent, so at this point it looks like a recovery.
.
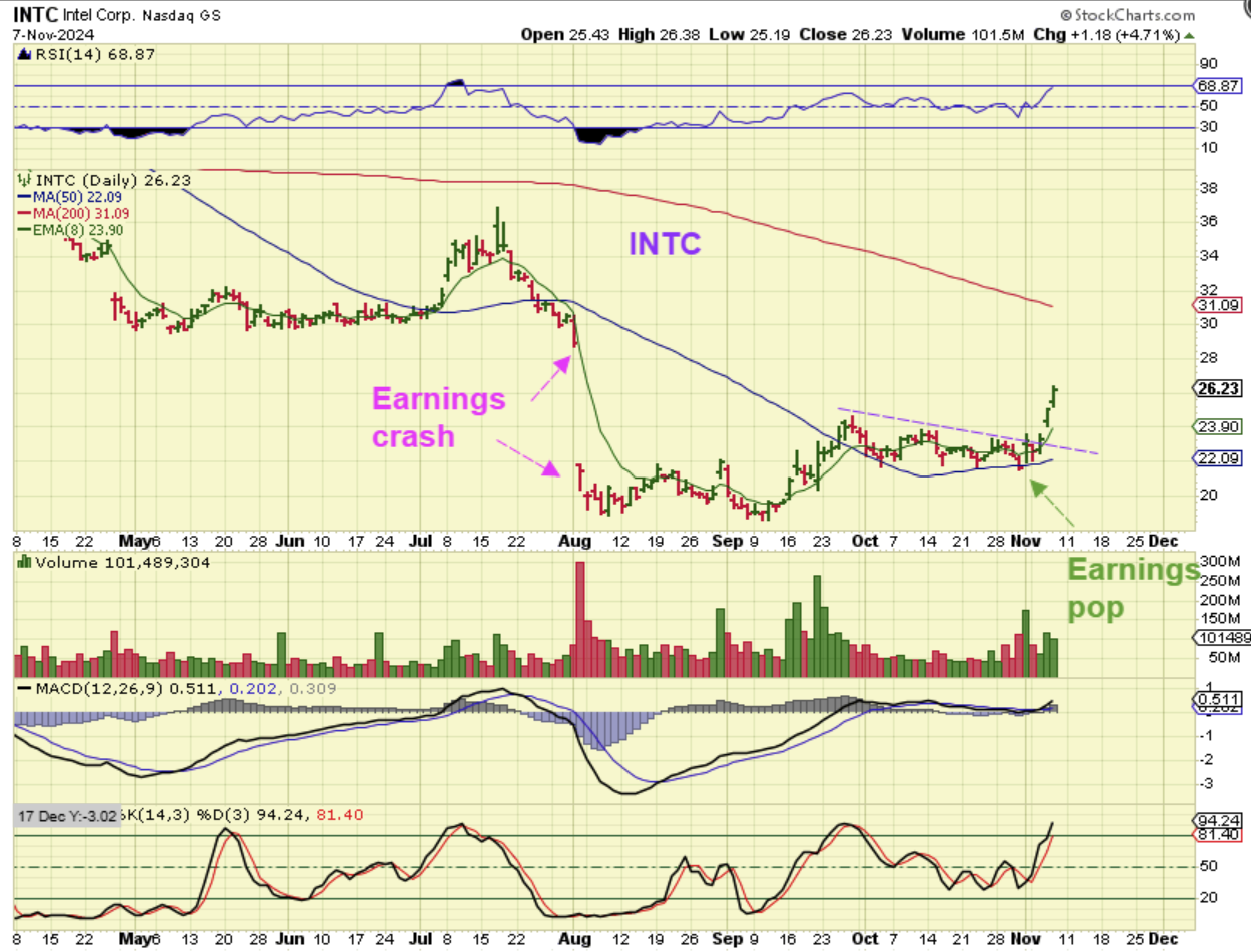
INTC – Intel crashed when it released the August earnings report, but last week it popped higher after earnings, reversing right above the 50sma. This weeks election result pop on Wednesday broke a downtrend line and yesterday it was up another 5%. This looks like it will run to the 200sma and fill that gap over time, and NVDA is breaking to new highs, so the SOXX may actually try to recover from here.
.
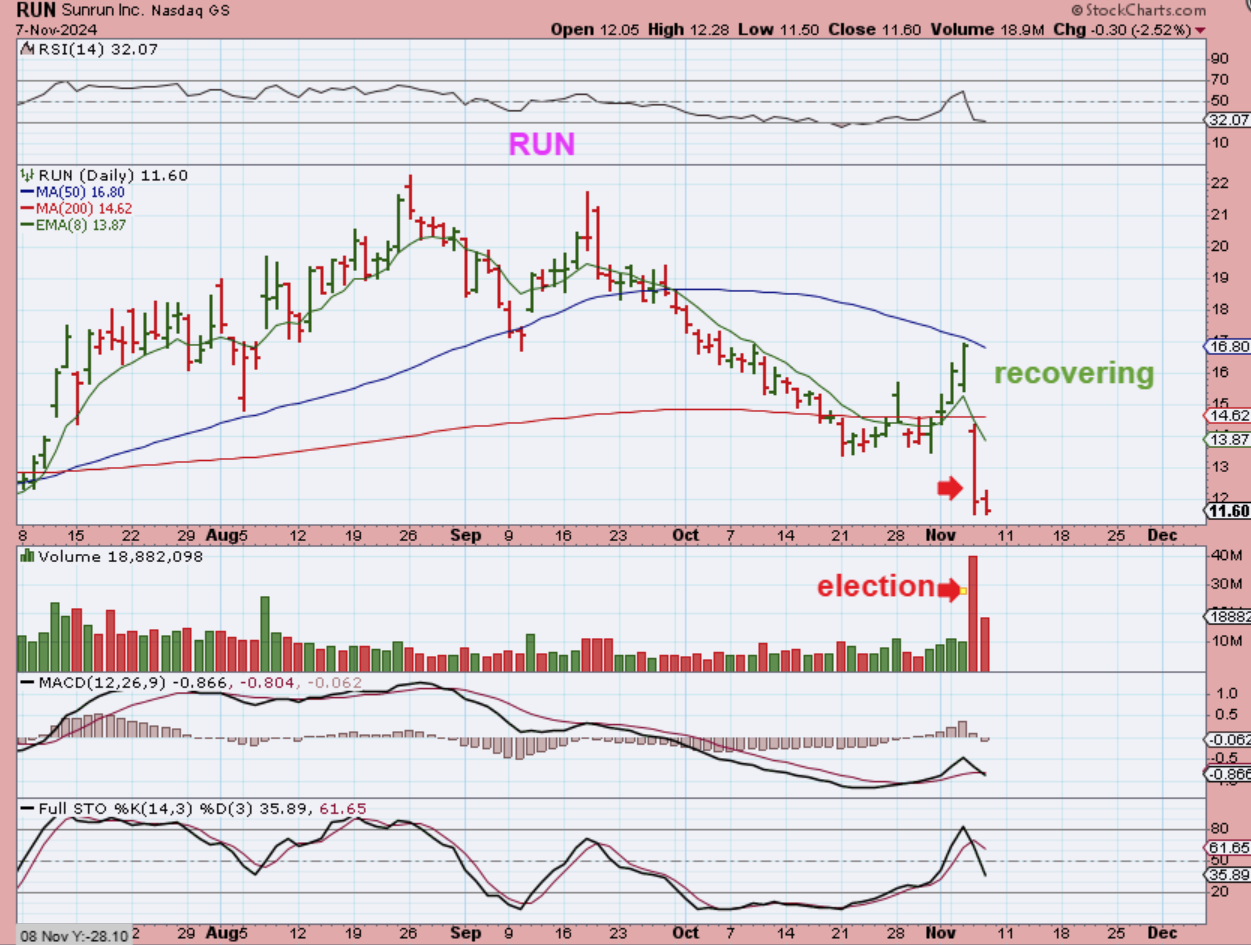
At this point, I just wanted to mention that Solar stocks got absolutely crushed when the election results were released. See CSIQ, NOVA, RUN, FSLR, etc. Trump is not known to be a green or clean energy supporter, he favors Oil. So Oil is starting to strengthen, but Solar stocks that had started to recover were crushed.
RUN: This MIGHT be a capitulation low and an overreaction, but I just wanted to point this out here before we cover Oil. Most Solar stocks reacted with this kind of a crash. RUN dropped form $17 to $12.
.
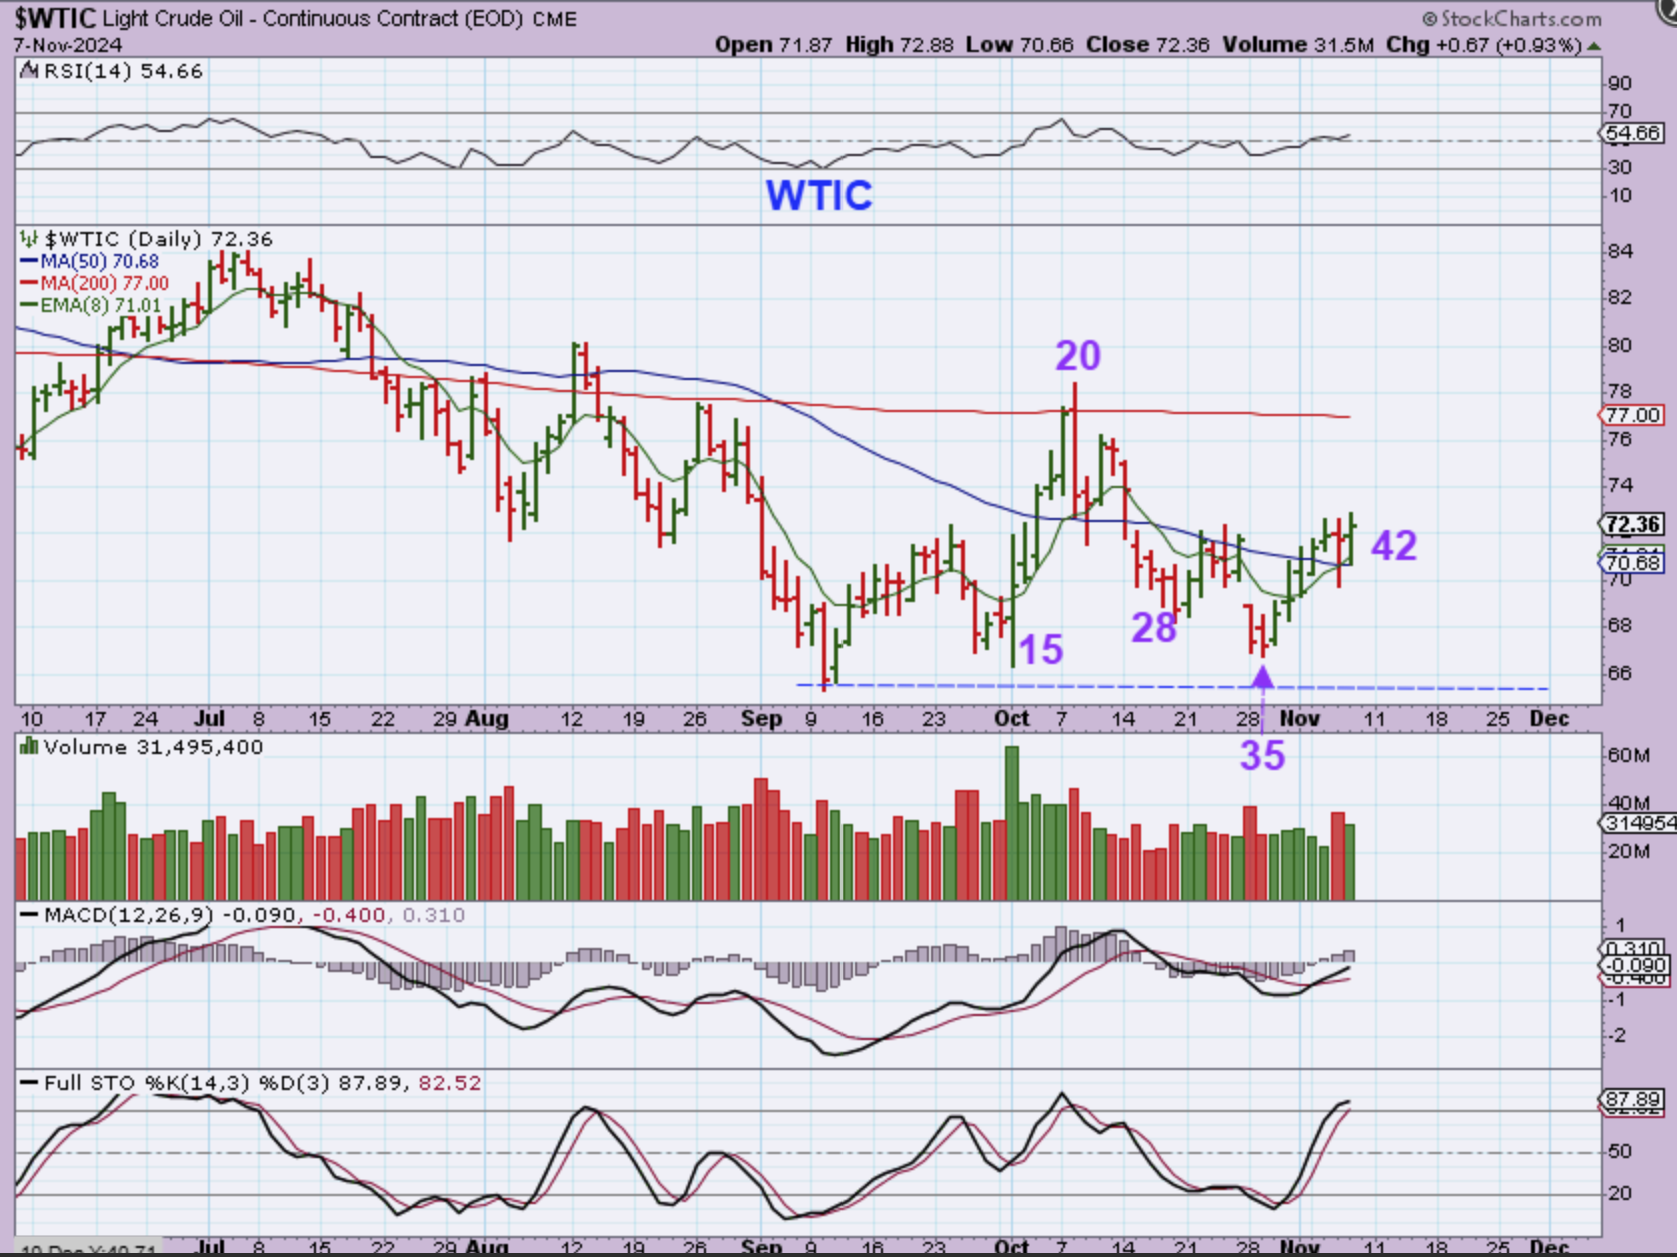
WTIC – Another area that could benefit from a Trump Presidency is Oil. It has been choppy and weak, rejected at the 200sma first and then the 50sma, however Oil is now finding support there at the 50sma. The September lows have not been broken and we are on day 42 and the MACD is now rising up with divergence. THIS makes me think that Oil will put in a higher low and we may be looking at the ICL in September with a choppy base forming here.
.
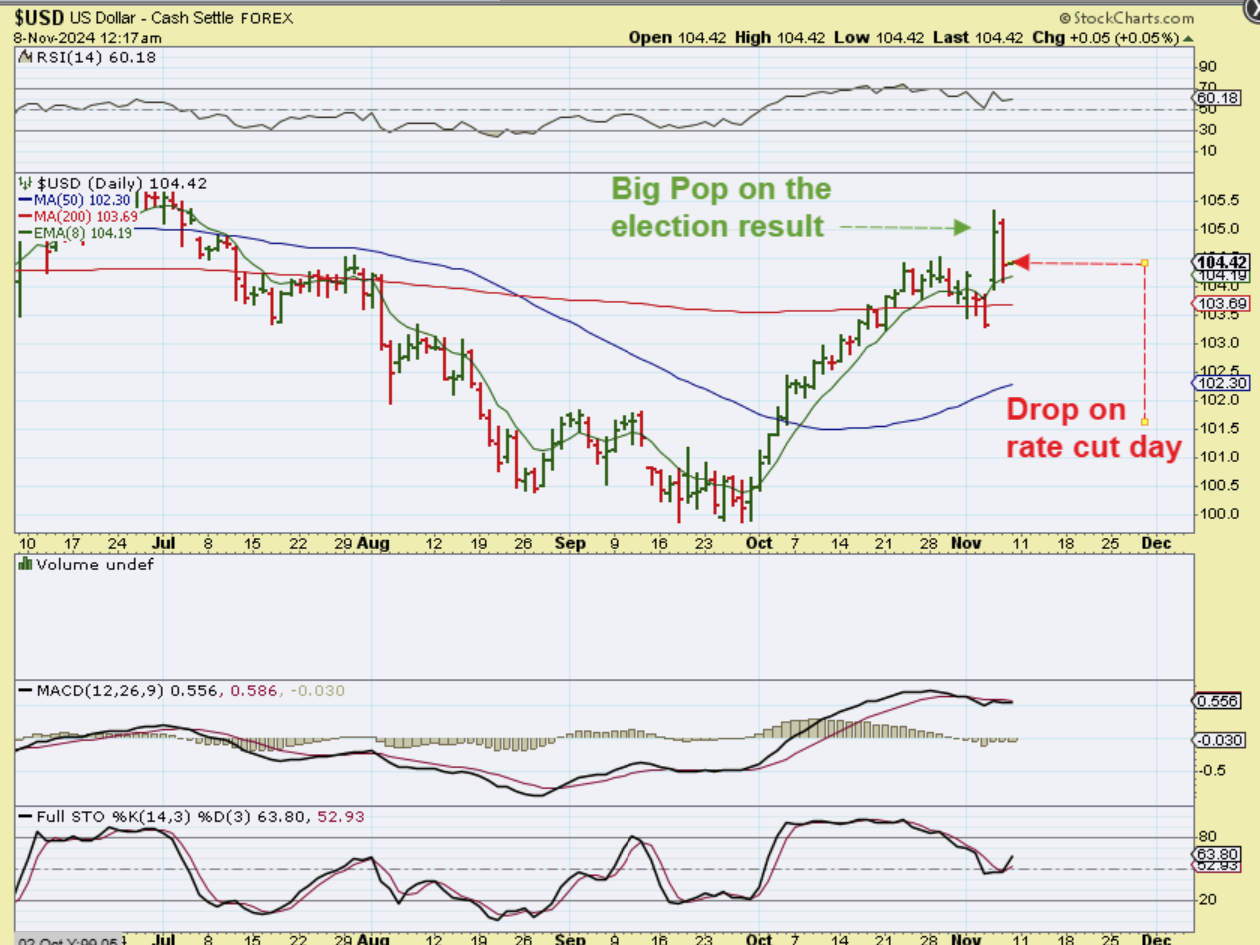
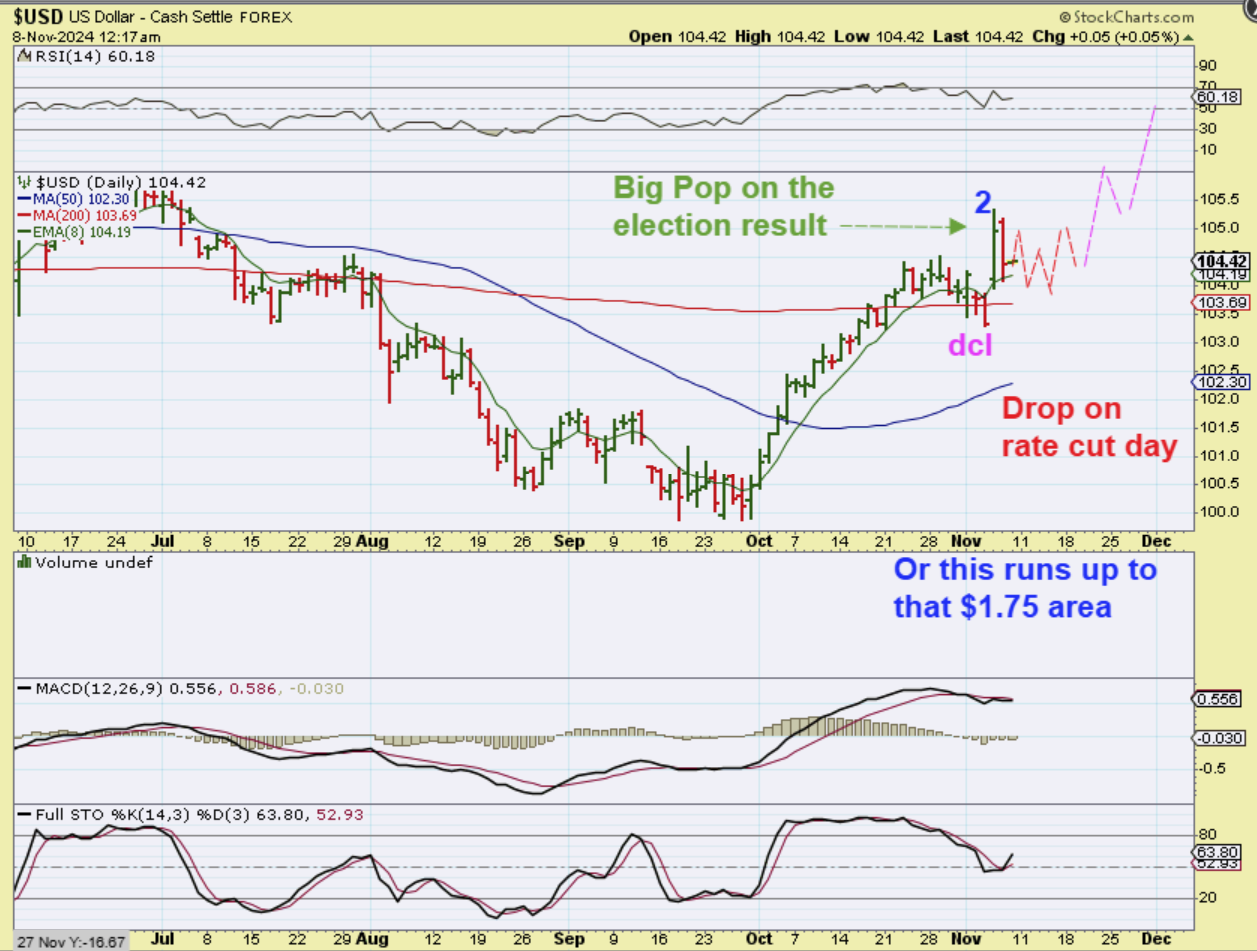
THE USD gave us a surprise POP with the election, but the rate cut gave me more of what I was expecting, and that was that the USD would possibly peak on the second daily cycle, and not continue this very strong rally. So let’s discuss the USD possibilities…
.
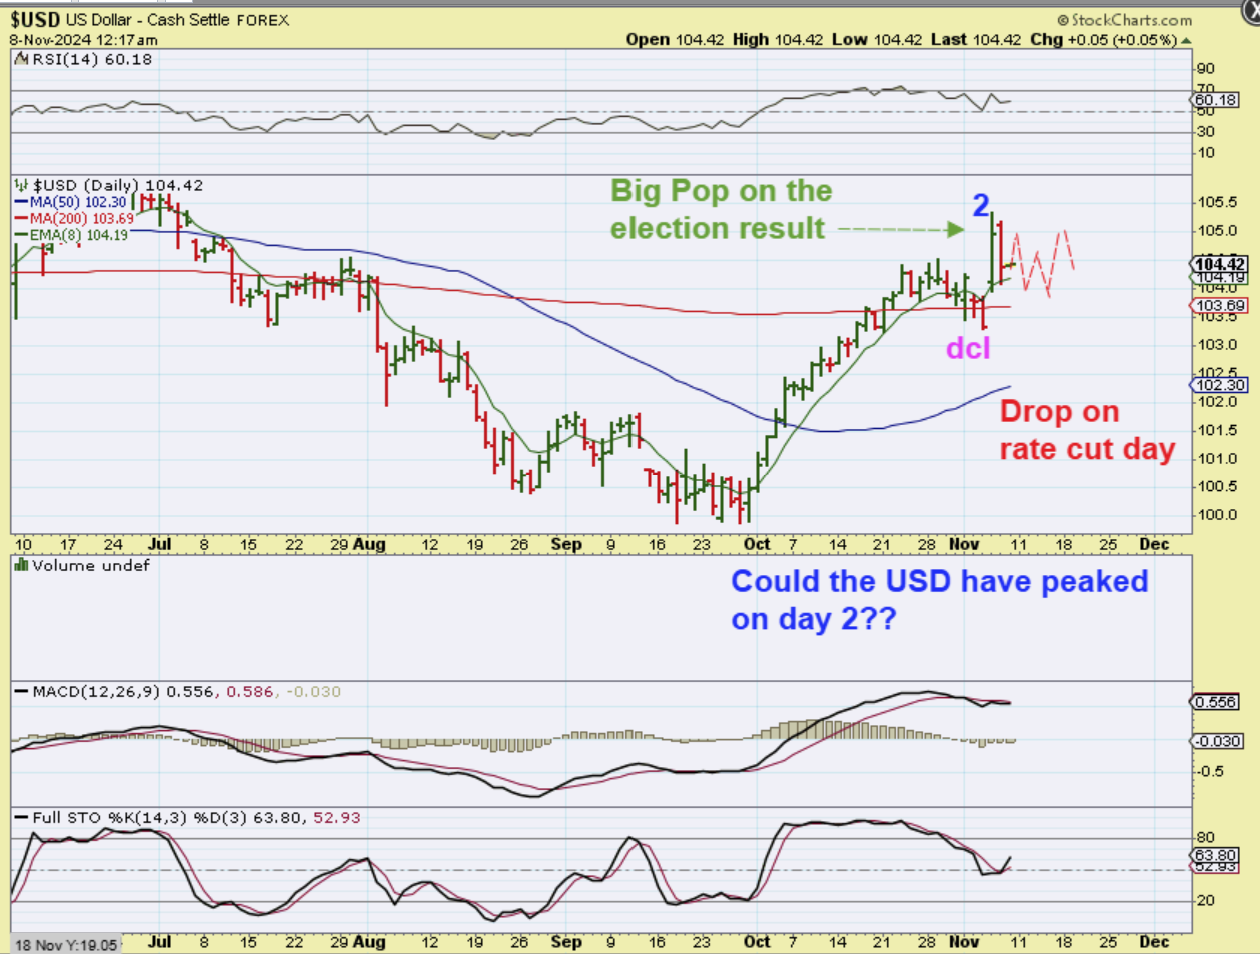
USD – Did we get a dcl with a shake out at the 200sma and now possibly a peak on day 2, due to rate cuts and more being discussed in 2025? MAYBE. If so, I drew a choppy consolidation above the 50 sma with a day 2 peak, ot maybe a day 8 peak that SLIGHTLY breaks these highs.
.
YESTERDAY I MENTIONED THE $107.50 area AS A POSSIBLE HIGH THOUGH TOO: Yesterday I said…
.
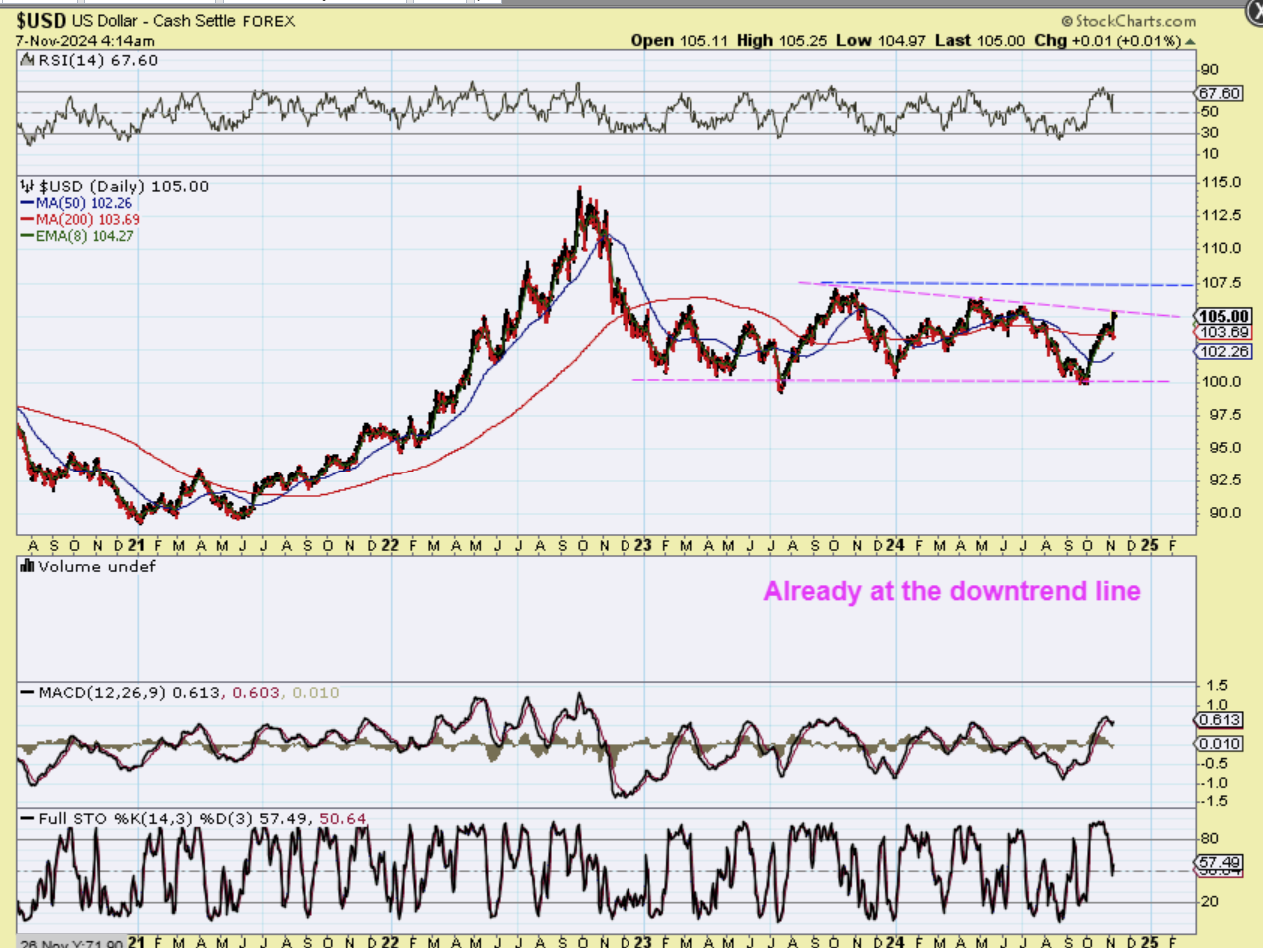
THE USD is quickly moving out of the ICL and it is already up at the downtrend line. It can run to the $107.5 area, but I was expecting it to roll over further with rate cuts. We’ll see. We are supposed to get a 1/4 point cut today.
.
USD – So with yesterdays drop, we may get some chop that gradually gets us up to that $107.50 area, and we’d still get a USD that rolls over and allows Gold to put in an ICL and rally again later. This may mean a USD peak in December and Golds ICL in December.
.
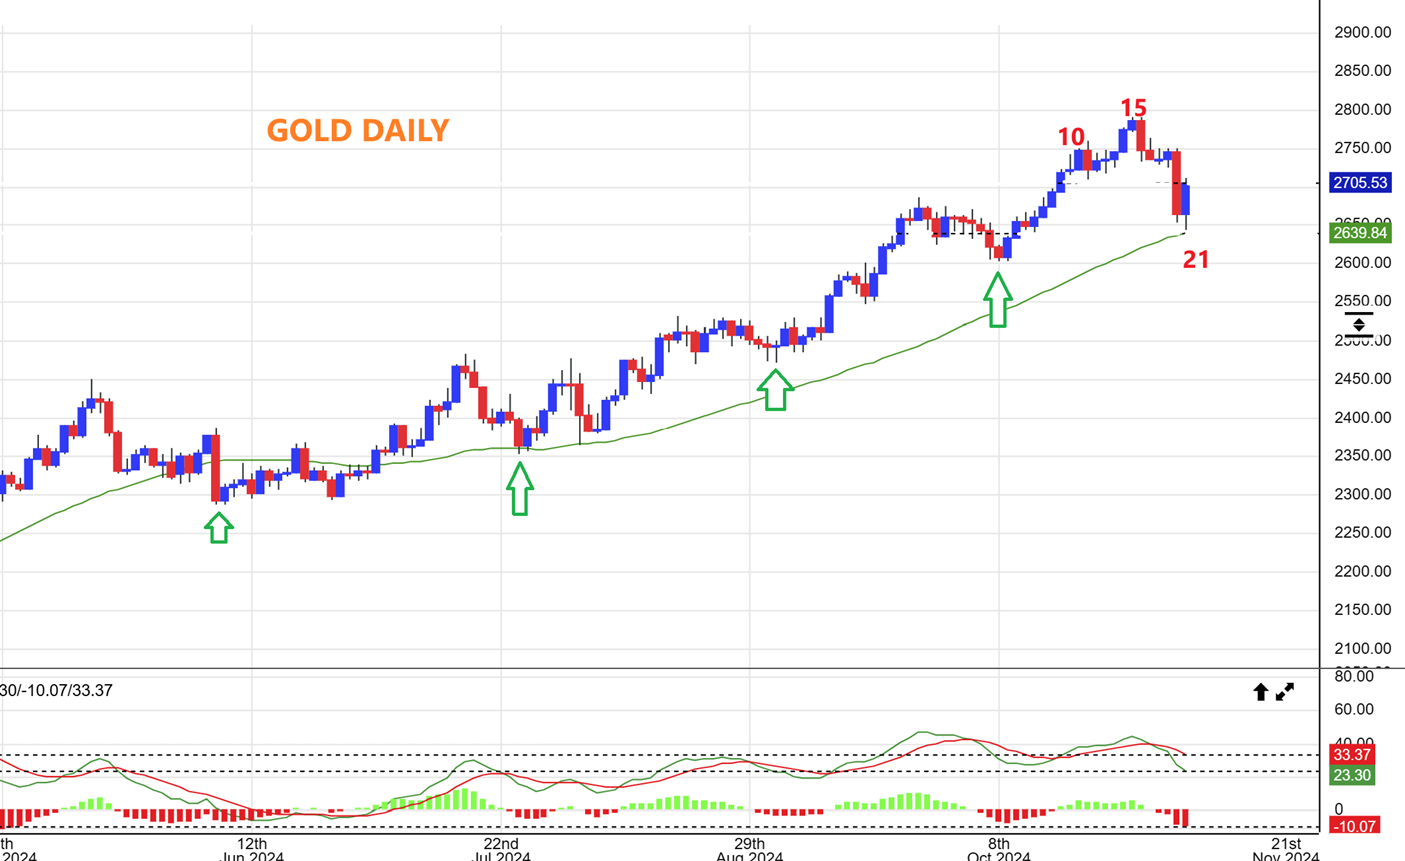
GOLD dropped sharply to the 50sma on Wednesday when the USD popped, and then it reversed there. This gives us a possibility of a dcl and swing low here, since the daily cycles have actually been shorter and closer to 25 day daily cycles. I’m picturing Gold being a bit choppy and thus forming a H&S now with a lower daily cycle and then a dip into an ICL.
.
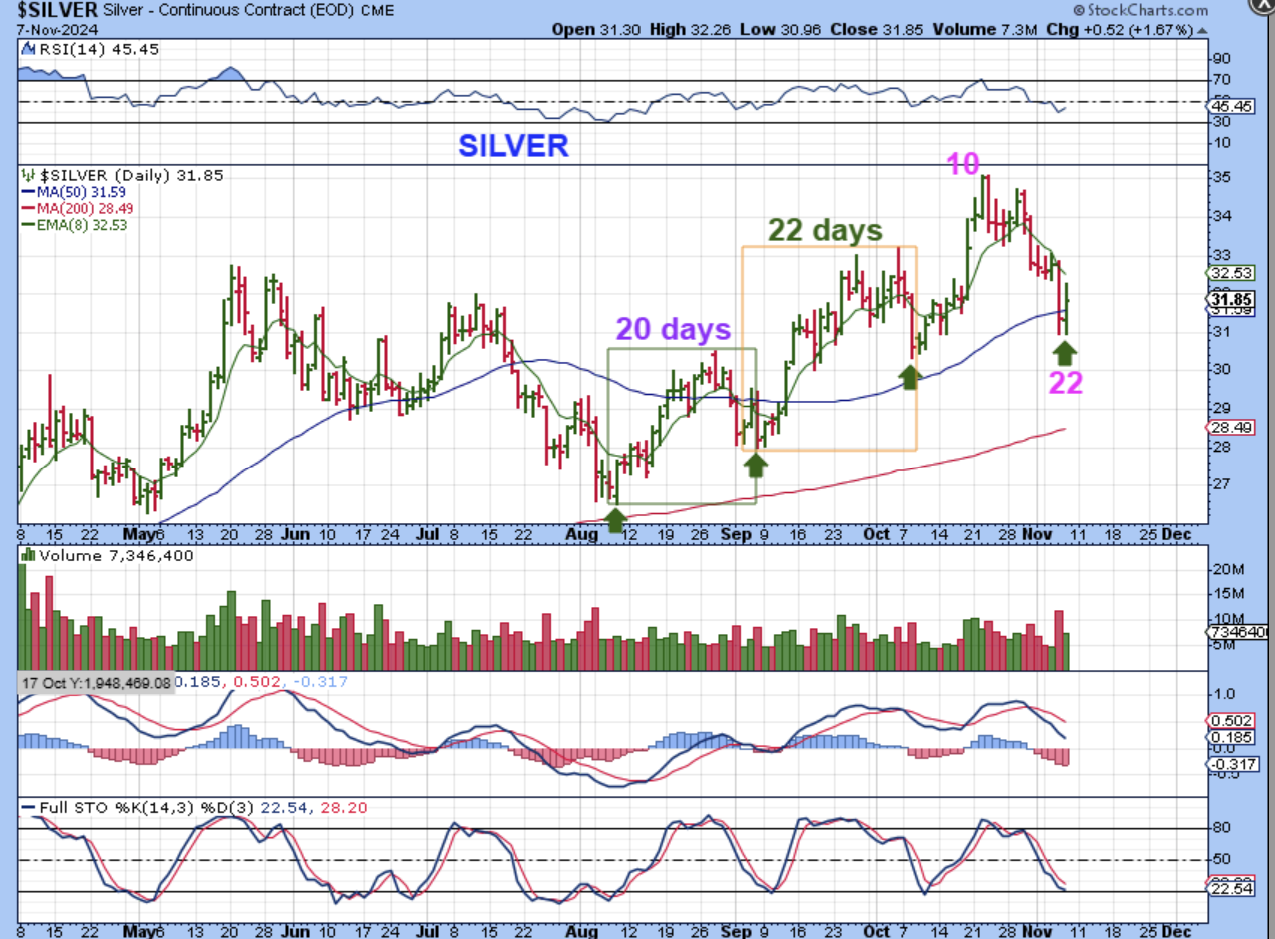
WITH SILVERS DROP, I WROTE THIS YESTERDAY:
I do often see a sharp drop followed by a little chop right before a low forms in SILVER. We may see that again with the Fed Mtg today. Yesterday was day 21 for Silver, so a low could form or we get a sharp drop, a bounce, and then a slight undercut next low week.
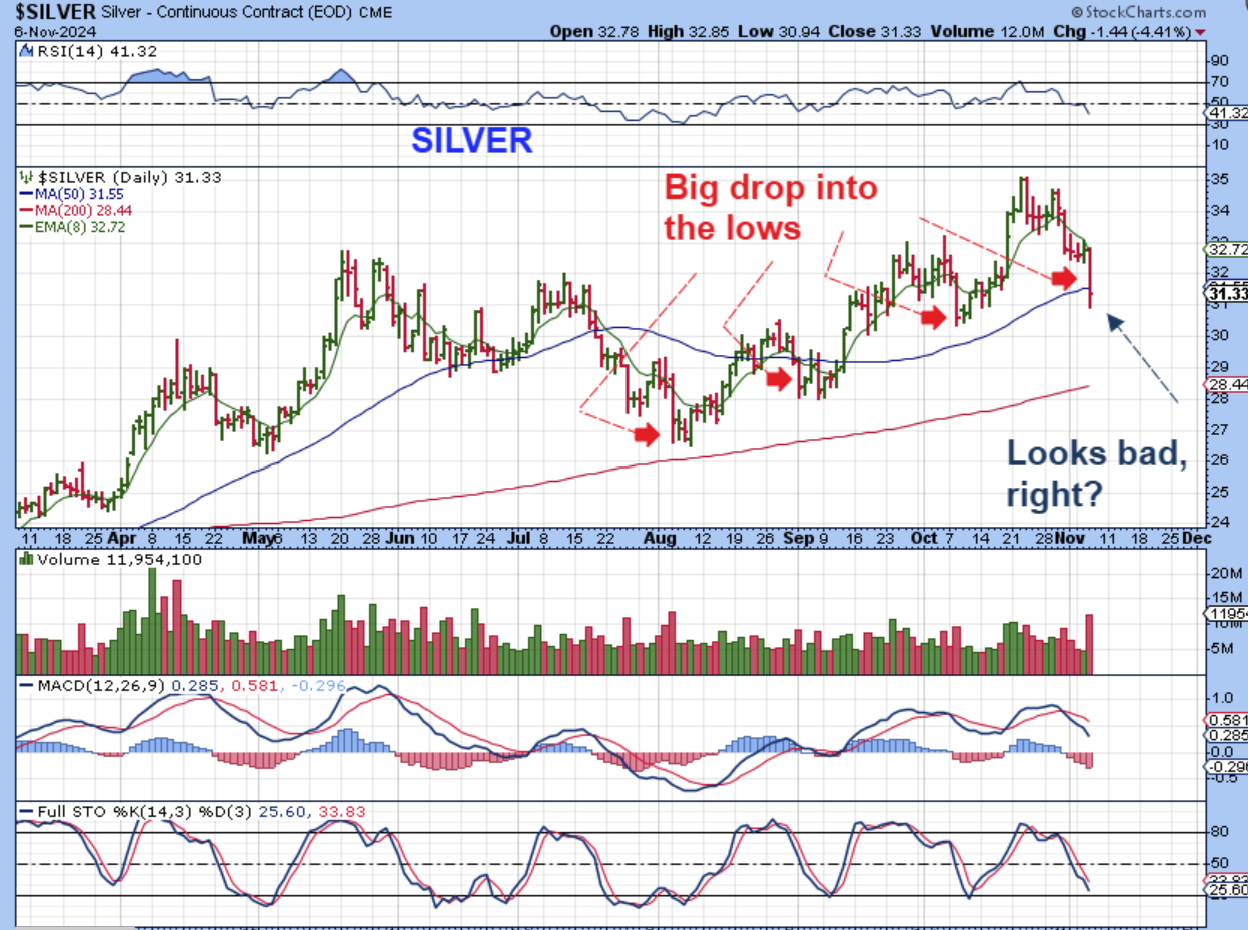
SILVER has also had what looks to be very short daily cycles, so with a reversal at day 22, we may have Silvers lows in place. The negative observation here would be that Silver peaked on day 10 and usually a L.T. daily cycle is a sign of weakness.
.
And also from Yesterday:
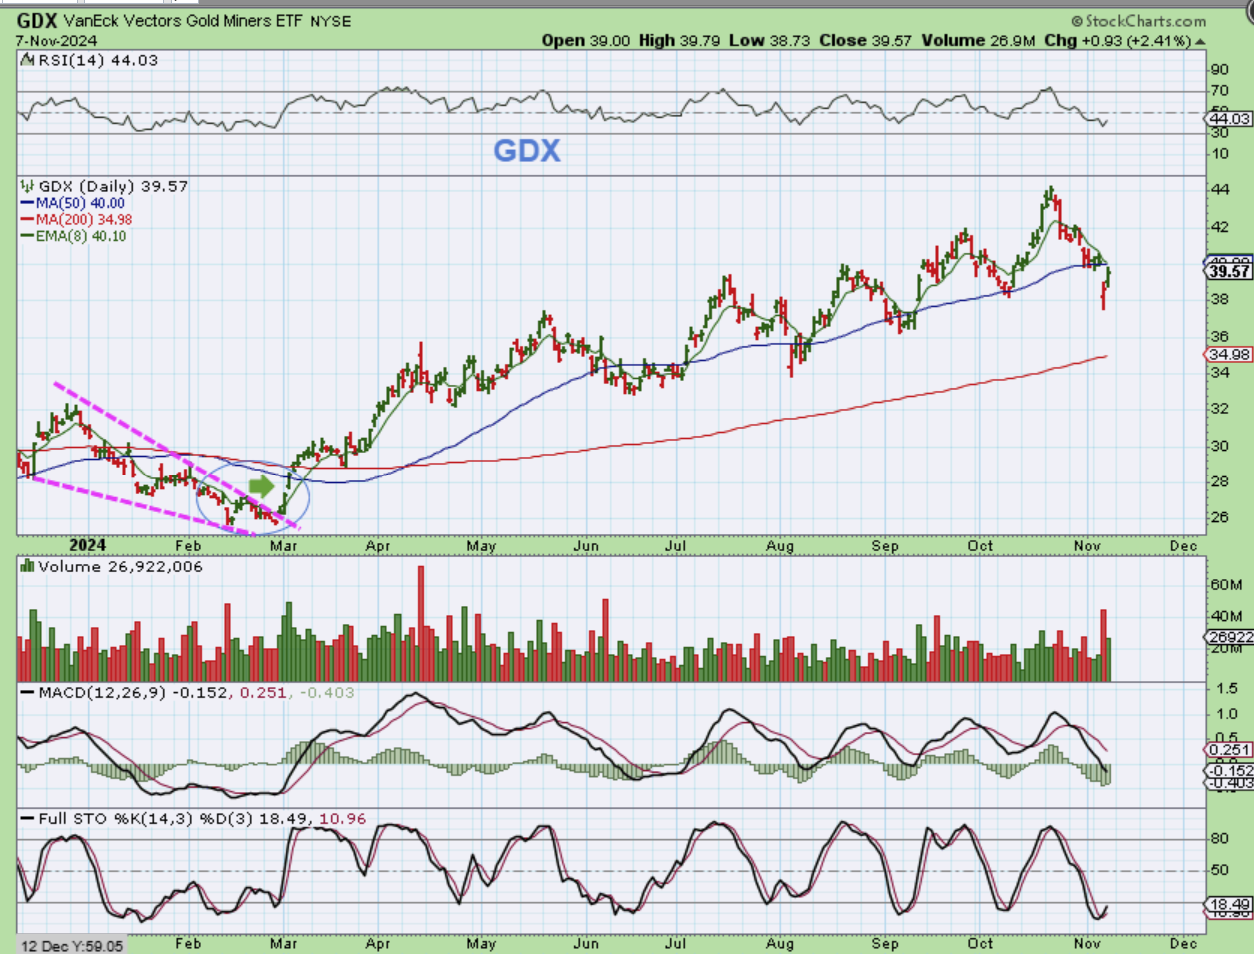
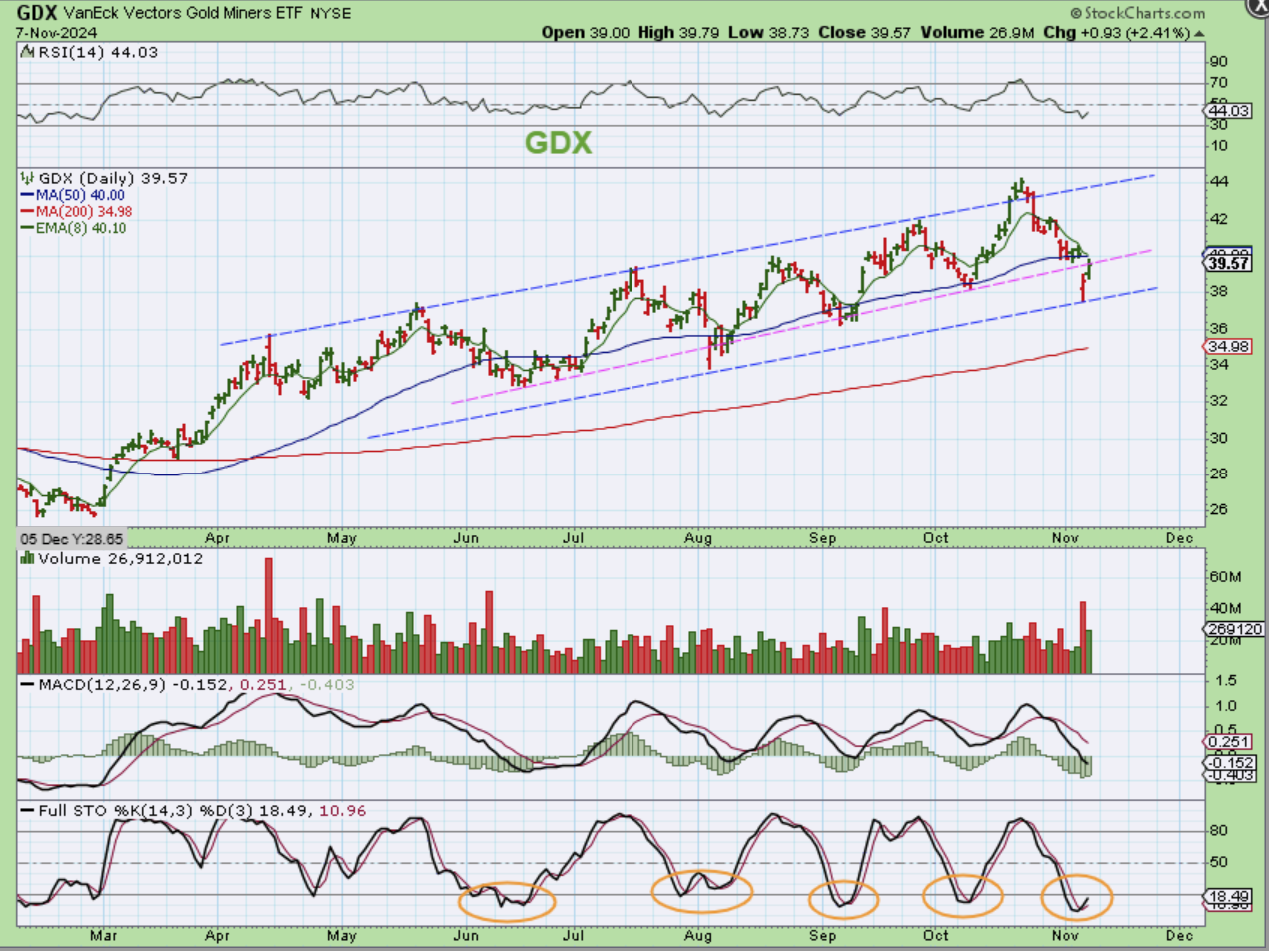
GDX is oversold and this does look very much like the reversal in early August too. A fed cut may start to form the low here too. A large gap open higher that doesn’t fill the gap would give us an abandoned baby, but the fed cut isn’t due until well after the open, so this may chop around until that 2 pm decision.
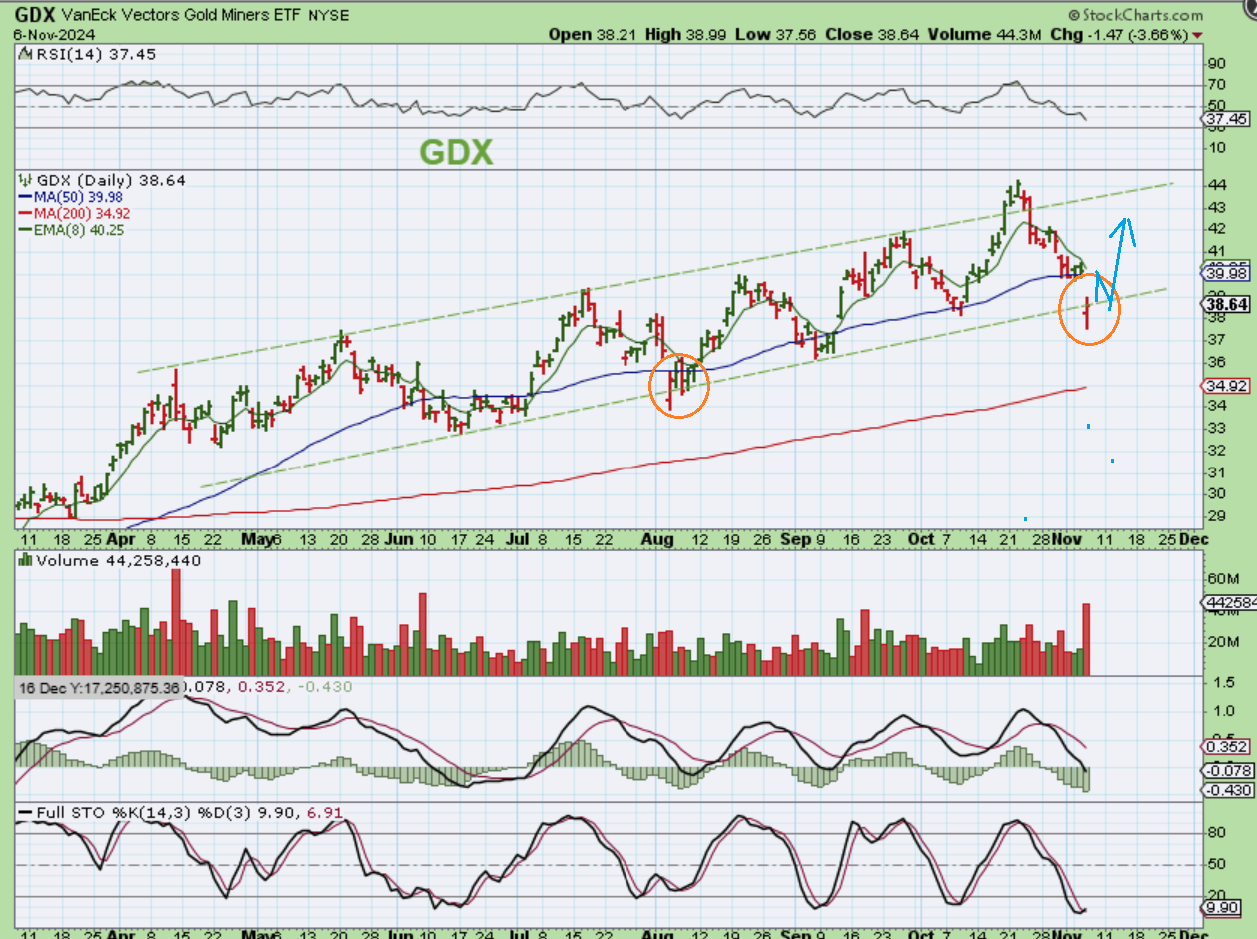
GDX added some gains to that reversal, and that unconfirmed swing low may be the dcl. GDX is oversold.
.
During the uncertainty of the elections, the markets started to chop sideways and become difficult. Heading into this week with the U.S. Elections, Jobless Claims, and the Fed rate cut meeting, I warned that I expected higher volatility (markets hate uncertainty). Well, now that we have all of that behind us, it appears at this point to have resolved in a Bullish way for the General Markets, Bitcoin, and even Oil may be building a base to move higher from. Time will tell. Gold and Silver look set up to cool off a bit and pull back after a little move higher here, so if that continues some may decide to lighten up on their miners if they are heavily invested, that is a personal choice since Gold has been very strong and may quickly recover after that dip. Bitcoin turned quite bullish this week and I want to discuss that below. Enjoy your Friday trading and your weekend!
.
~ALEX
.
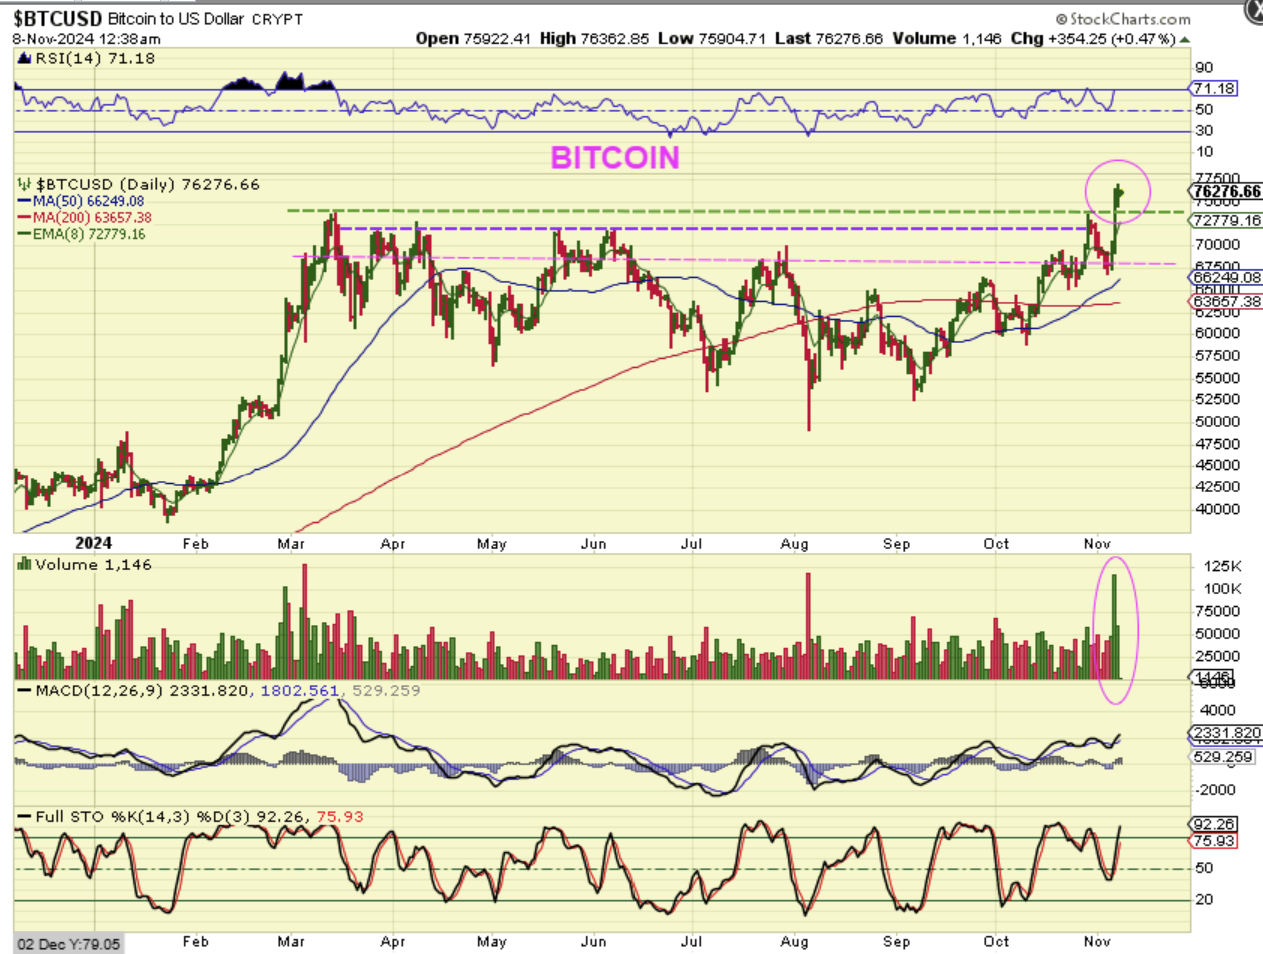
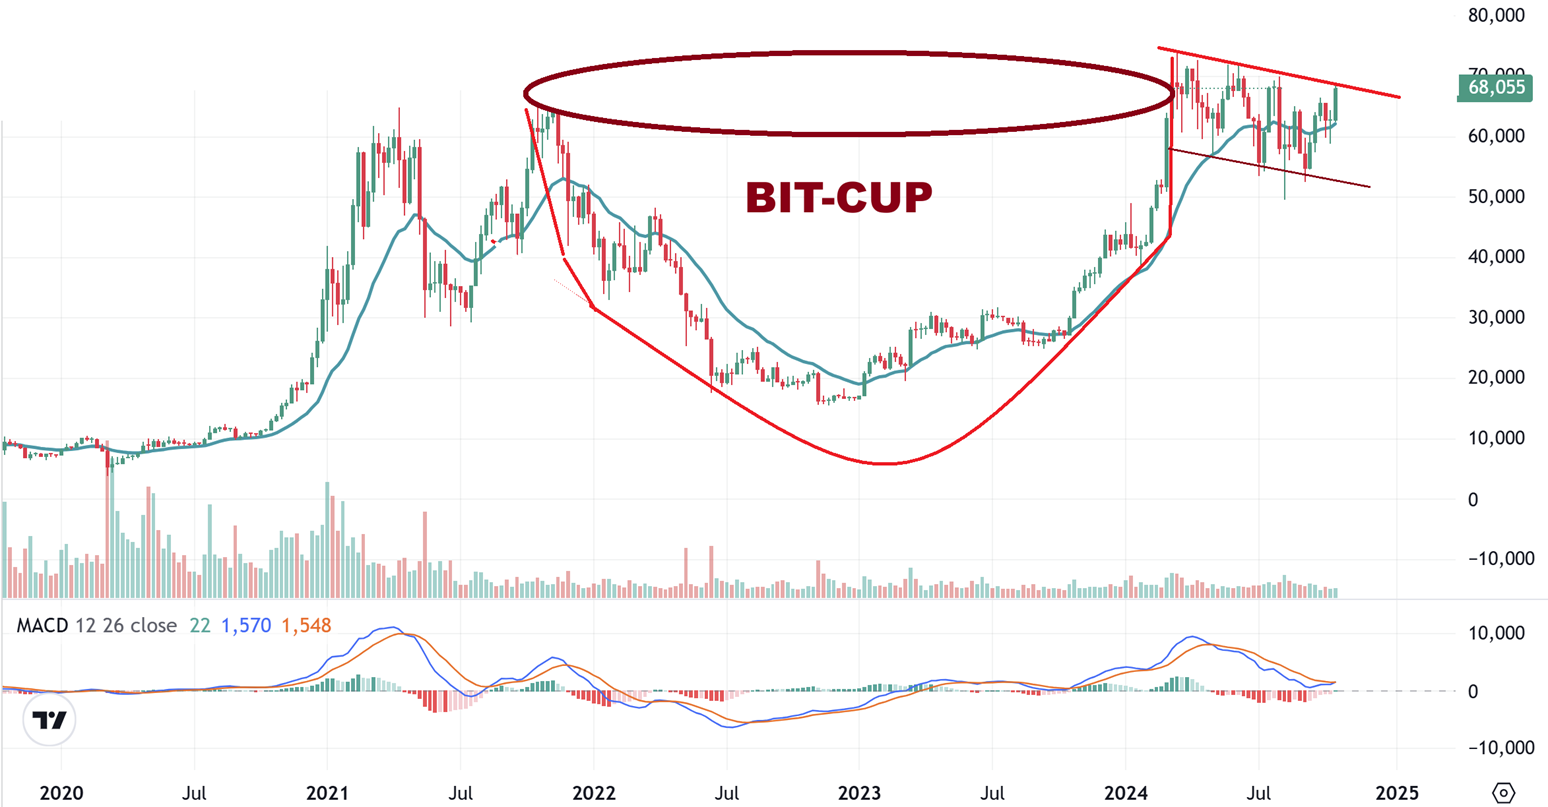
BITCOIN – I want to remind you of something that I mentioned in past reports. Bitcoin has now rallied to a breakout to new all-time highs. We often see a ‘back-test’ after a breakout, however…
..
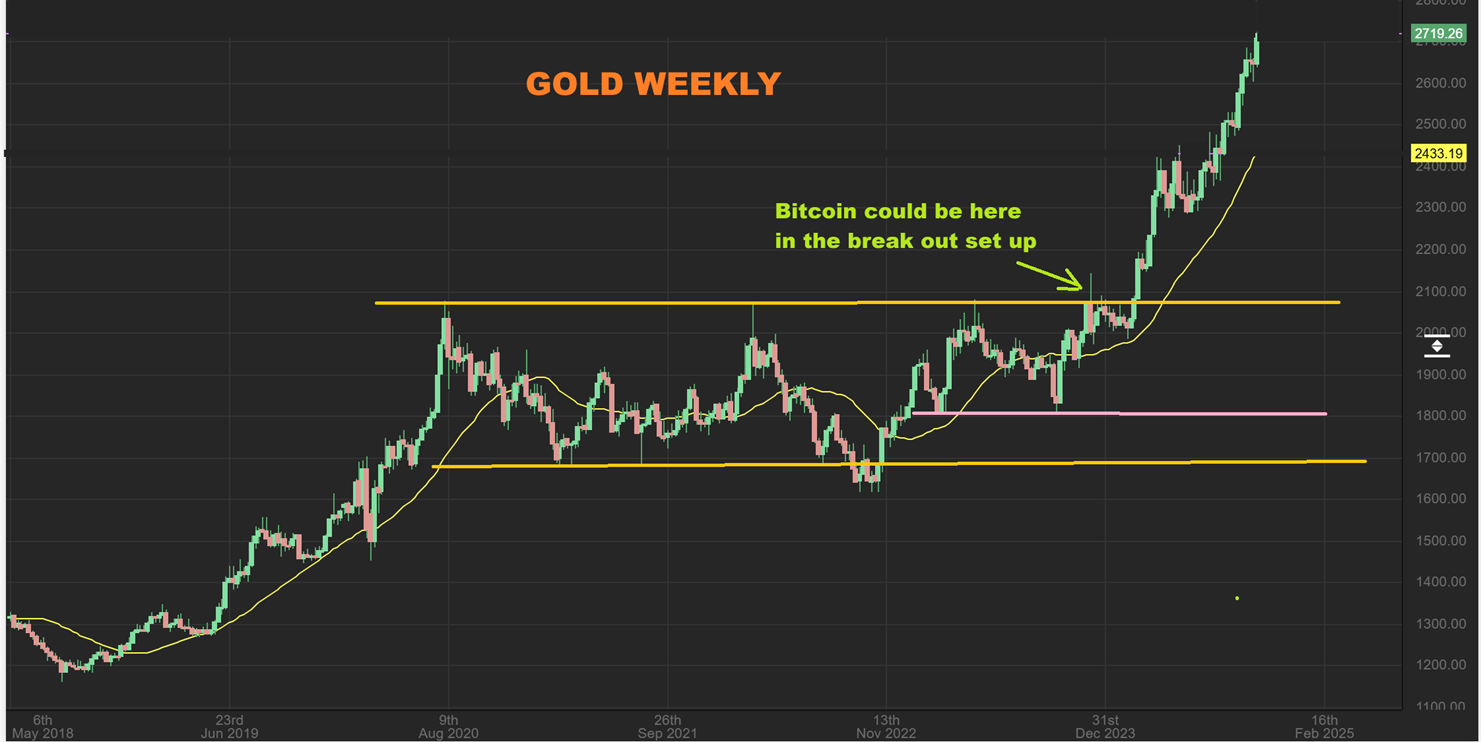
GOLD WEEKLY – I pointed back at Golds breakout and showed that once it got running, you really wanted to be in Gold and Miners. We did have a false breakout and then the real one, so let’s discuss that too.
1. It is important to note that That false breakout was really just an intraday breakout and pullback. I will show you that it was a Pop & Drop day on another chart. We do not have that with Bitcoin.
2. Notice that the real breakout did NOT back-test, because Gold became very strong, so…
.
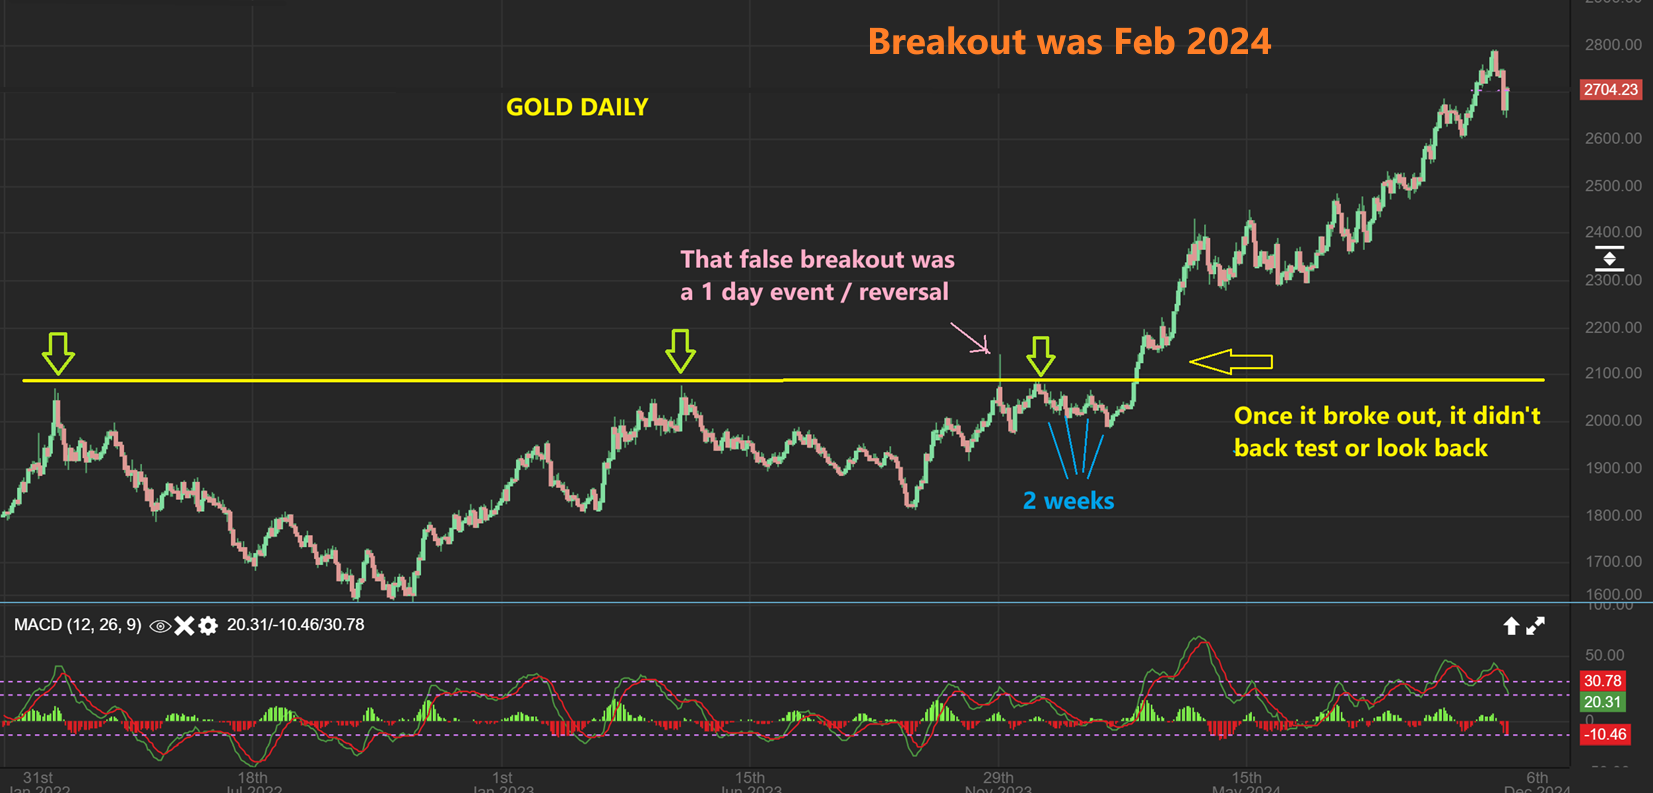
NOTE: GOLD BROKE OUT ON FEBRUARY OF THIS YEAR: Please read the chart and then notice…
1. Here you see the 1 day intraday ‘pop & drop’ false breakout, and then it crawled at the highs and broke out.
2. Once Gold broke out, it did NOT need to back-test, and that just shows the strength.
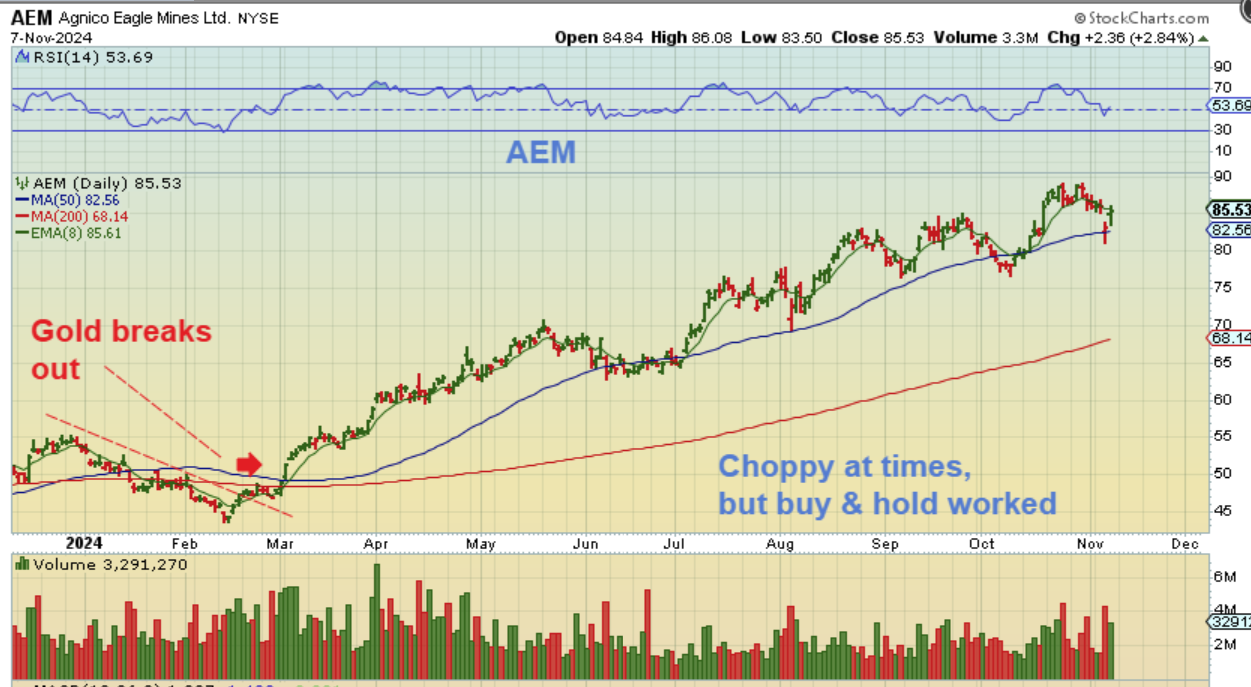
3. Pull up a 1 year chart of HMY, OR, EGO, KGC, IAG, AEM, AU, etc etc. What have they done since Feb 2024?
.
Pull up a 1 year chart of AEM, HMY, OR, EGO, KGC, IAG, AU, etc etc. What have they done since Feb 2024? They were choppy day to day, and yes they did have dcl pull backs, but many did not dip very much after that breakout, until Gold started to dip. FEBRUARY WAS THE LOWEST ENTRY POINT FOR MINERS. COULD THIS HAPPEN TO CRYPTO? It might.
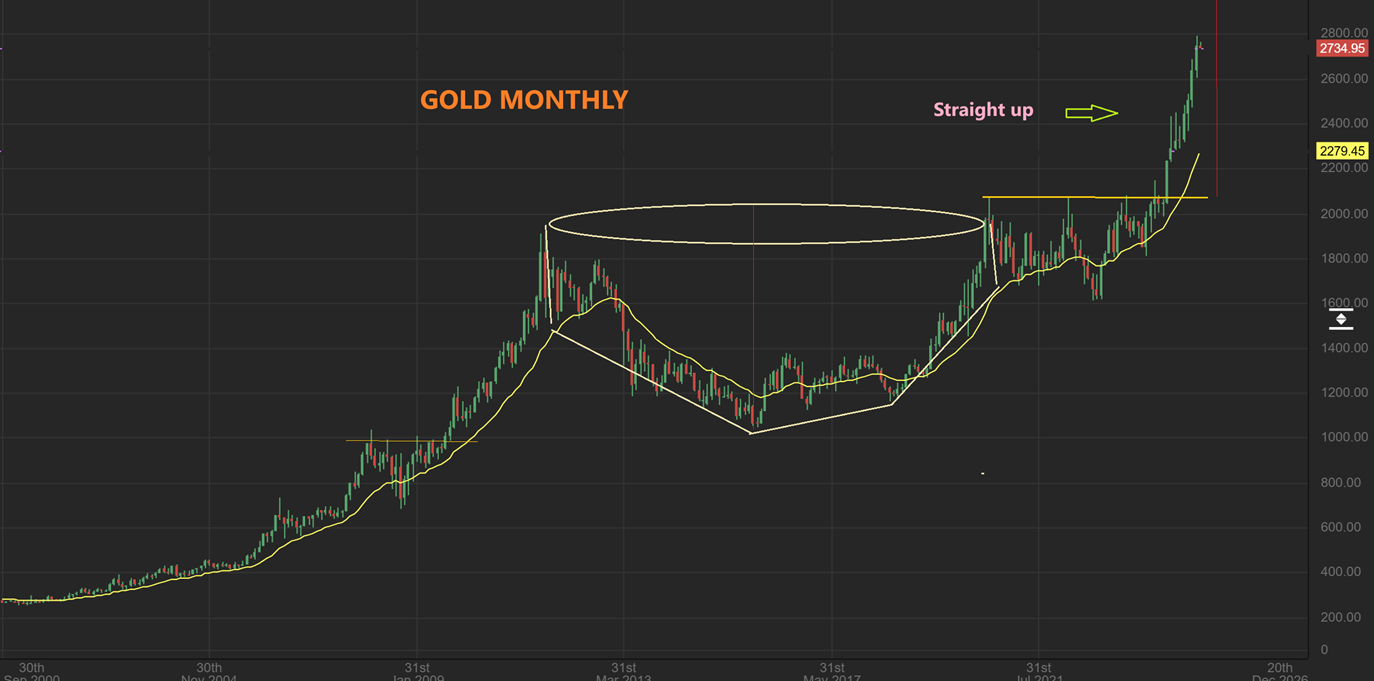
GOLDS MONTHLY CHART then shows us that with that cup and handle breakout, Gold made gains almost every month straight and we did not see a back test.
.
Do you remember this chart?
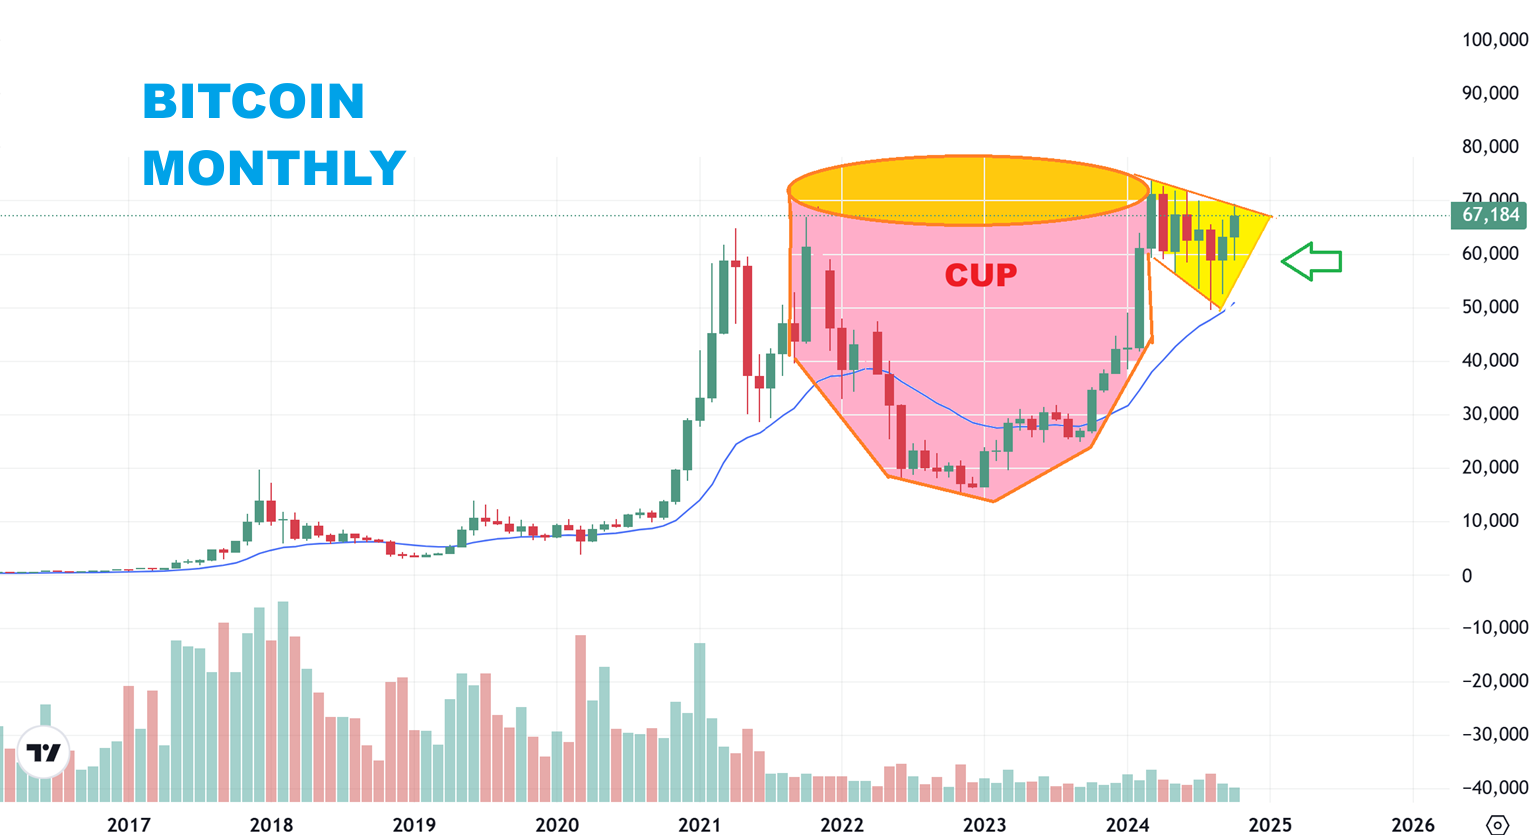
Do you remember this chart from earlier in October? We are now above the cup.
.
CONCLUSION: BITCOIN CAN PULL BACK AND BACK-TEST, BUT WHAT IF IT DOESN’T?
.
I will discuss Bitcoin more in the weekend report, but I just wanted to mention that with this cup and handle,
1. We MIGHT back test, and you’ll get a buy opportunity, however
2. We also may not see a back-test, if Bitcoin gains buyers and becomes as strong as Gold was after that cup & handle breakout.
3. And again, take a look at the Miners from Feb 2024 to now. Some are very choppy, but that breakout for Gold broke a downtrend line and became their lowest entry point.