October 5th Weekend Review
.
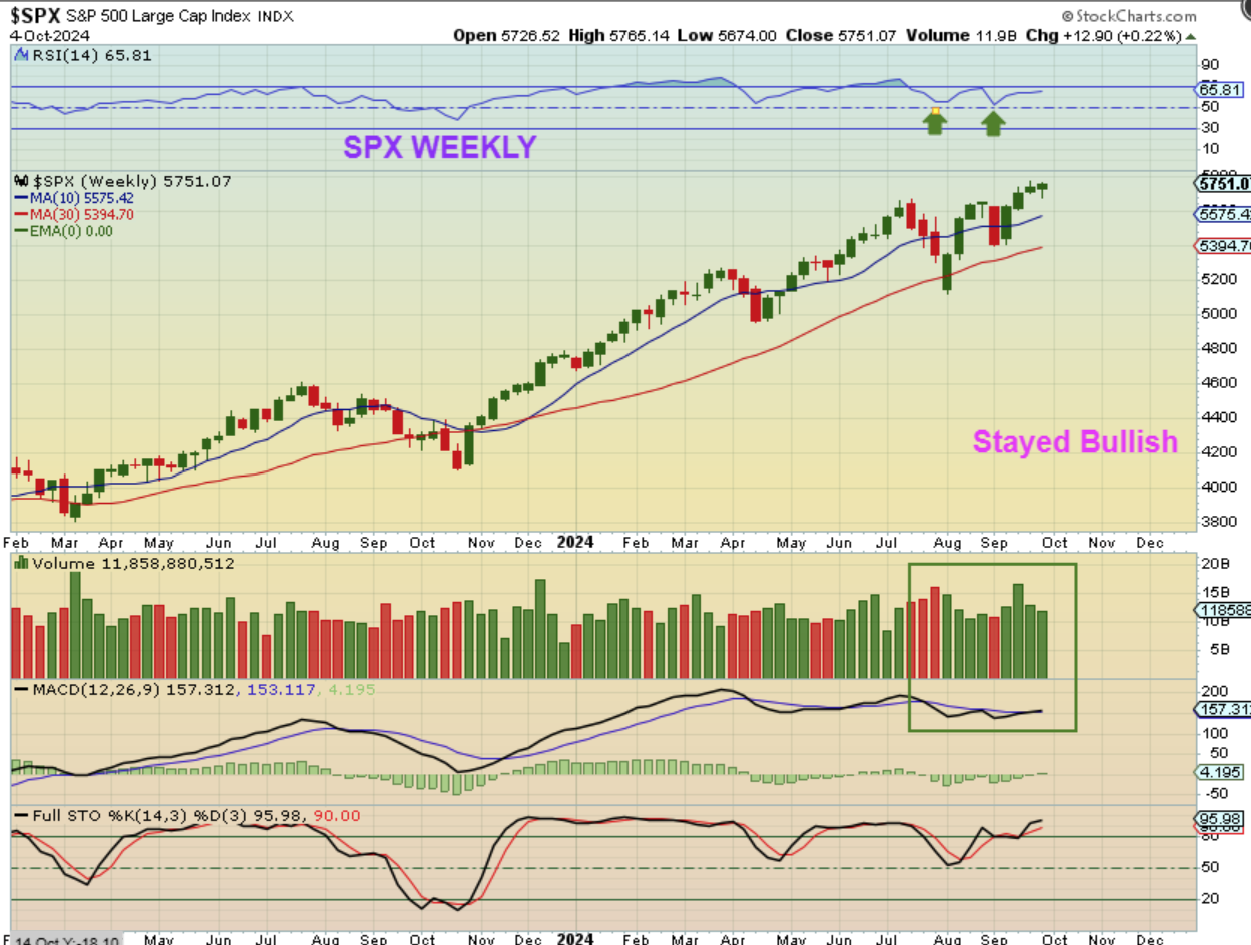
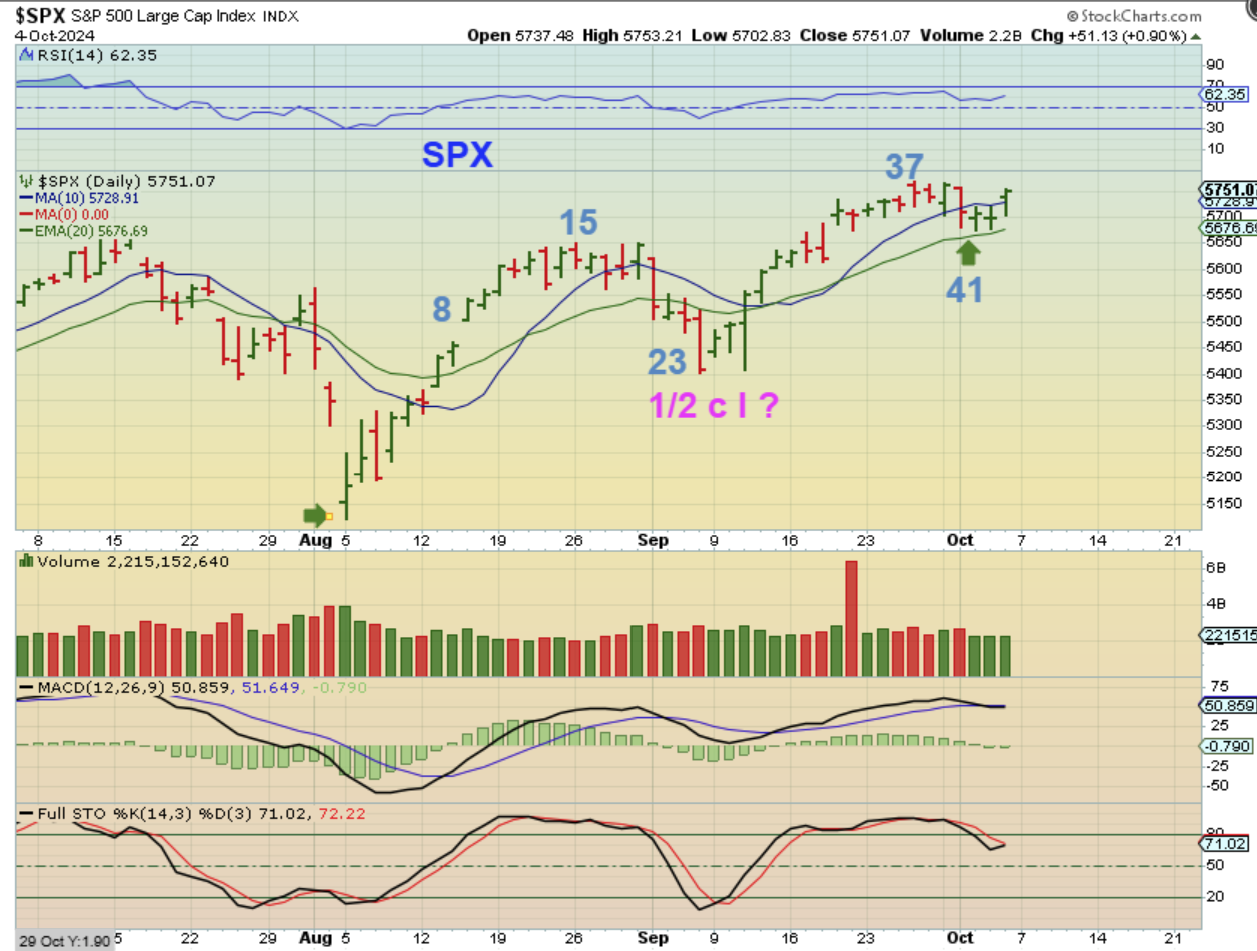
THE SPX is at all-time highs after plunging into an ICL in July-August. If you look at the past pullbacks after coming out of an ICL, you can see that they have been mild, with the exception of the one that we just had in September. We were due for a dcl heading into the jobs report, and I wondered if this dcl would be mild too. Well…
.
We were due for a dcl heading into the jobs report, and it looks like we have a very mild dip to the 20 ema and now a push back above the 10sma (day 41 dcl). This would be a ‘buy’ or a place to ‘add’ to current positions, with a stop at the 20 ema.
.
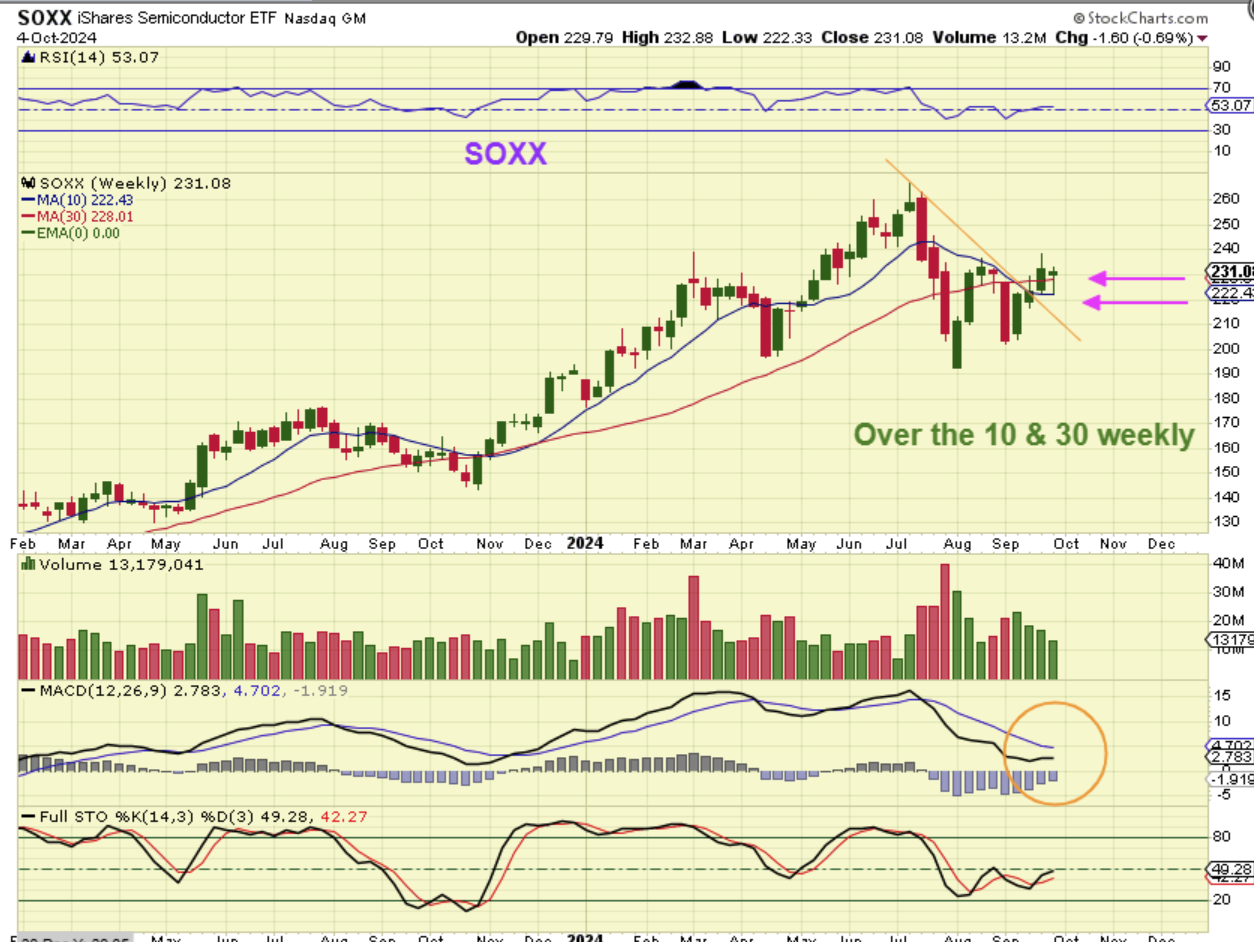
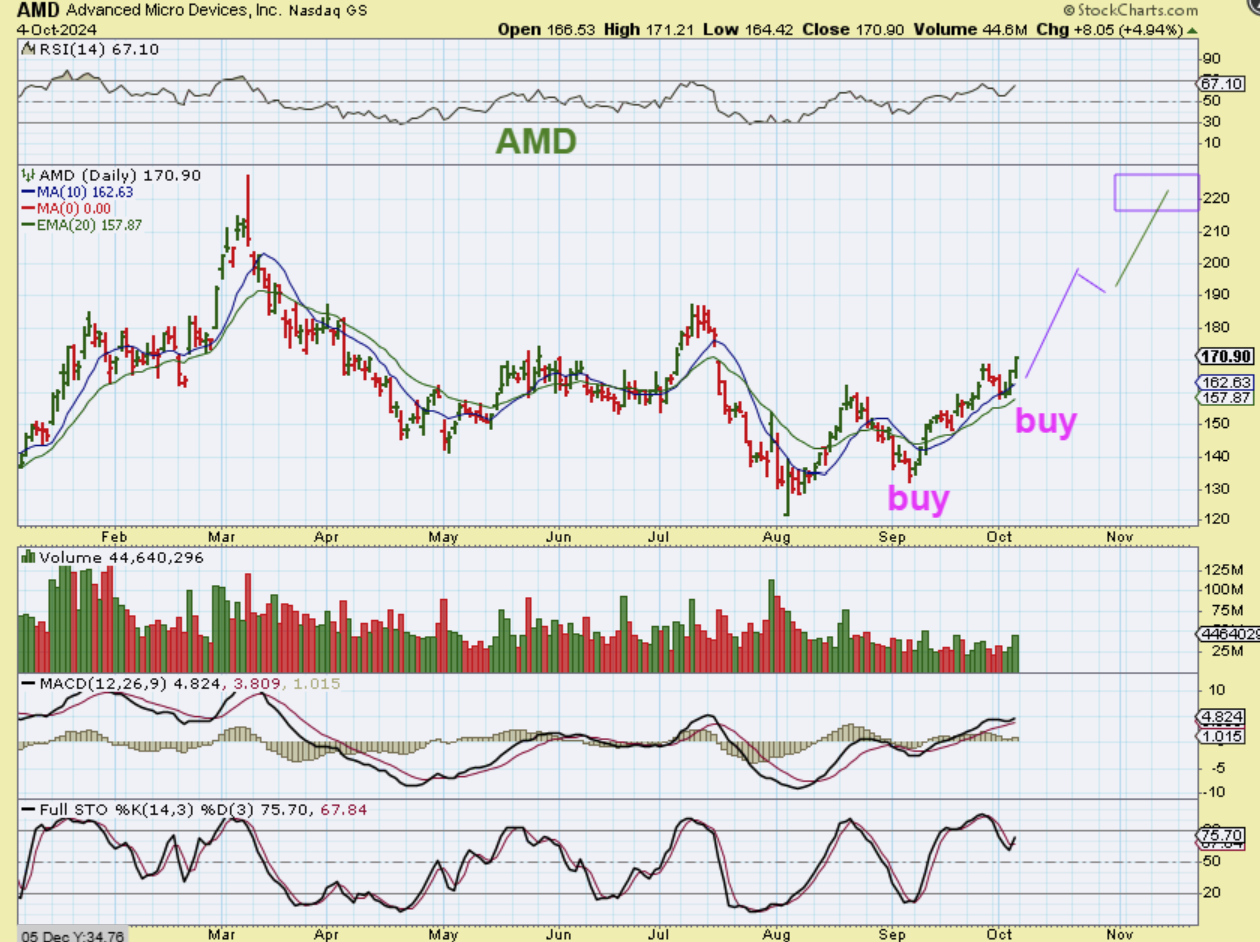
THE SOXX dropped to the 10 week ma and bounced back above the 30 week ma. That is bullish price action on a weekly basis, so the SOXX (SOXL) can be considered a buy too (or MU, AMD, NVDA, TSEM, etc). This may now play catch up to former highs, and…
.
AMD – I really like the set up in many of these semiconductors. You can buy and hold AMD, MU, NVDA, etc. A run from $170 to $220 is a nice 30% gain.
.
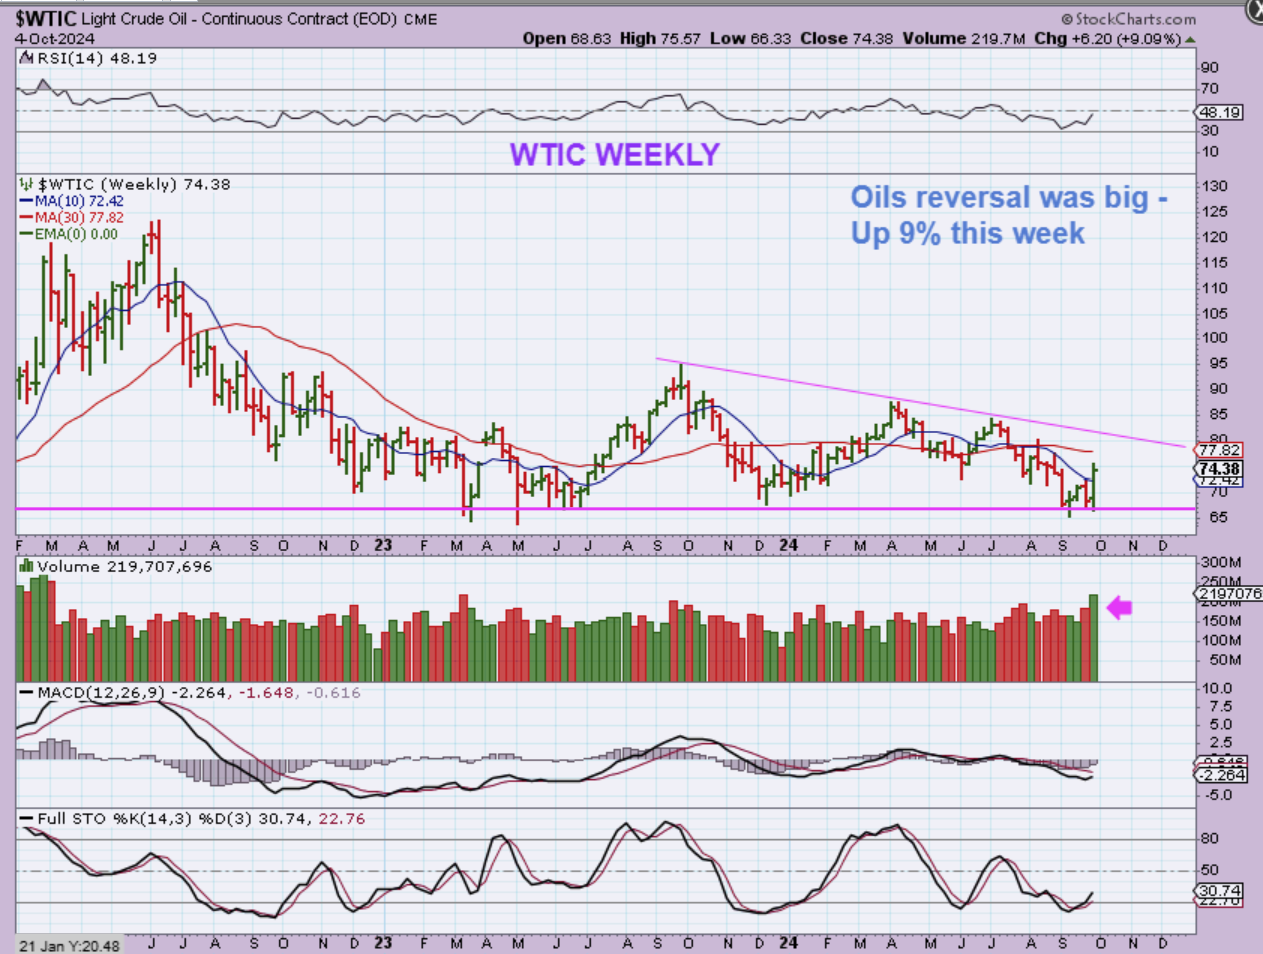
WTIC WEEKLY– We saw Oil reverse sharply this week, right at prior support. It was a little sudden, but Oil Stocks started to respond strongly too, so you have to let price action and volume tell you what is going on.
.
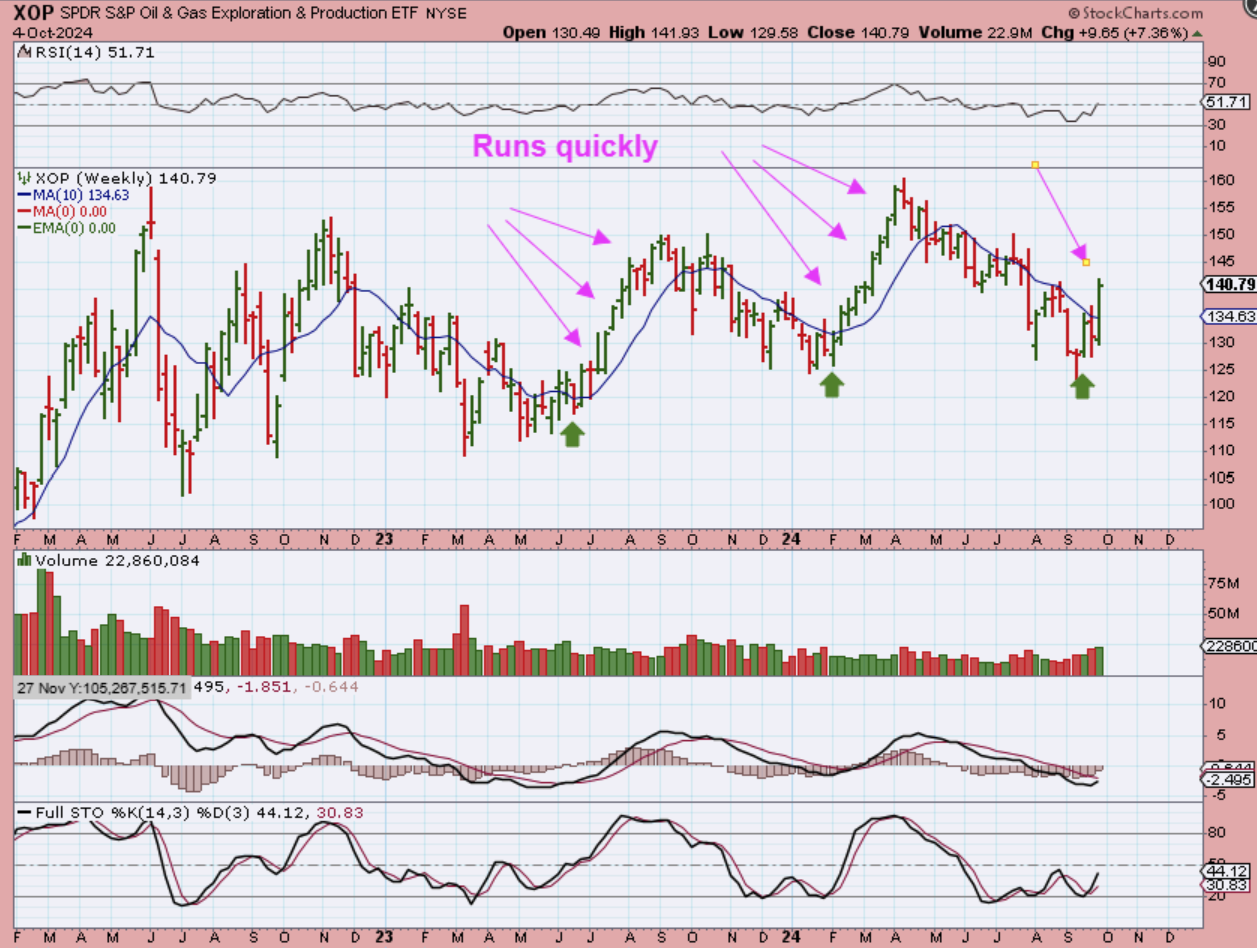
THE XOP WEEKLY had a large 7% pop this week too and in prior runs out of the lows, it was pretty green week after week after week, as seen below. Oil stocks became a buy.
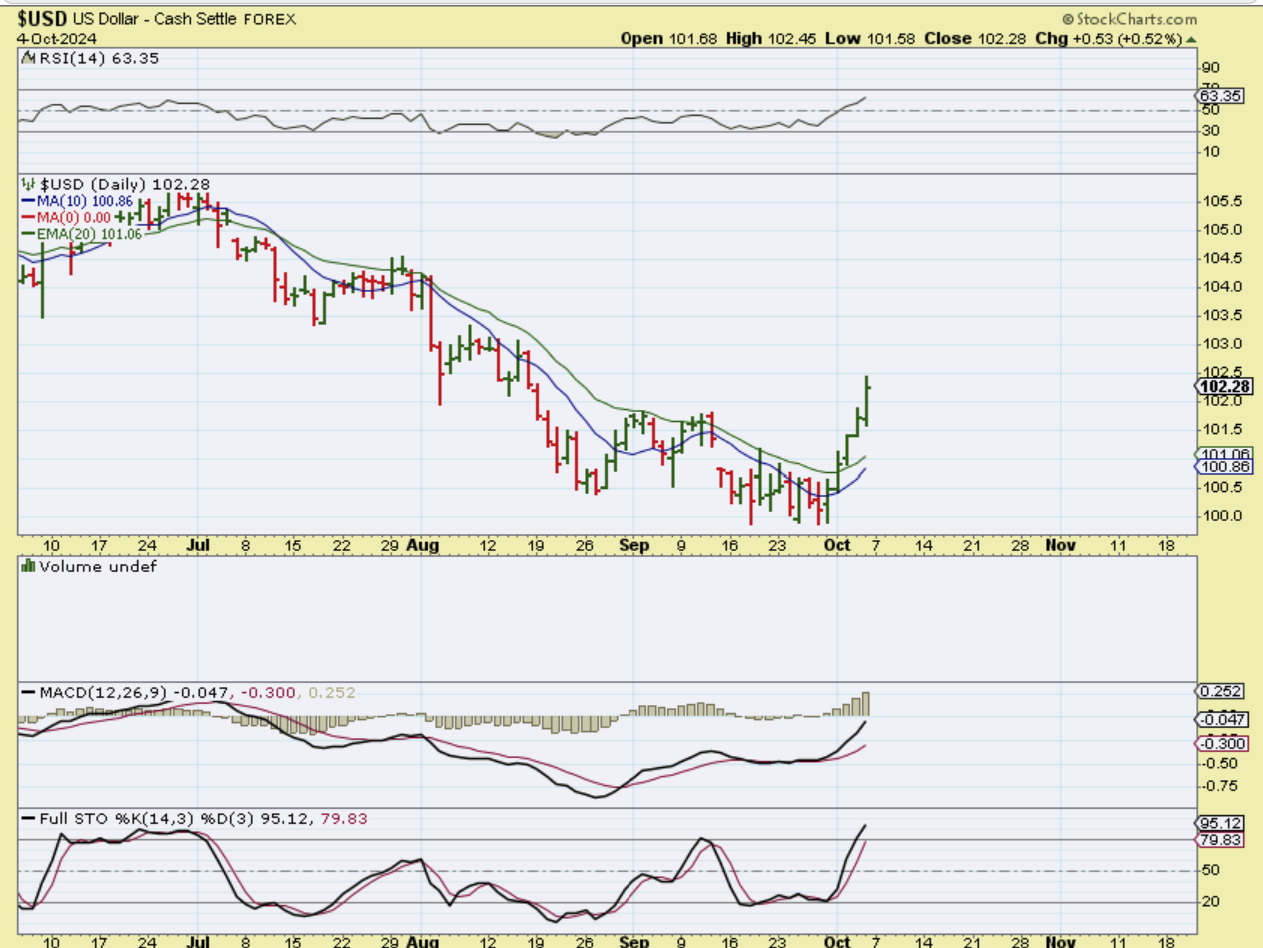
THE USD bottomed and ran straight up last week for 5 straight days, but this run higher has not adversely affected Gold and Silver as much as it usually does. Silver was actually able to break out to new highs last week and Gold is still up at the highs too.
.
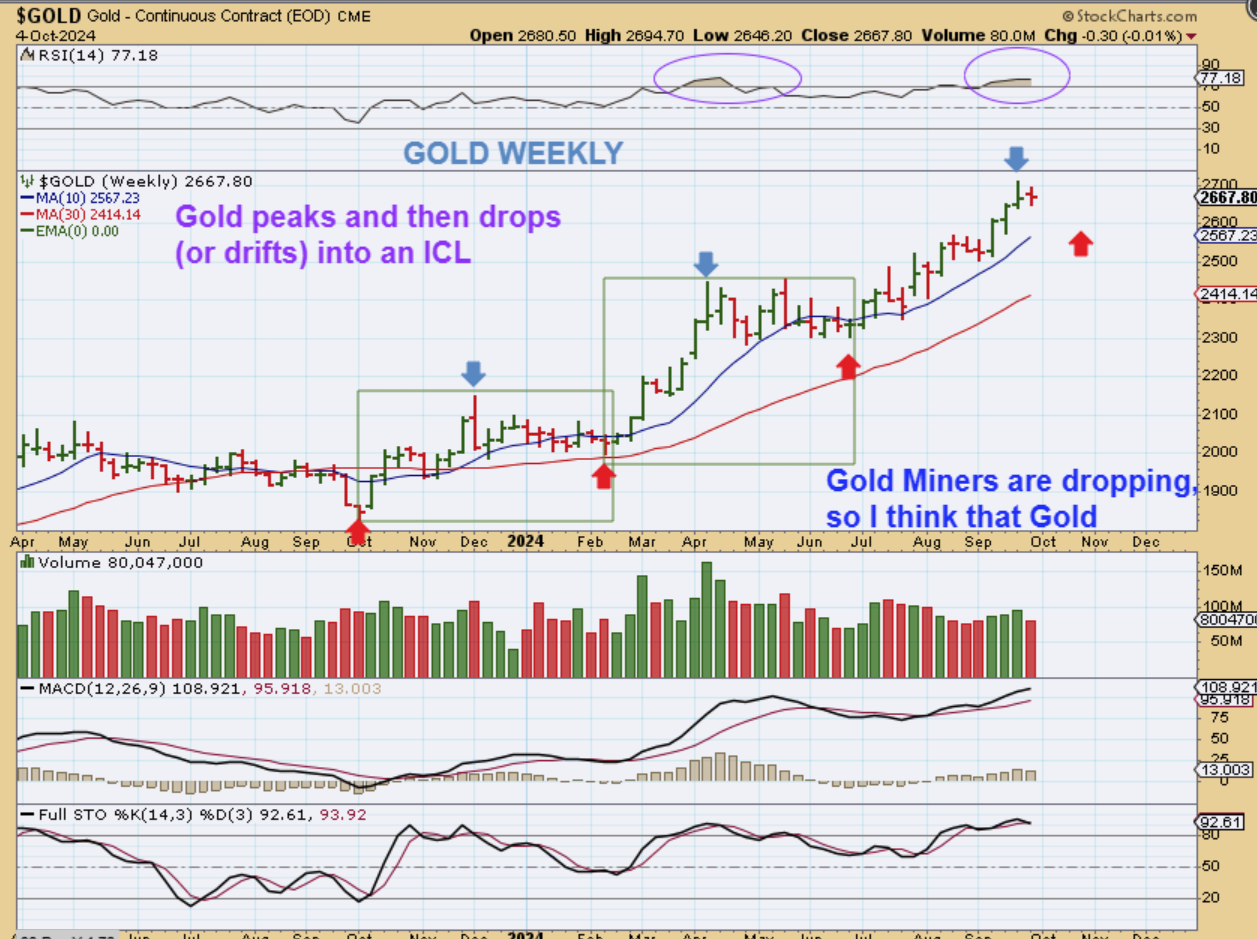
GOLD WEEKLY – Gold is on its 3rd daily cycle and with the USD running higher, it may be that Gold ‘peaked’ 2 weeks ago after a very nice run to new all-time highs. It can begin to pull back and gradually give us our next ICL in November or maybe December, but notice that the last 2 ICL’s were almost stealth because it was so mild. Gold dipped and chopped sideways. Note; my last Red arrow should be over in November / December.
.
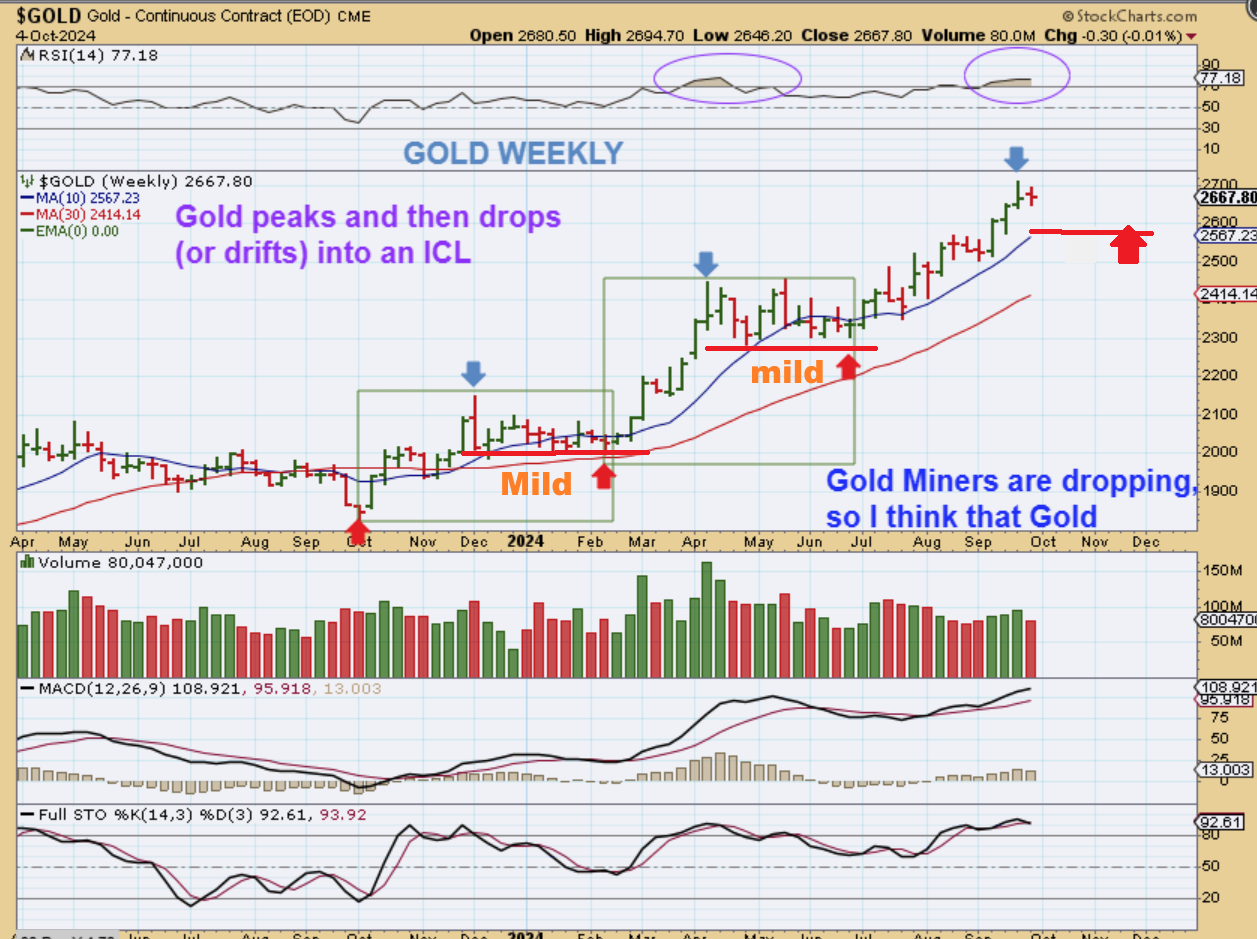
GOLD WEEKLY – This is what I am thinking could happen (I moved my red arrow).
1. Past ICLs were sideways, choppy, yet mild.
2. This could do something similar as the USD puts in a daily cycle or 2 higher.
3. After that pause in Golds run, I think that it will continue higher with future rate cuts and Silver and the Miners will resume their bull run too.
.
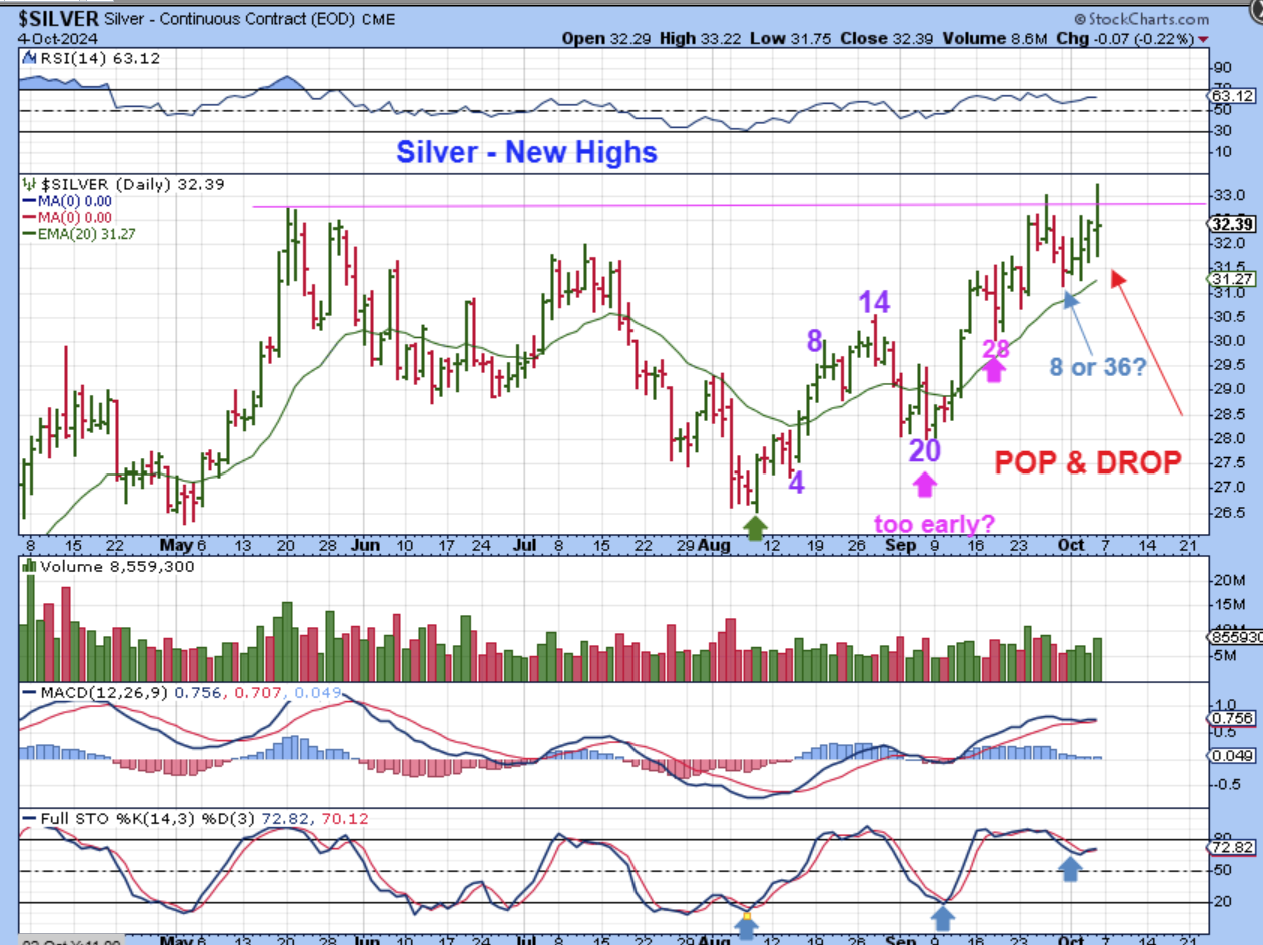
SILVER DAILY – The cycle count for Silver has been obscured with the choppiness. Was day 20 too early? It seems so, but was day 28 the dcl? Maybe, it is hard to say with a certainty. Another dip came on day 8 or was that day 36 and THAT was the dcl? You can see that it is not clear, but what is clear is the ICL in August and we are exactly 2 months forward from there, so Silver can & should continue higher despite the USD.
.
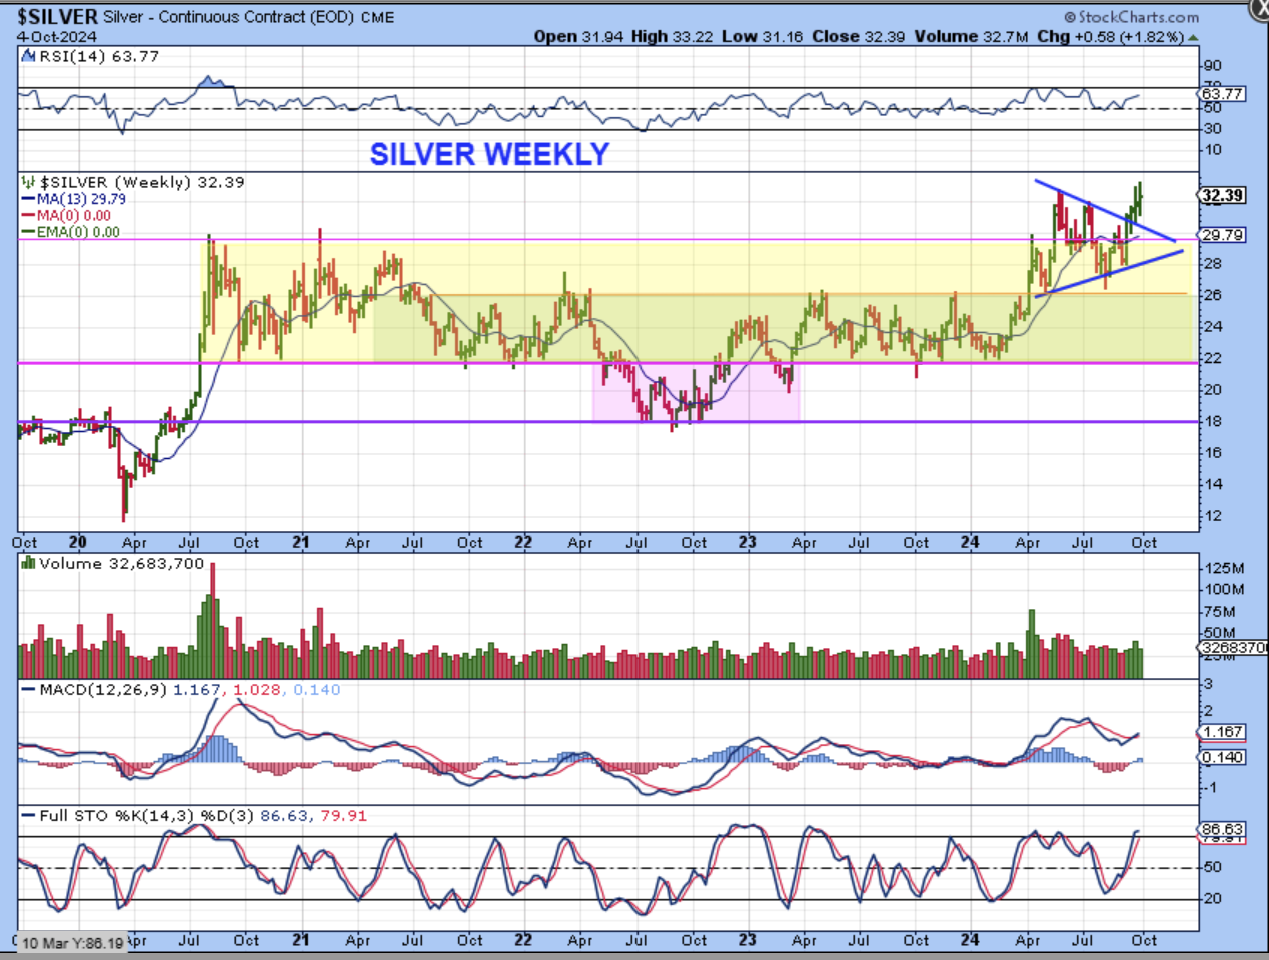
We have a Weekly breakout for SILVER and each week it is trying to forge higher to new all-time highs. $36 is a realistic target for this run, but Silver can get explosive at times, so we’ll just call it a nicely Bullish set up.
.
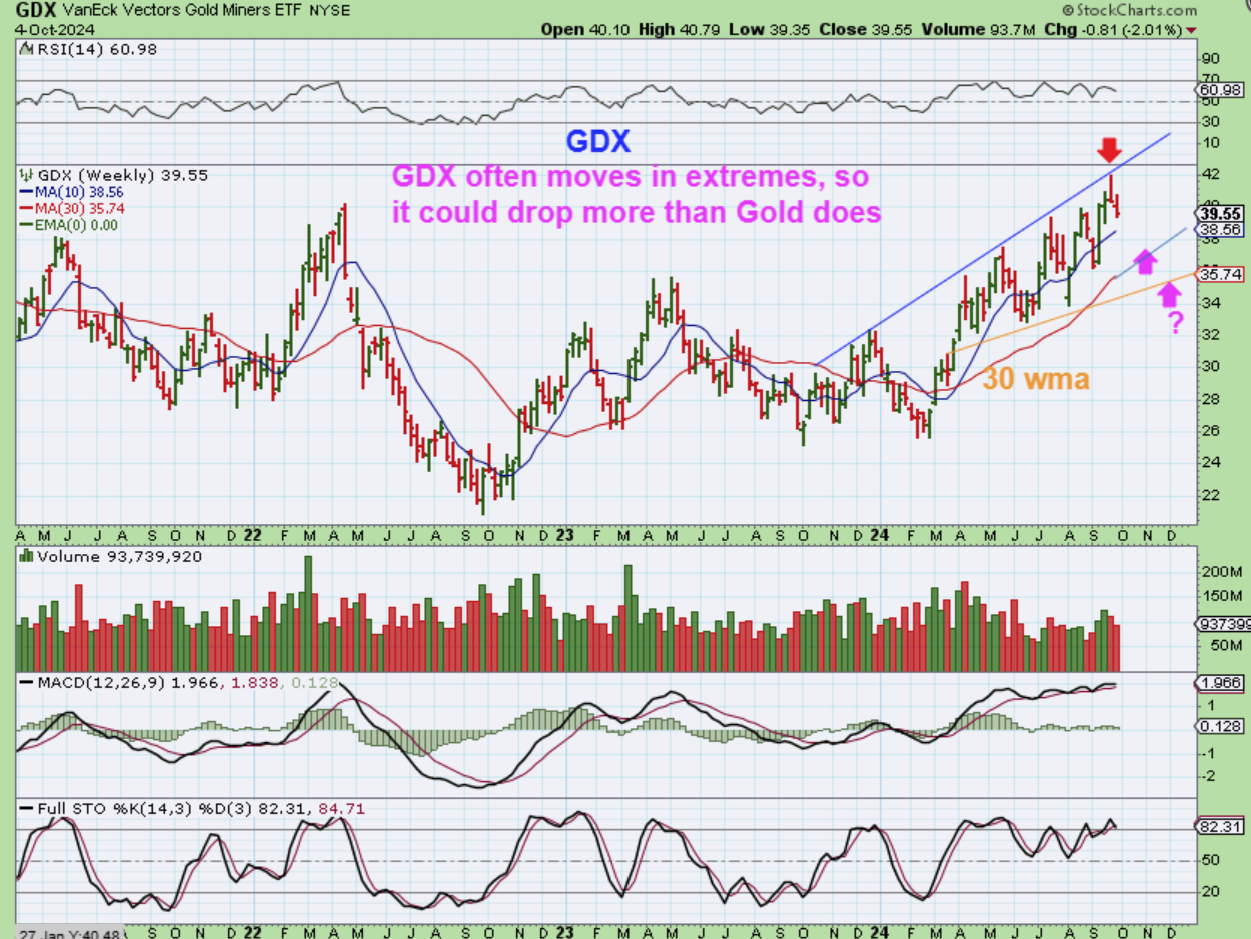
GDX WEEKLY – Now that we’ve seen that Golds peak was 2 weeks ago, it makes sense that GDX peaked then too. It also lines up with the upper trend line that I have been drawing. Miners can drop quickly, so I’ve drawn the lower arrows at the 30 week ma or possibly the orange lower trendline. So if or when GDX gets down to that $36 area, it will be a strong buy when that next ICL is in place.
.
So that’s how the Markets are set up going into next week. It looks like The General Markets are set up to continue higher, with some nice set ups in Tech and Semiconductor stocks. Oil and Oil stocks could pull back after a straight up surge, but they should also continue higher over time. Gold may have ‘peaked’ in its intermediate cycle, but Silver is out of sync with Gold and it is only 2 months out from the ICL, so I think that Silver can move higher too. I have been trading Crypto Stocks, since they looked to be bottoming with Bitcoin, and that area does look good, so I’ll discuss Bitcoin below. Enjoy your weekend!
.
~ALEX
.
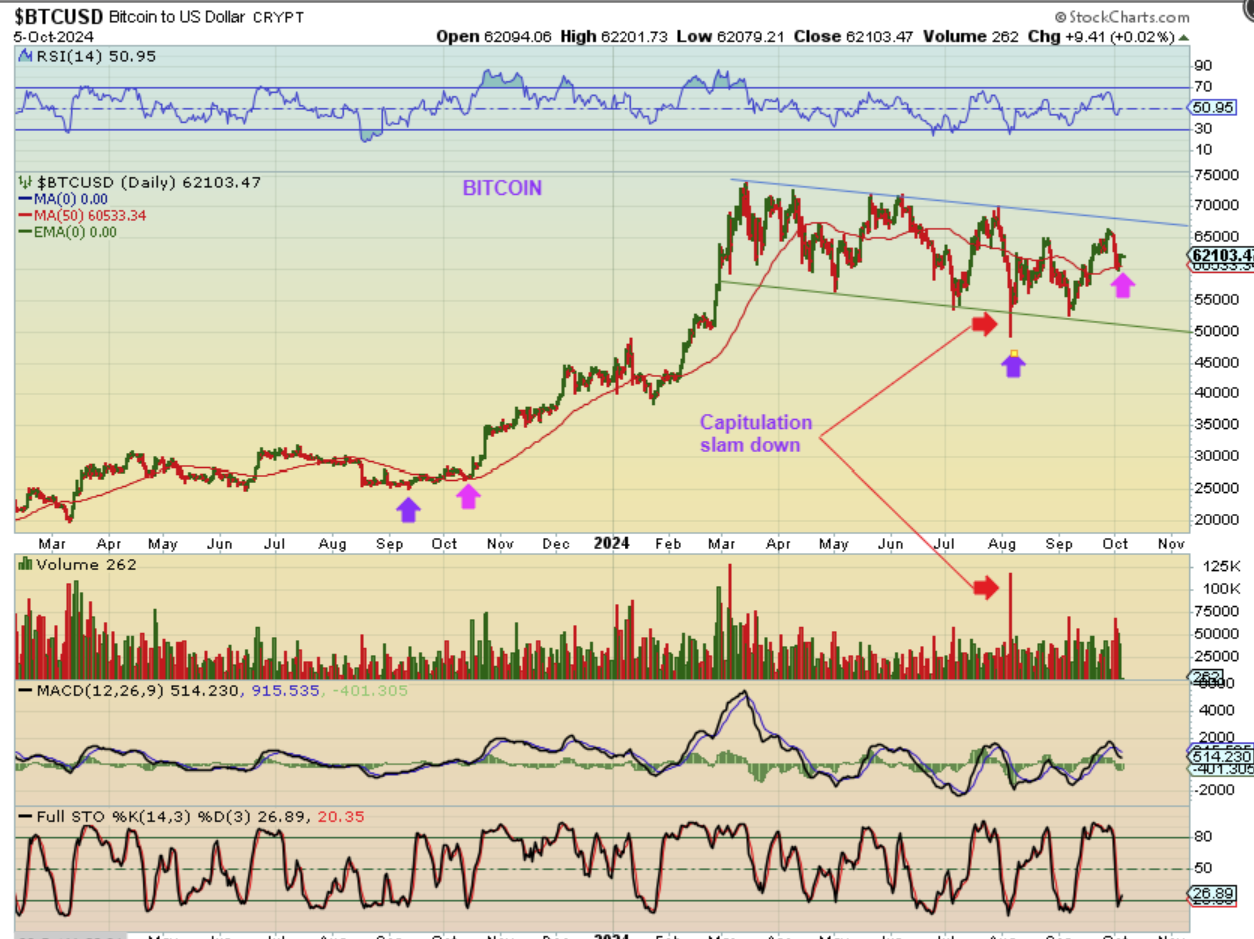
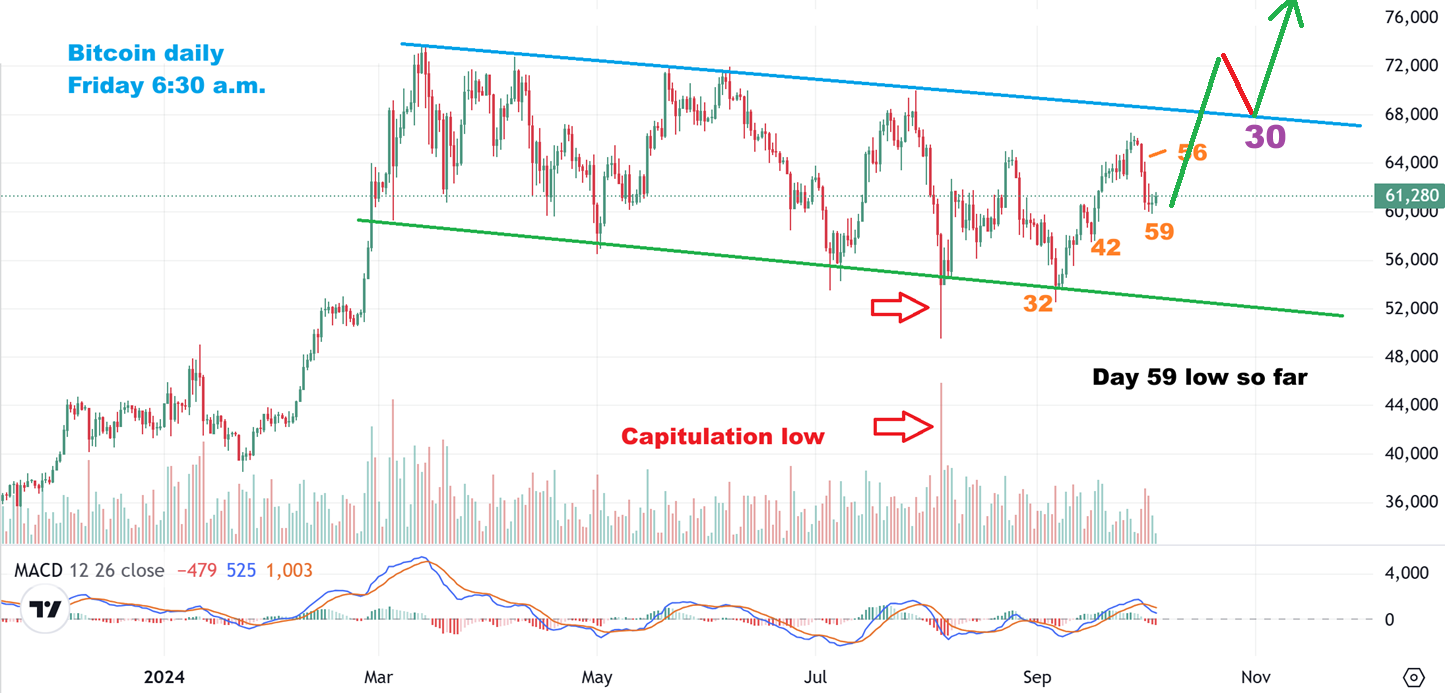
BITCOIN DAILY: This is a long bullish consolidation, and it had a sharp sell off with capitulation type volume as the lowest point in August, so we’ve been counting out the 60 days that follow to see if we get a higher low or not. We are now at that day 60 point, and Bitcoin bounced at the 50 sma.
.
.
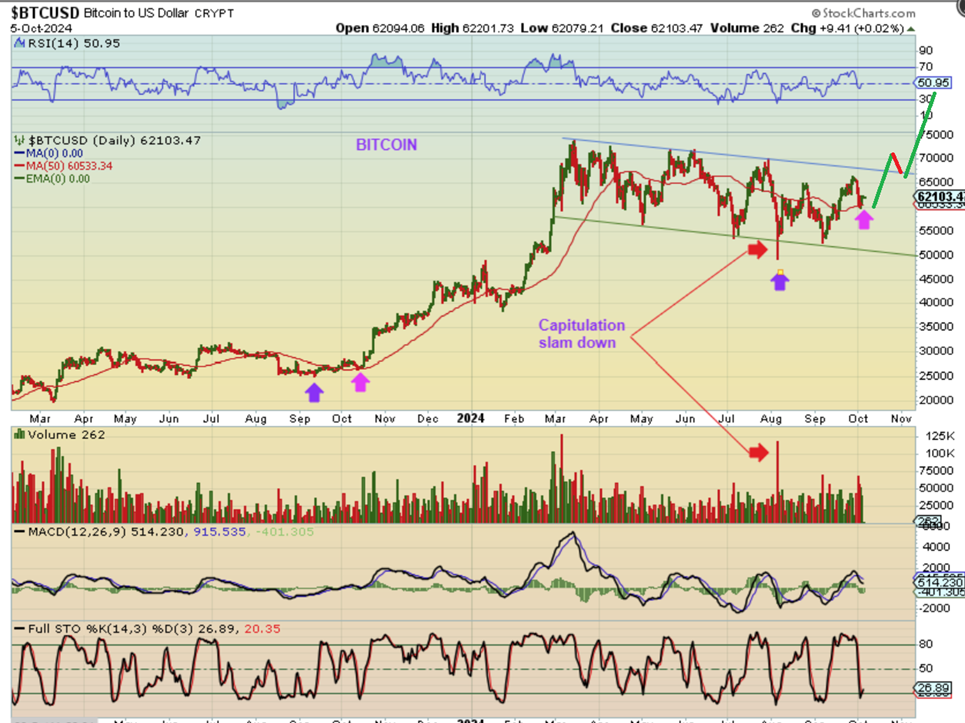
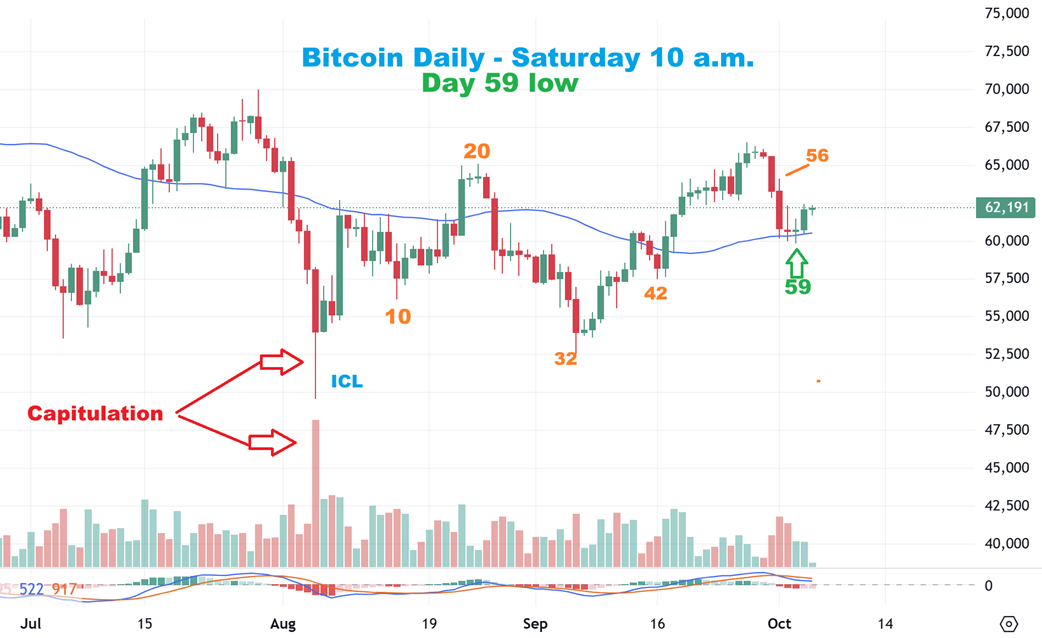
BITCOIN DAILY: So I am thinking that with this higher low around day 60, we now are close enough to the top to break out and back test in the next 30 days, and then rally to new all-time highs in the complete 60 day cycle. THIS COULD BE BIG for Bitcoin ETFs and Crypto Stocks if hat I have drawn here plays out.
.
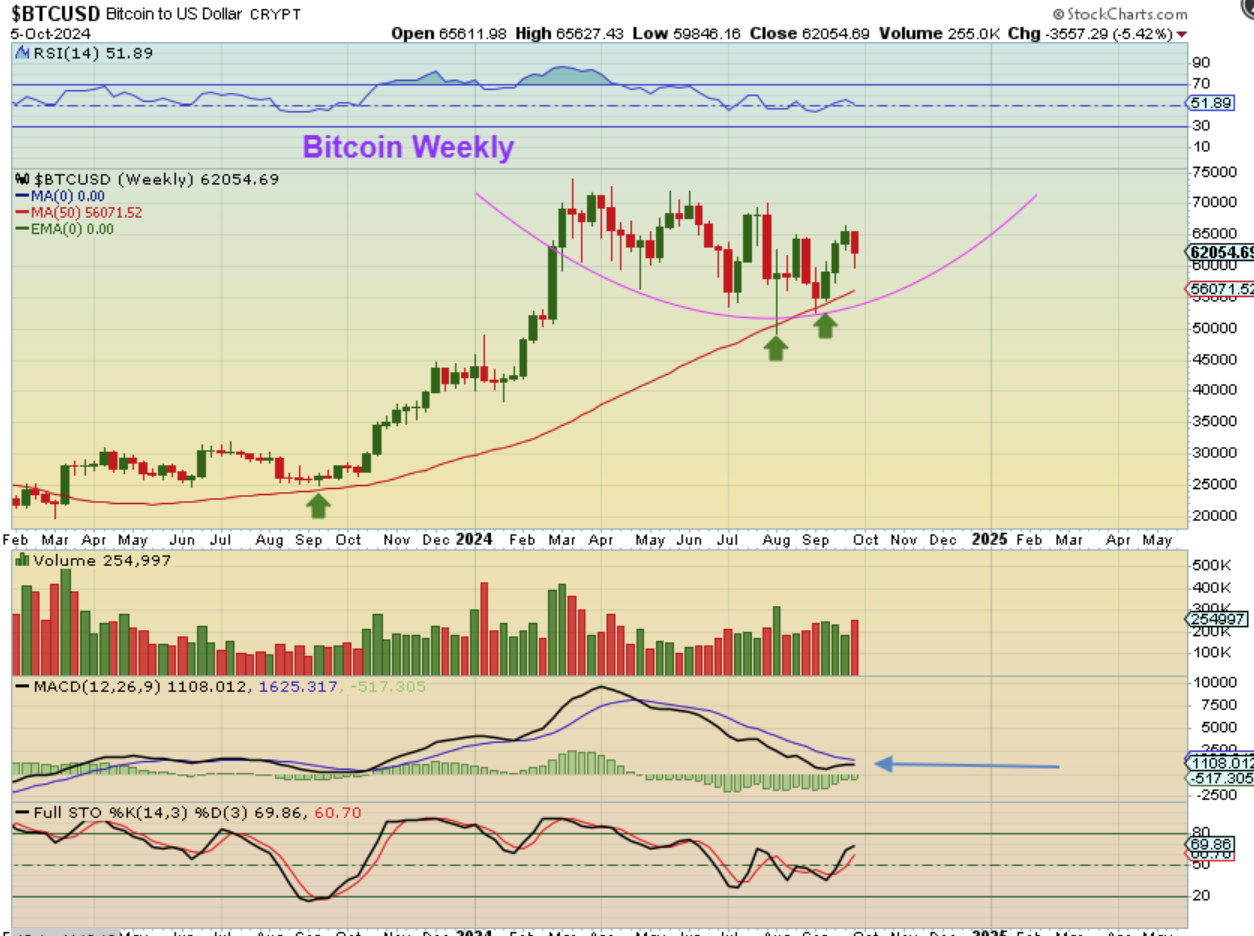
BITCOIN WEEKLY: I noticed a bowl-like rounding bottom base forming, but I don’t think that price will drop and continue with this shape, since day 60 is now behind us. I just feel that price is ready to move higher and this will look like a bull flag breakout after a few more weeks pass.
.
I PUT THIS IN FRIDAYS REPORT:
If the day 60 low comes in this high in the consolidation, it is very easy to picture Bitcoin finally breaking out and running much higher, like this. THIS would be a GREAT TRADE for ETFs or the Crypto stocks.
.
This is Bitcoin Saturday morning: If this day 59 swing low remains in place, then this was a beautiful reversal / landing on the 50sma and we should have 30-60 days higher over time if the sideways chop comes to an end.
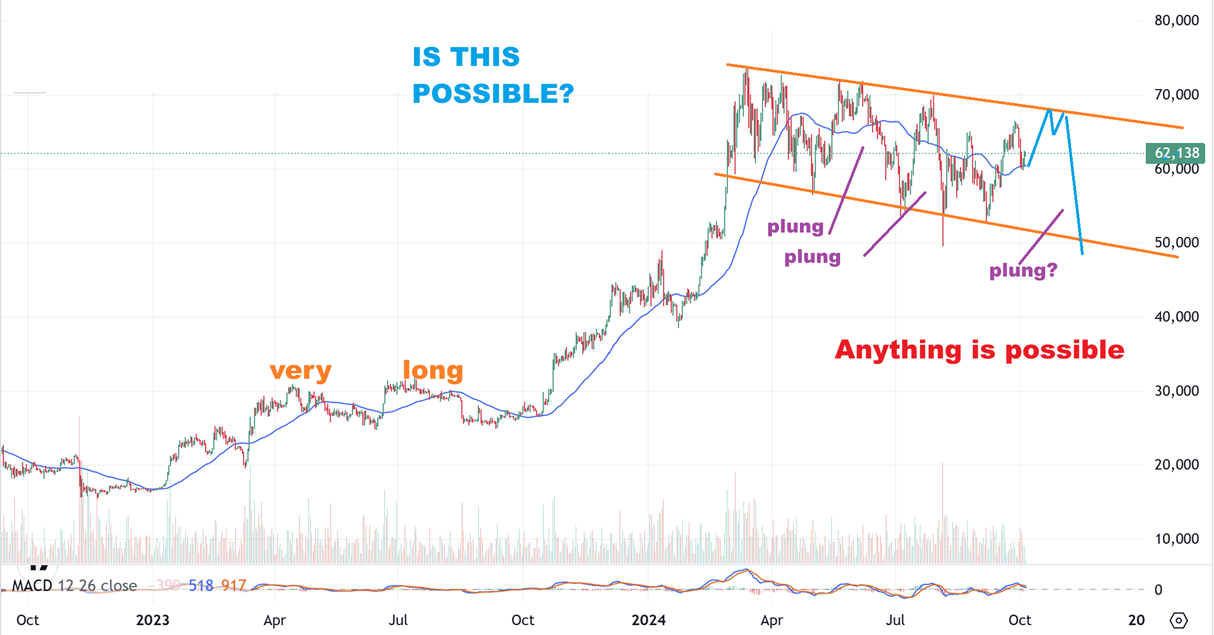
ONE FINAL THOUGHT ON BITCOINS SET UP: Is it even possible that we get another 60 day portion to this large consolidation? Of course it is. 🙁 Anything is possible with Crypto. That said, this day 60ish low would be a buy and then I think that we will know more as we approach day 30 near the highs.
.
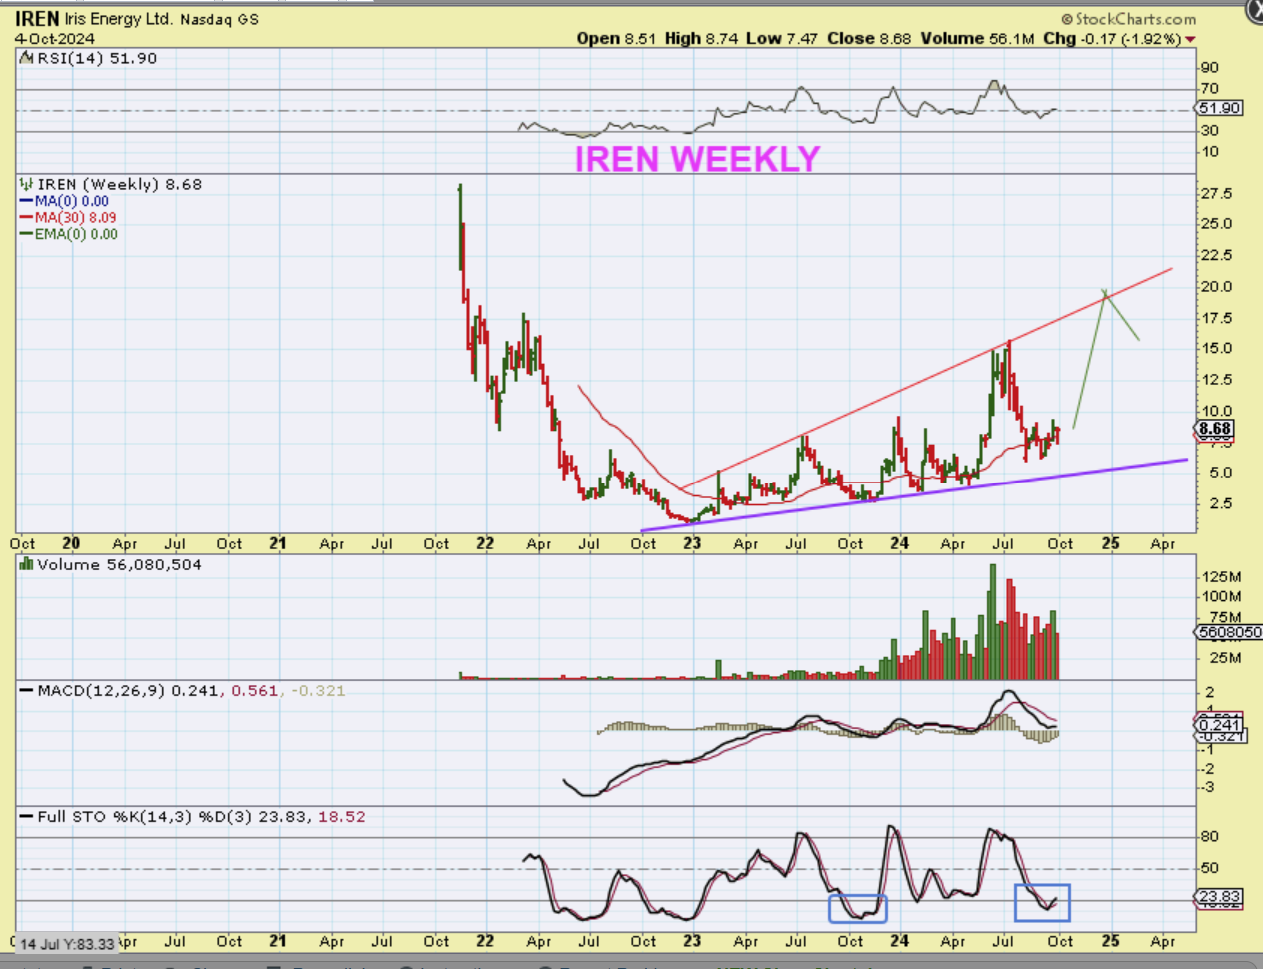
I have discussed HUT, IREN, BTBT, WULF, etc as looking like they bottomed, and RIOT, CLSK, CIFR, MARA, etc may be bottoming at the lows now too. I will cover those more in the day to day reports, like I have in the past, but here I’ll just add a couple of weekly charts for the weekend review.
.
You can see that the Potential is big if Bitcoin breaks out and runs.
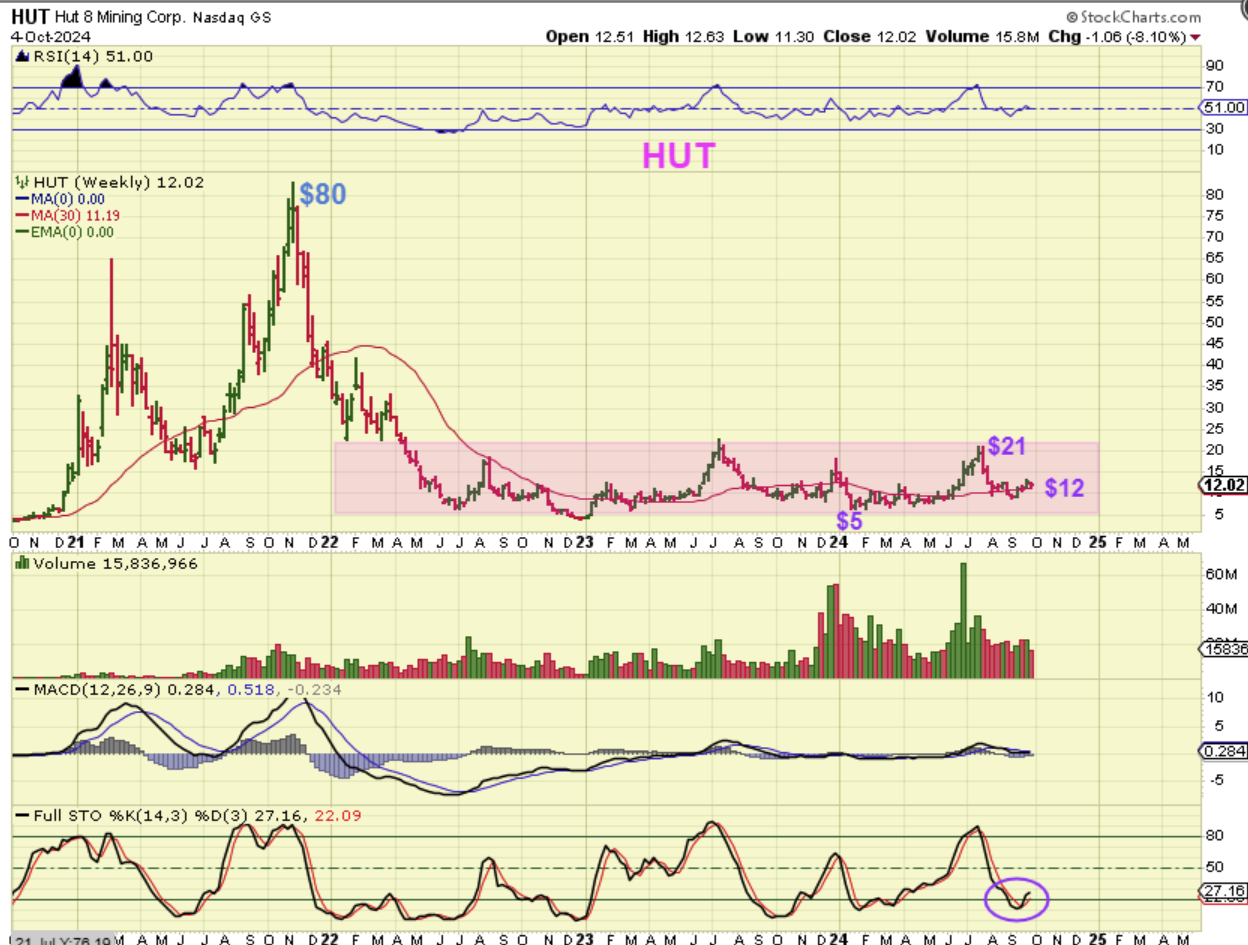
The Potential is big if Bitcoin breaks out and runs, and these find buyers again too.