
October 26th Weekend Report
.
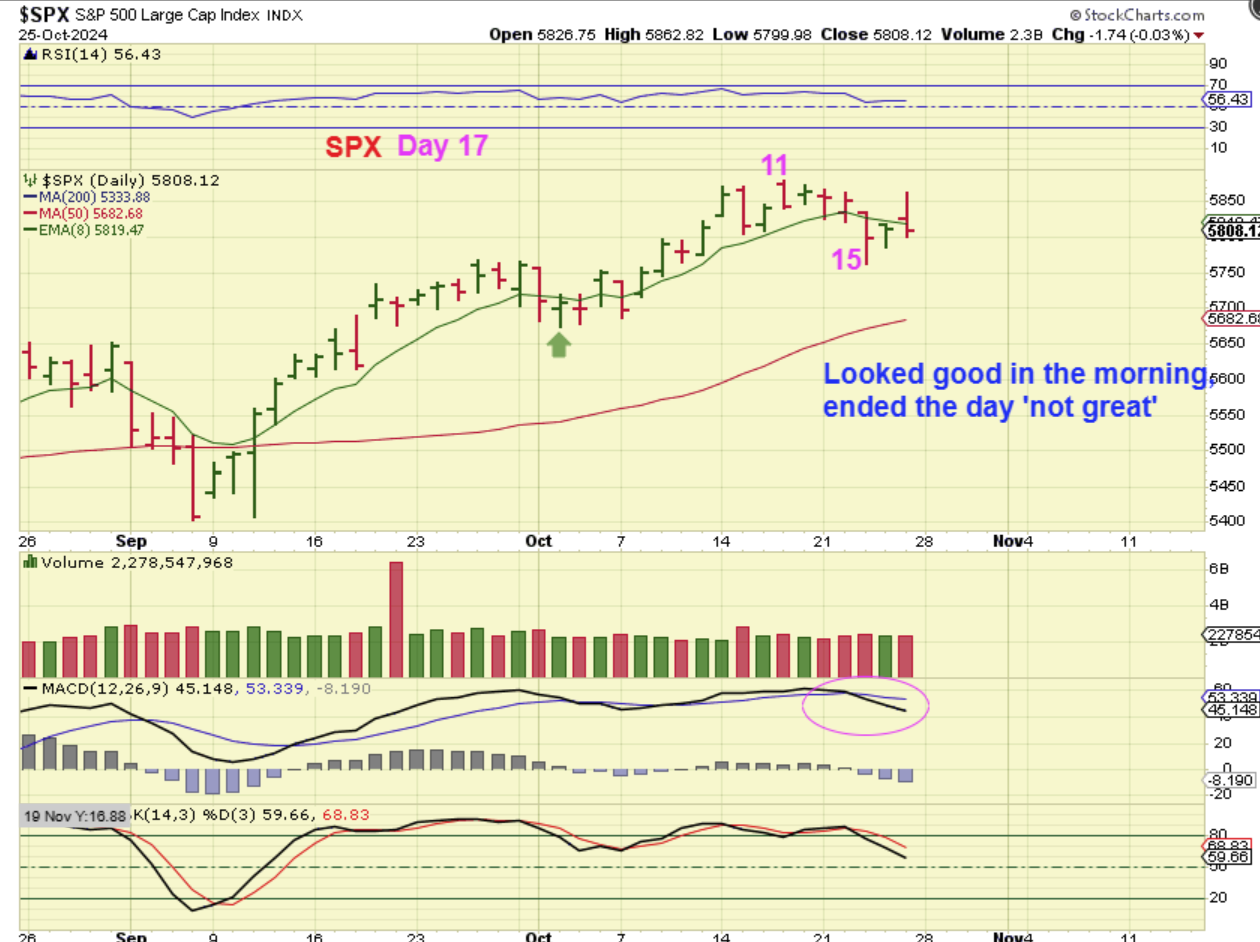
SPX DAILY– The markets have chopped sideways for a while and seem a little ‘heavy’ lately, unable to start a rally. We saw what could be a day 15 half cycle low, and then Friday started to take off higher, but that rally also sold off into the close. So far, we are waiting for some upside to continue the bull run, or this may have peaked on day 11.
.
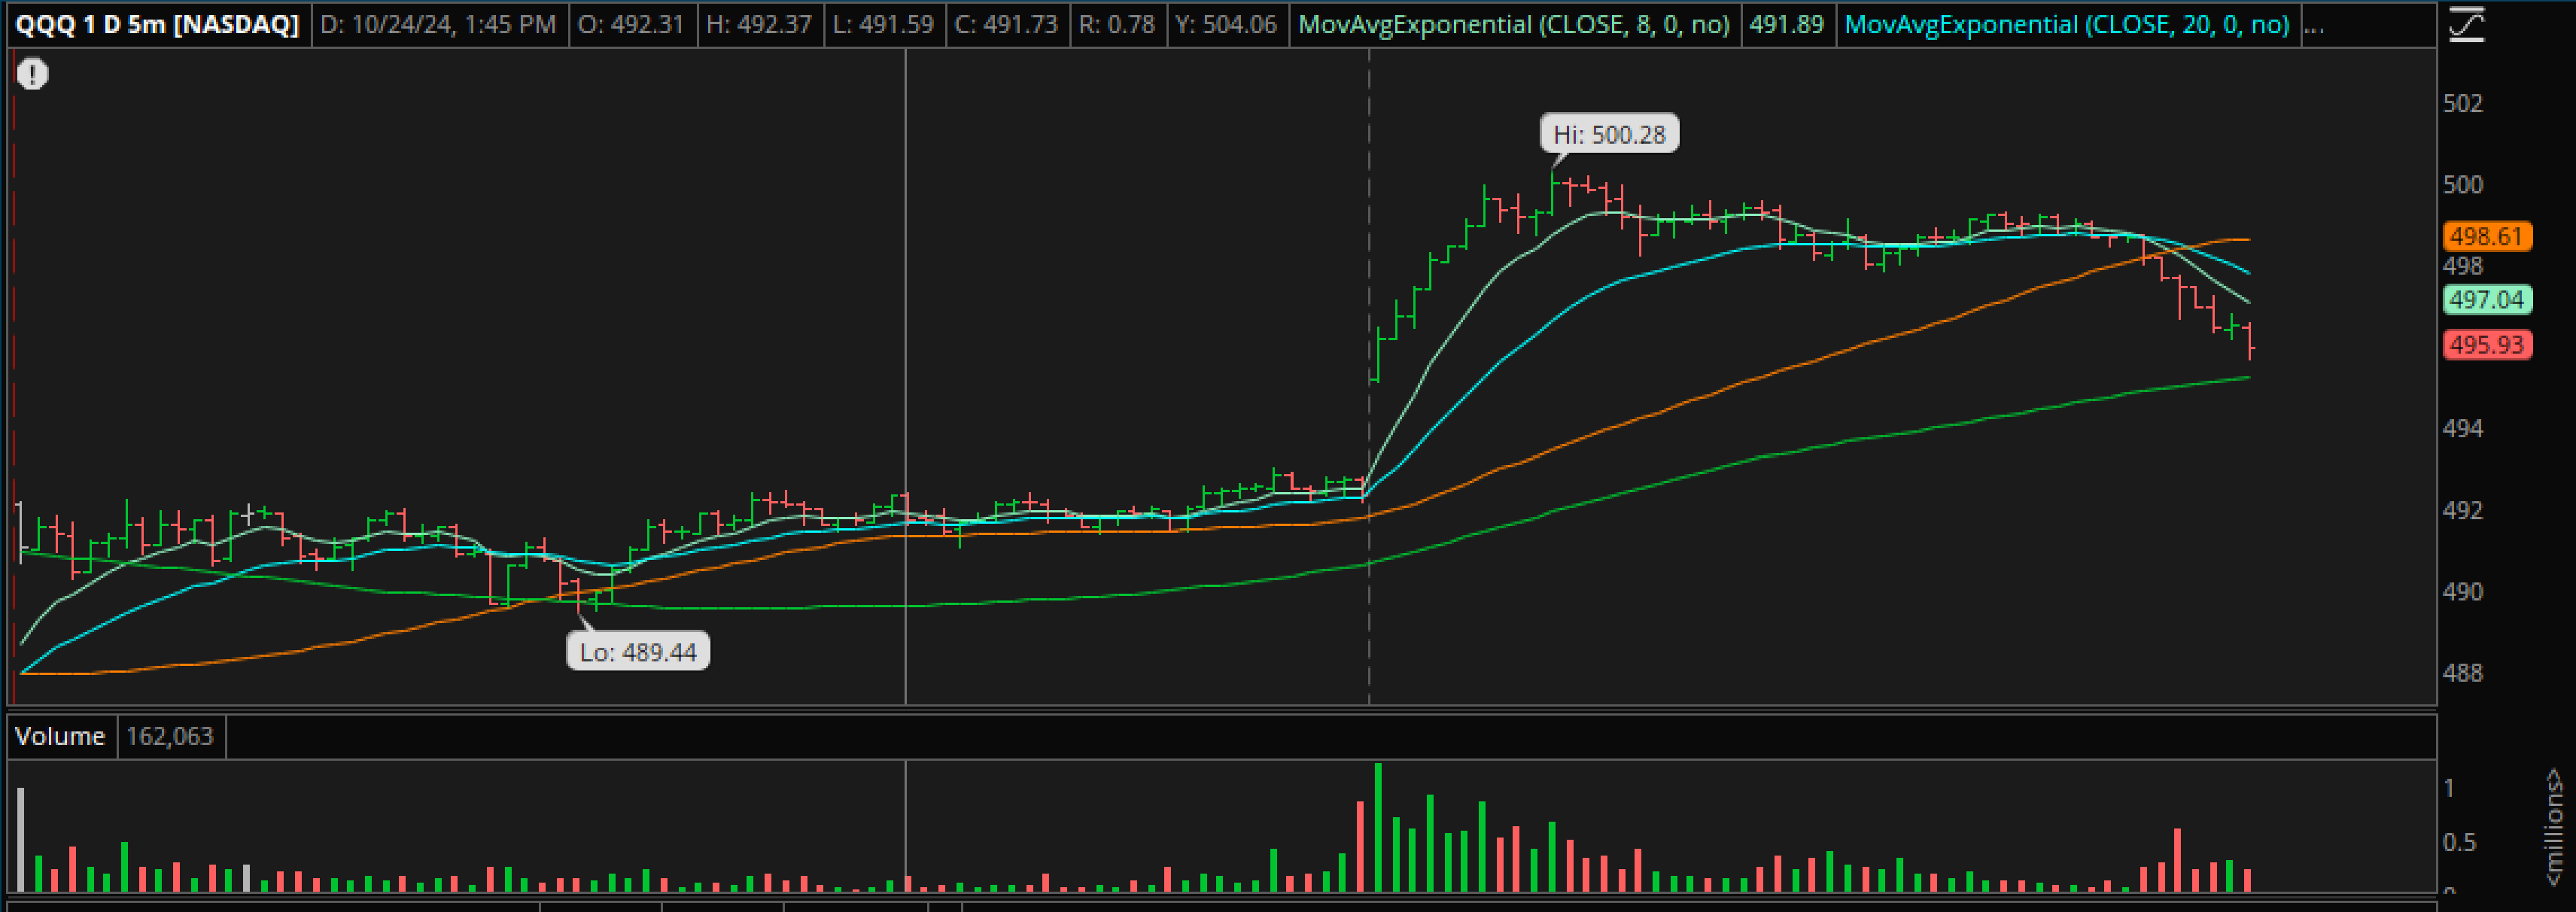
Using the QQQ 5 MINUTE chart, so can see how the markets gapped open higher and started off with a rally, but then chopped sideways, lost steam, and sold off into the end of the day.
.
Now for the Weekly charts:
.
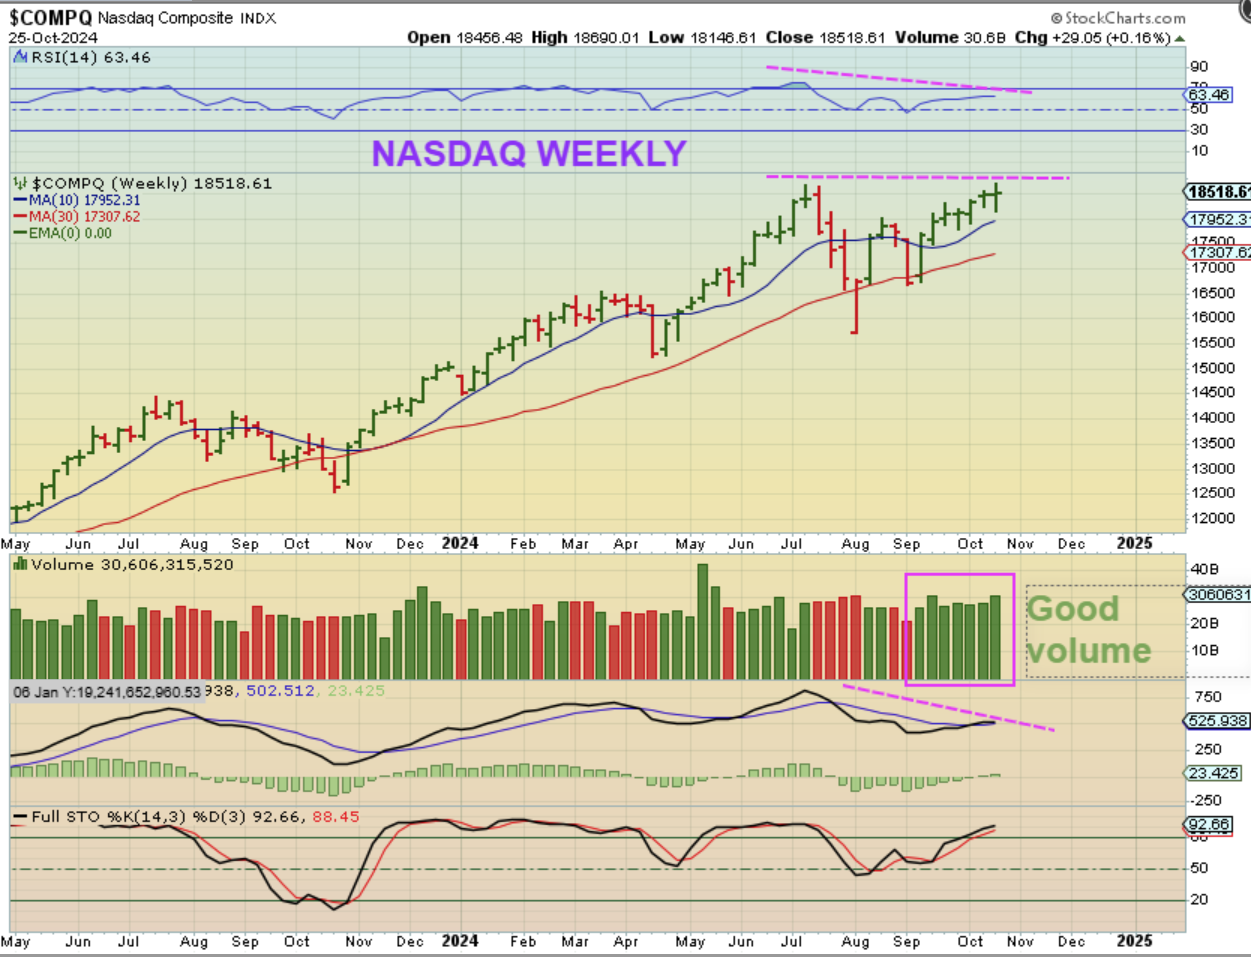
THE NASDAQ WEEKLY formed a doji or indecision candle. As we reach the prior highs, I do see great volume, but I also see negative divergence. This is not a bad chart, but it just need to see some upside sooner than later. P.S. The next Fed meeting is a week and a half away.
.
THE SPX WEEKLY also doesn’t look bad at all. It does show a little divergence in the RSI, but the MACD actually looks good and it has been rising up and out of the ICL, so the tech Sector is showing a little more weakness than the S&P 500.
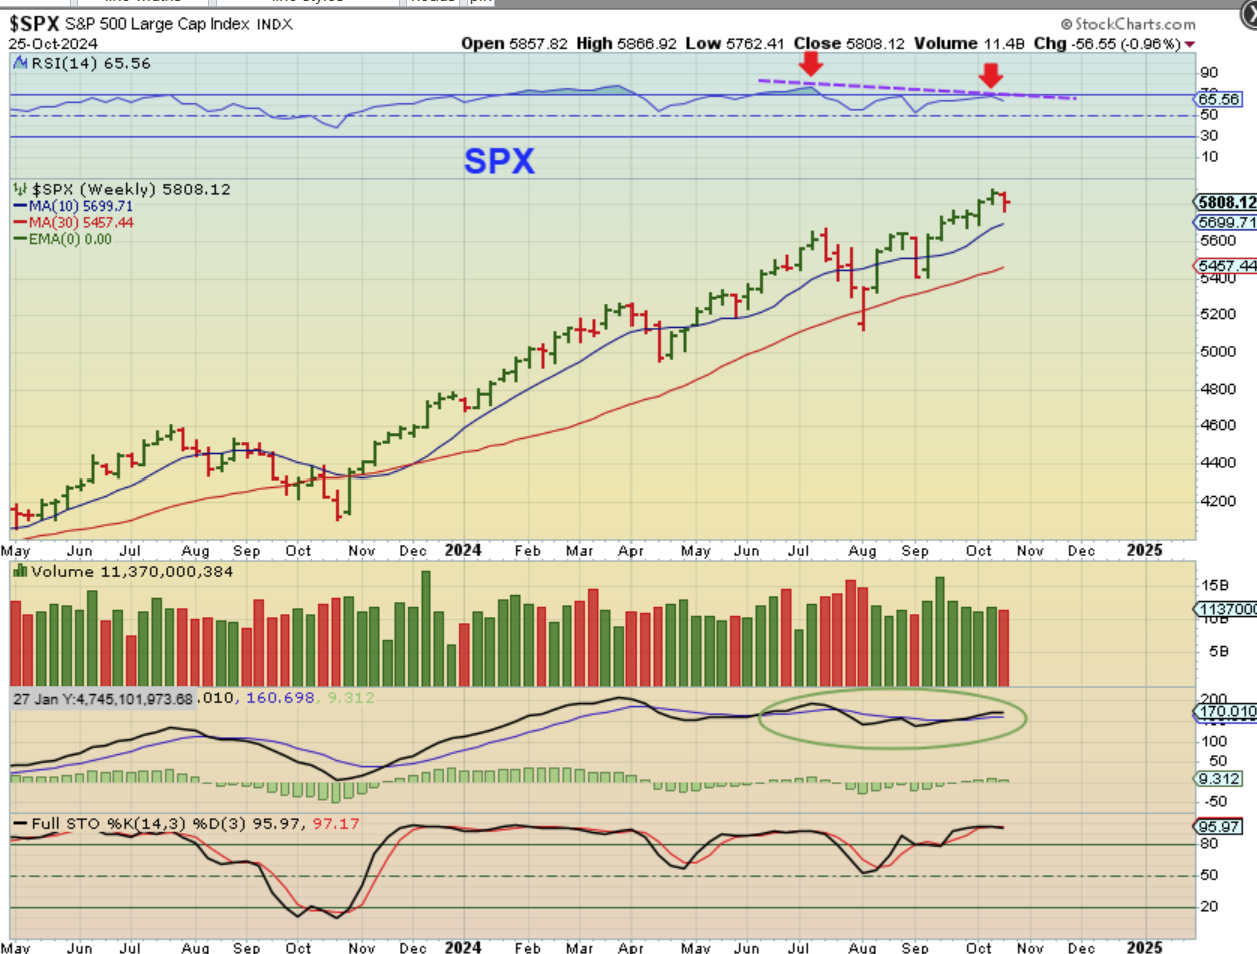
Overall, the General Markets have time to put in some upside, I would just become more cautious if we get all the way to the Fed meeting and they still don’t have a any strength, because it may then be too late in the daily cycle to make a new peak. Time will tell.
.
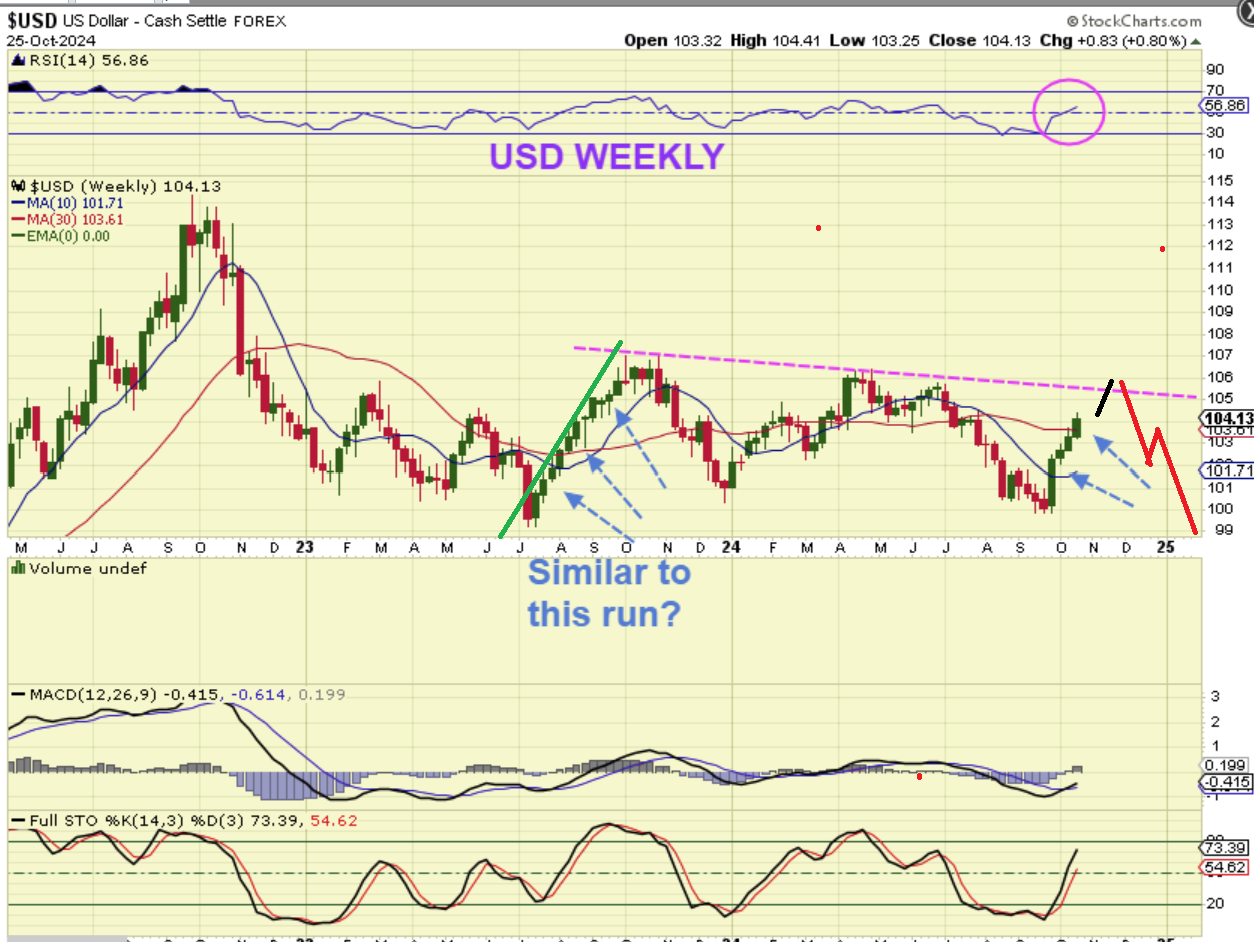
THE USD has been running strong and we have seen that before, with 11 straight weeks of gains in mid 2023. The daily chart broke through the 200sma and the weekly broke through the 30 week ma, so it is a bull run, but it has NOT hindered Golds rally very much at all. They both ran together. I’d love to see…
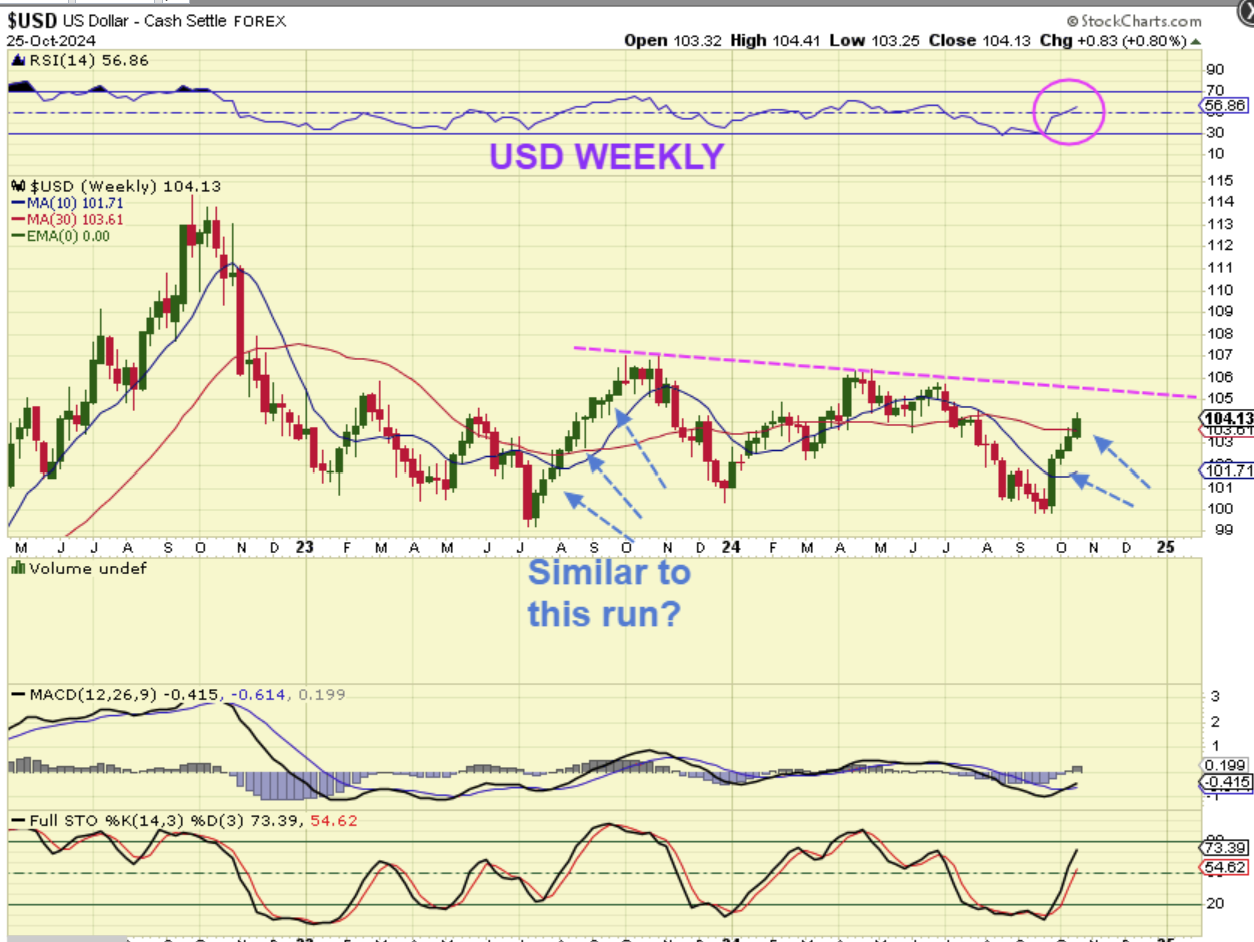
.
I’d love to see the USD peak around that upper trendline again, as Gold puts in an ICL (maybe in November / Early December?). Then the USD would sell off and Gold would likely really take off.
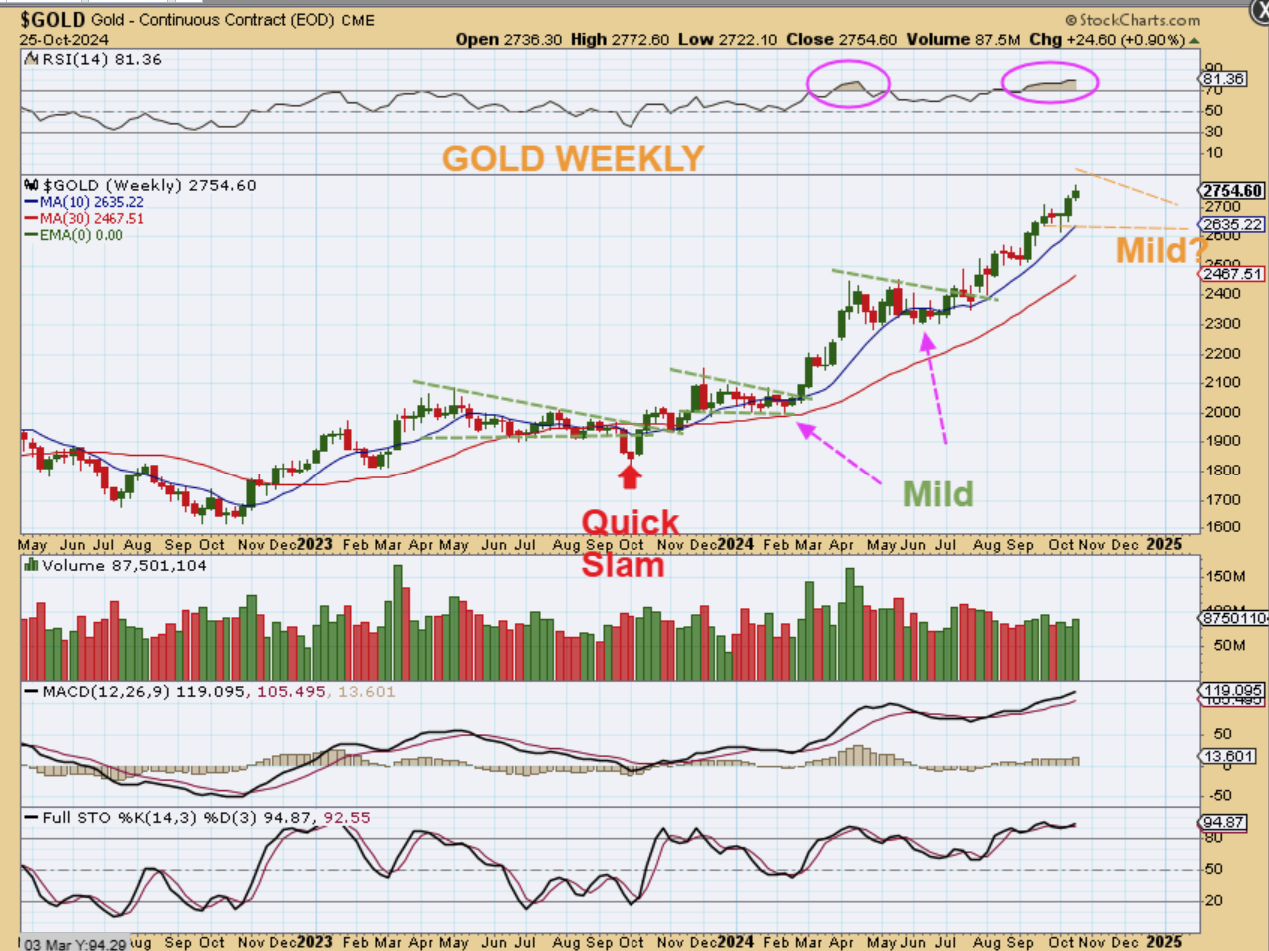
GOLD WEEKLY – Gold has been very strong despite the USD rally. We made new all-time highs again this week, but it is getting quite overbought and is coming due to peak in this 4th daily cycle and then roll over into an ICL. We have seen choppy mild dips into the last DCLs and ICLs, so this may do the same. Notice that The OCT 2023 ICL saw price chop sideways and then it did a quick slam down & recovery. Whatever way that it forms, buying the next ICL should pay off nicely too.
.
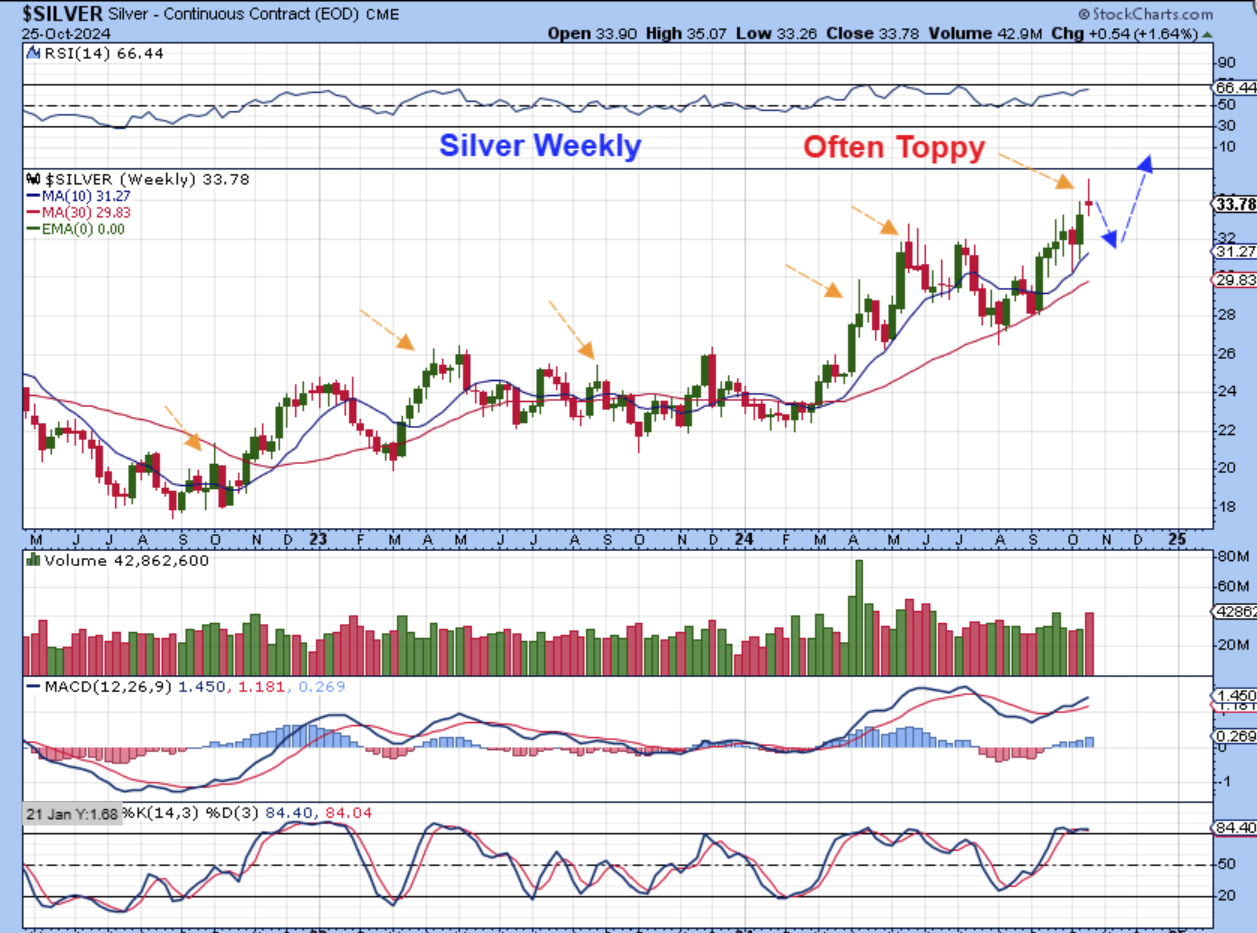
SILVER has what looks to be a toppy weekly candle. Silvers run is not in sync with Golds and it has not been as smooth and steady as Gold, but that can change over time. Silver broke out recently and if it back-tests & reverses higher, it could make a nice move over time. In 2024, Silver has moved from $22 to $35, and that is great, except that it has been very choppy and difficult.
.
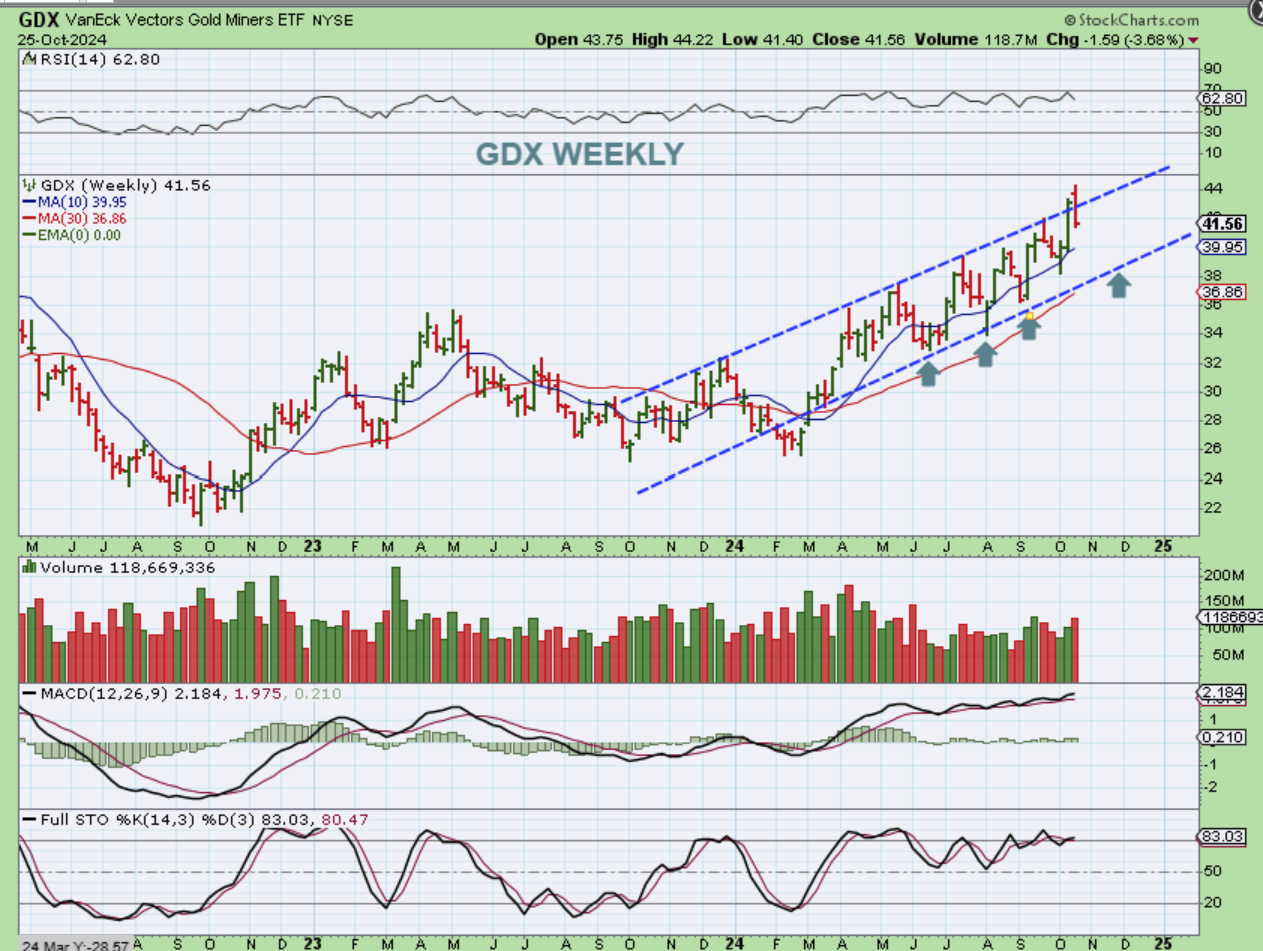
GDX WEEKLY: GDX has been very choppy too. In hindsight, it looks good in 2024, running from $25 to $44, but the ‘swings’ of the daily cycles have been large, making ‘Buy & Hold’ tricky.
RIGHT NOW: We had a breakout of the up-trending channel, but it became a ‘false breakout’ and usually price returns to the channel. Notice however that it has actually turned upward before hitting the lower channel on the last 2 drops (Bullish). So…
.
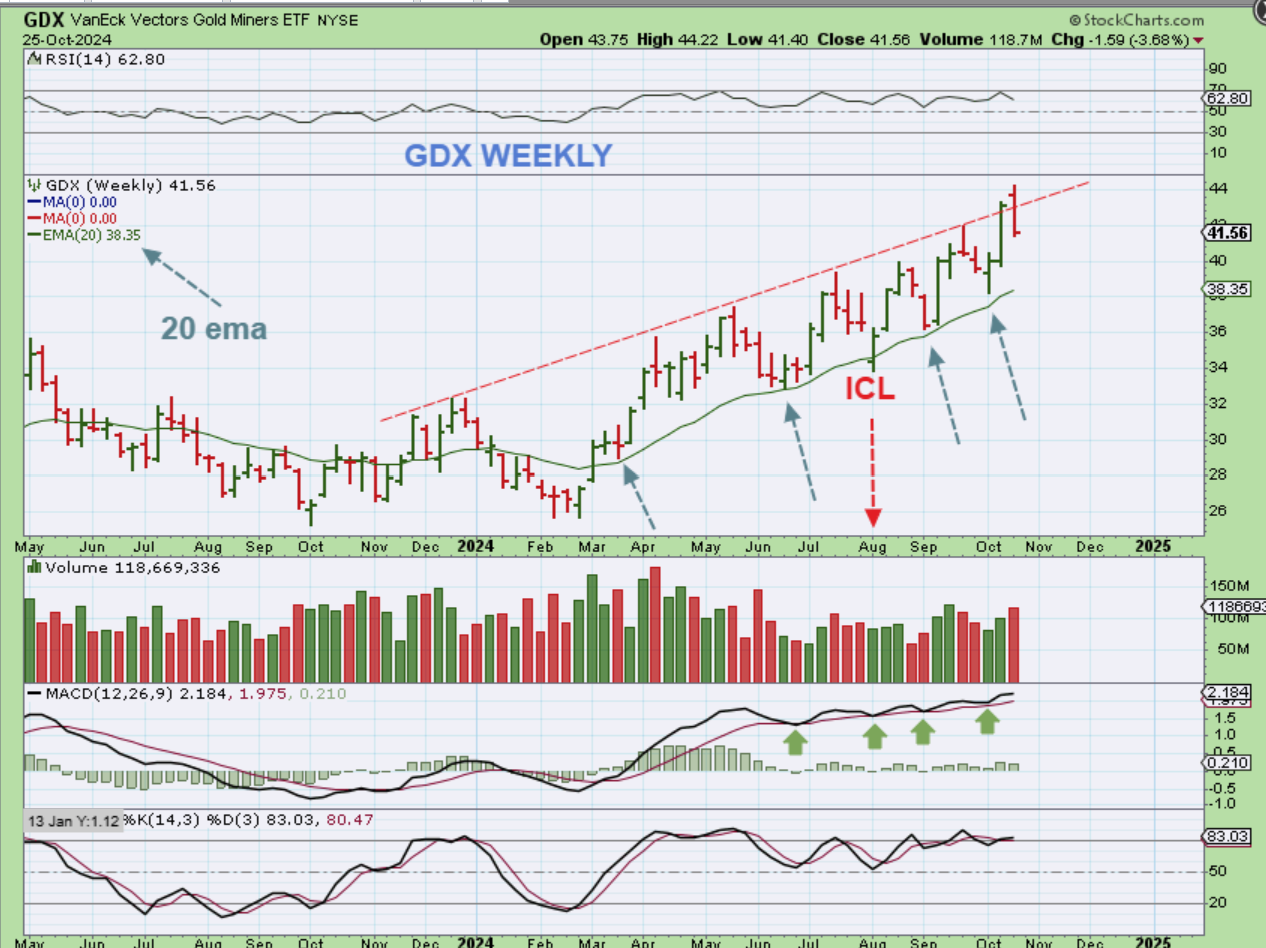
THE GDX ETF actually turned upward before hitting the lower channel on the last 2 drops, which is Bullish, so I adjusted my moving average to see if it had a common spot. The 20 Weekly MA held price on each dcl and the ICL only briefly pierced it one week, so I’ll assume that this may be the next target. That may be roughly $38.50 by the time it gets there. P.S. : Take a look at the steady weekly MACD.
.
This week was a little choppy and toppy looking, but overall you can still see the bullishness in the weekly charts. We may be coming due for a pullback in the Precious Metals Sector, but it will be a buy the dip when an ICL forms, that is for sure. I’ll discuss the bitcoin developments below, and I hope you are all having a nice weekend!
.
~ALEX
.
From Friday:
Bitcoin did bounce at the 20 ema on Wednesday night and on Thursday it moved higher. Overnight it dipped lower, but has a small red candle and could go either way on Friday. The set up looks good though and this MIGHT be setting up to breakout too.
.
I just have to keep telling myself that it’s been a decent run from lows to highs, but this daily cycle may not be the time when we see THE BIG BREAKOUT.

.
So I had this as a constant reminder in Fridays report too:
.
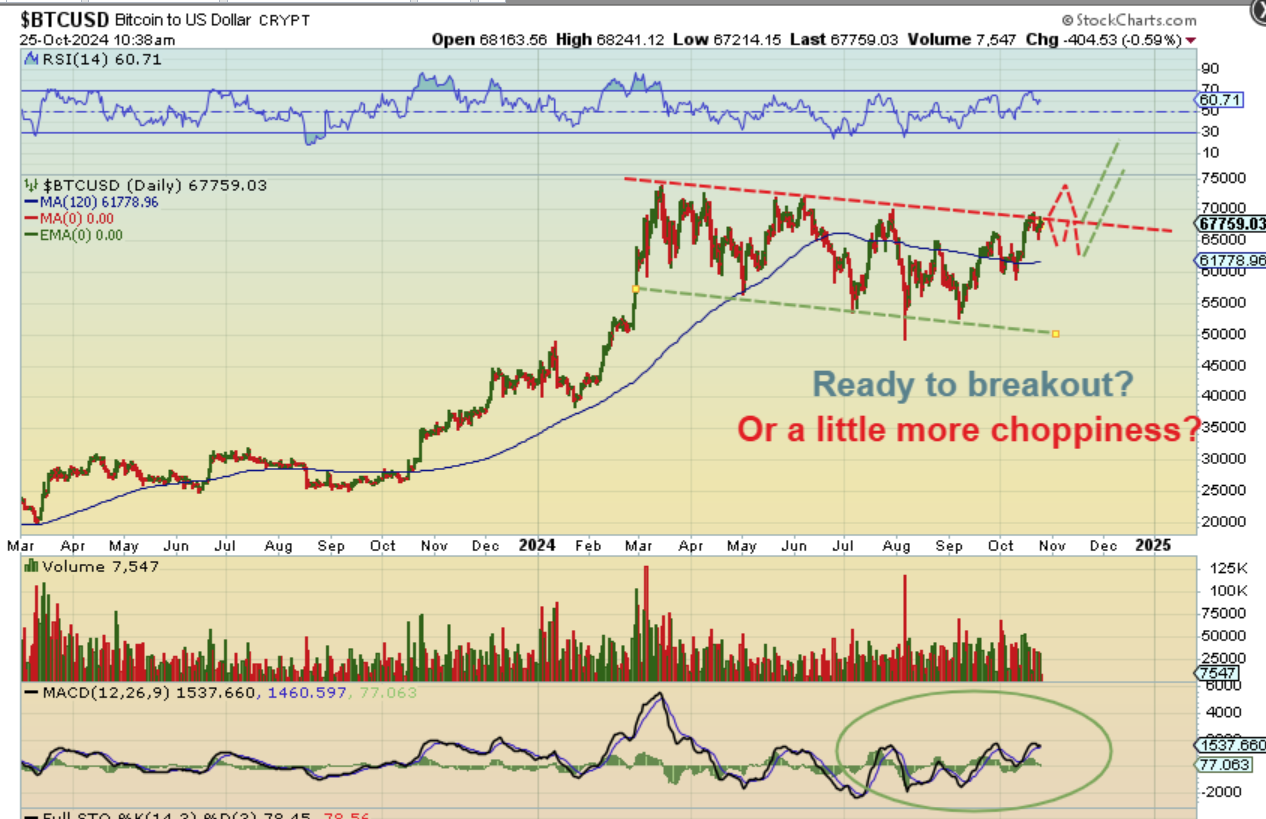
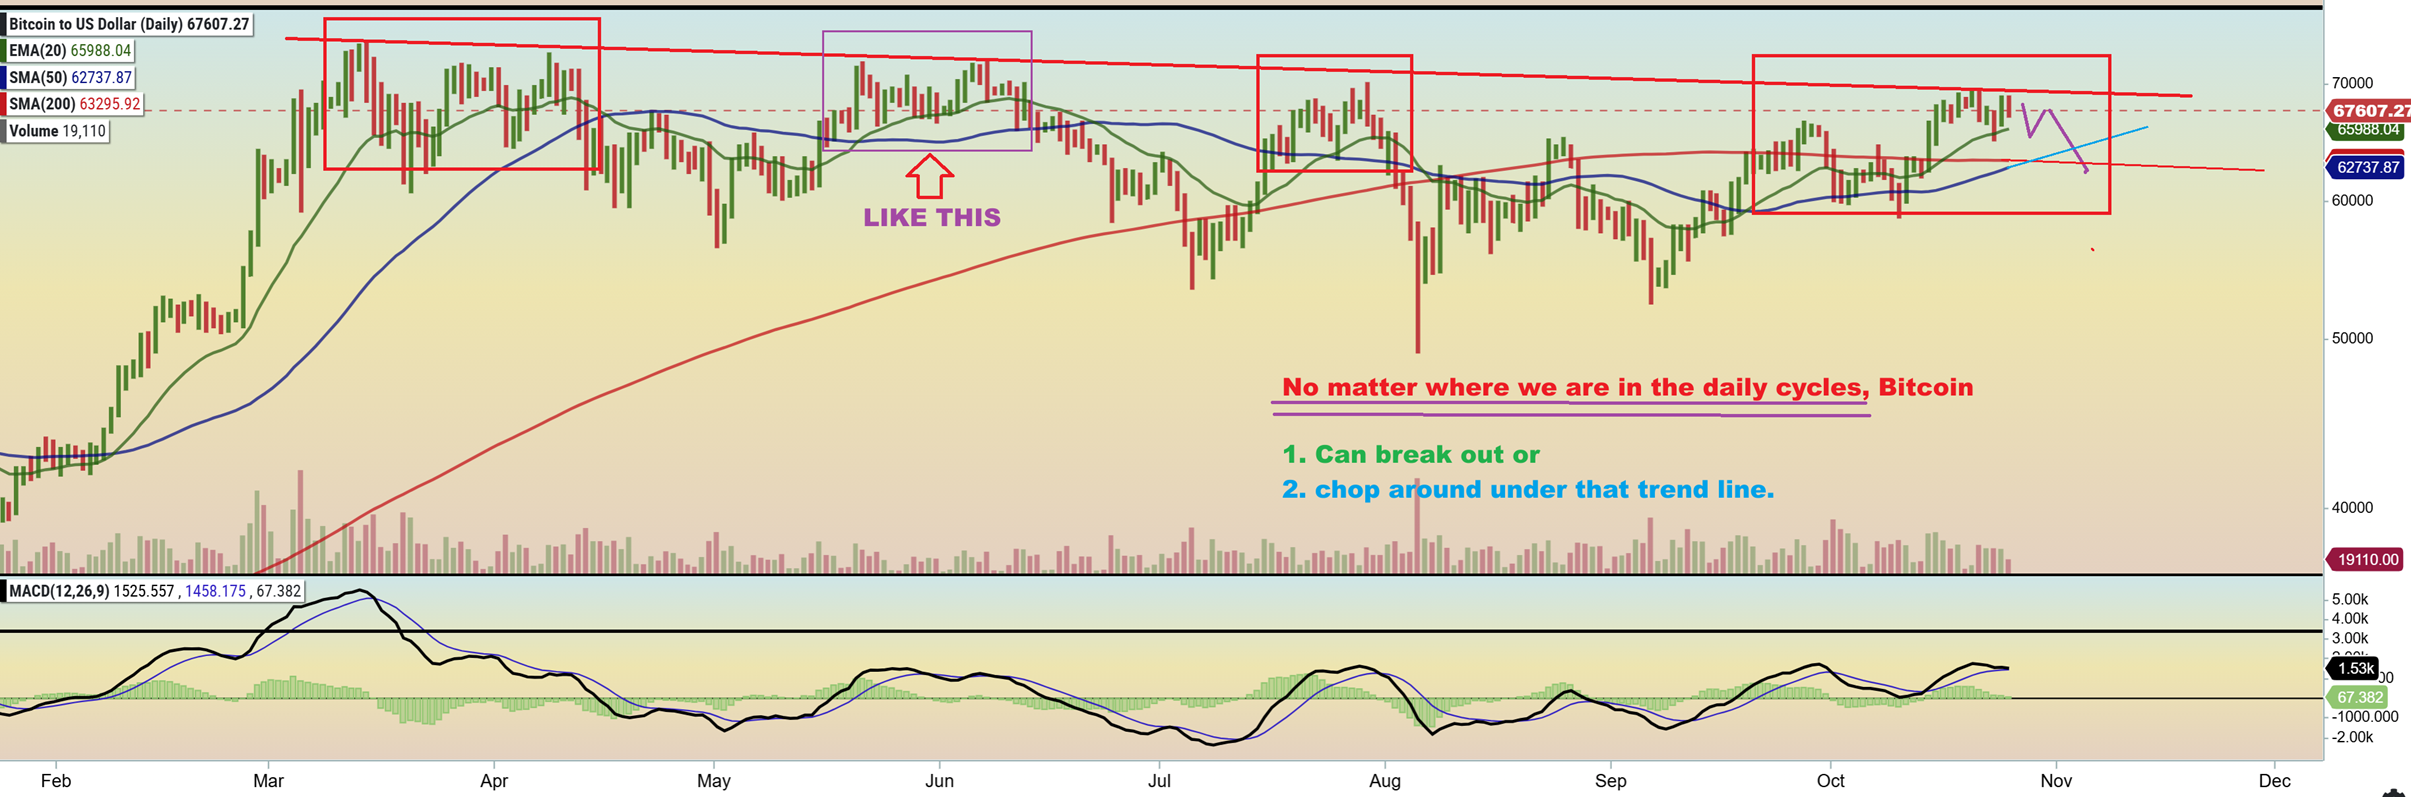
Bitcoin could breakout at any time, but we also know with the choppiness, Bitcoin could drop & chop further. I want to discuss this a bit further in the weekend report, but Bitcoin is currently near the highs, and I have said that a $70,000 print will be a decent visual move above the slanted upper trendline.
.
BITCOIN – I have seen these choppy ‘double tops’ in the past at the upper trend line tags. (Read the chart)
.
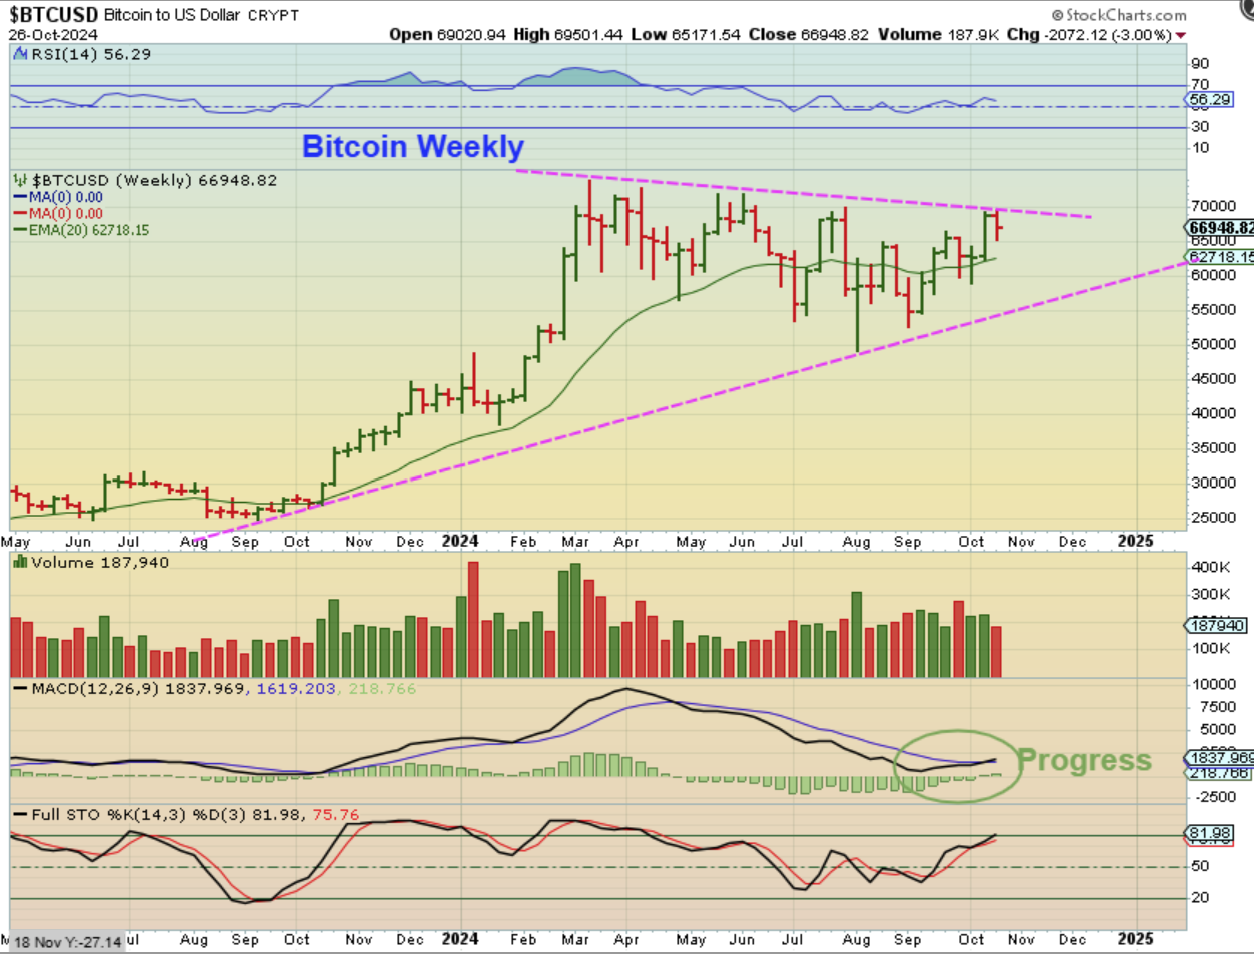
So at the end of Friday, Bitcoin sold off and we now have this for the Weekly Bitcoin Chart. When I added that lower trendline, it actually gives us an Apex that may allow for more time. Can this still just breakout? Yes, it can, but if it doesn’t…
.
BITCOIN:
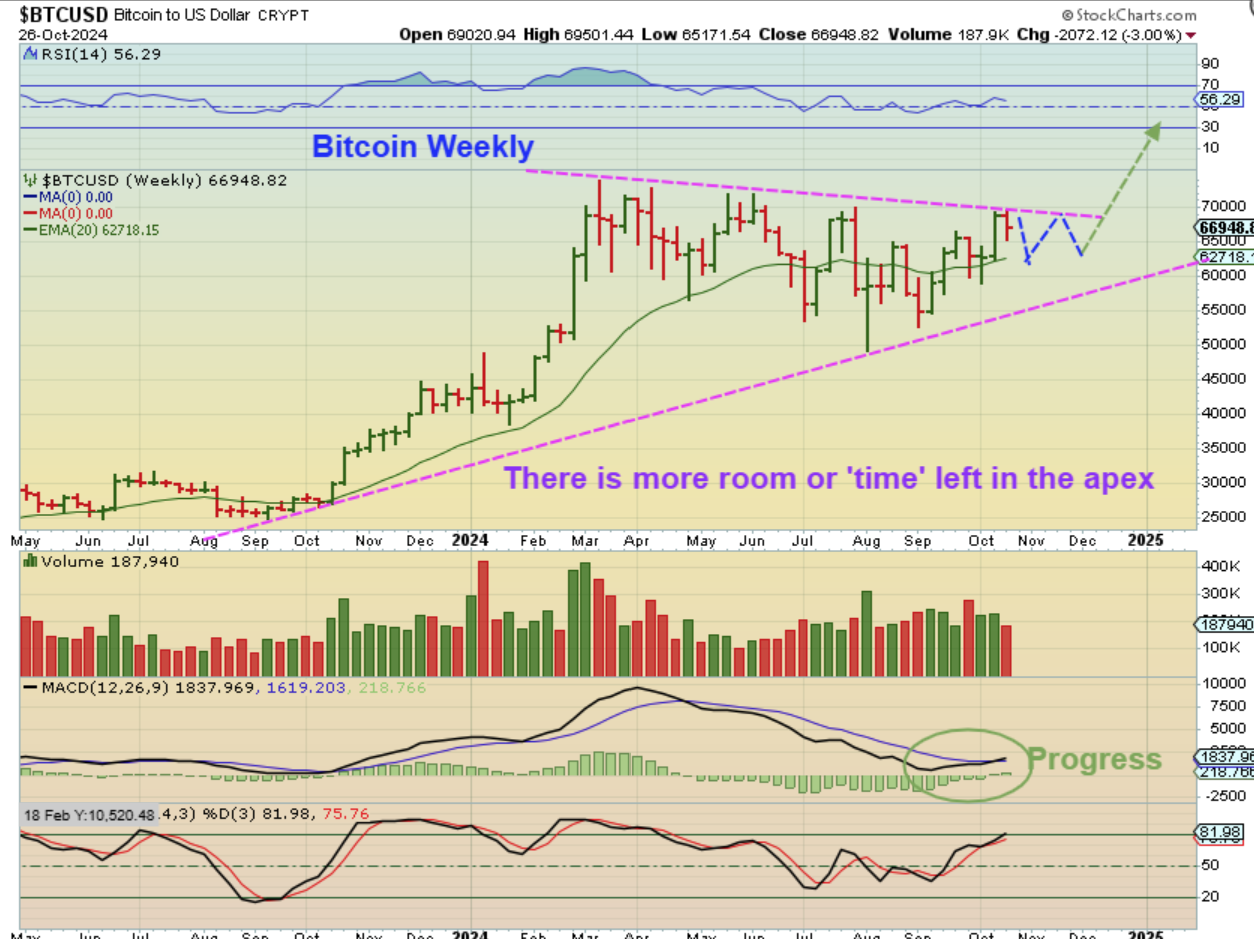
Can this still just breakout? Yes, it can, but if it doesn’t break out, we may just need more time and chop along with higher lows to form the right side of this consolidation.
.
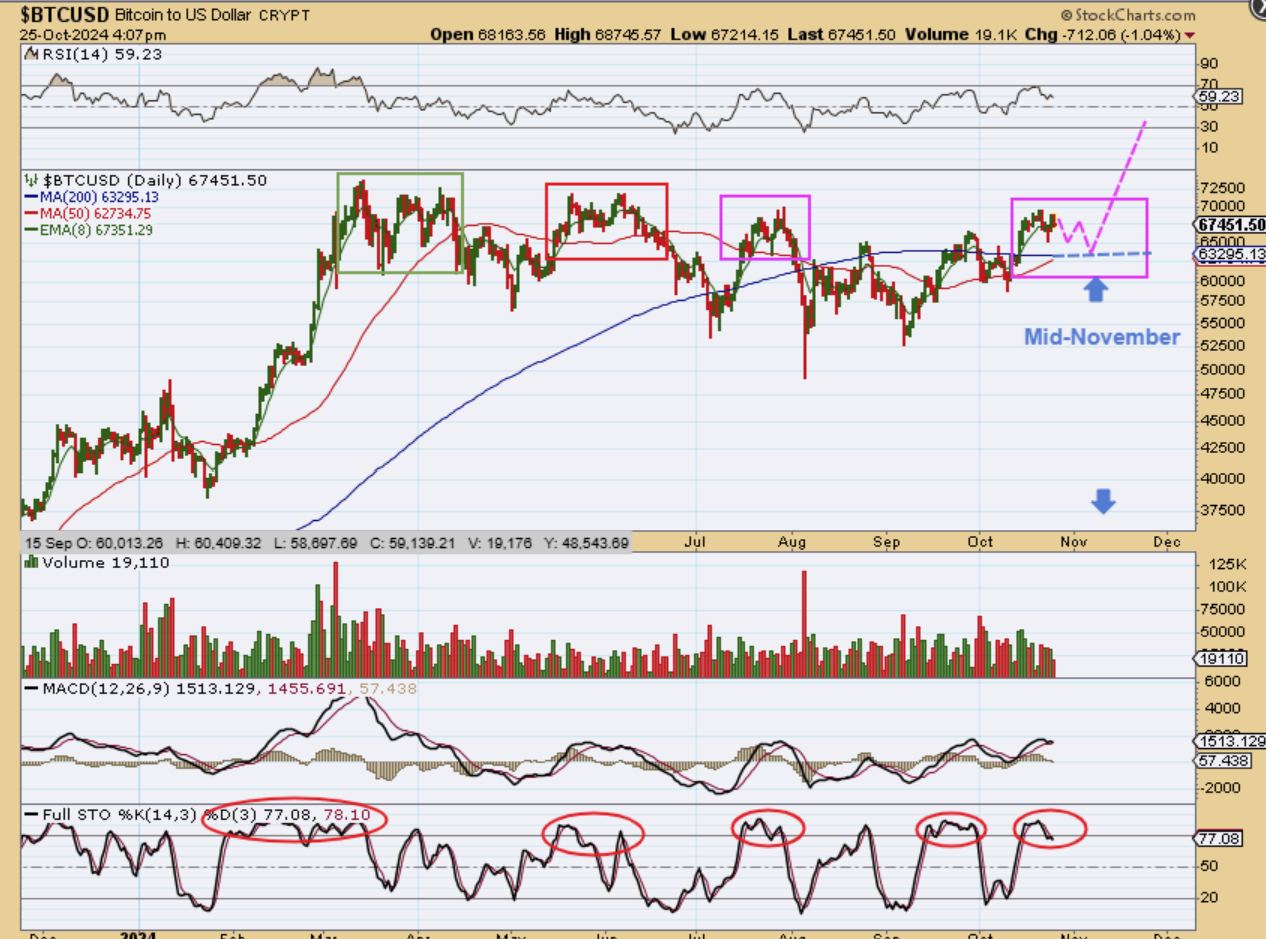
And again, we may not see that breakout come until mid-November or more.
I WANT TO ADD ONE FINAL THOUGHT, AND IT IS A REMINDER: I made this clear when I did this in August.
.
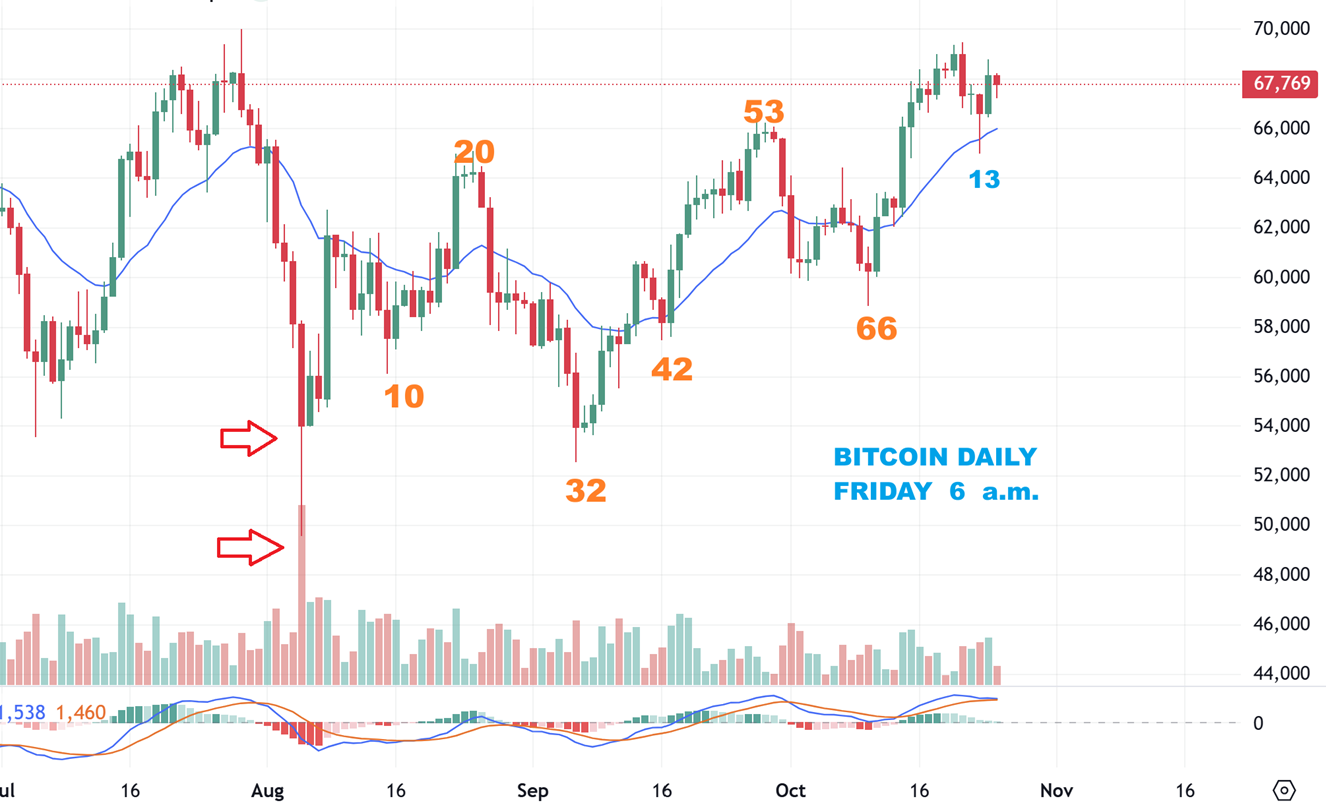
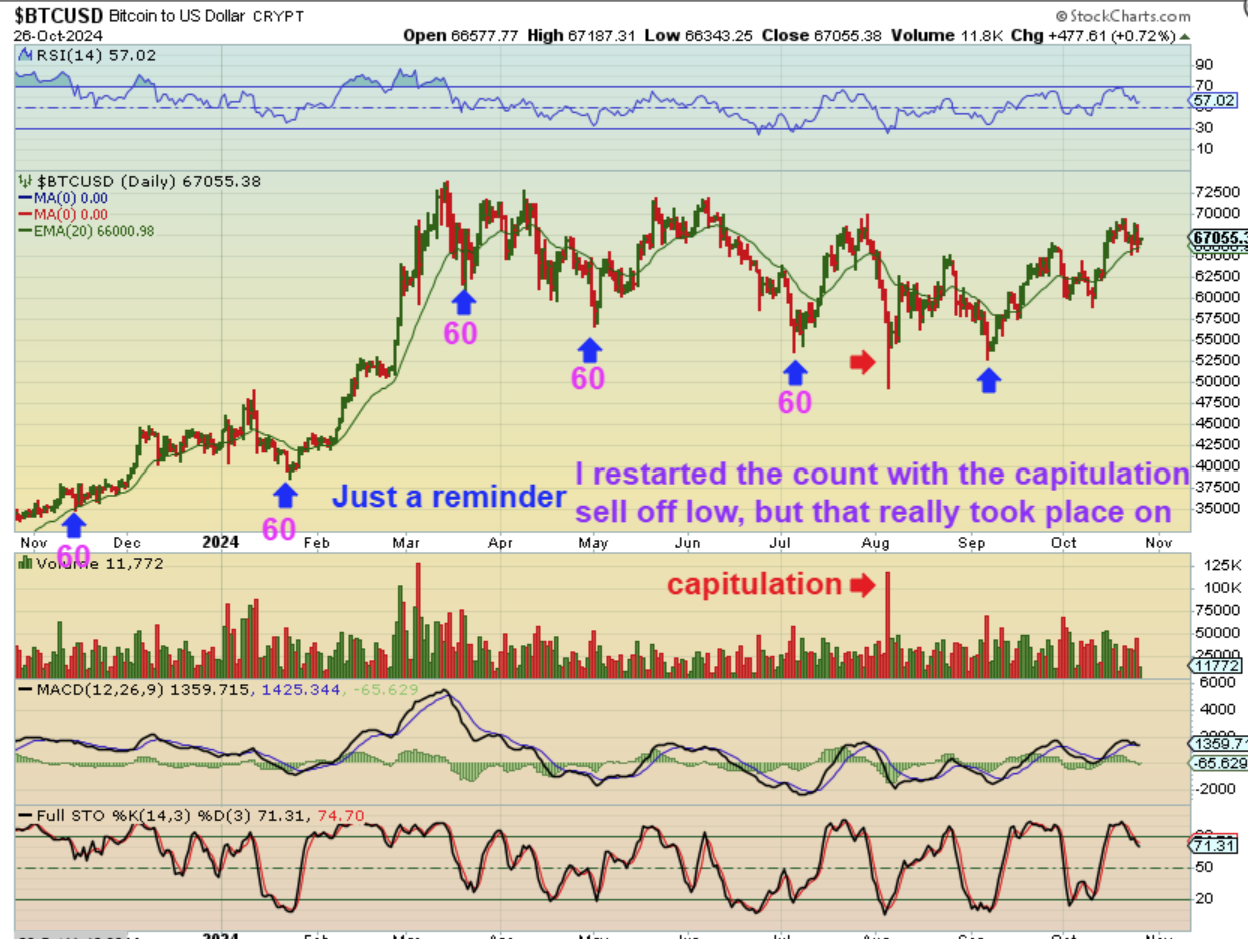
BITCOIN CYCLE COUNT:
1. Do you remember that we originally had that slam down capitulation day near day 30, and this was my cycle count heading into August?
2. On August 1, Silver & GDX seemed to have put in an ICL, and Bitcoin then had this capitulation high volume slam down, so I mentioned that I was going to choose to re-start the count there as an ICL going forward, due to that capitulation and then next low actually came in as a higher low?
3. From that capitulation low, we then do have higher lows and higher highs, so THAT does still seem to be a significant low that I renamed the ICL.
.
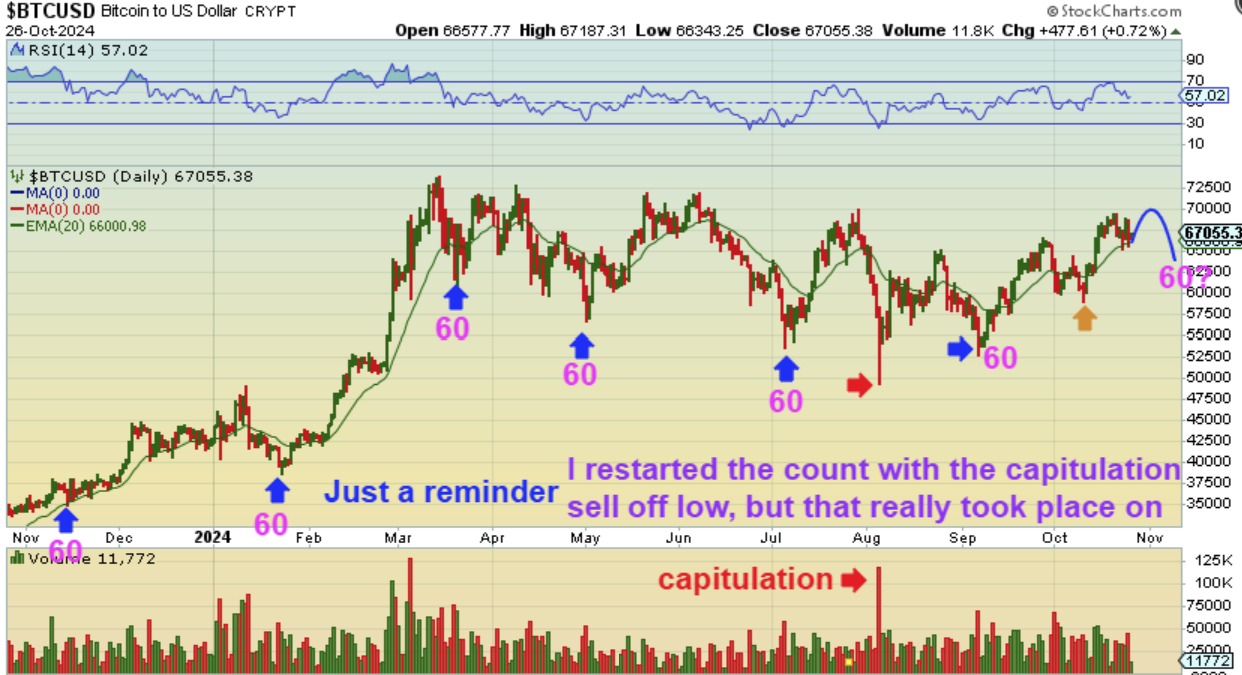
BITCOIN CYCLE COUNT: I am just reminding you of this, because if I did NOT call that capitulation low the ICL and kept it as a day 30ish half cycle low, THIS would be the count we’d be on. We would be coming due for a day 60 drop in a couple of weeks and we’d be on day 40 something.
.
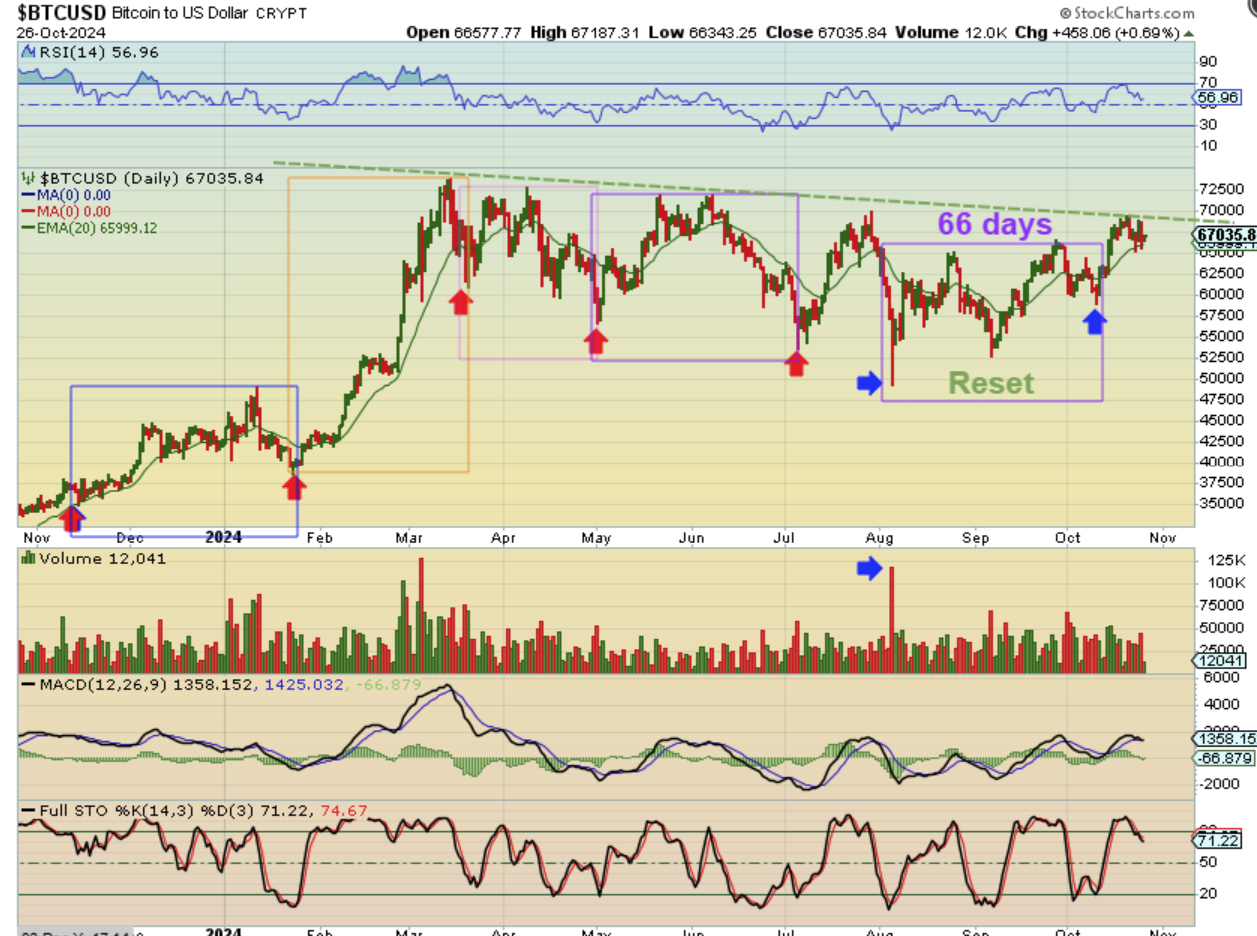
BITCOIN CYCLE COUNT RESET: So I just wanted to remind you of that change, which would now have us on about day 16 or 17 this weekend and a day 30 drop in a couple of weeks. I do not know if it was necessary to change the count, since we basically have dips every 30 days, but at times we do not. That 30 day crash just looked and acted like an ICL to me. Take a look at May-July. That was a 60 day cycle with no real midpoint dip, except for the double top, so that 60 day count is quite obvious, meaning that the crash was also quite obviously near day 30. This reset count doesn’t change a lot while we are up here near the upper trendline, unless we get a very large drop to new lower lows. For now, analysis remains that…
.
For now, analysis remains that we are pushing on the upper trendline, and a breakout should be very bullish, a pullback from here should give us a higher low and that is bullish too. Bitcoins set up is currently quite bullish, even though it may or may not need more time to finally breakout.

