October 19th Weekend Report
We have a Mixed market with the General Markets, and I’d like to see that resolve sooner than later. Let’s take a look at the charts!…
.
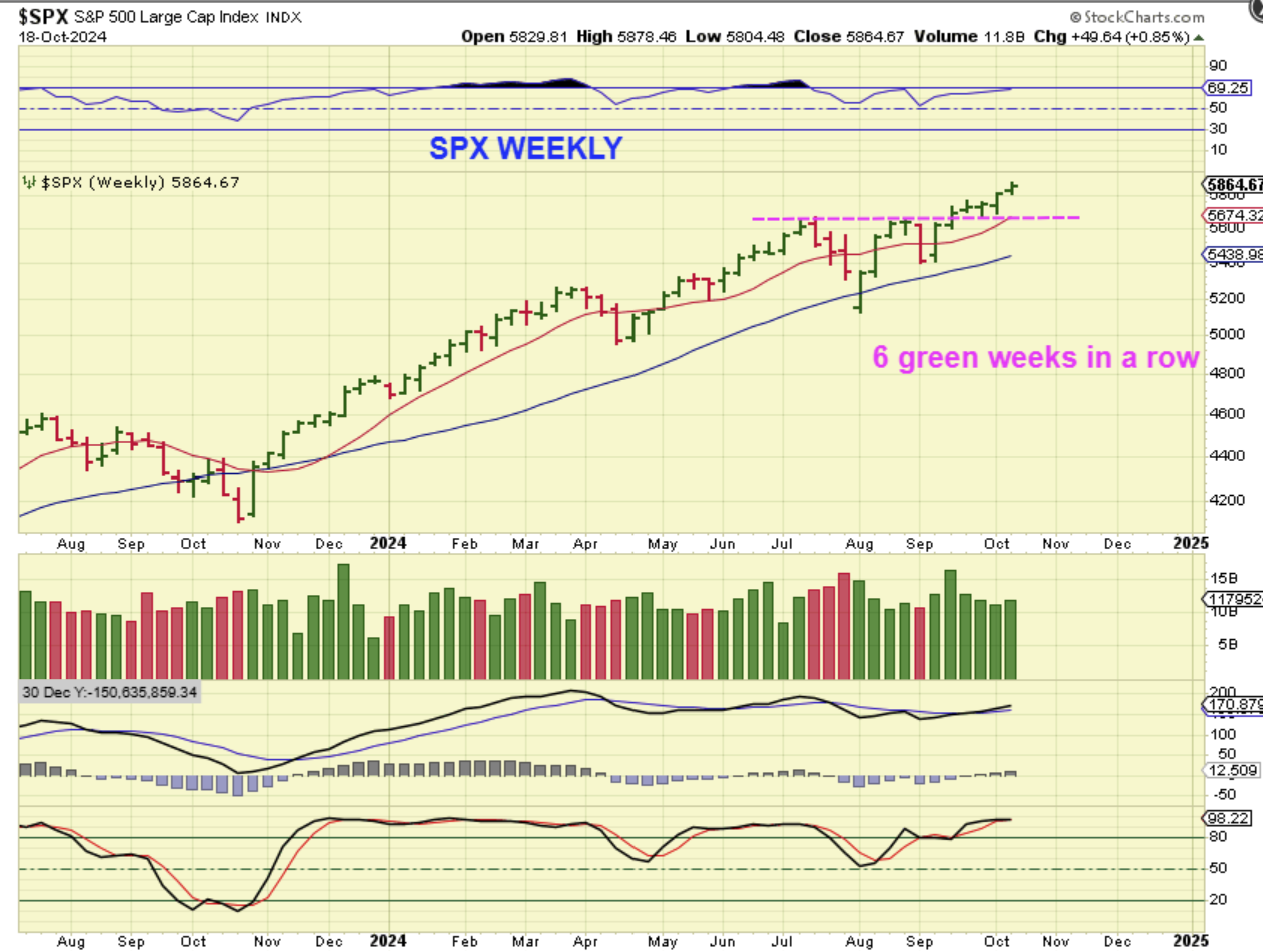
SPX WEEKLY – The General Markets are in the 2nd daily cycle and as you can see, The SPX made new all-time highs again.
.
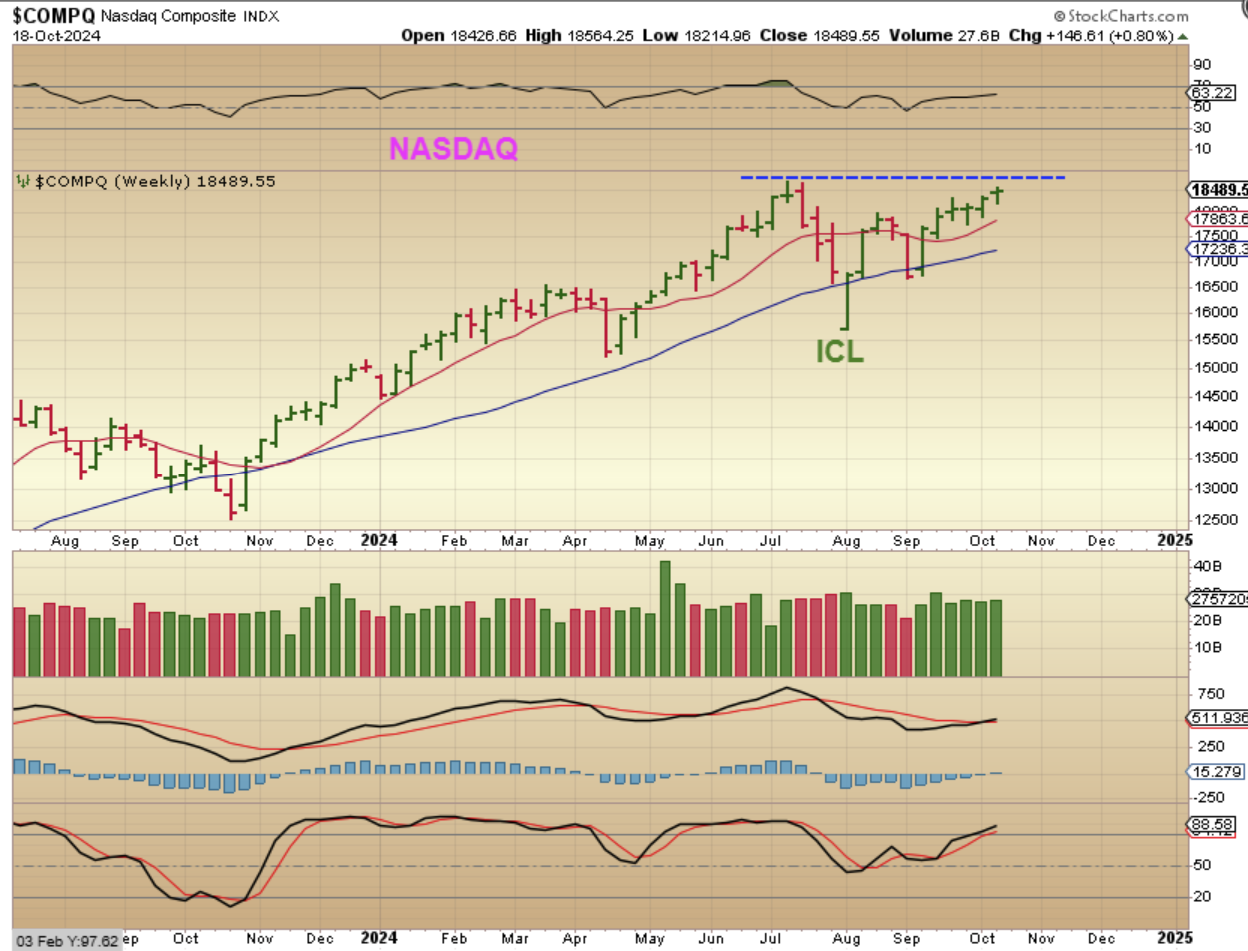
NASDAQ WEEKLY – After the Nasdaq crashed in July & August, it has been climbing back to the all-time highs and is almost there. I like the volume and the MACD, so we’re seeing some good in Tech.
.
.
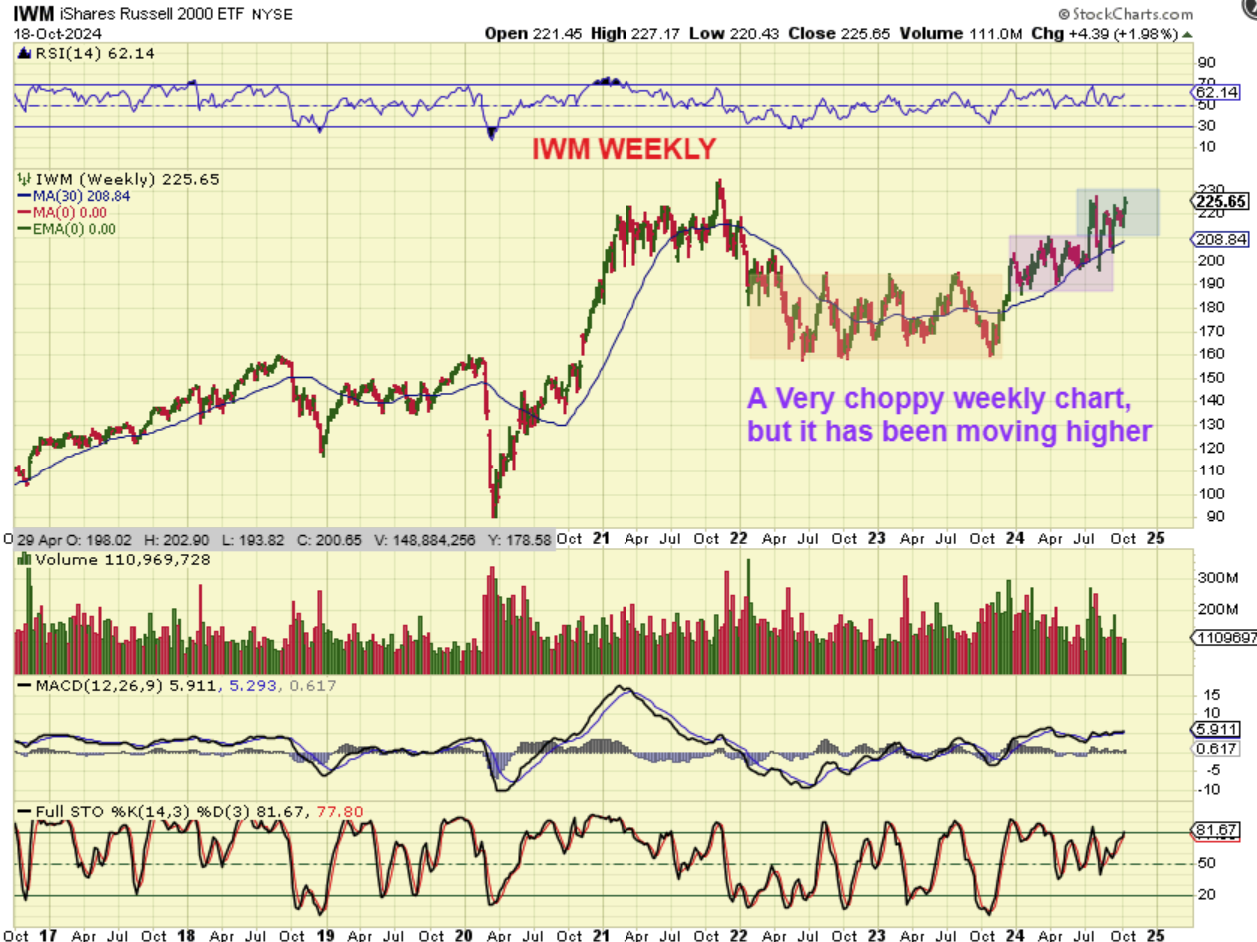
THE IWM WEEKLY has been extremely choppy as it chops higher. It has been a hard sector to buy and hold or trade, and I’ve seen many nice Rallys roll over in this area, but now the IWM put in 5 good weeks, so that remains bullish. Solar stocks rallied and died, for example ( see FSLR, NOVA, CSIQ).
.
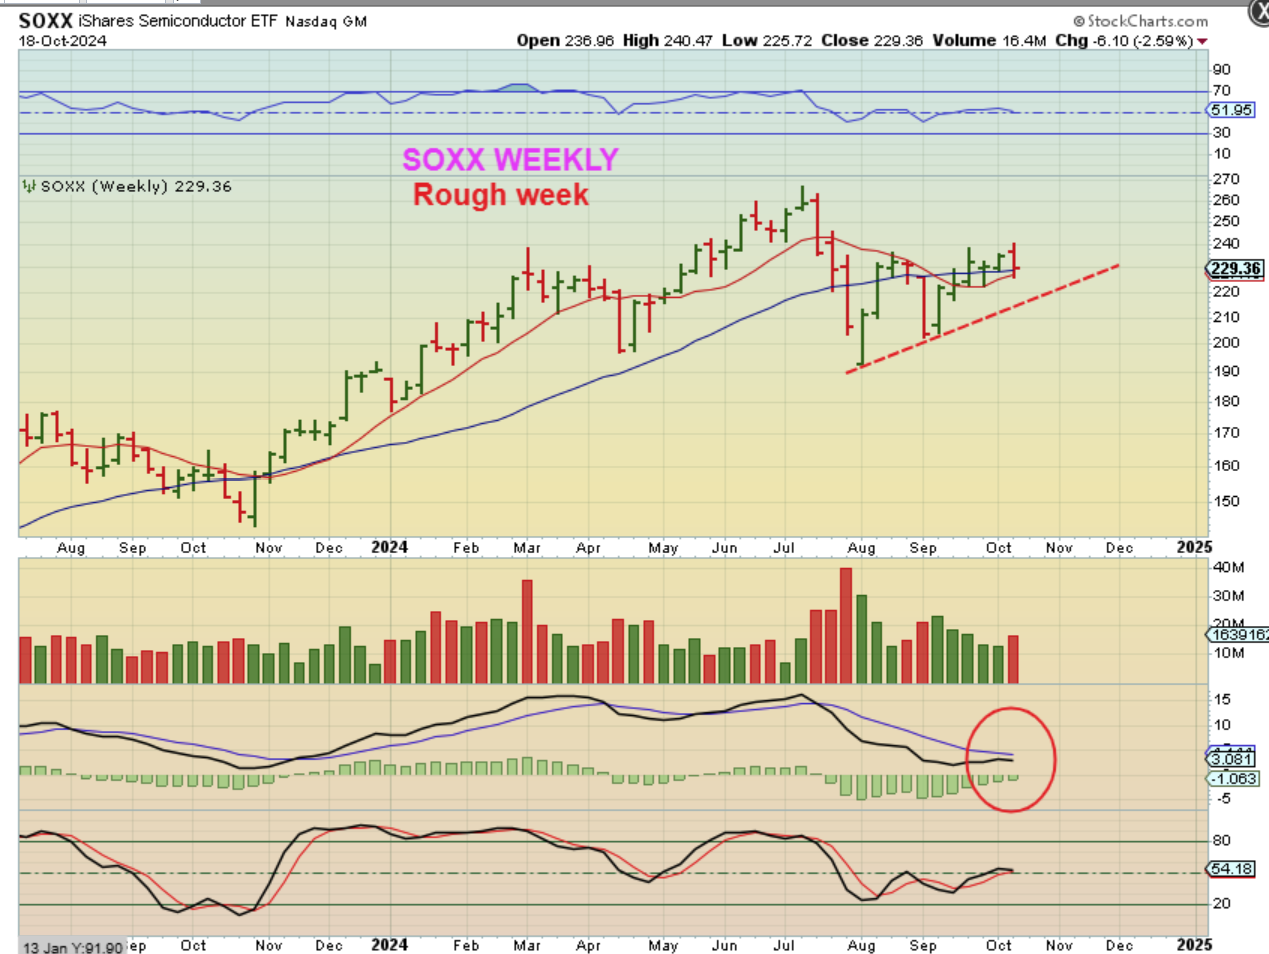
But now we get to the Semiconductors with The SOXX WEEKLY: This was a tough week for the semi’s and it actually popped and dropped down 2.59% for the week. This needs to move higher soon, to harmonize the markets. That is the 10 & 30 week ma, and it is above both, so that is good to see, but the MACD is weak.
.
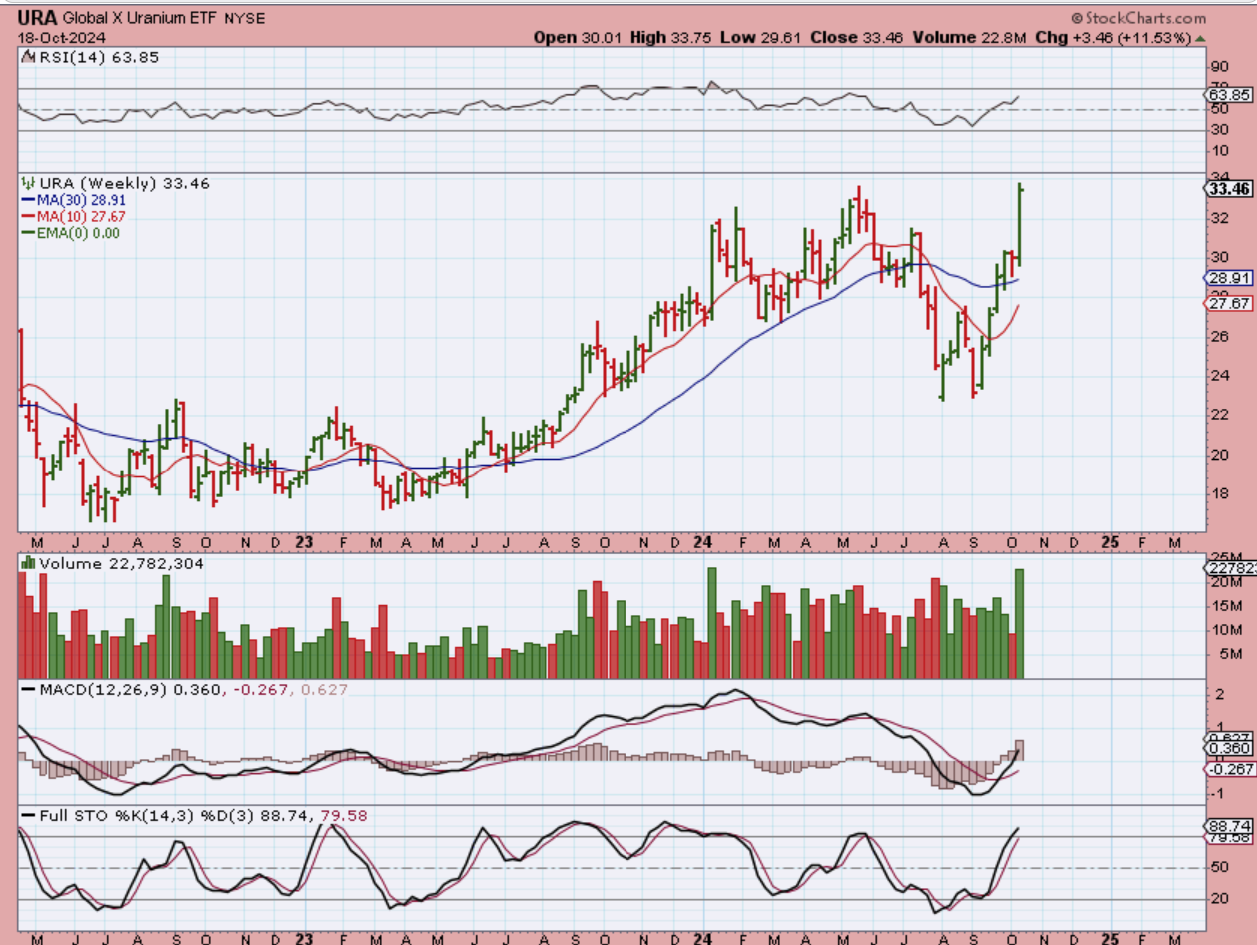
URA WEEKLY – I just wanted to show the Uranium Sector. It had been running higher 2023 into 2024 and then just crashed this summer. After a double bottom, the fuse was lit and all of the Uranium stocks had a great week ( a very nice 6 week run too). If it slows down and chops down to the red line ( 10 week ma) and reverses there, that’ll be a buy the dip set up. We DID have a large up week like this in the first week of 2024 (see the chart) and then it calmed down, but this one was a nice 5-6 week rally.
.
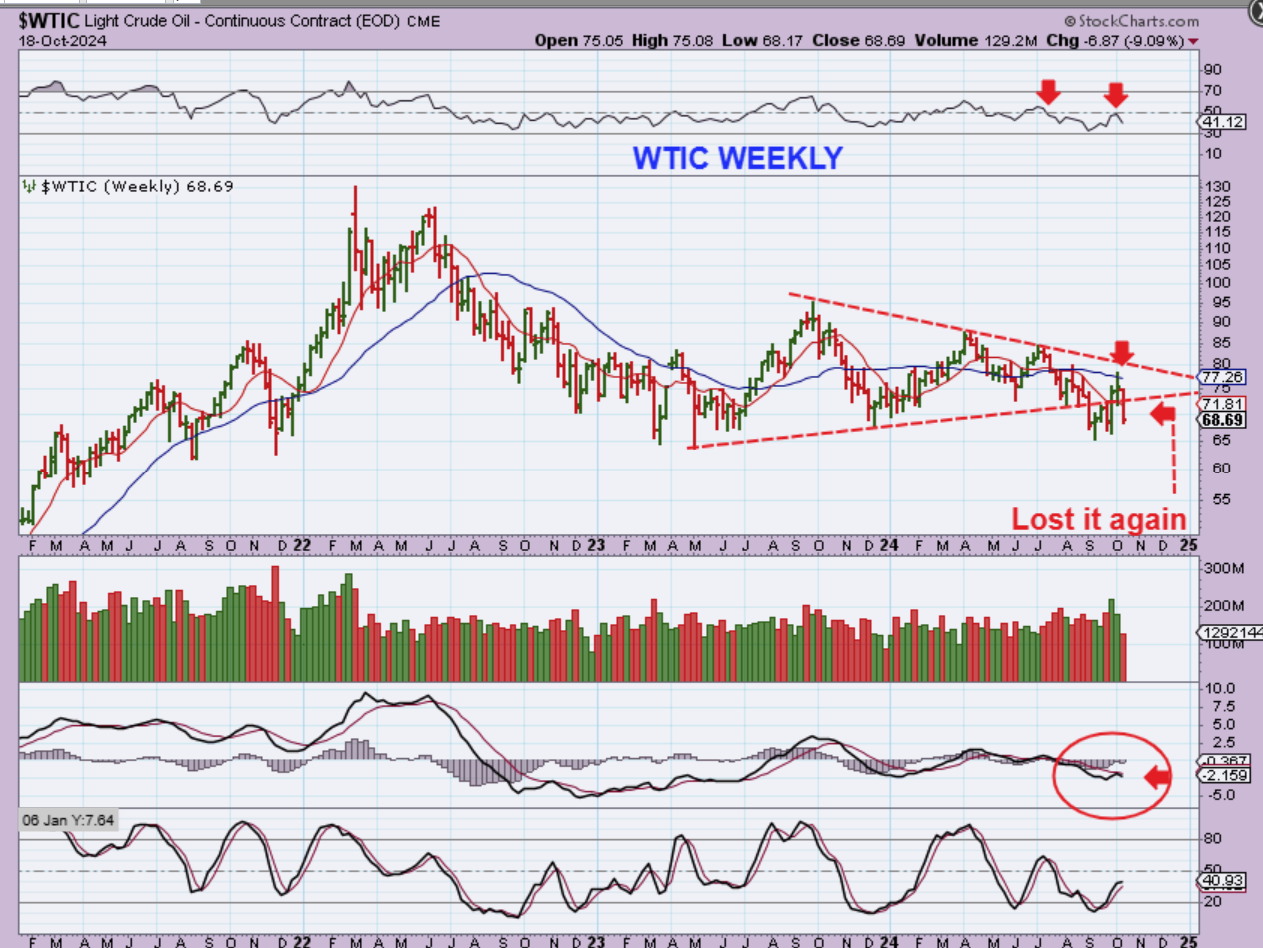
WTIC WEEKLY -Oil is extremely difficult right now.
1. Notice that it was very choppy and formed a triangle that I was watching.
2. We lost that triangle, rallied back to the 30 week ma (blue line) or the 200sma on a daily chart, and that looked like a shake out.
3. Next it was rejected again and has closed at the lows of the week , back below that triangle. I have said that I am not trading Oil right now, but some Oil stocks looked to be holding up.
.
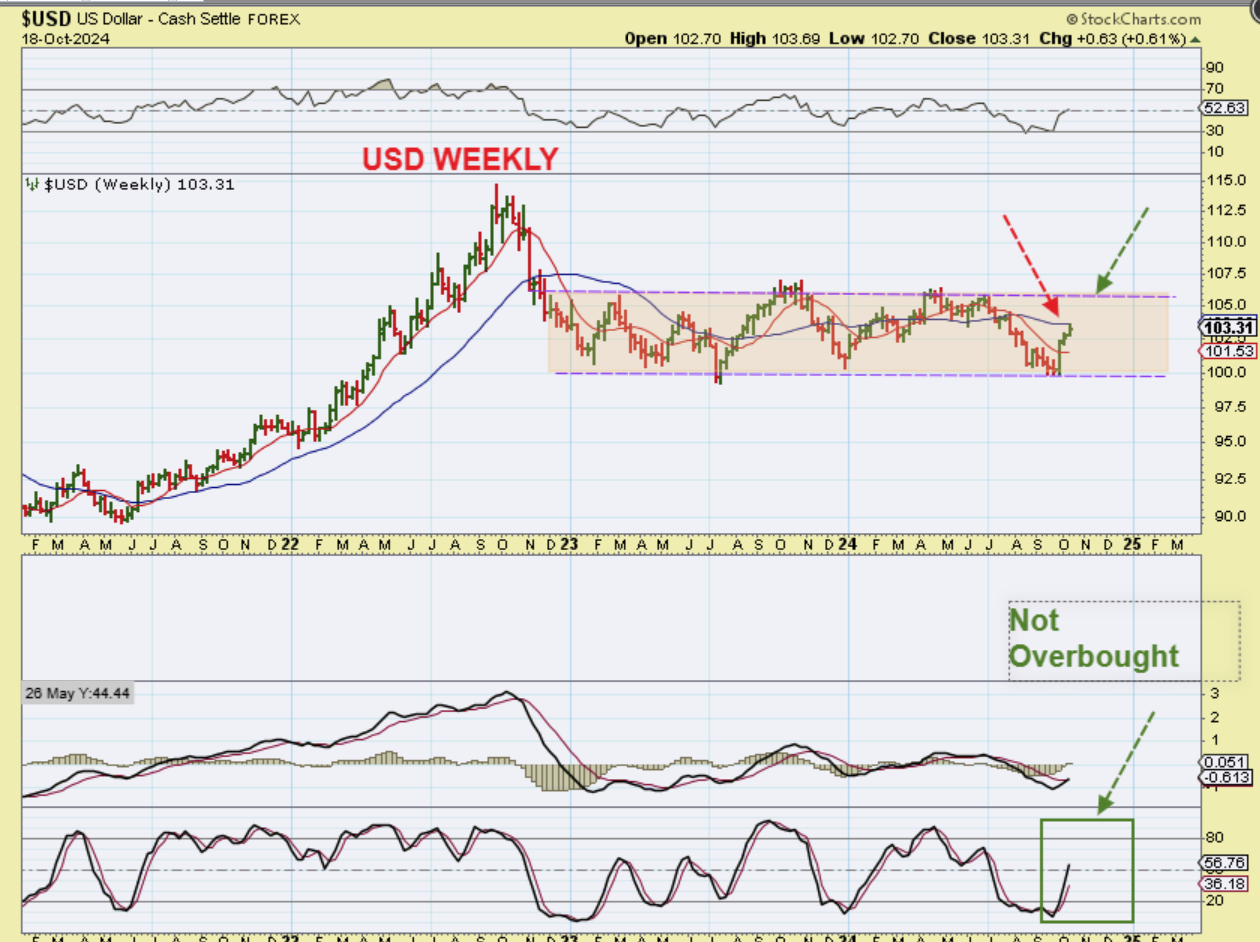
USD WEEKLY #1 – In the daily reports we watched the USD go straight up day after day to the 200sma. This is the weekly chart and it ran to the 30 week ma and backed off a bit. As the USD backed off on Friday, Gold and Silver shot up. THAT COULD CONTINUE NEXT WEEK AS THE USD DROPS INTO A DCL and Gold and Silver are somewhat early in their daily cycles…
.
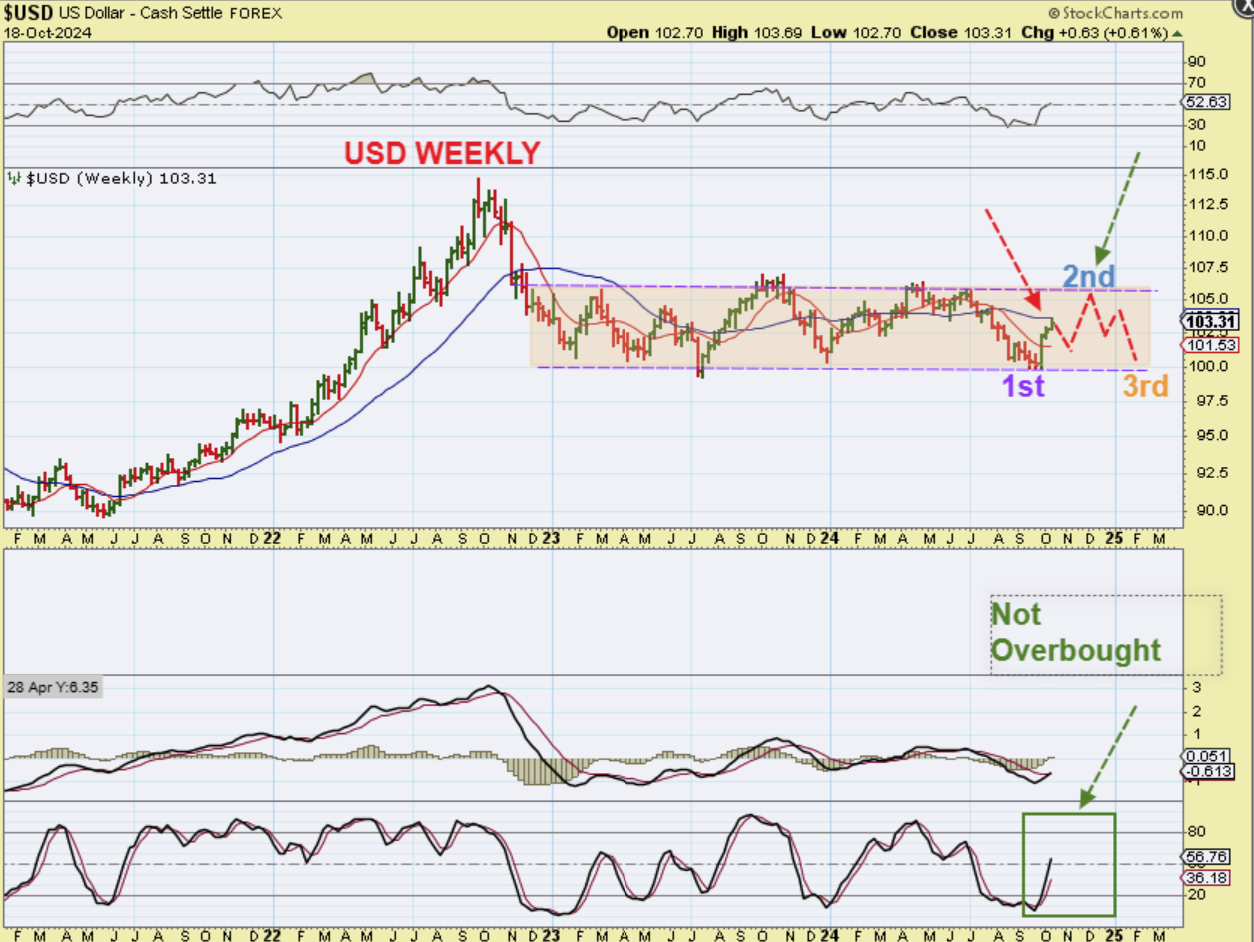
USD WEEKLY #2 – The USD is not overbought, so coming out of an ICL, we would expect a 2nd daily cycle to run even higher. We may see what I drew here and that could send Gold into the ICL. An ICL in Gold would become the next good buying opportunity.
.
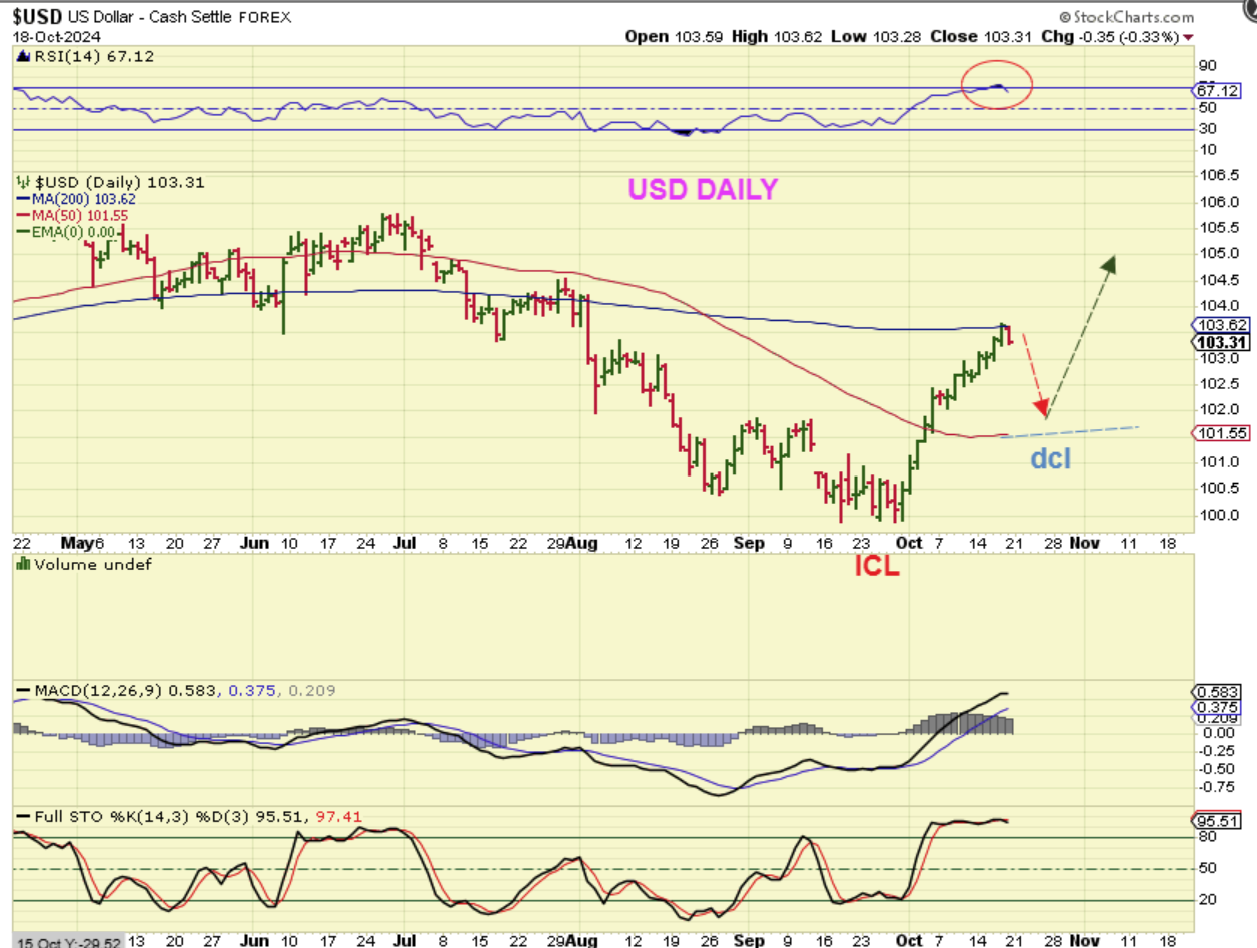
USD DAILY – So I am thinking that we could see this next week and that could push Gold, Silver, and the Miners a bit higher too. FRIDAY WAS DAY 6 FOR GOLD.
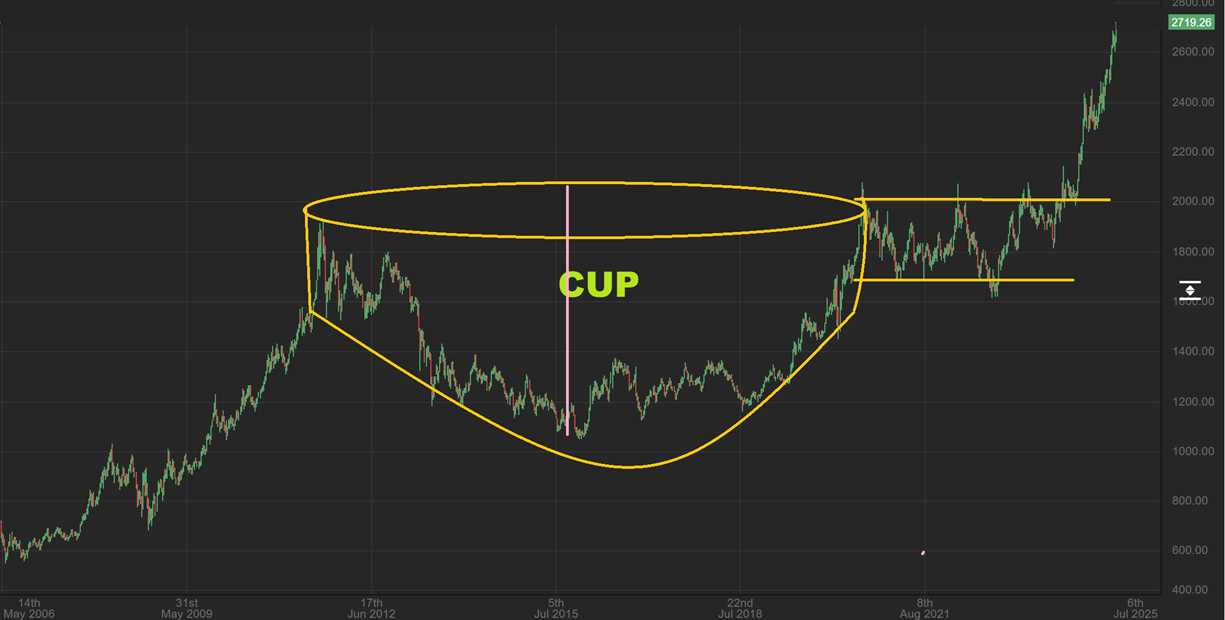
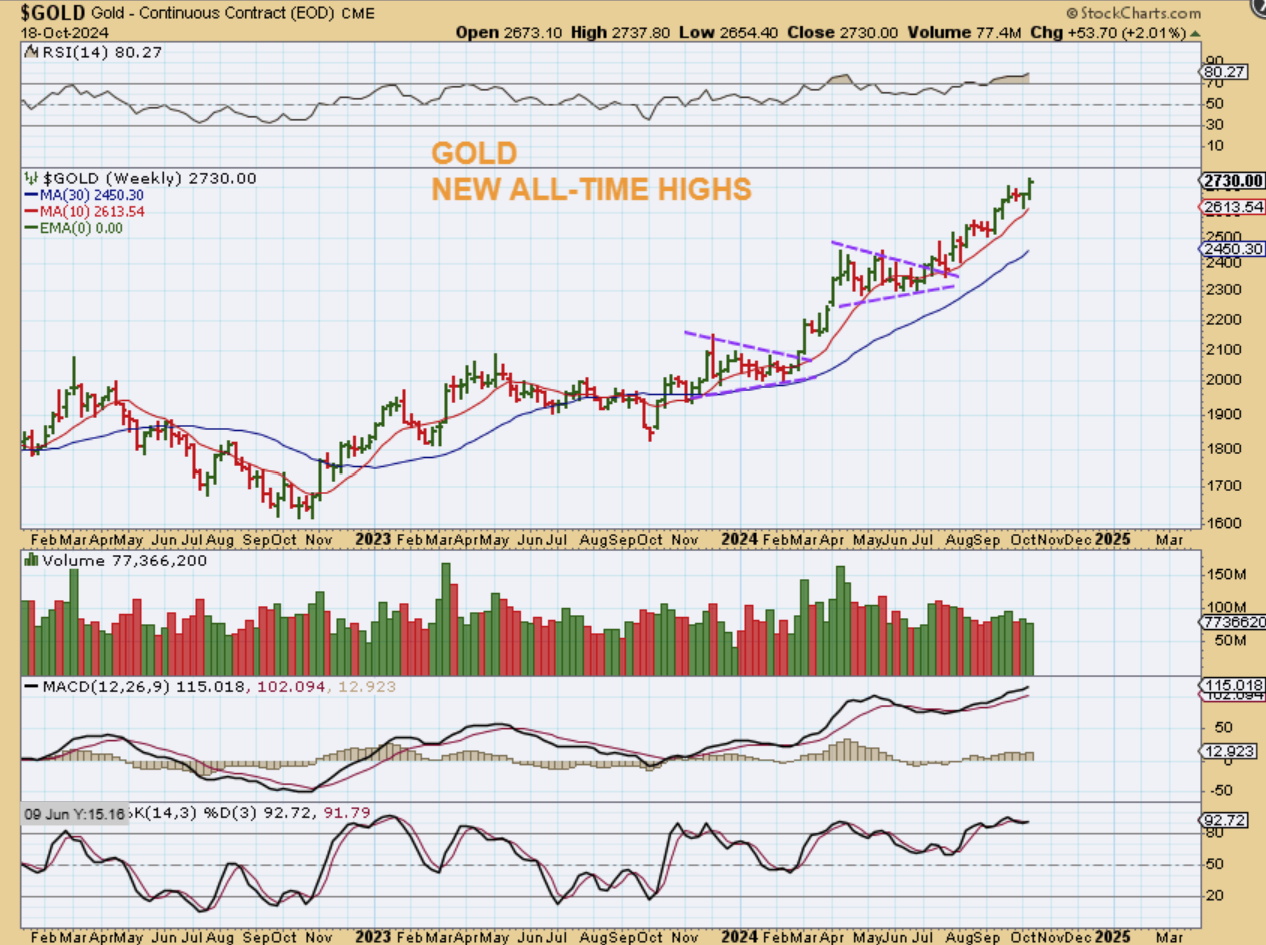
Let’s just admire The GOLD WEEKLY Cup & Handle for a moment. This has been a beautiful run since it broke out in Nov 2023, back tested that break out, and rallied through 2024. Close up it looks a bit less than straight up, so let’s take a look.
.
GOLD WEEKLY – You can see that ICL in October 2023 and then Gold has had much milder (Choppier) ICLs since then. Each ICL formed in a triangle and Gold then began to hug the 10 week ma on the way higher. That is what Bull Markets do. Gold made new all-time highs again this week as the USD pulled back from the 200sma.
.
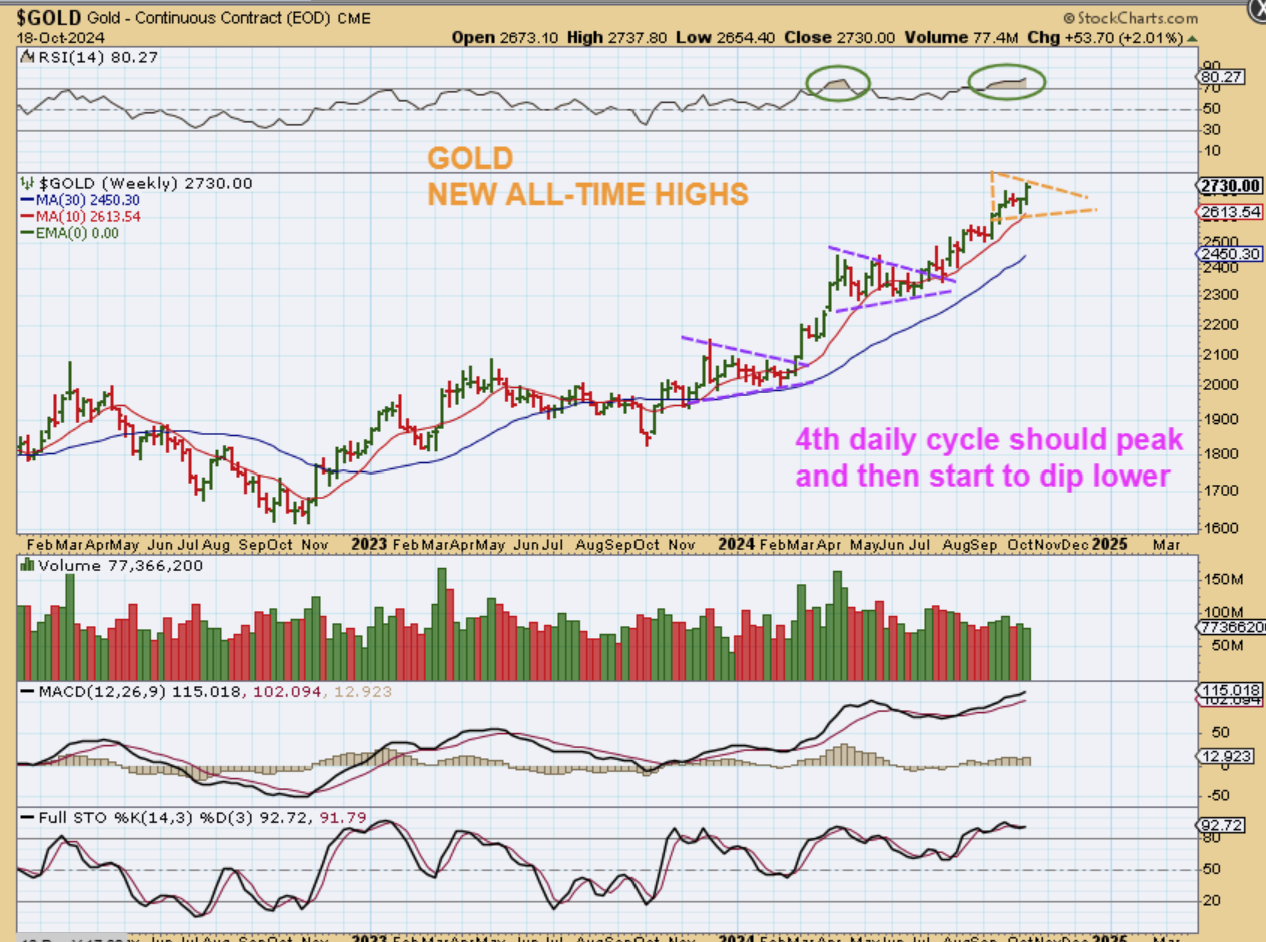
GOLD WEEKLY – I drew this as the next possible dip into a DCL/ICL, but Gold was only on day 6 Friday, so it can push even higher, especially if the USD drops as shown above. It is a weekly chart with Gold on day 6, so I should have drawn it with one more push higher and then the triangle forms.
.
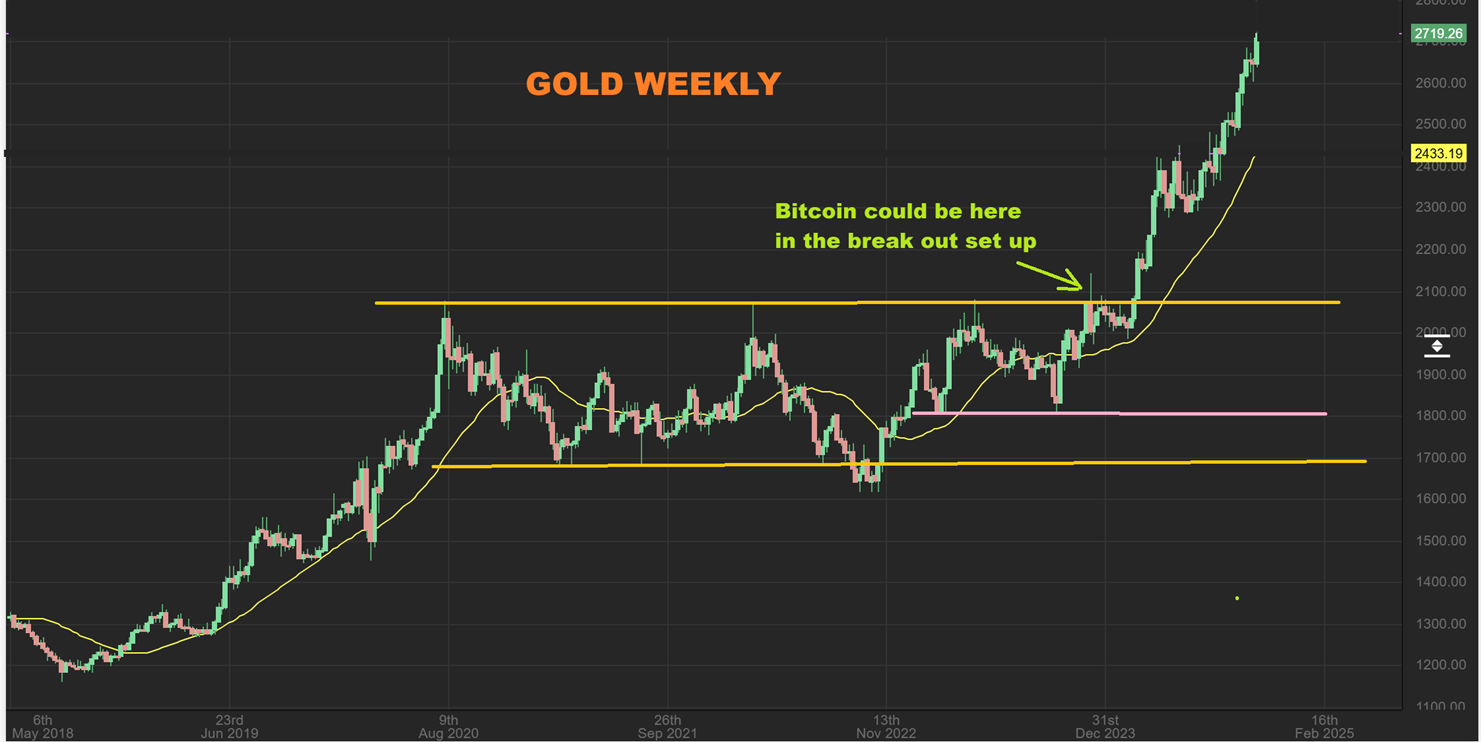
GOLD WEEKLY – I wanted to show this break out, since Bitcoin is at the upper trend line now too. I am showing that Gold broke out 1 week and then dropped back inside, gradually falling back to the 10 week ma (False breakout). It happens, so I just wanted to post that as a reminder.
.
It’s funny that I said this about Silver on Friday (Silver may be waiting for the USD to drop before it can pop).
.
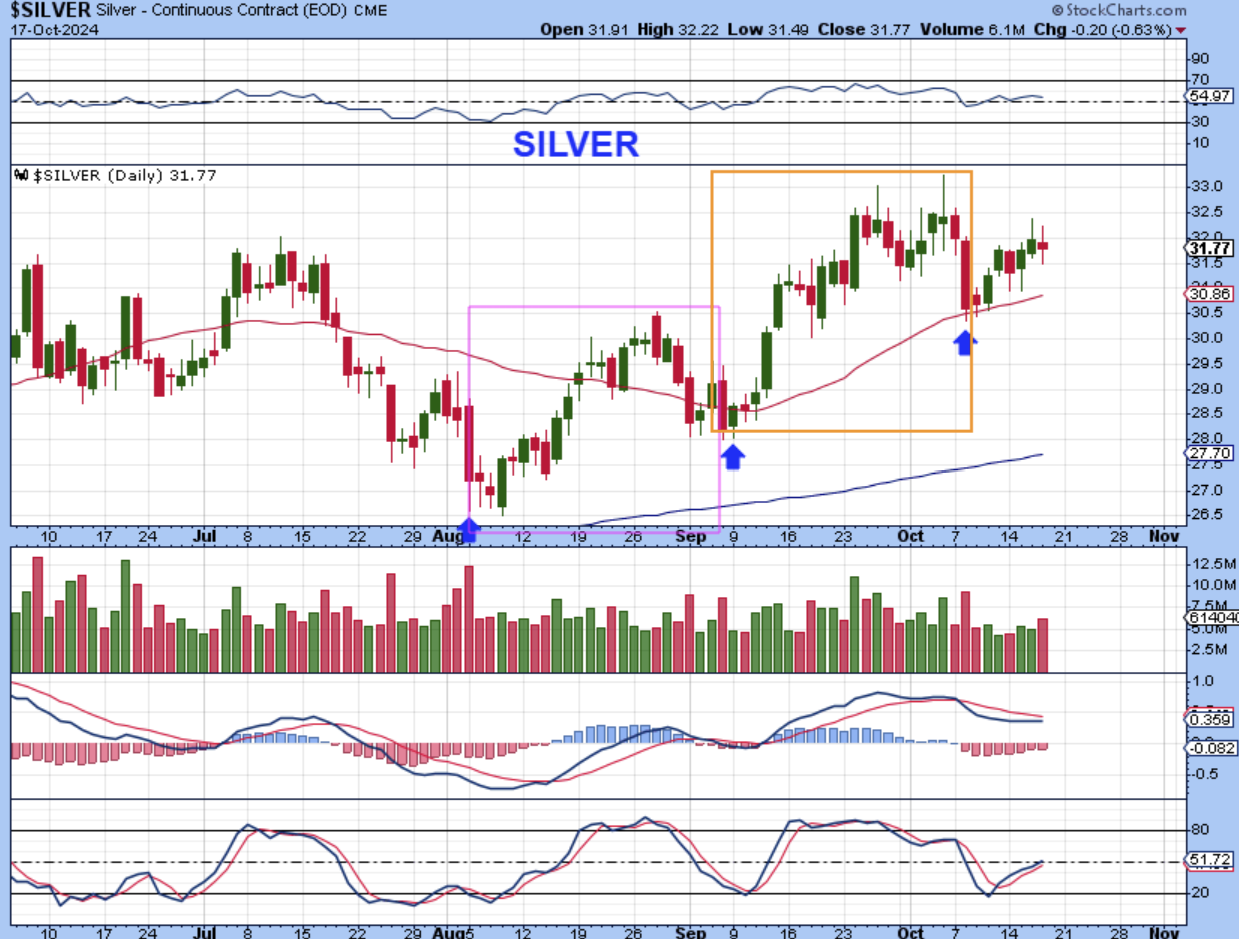
SILVER – Oddly, Silver is struggling a bit here. It put in an ICL in August, so I would have expected more strength with Silver coming out of this dcl, but it may need the USD to roll over before it can really pop.
.
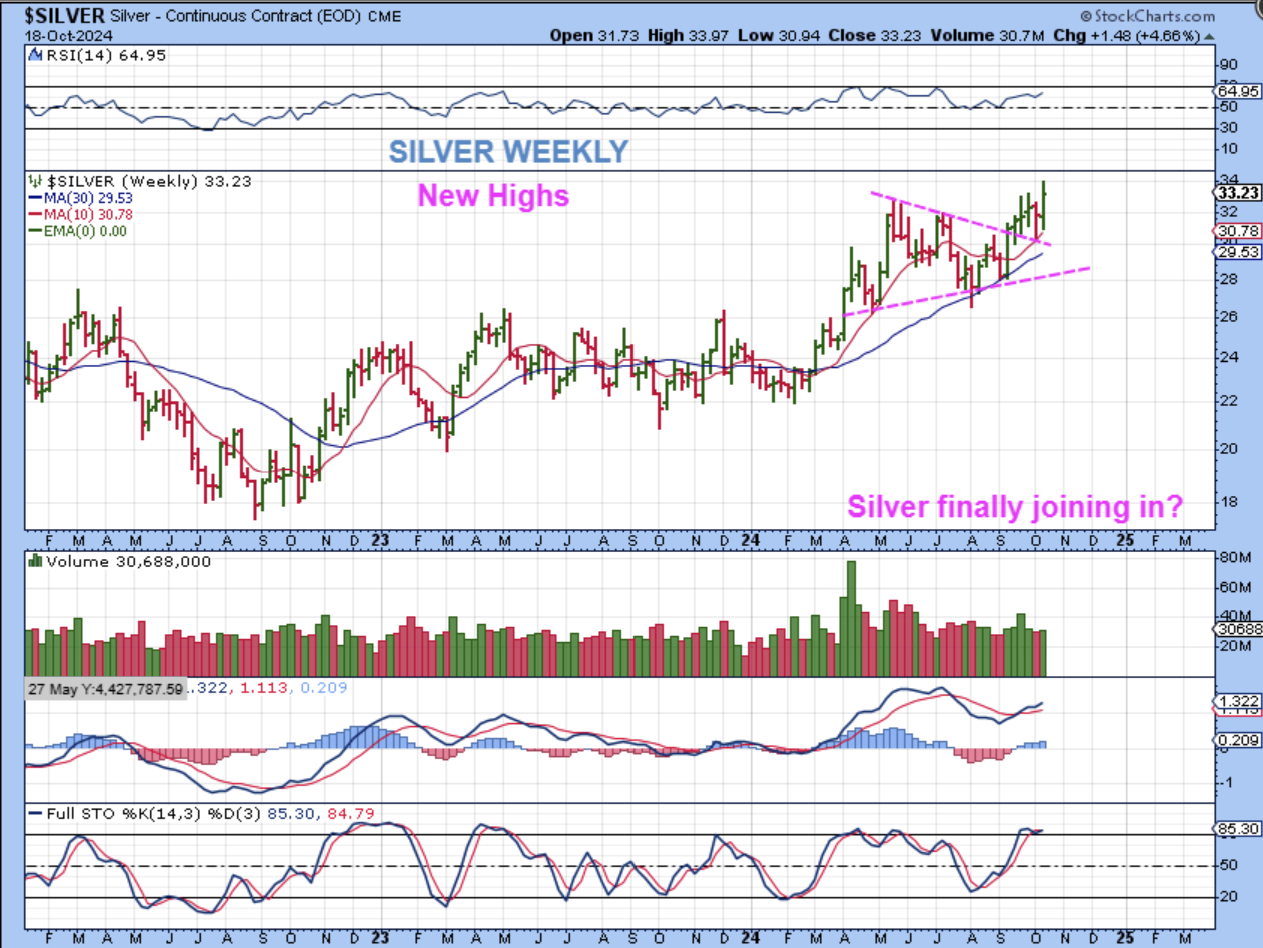
SILVER WEEKLY – The USD started to roll over and we finally got our Silver pop. Silver was up almost 5% for the week and broke to new highs! Silver stocks applauded the move and rewarded those holding them at the last dcl or ICL. Many were up about 10% or even much more. AG was up 15% , for example.
.
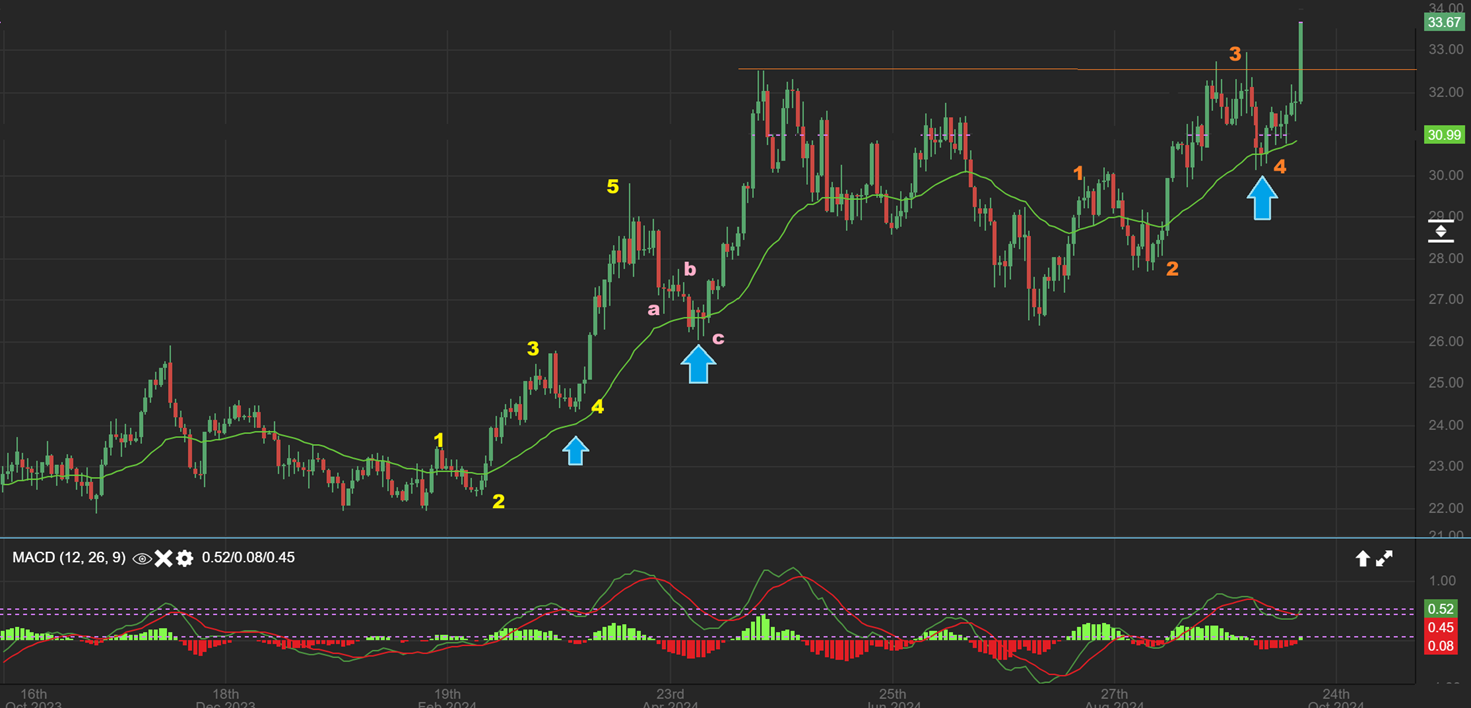
SILVER DAILY – Look at that move by Silver on Friday and you can see that THIS is where most of that 5% gain for the week came from. I see a possible 5 wave move unfolding and compared it to the run from last Feb to May. Silver can continue to run next week and Silver Miners looked excellent (HL, EXK, FSM, AG, SSRM, PAAS, USAS, etc.).
.
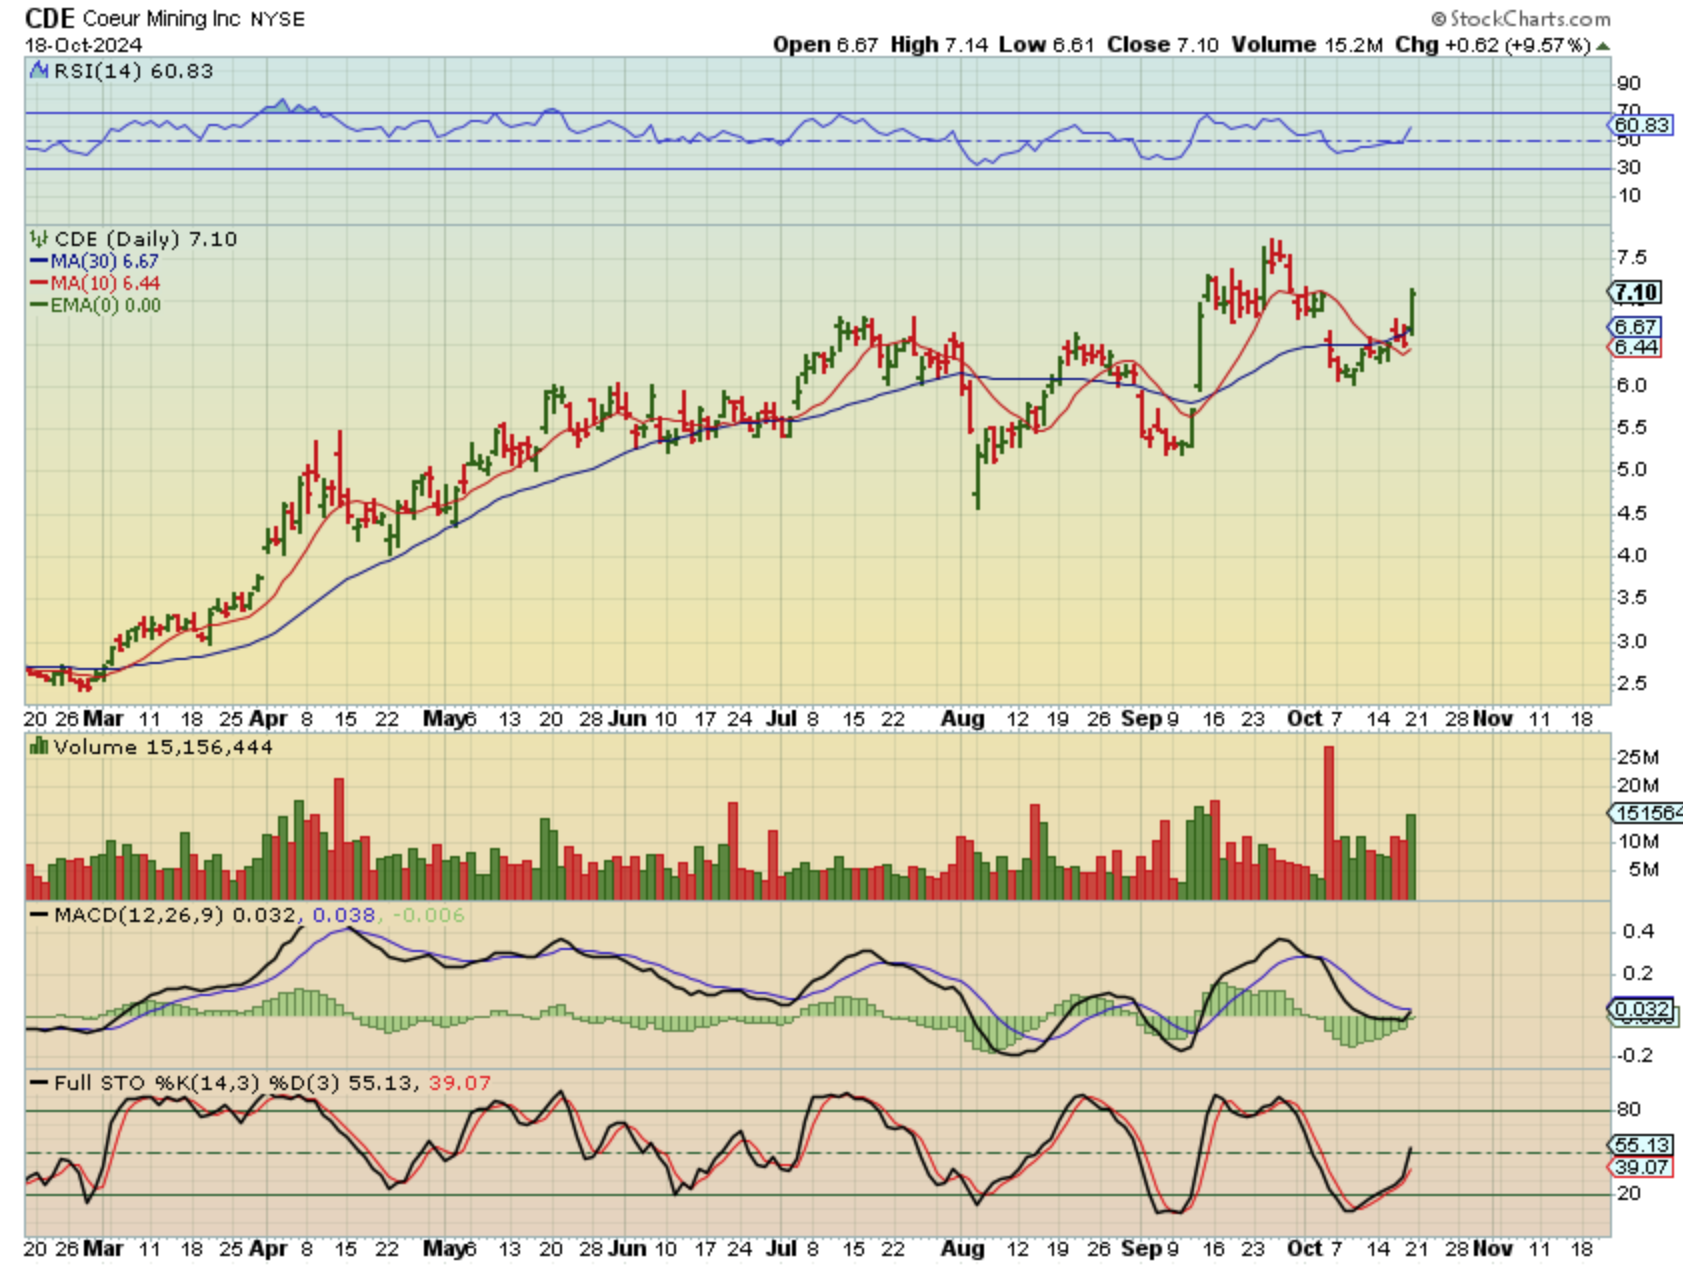
SILVER DAILY – I know that its hard to buy or ‘add’ to current positions when they’re up 10%, but if they dip on Monday you could ‘add’, and even FSM, CDE, and a couple of others aren’t at new highs. They may be lagging just a bit and you could add.
.
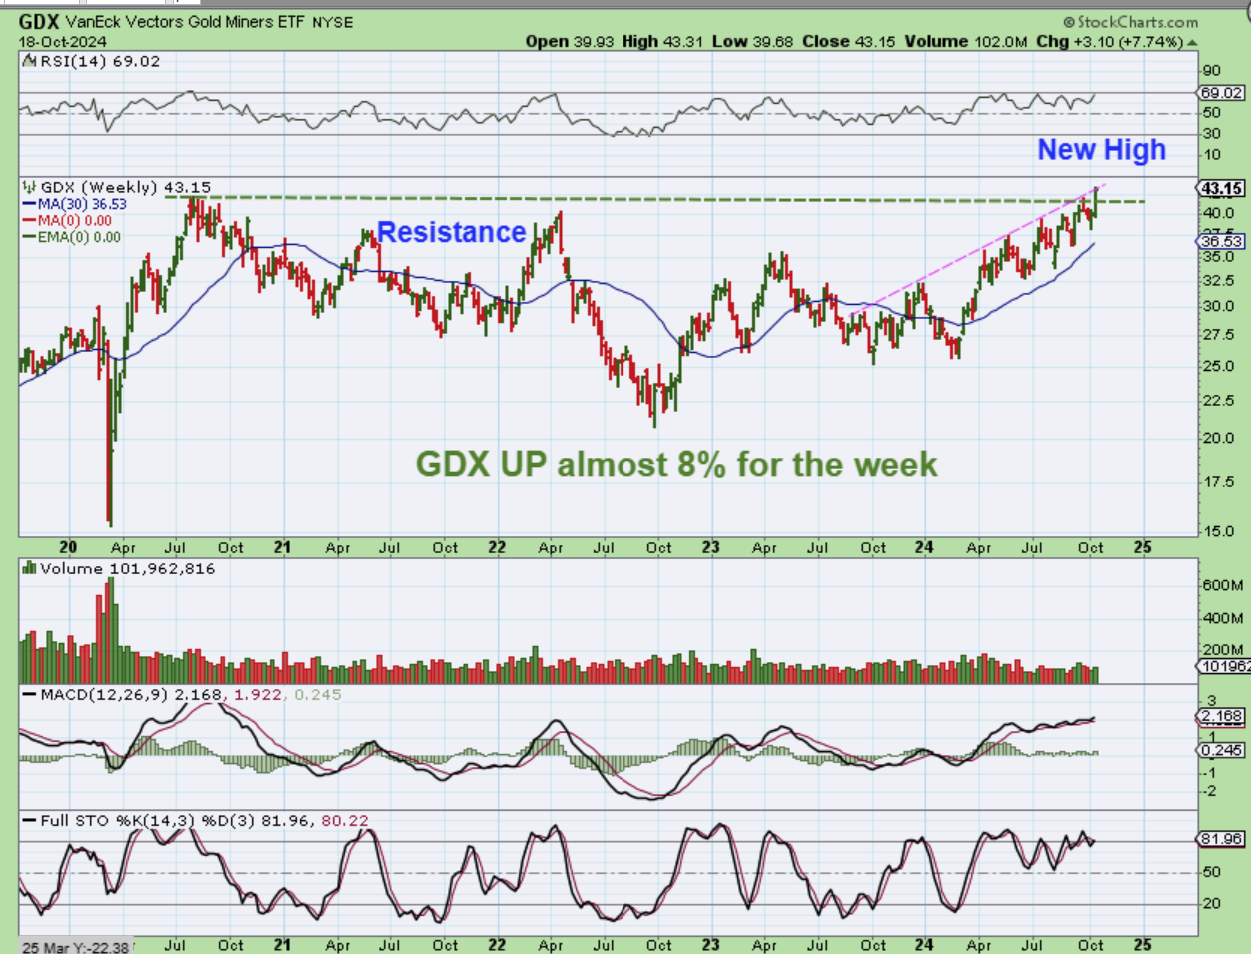
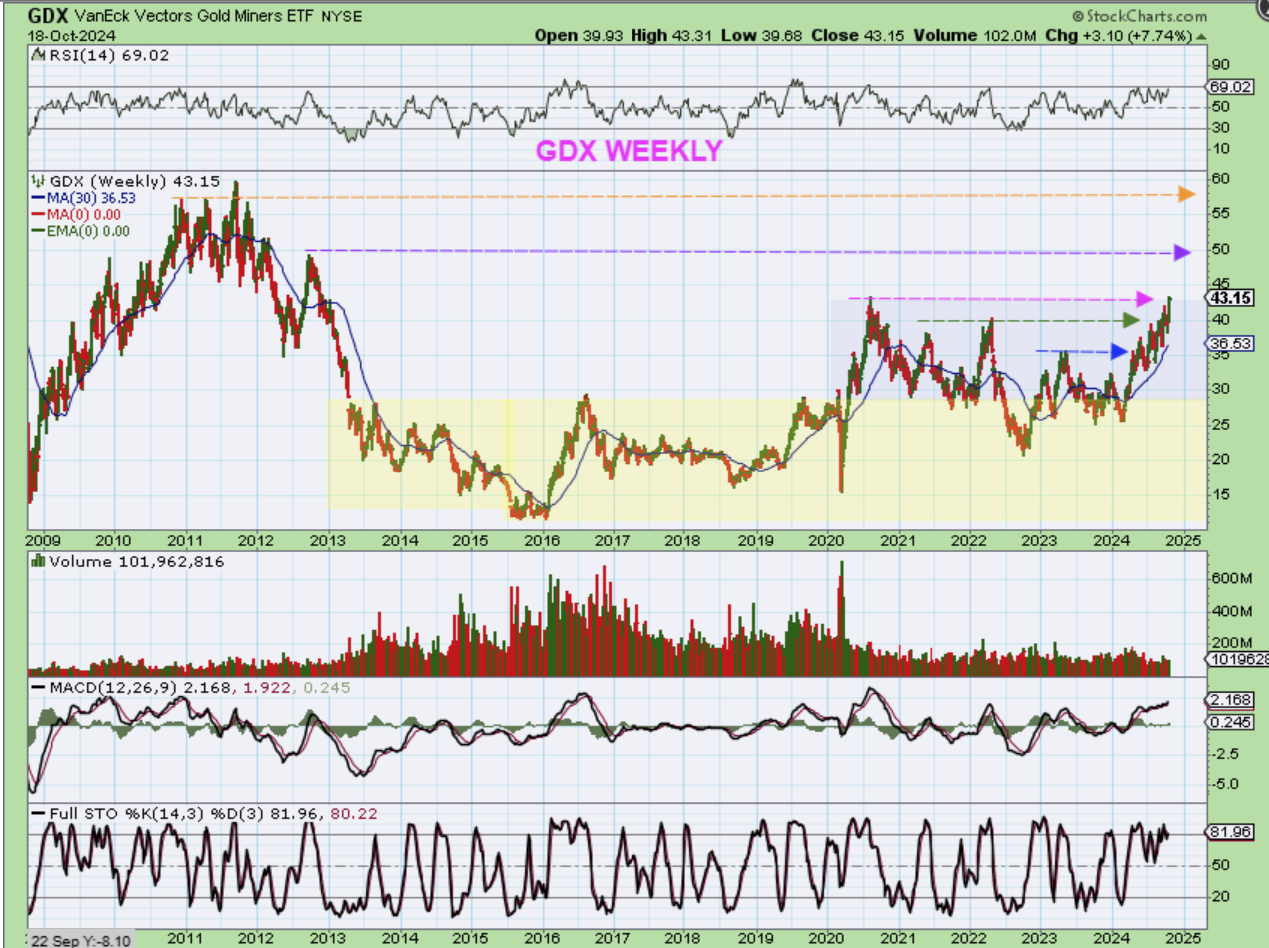
GDX WEEKLY – GDX was up 7% and it finally broke to new highs, above those 2020 highs. Yay! It has been very choppy, but the chart does show a lot of resistance to the left side, so that might be what has added to the chop (sellers).
.
GDX WEEKLY – There looks to be less resistance from $40 to about $50, but then it may get choppy again.
.
It was a bullish week across the board, with the exception of the SOXX and OIL. Bitcoin was also rising up higher, and I wonder if it will be able to breakout too, if the USD pulls back? I’ll discuss Bitcoin below, have a great weekend everyone!
.
~ALEX
.
We’ve been following Bitcoin Very Closely: This was in Fridays report…
.
Yesterday at 11:30 am, using this chart, I pointed out that price reaching near $70,000 would give us a breakout of the downtrend line. So far $68,388 has been the highs for this run.
.
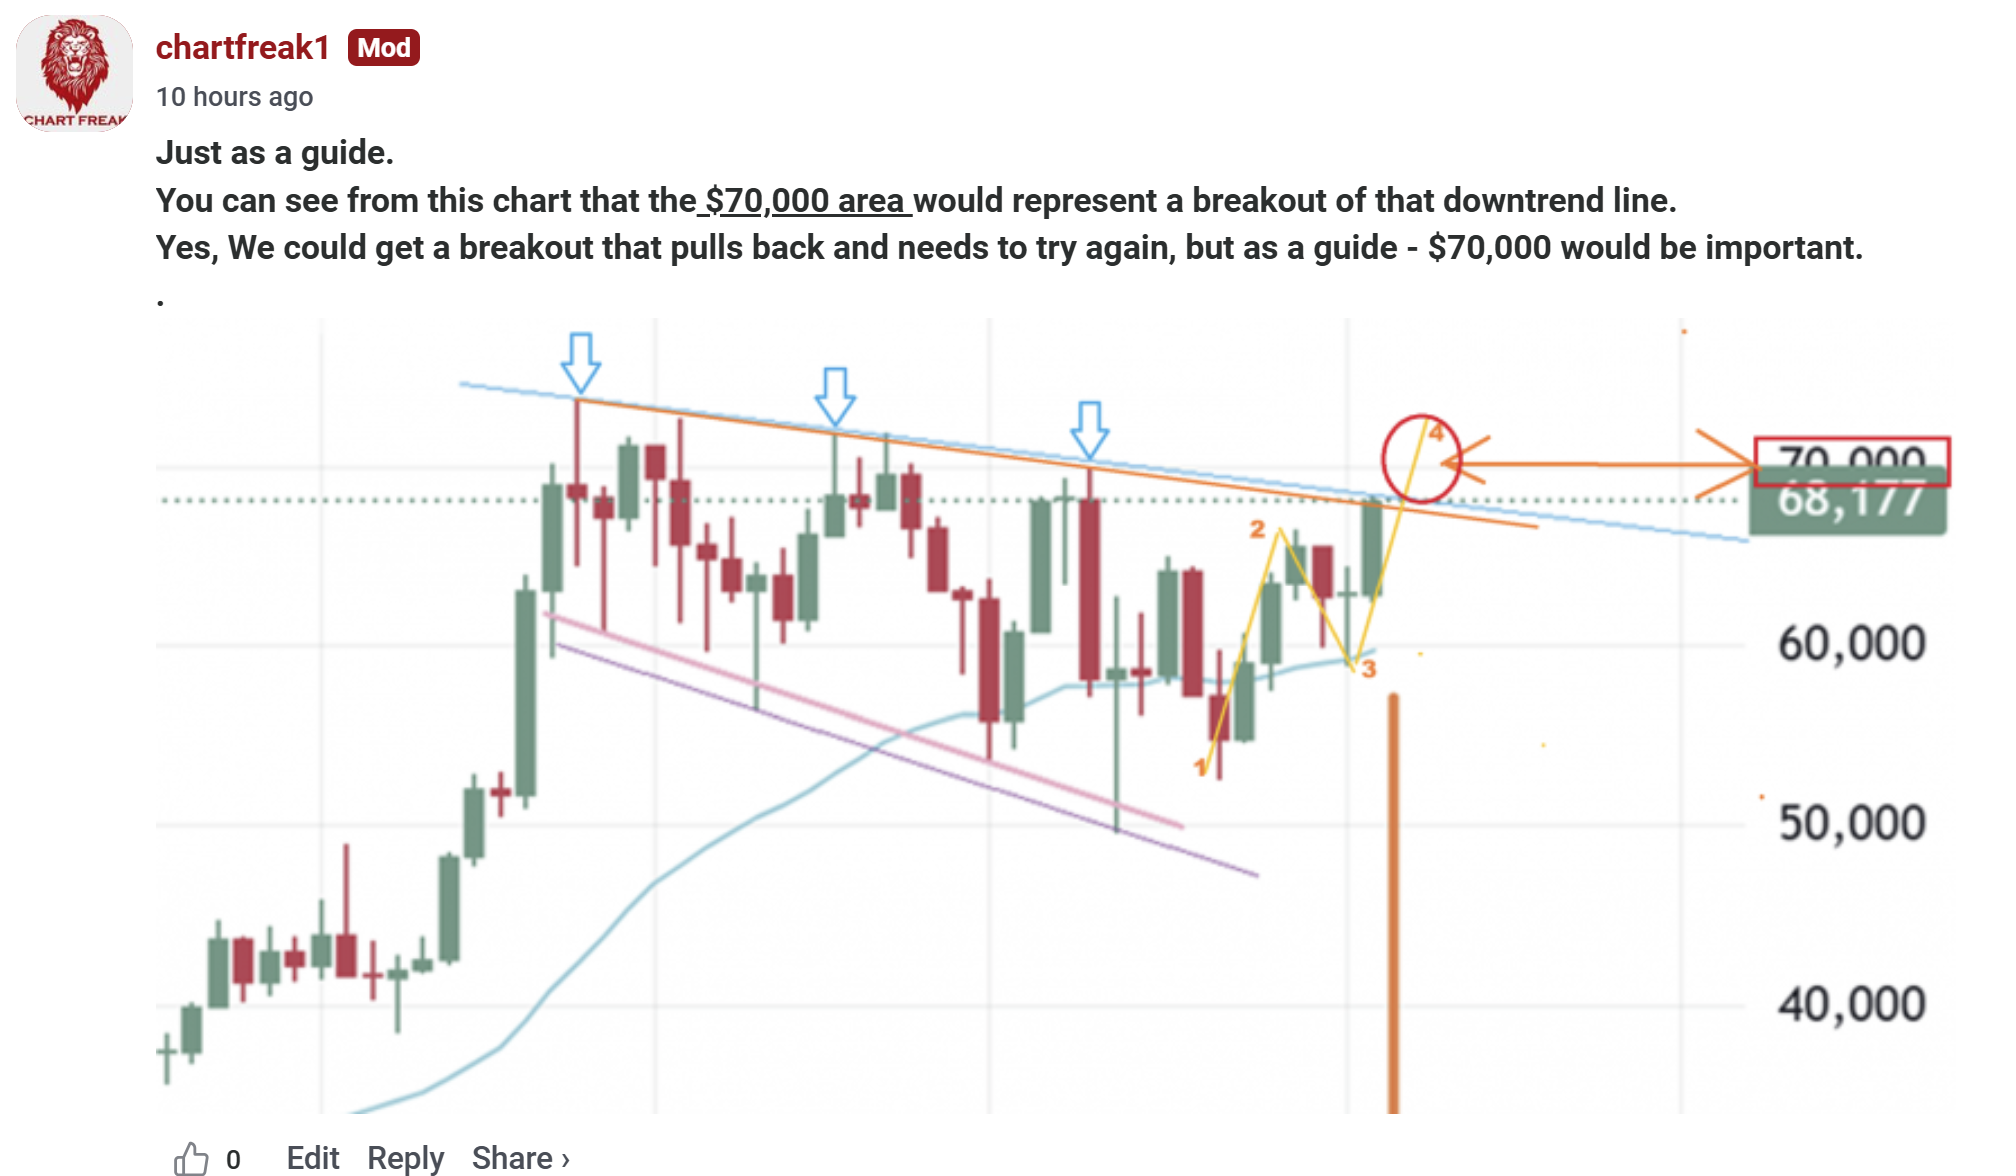
I THEN DISCUSSED TWO POSSIBLE PATHS THAT SEEM LIKELY:
.
Bitcoin could just breakout, back test, and be on the way. Very Bullish.
.
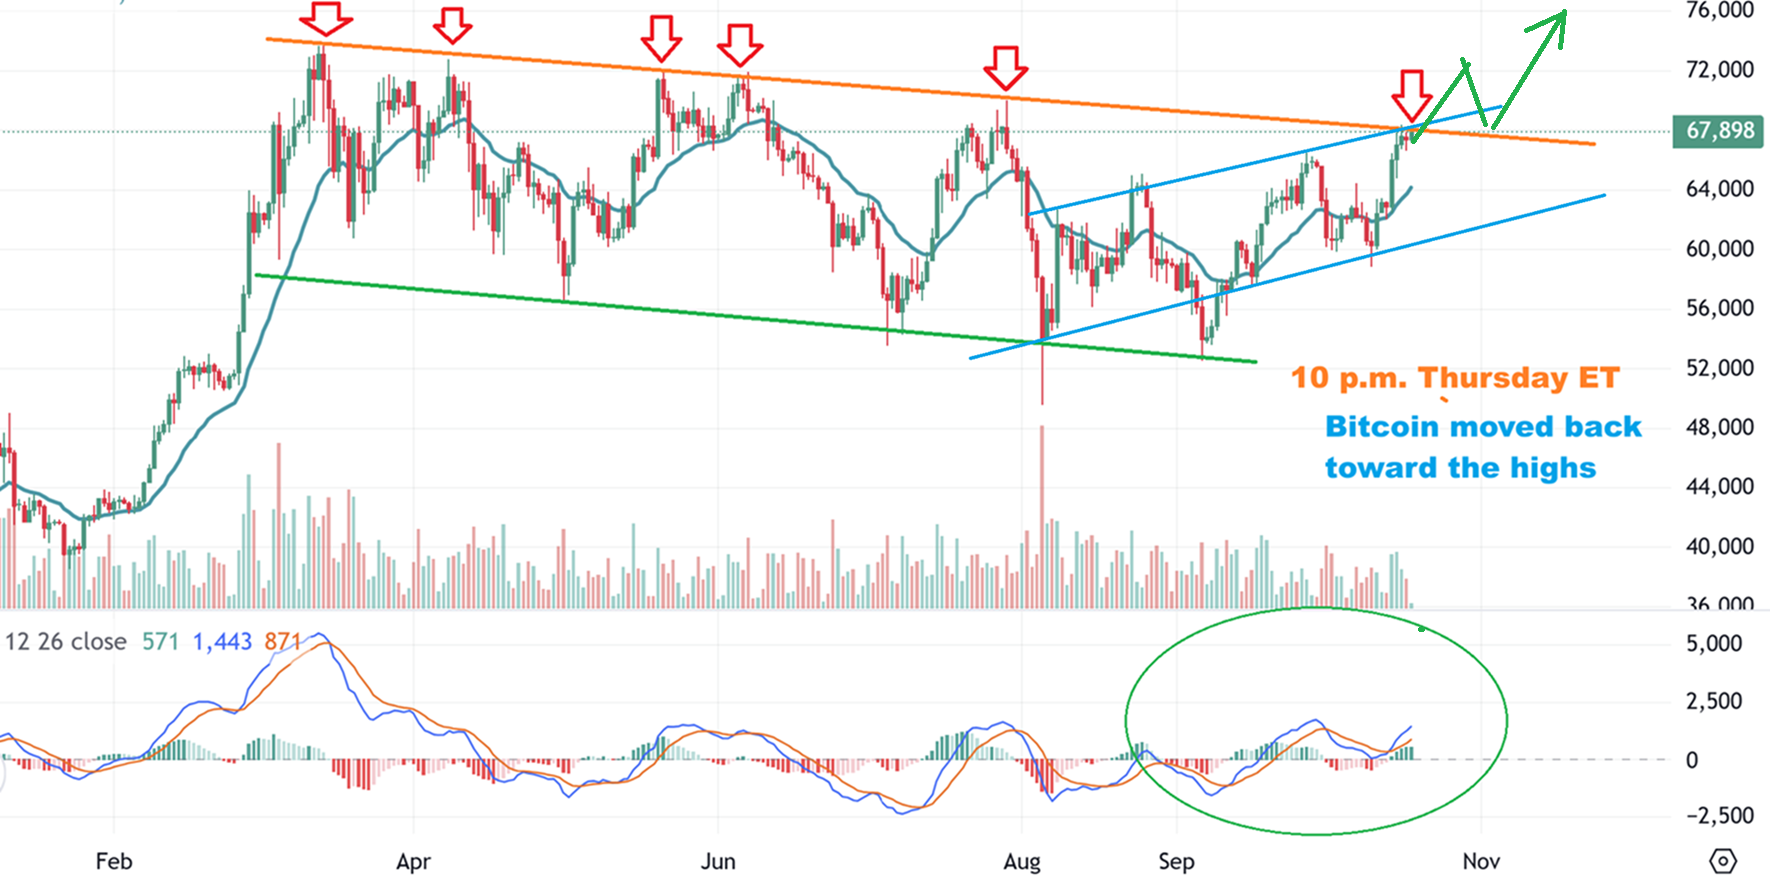
Bitcoin could keep doing what it has been doing, chopping and then reversing lower. I get this idea from the move in May, June, & July (Purple Box). We saw a rally to the highs and then a double top on the trendline.
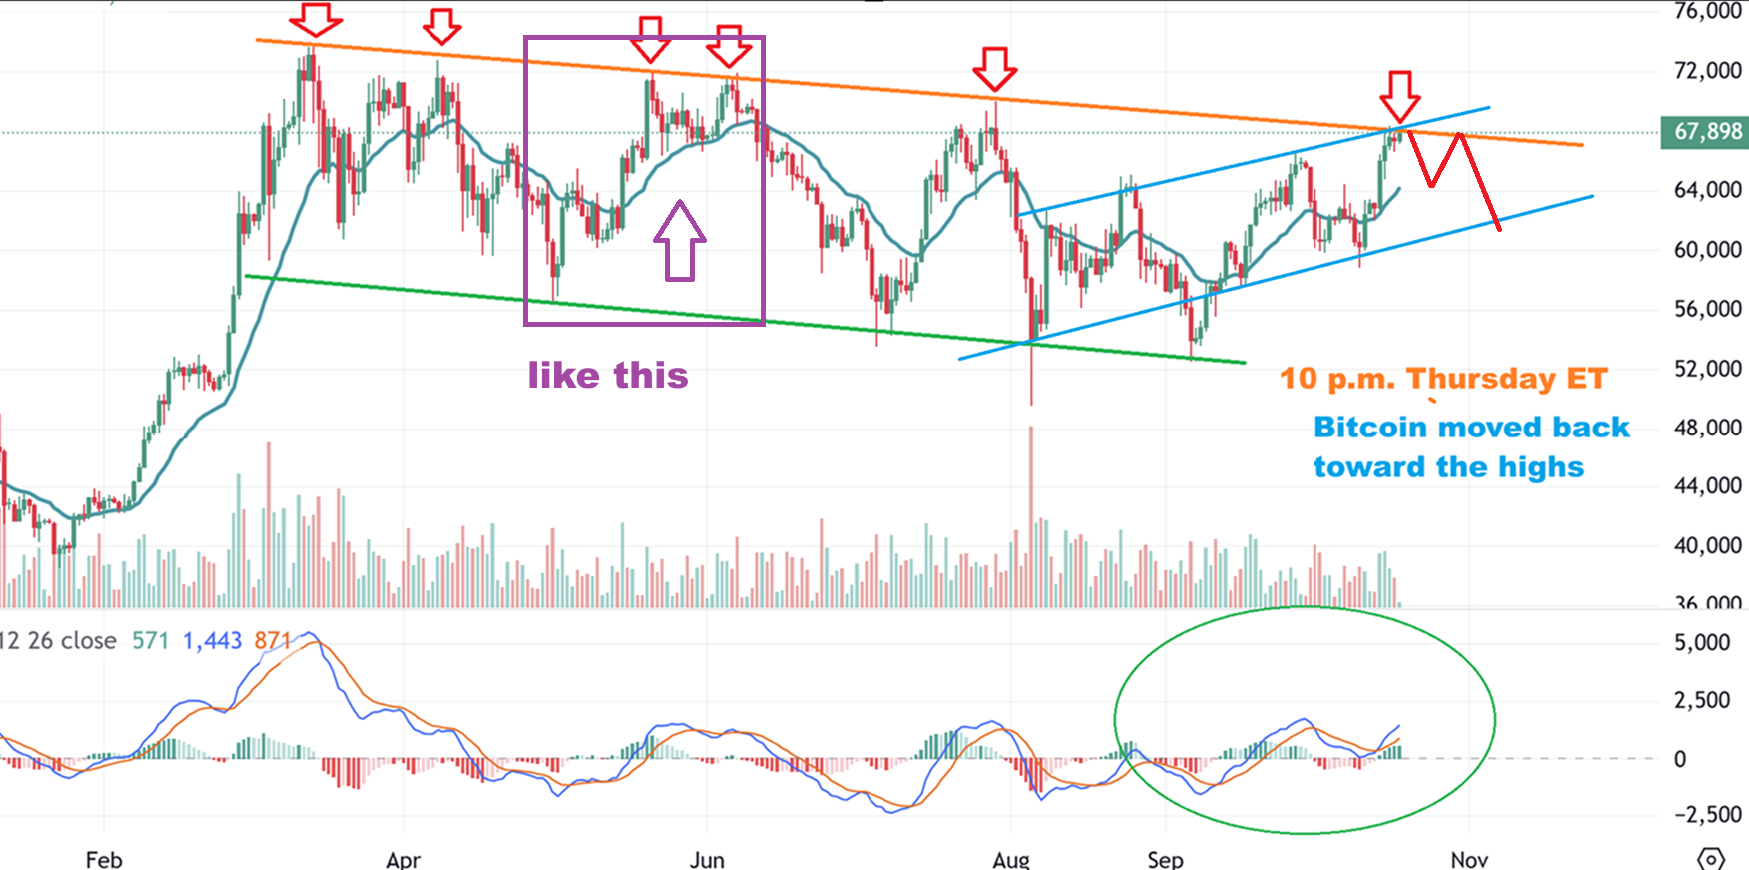
SO, AFTER FRIDAY AND PART OF SATURDAY, WE ARE BASICALLY AT THAT SAME UPPER LEVEL of $68000 after almost tagging $69,000. IT COULD BREAK OUT OR BUY A LITTLE MORE TIME CHOPPING AROUND, AS DRAWN HERE.
.
We have what I’d like to call a ‘Bit-Cup’ 🙂 Again, this could break out now or later, but when it does…
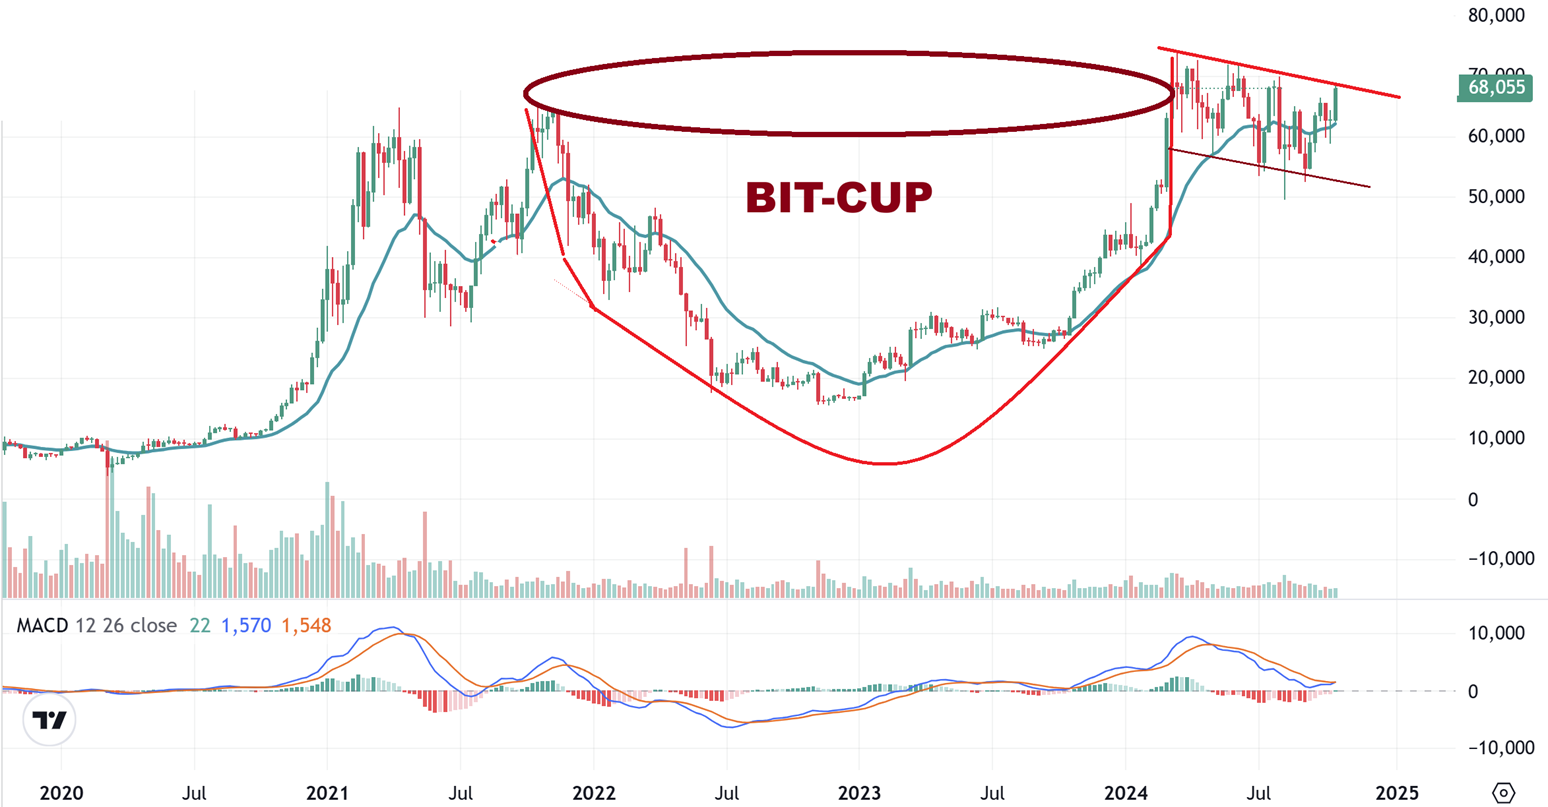
That Bit-cup could break out now or later, but when it does, you want to remember this Gold chart and what the stocks like HMY, OR, GFI, KGC, etc have done since last Oct 2023 when this broke out. 🙂
.
And also remember this Gold chart, which shows a possible fake out, but don’t get discouraged if we see this, there are still good times ahead.
.
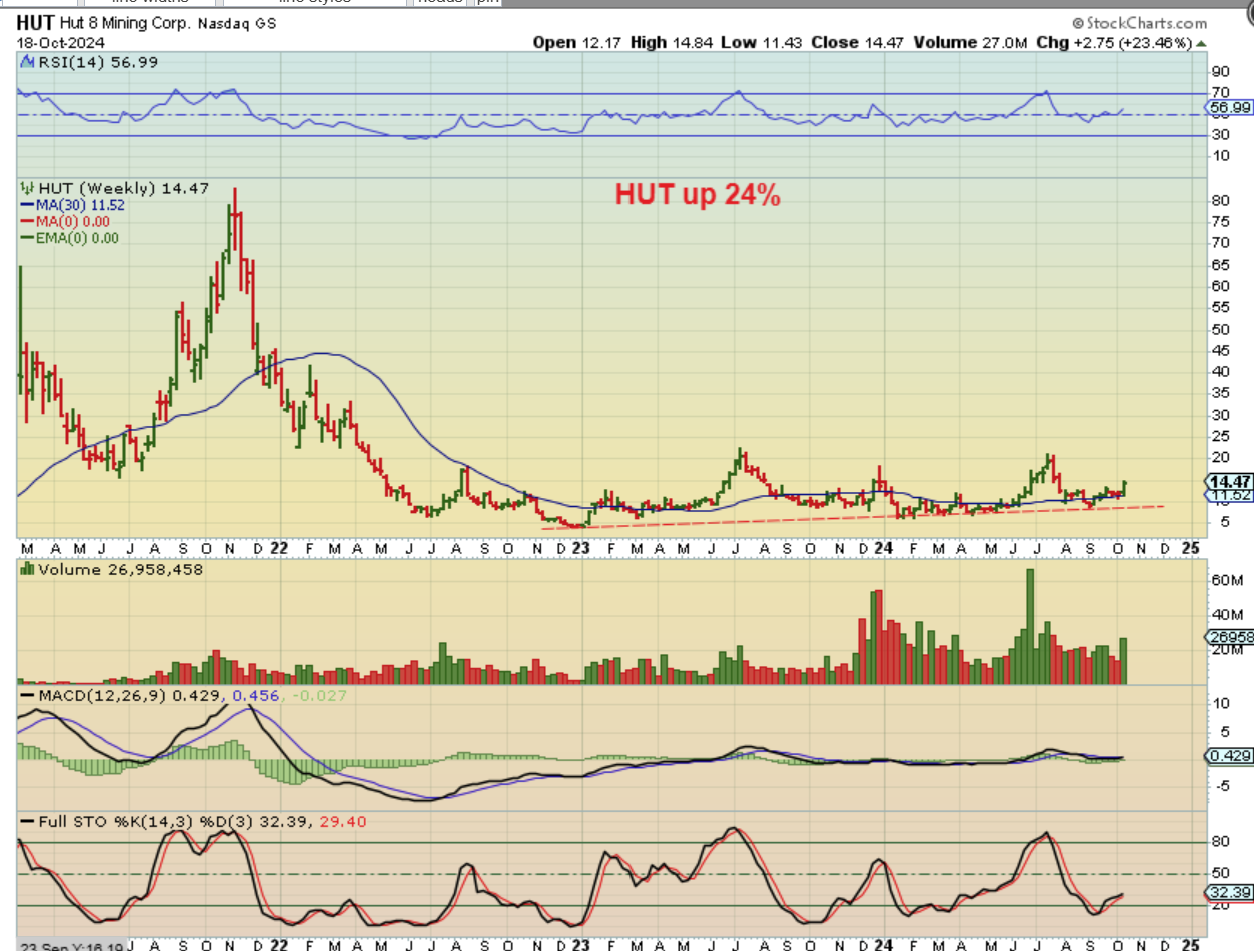
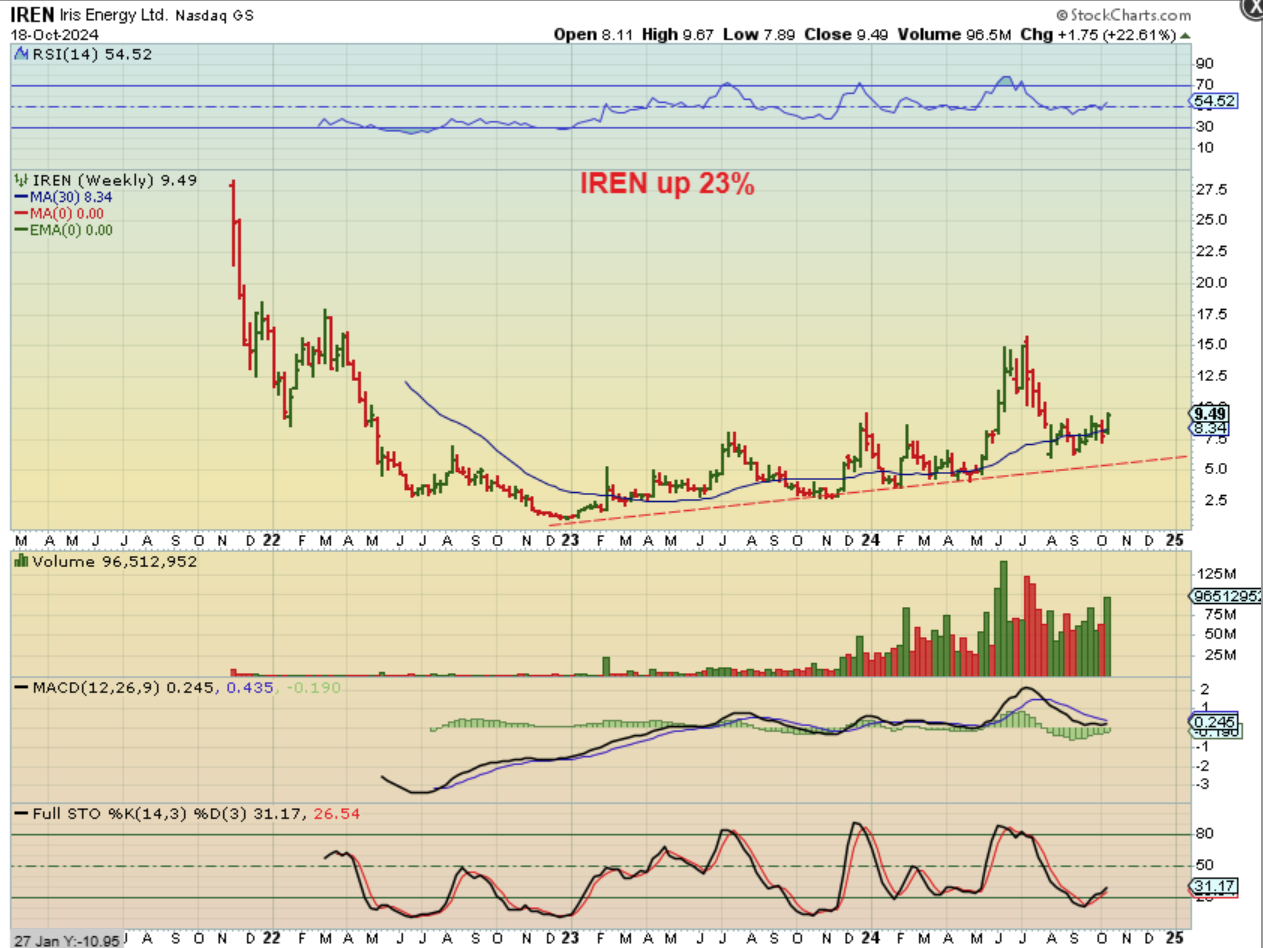
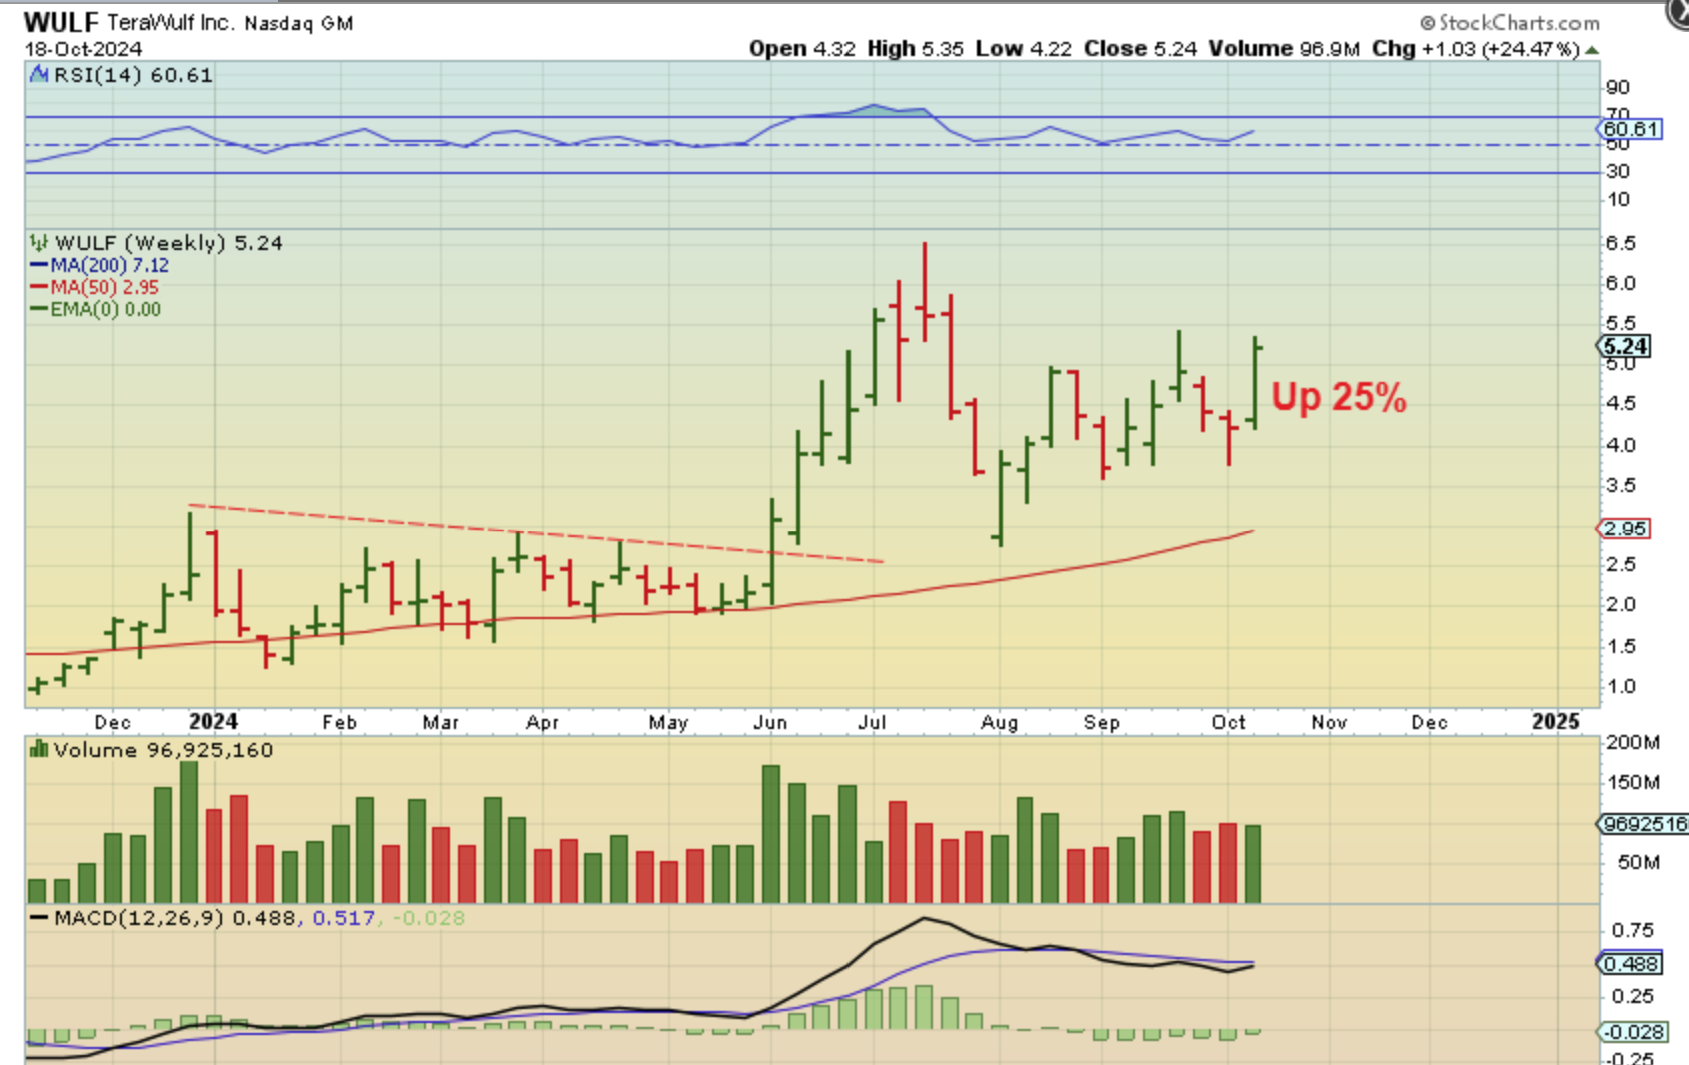
And 3 Crypto stocks that I had in the reports over the last couple of weeks were up big (& so where others). So far, so good, and these aren’t even close to overbought, if this sector decides to run.