October 4th – It’s Friday!
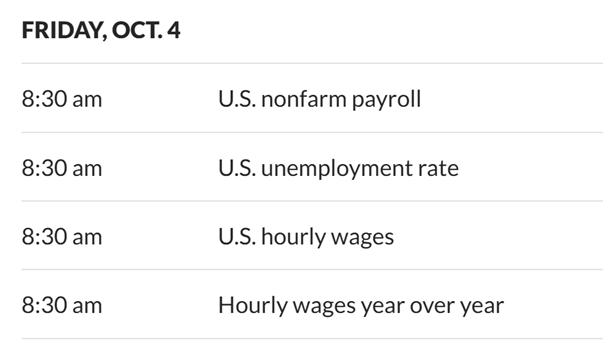
DATA THAT CAN MOVE THE MARKETS IS BEING RELEASED TODAY.
.
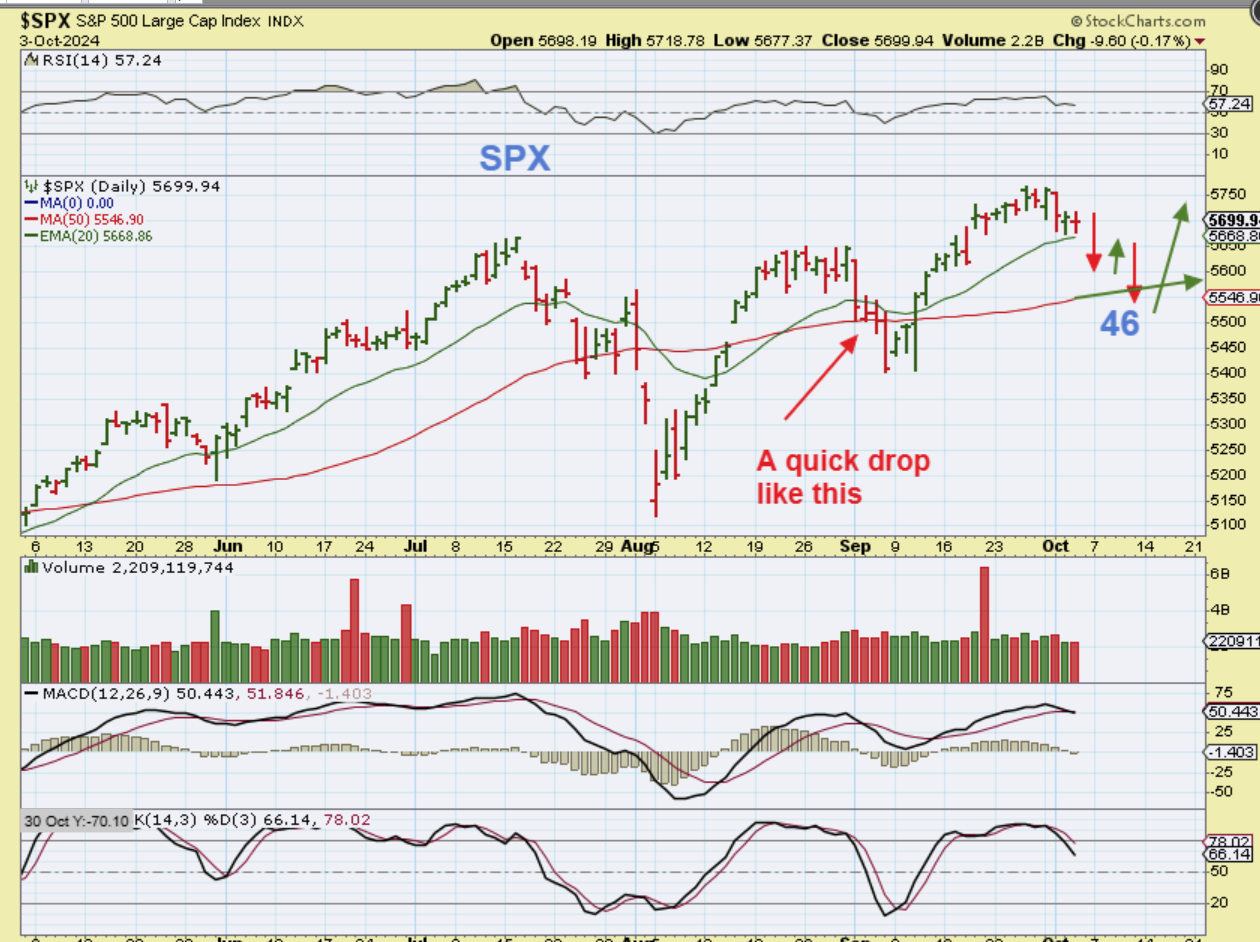
Yesterday I used this chart of THE SPX to show that the General Markets that I cover (SPX, NASDAQ, and SOXX) are currently under the 10sma, which is common when we drop into a dcl. So I said that these may ‘crawl along the 10sma’ and dip a little lower before a dcl is in place or they could break higher and possibly give us a mild dcl. At day 41, We are now within the timing for a dcl.
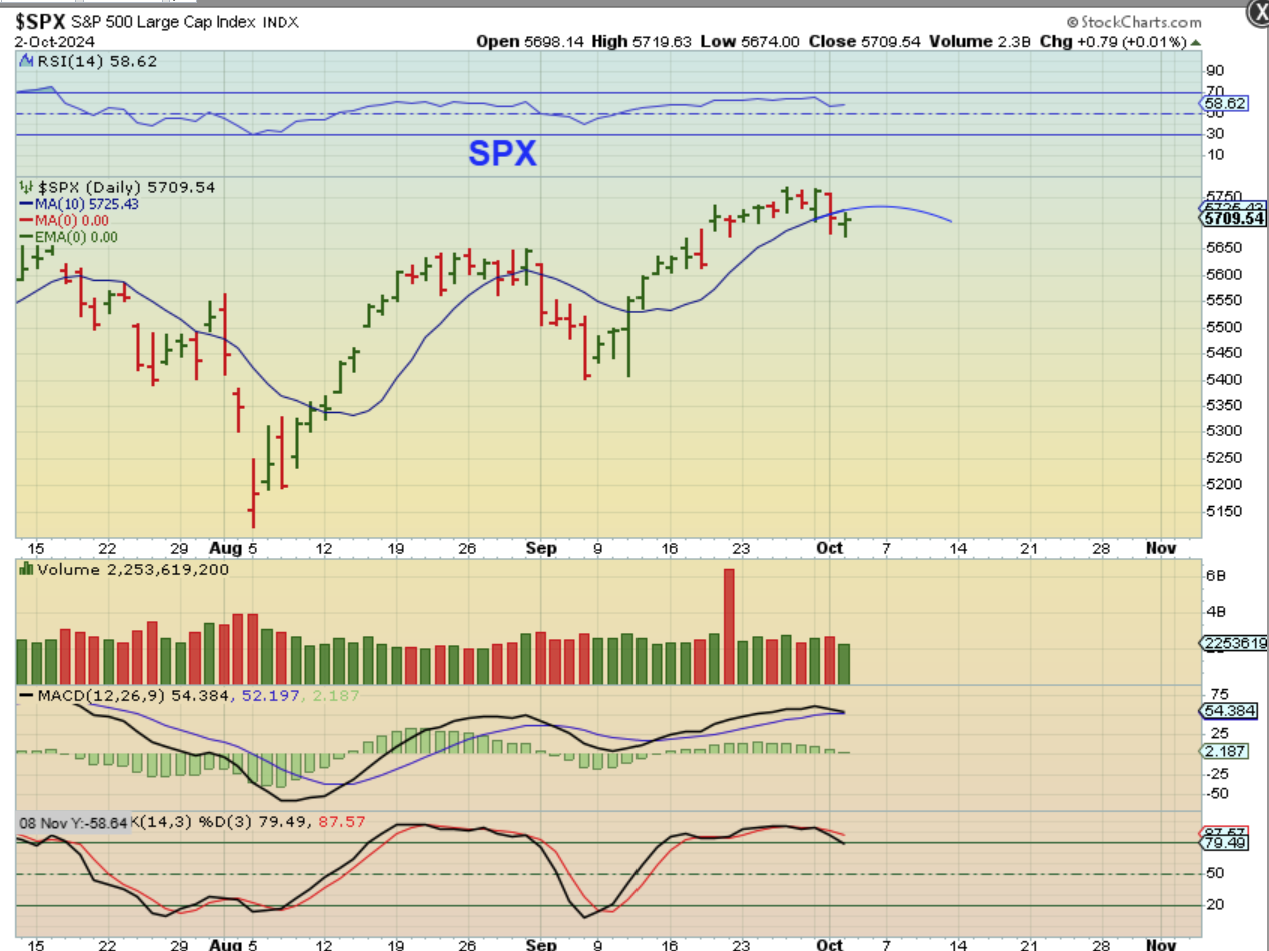
Thursday was DAY 42 and The SPX didn’t move higher, so it is still under the 10sma and still riding the 20 ema.
1. Watch for todays pre-market data to send price either up and over the 10sma (which may give us a mild dcl here at the 20 ema), or
2. Price could drop lower to form a dcl, possibly at the trendline or 50sma next week.
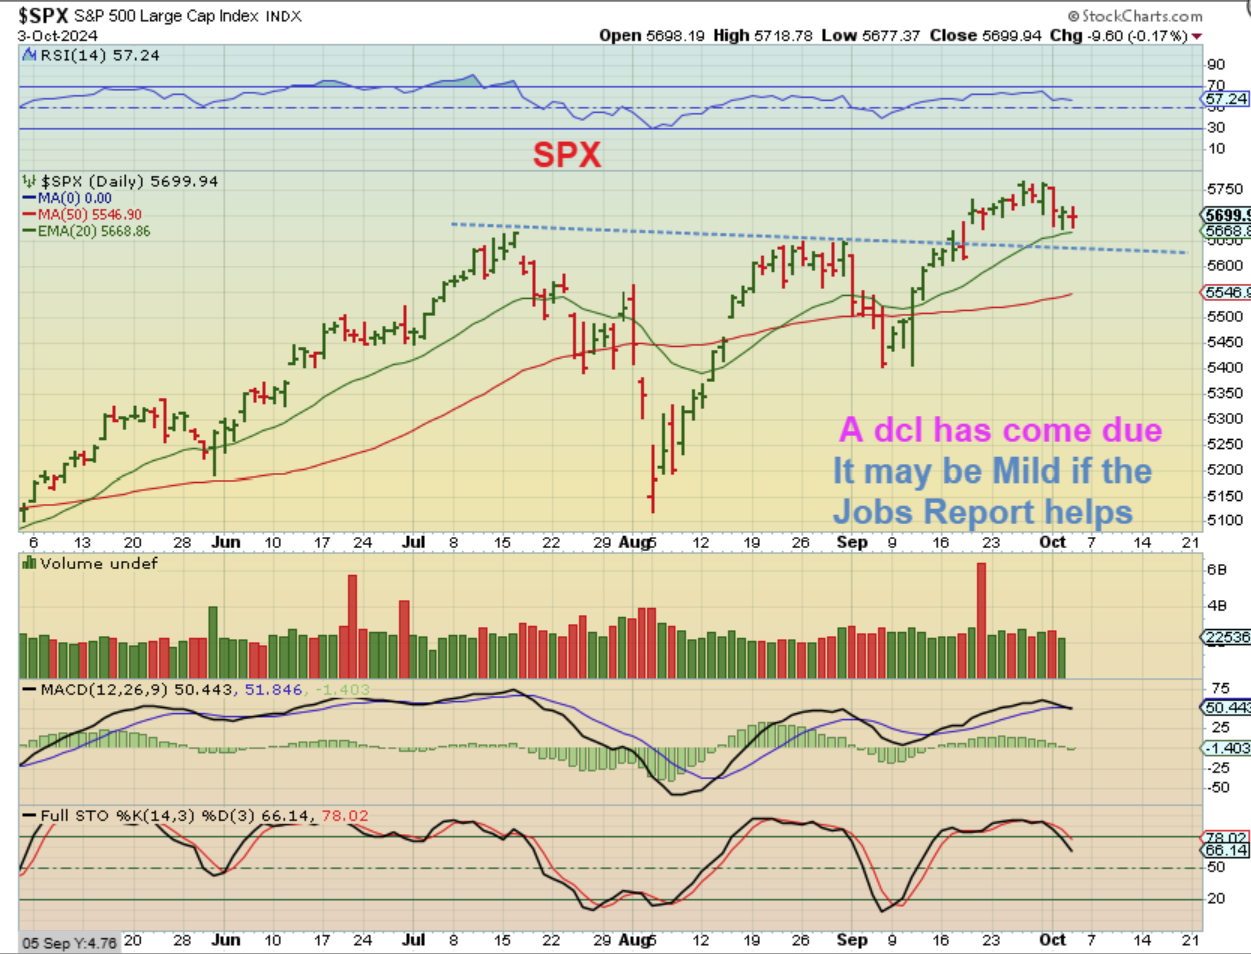
.
I would prefer to see something clear like this. Price dropping lower to form a dcl, possibly at the trendline or 50sma next week, something like this. This is a much easier buy point.
WTIC – Oil has been showing signs of strength and on Thursday it surged above the 50sma and above the short term blue trendline. Oil stocks have also been acting quite bullishly (read the chart for names )…
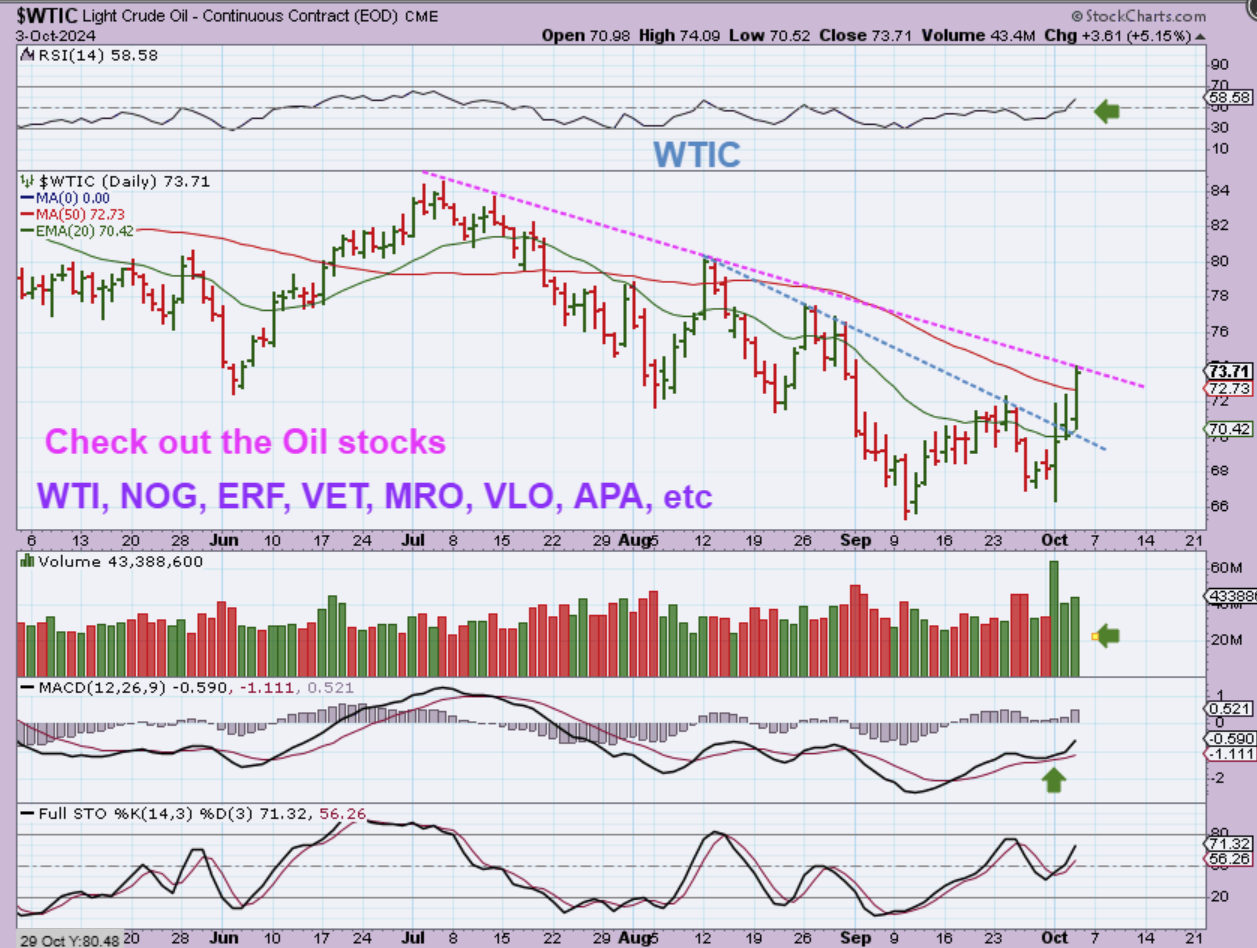
.
THE XOP (& GUSH) now have a higher low and a higher high in September-October, and this is also a bullish surge through resistance…
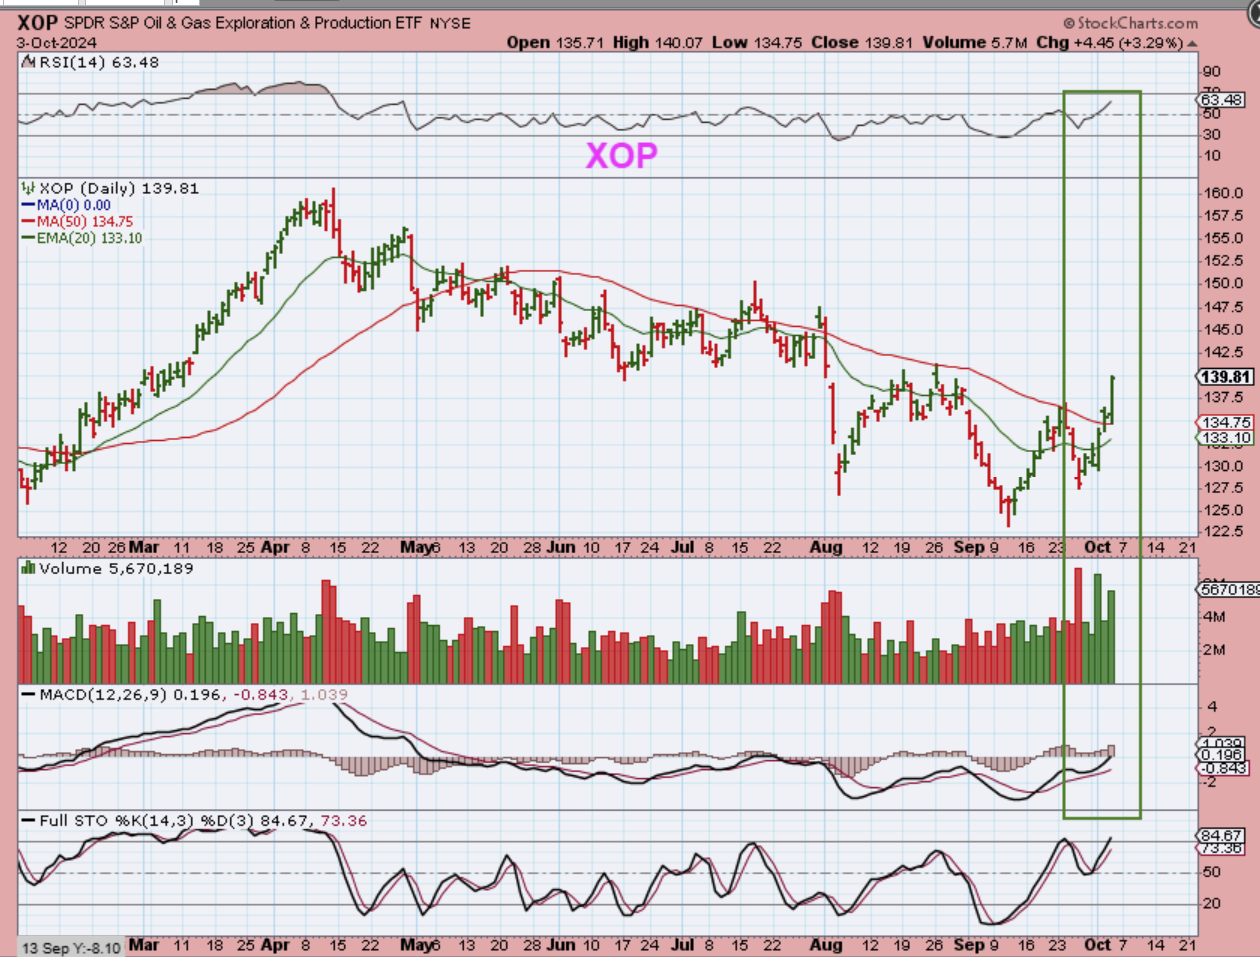
.
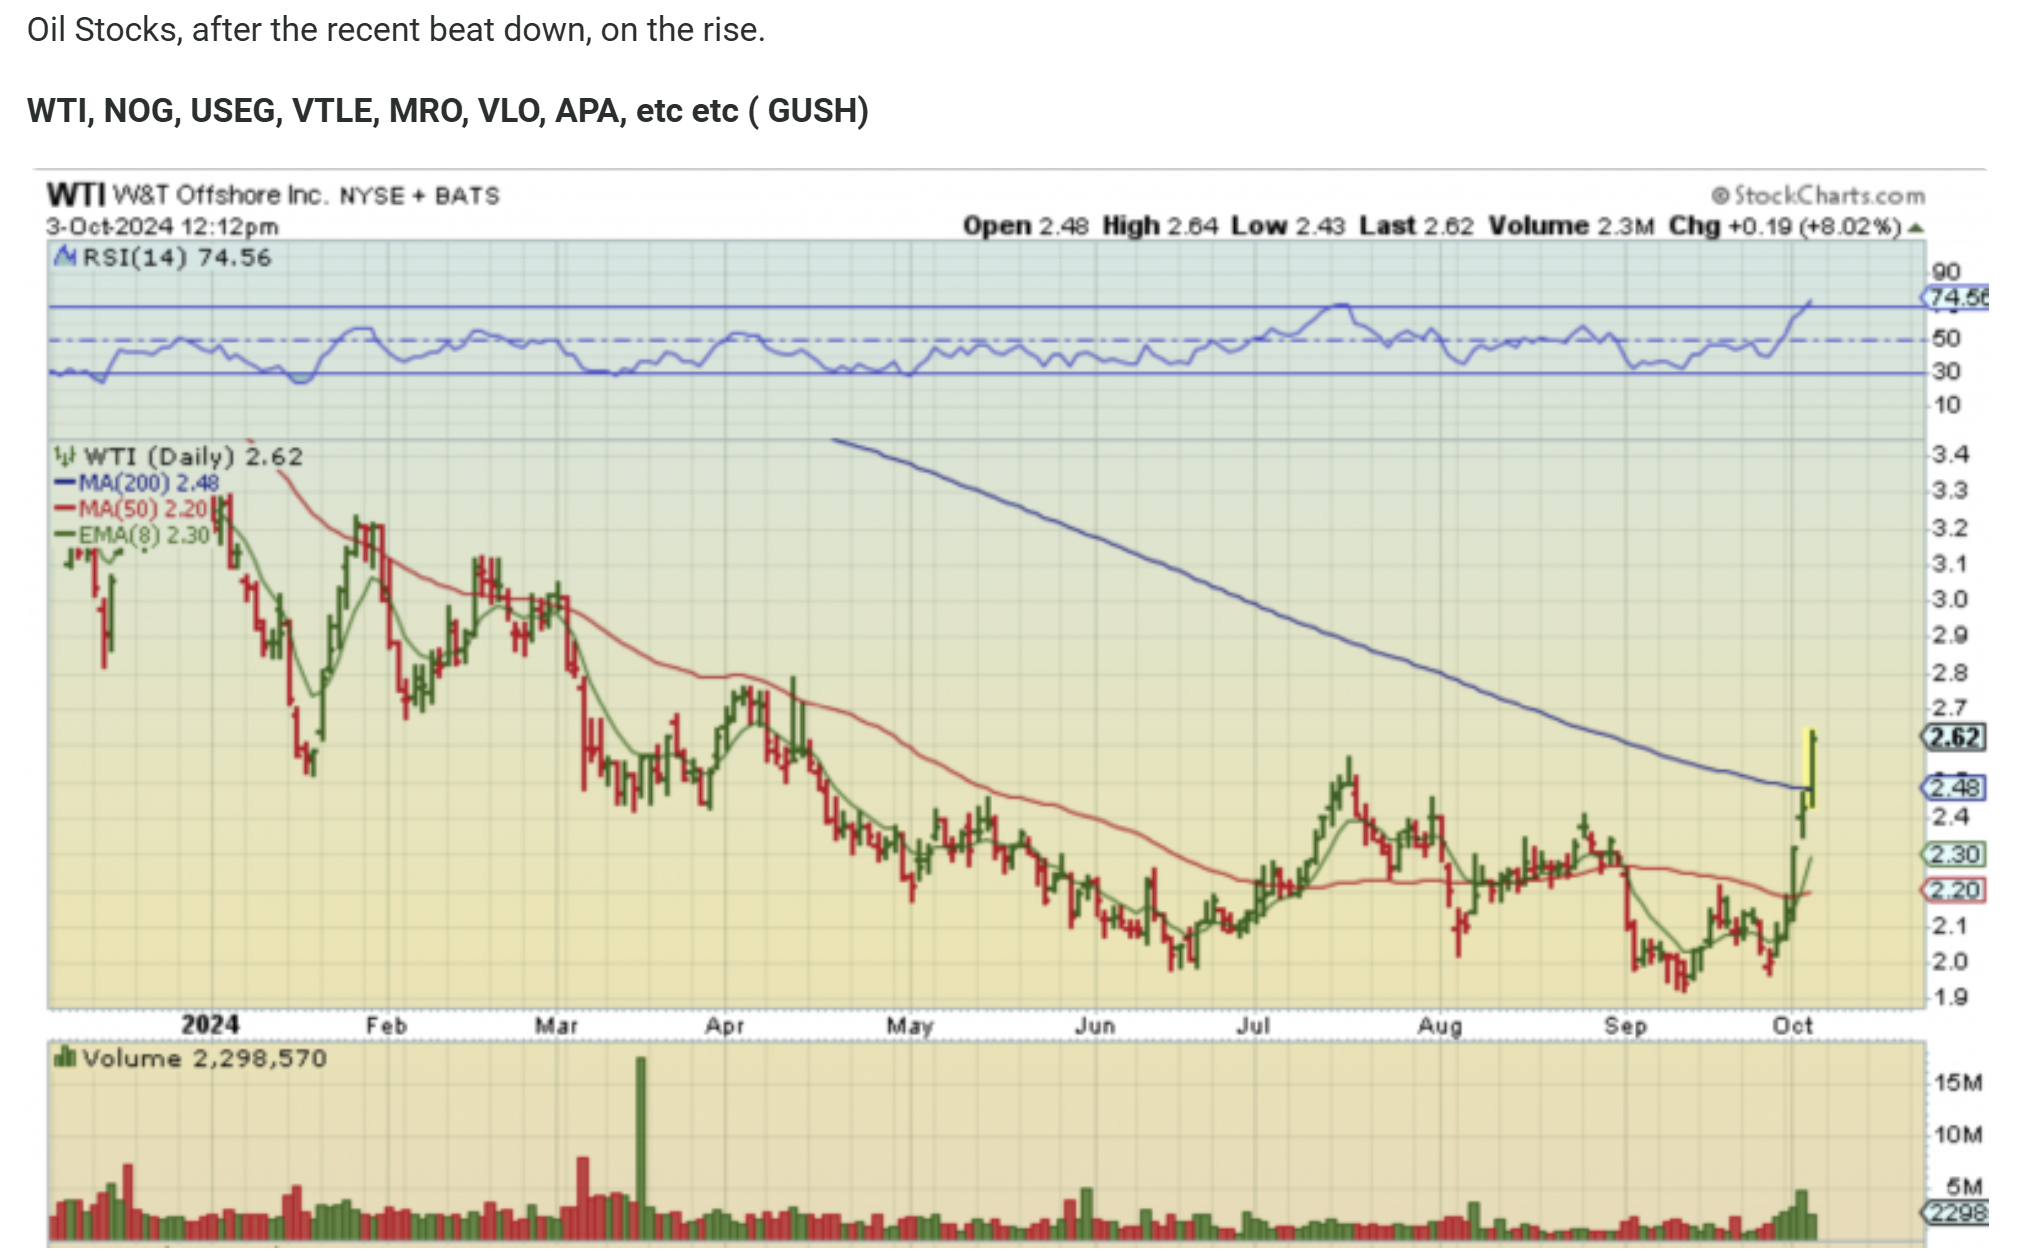
In the commenting area, I pointed out the Oil Stocks, and they suddenly look very bullish coming out of the lows. THis may also be due to short covering, but many are doing it.
.
.
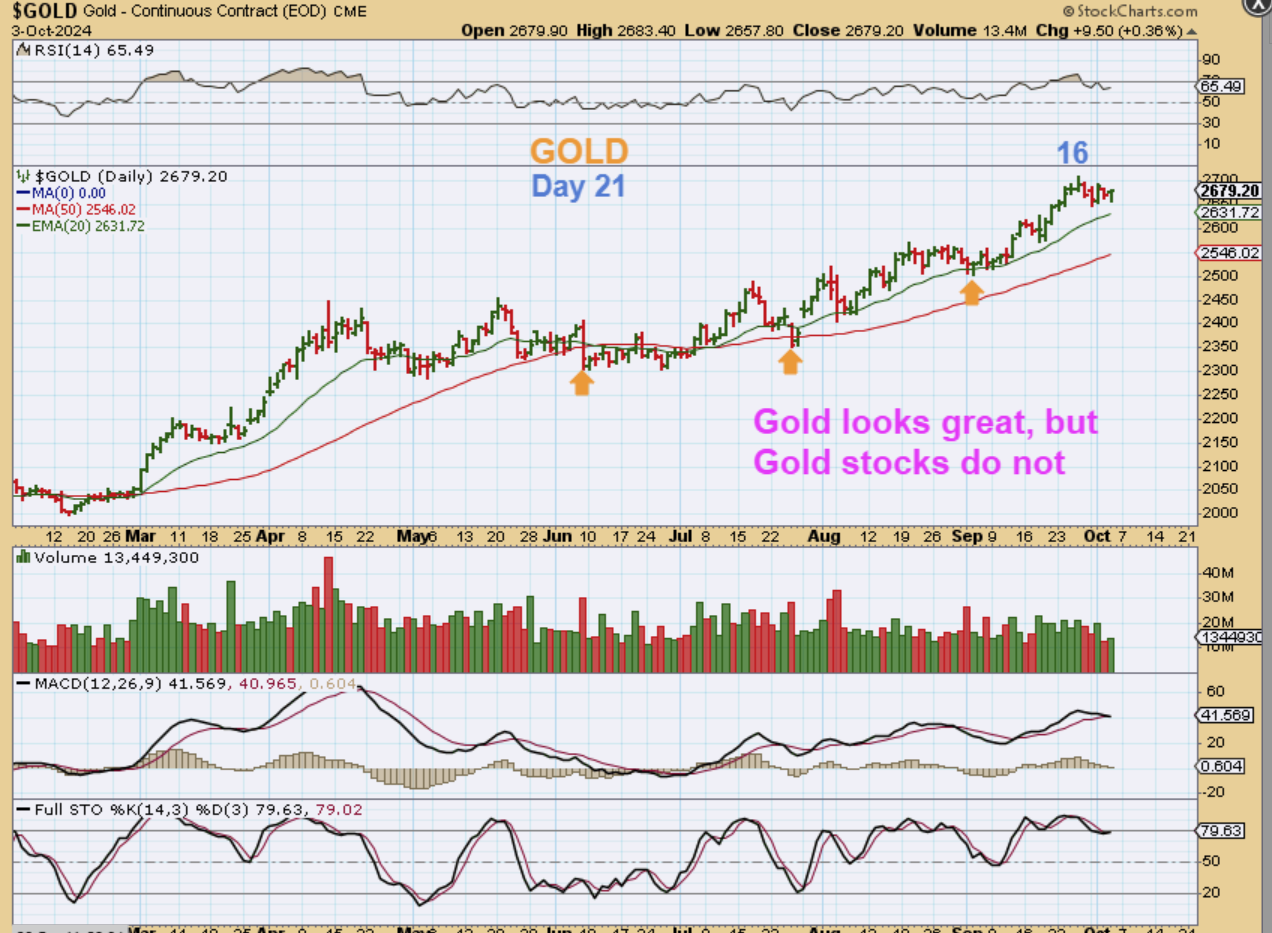
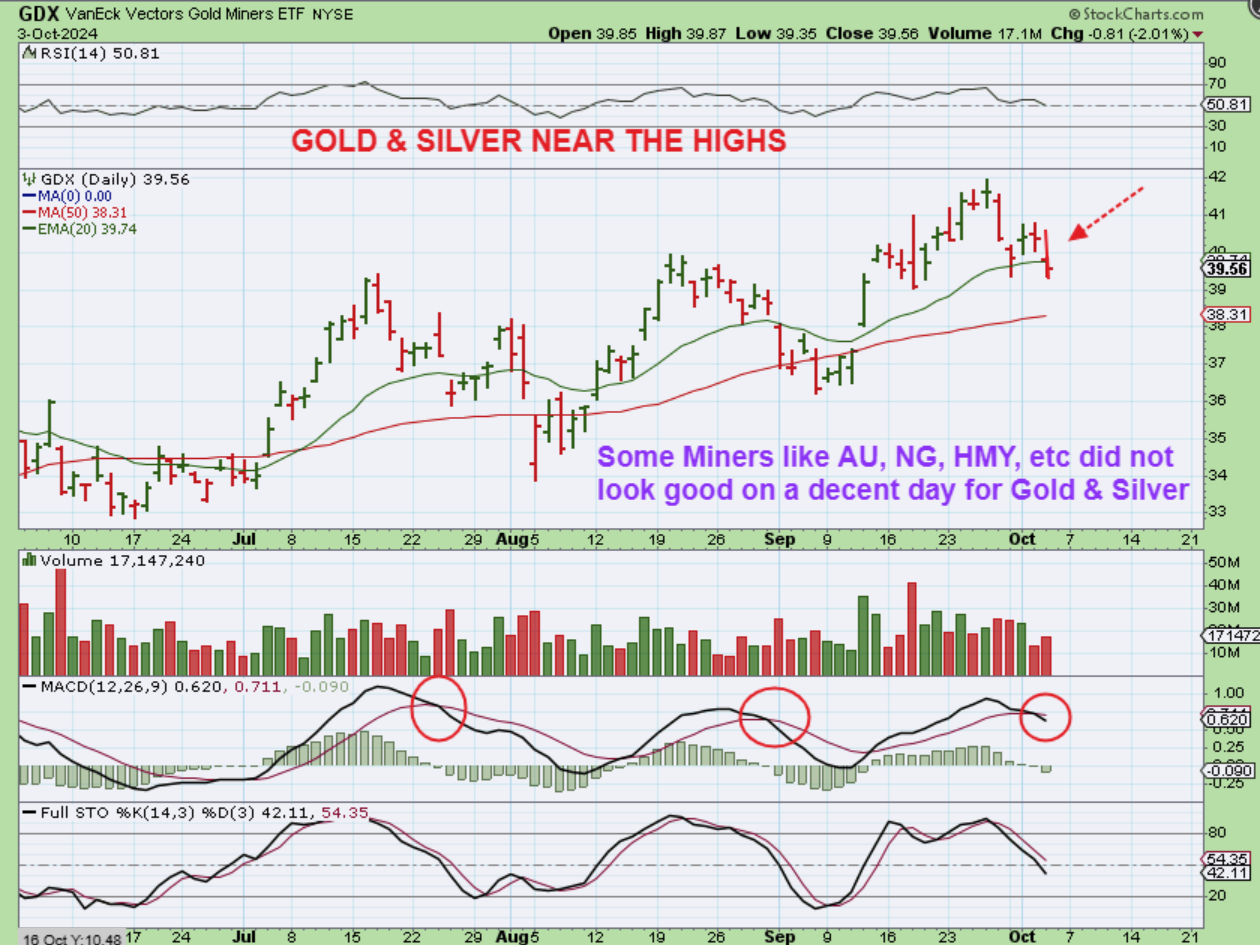
GOLD continues to look very good, and this could even have the look of a small pennant or triangle forming, right? However, what I don’t like is that many Gold Miners are now selling off and dropping lower. It may be because Gold is in a 3rd daily cycle and Gold Miners are starting the drop into the next ICL first. SOME miners are ‘ok’ (EGO, IAG, KGC above the 50sma), others really look weak. Let me show you…
.
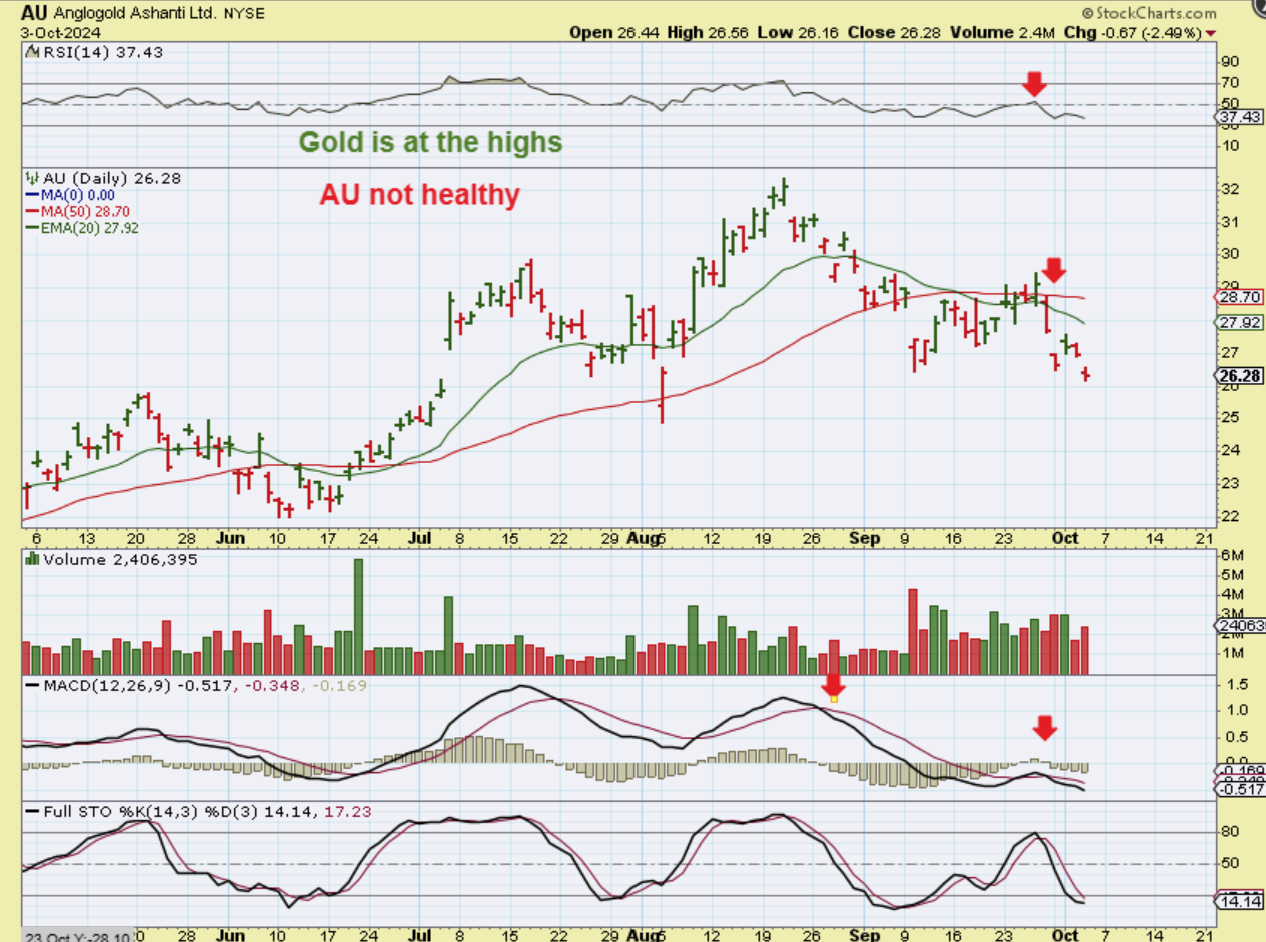
GOLD IS NEAR THE HIGHS, YET AU is an example of a formerly strong Gold Miner that looks bad with Gold still up at the highs. This is a warning to me that others like EGO, KGC, etc could start to follow.
.
.
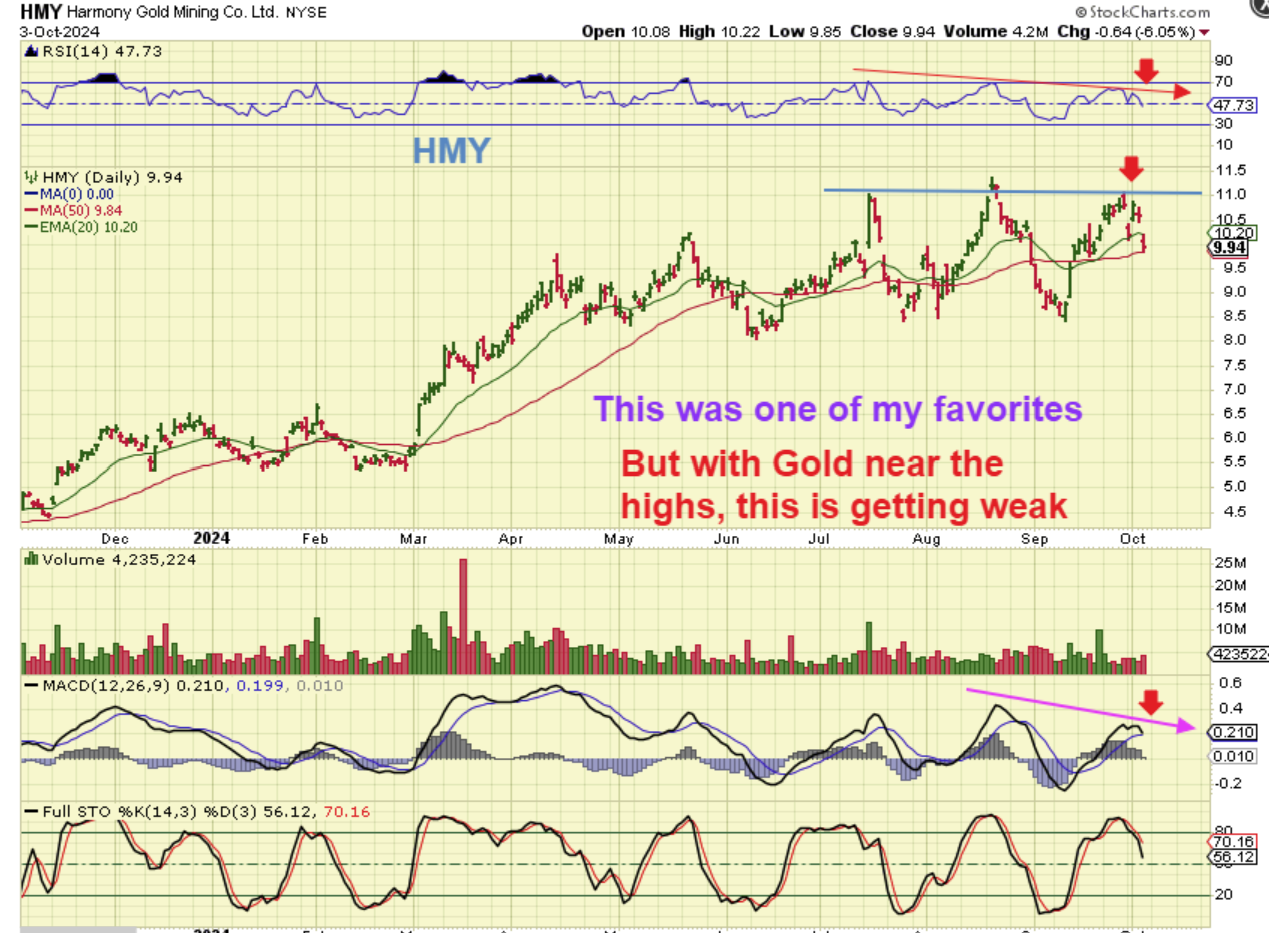
HMY: On Tuesday & Wednesday of this week HMY was at the highs with Gold at the highs. What happened? I would have said that HMY was set to breakout if Gold did, but this 6% drop on Thursday changed that. I looked for news and nothing big could be found.
.
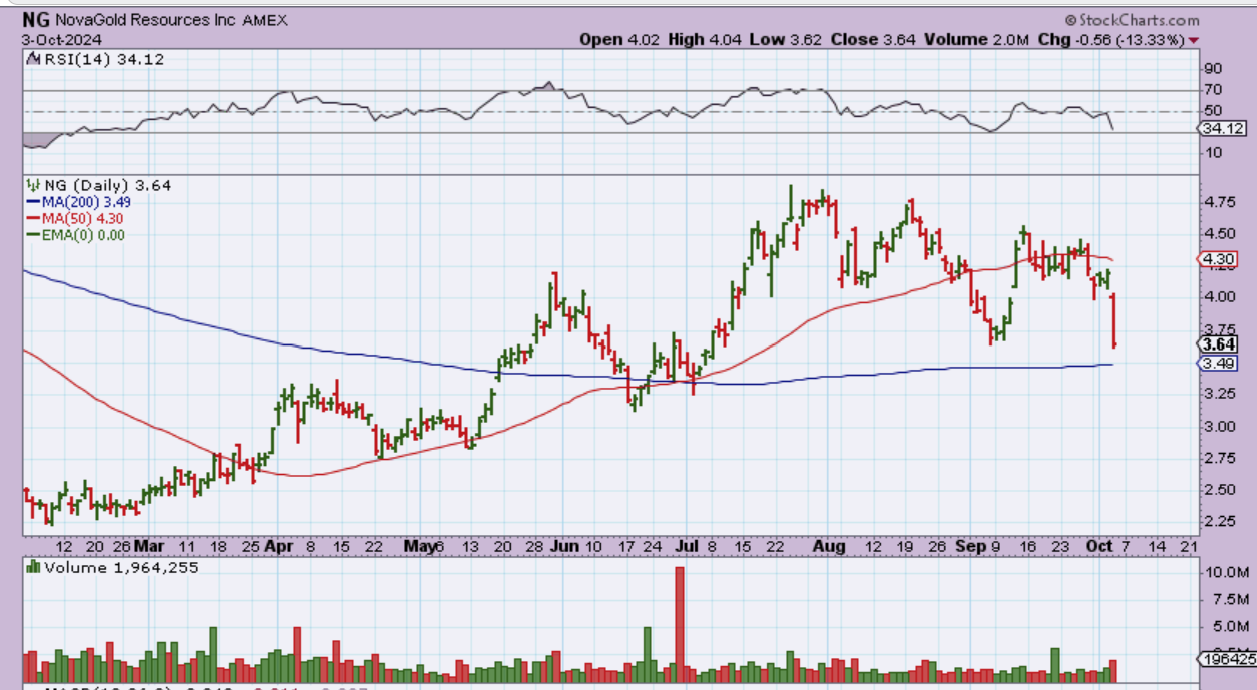
IF YOU THINK THAT WAS UGLY, take a look at NG after earnings, with a 13% plunge. This sector is weakening in the 3rd daily cycle for Gold. HOWEVER, Silver stocks look good…
.
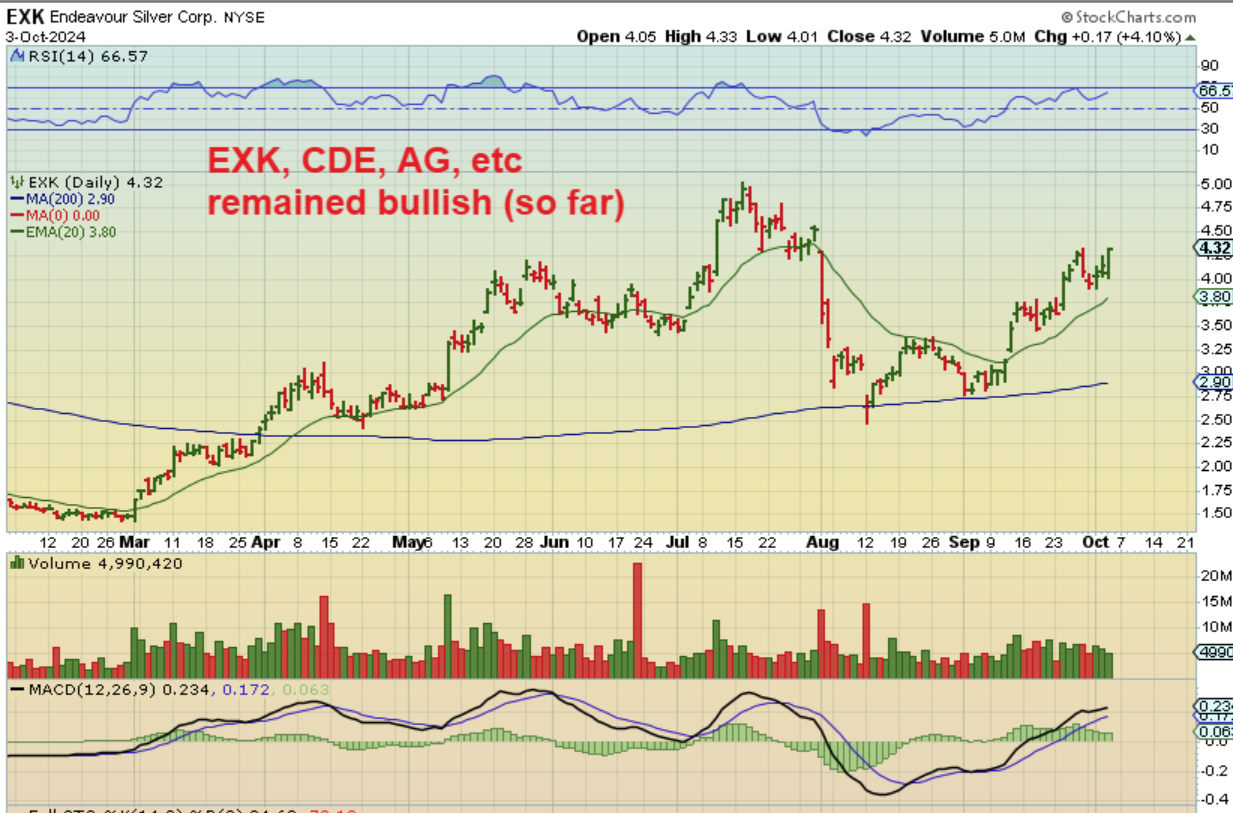
However, While Gold stocks show weakness, there may be rotation taking place. I see that Silver stocks still look good and closed at the highs yesterday. Silver is moving out of its ICL more recently.
.
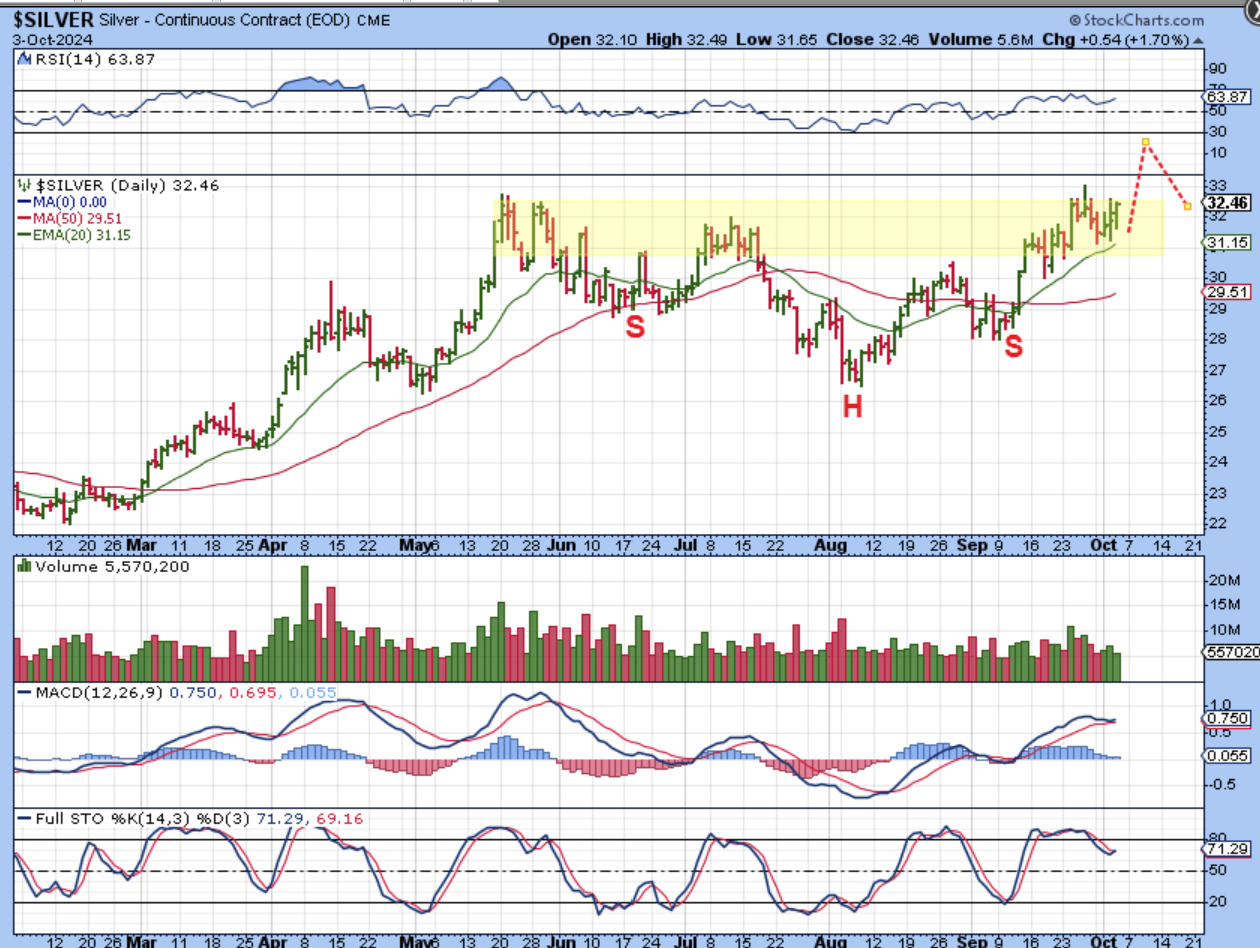
SILVER does look like it wants to breakout and then we could see a back-test with the dcl that follows.
.
GDX dropped & lost the 20 ema & has a MACD cross with Gold and Silver up near the highs, so this is a warning that Gold stocks may be ready to pull back ahead of Gold. The Silver stocks still look good but need monitoring (Use stops).
,
The General Markets will be due for a dcl soon, and that is a buy. Oil stocks are taking off out of the lows, so you could find a lagger and start a small position and add along the way or buy the dips on the recent rockets (this sector has been very choppy and Oil seems to be driven by geopolitical events, so it can be tricky). Gold and Silver look great, but Gold stocks are acting heavy all of a sudden and that may be predicting Golds 3rd daily cycle will peak soon and dip lower. That said, the next ICL for Gold will offer a GREAT Buying opportunity! Rate cuts are scheduled through 2025, so buy that next ICL! Silver and Silver stocks do still look bullish, we may be seeing rotation, which would be people taking gains in Gold Miners and adding them to Silver miners. Finally, I have been stalking the Crypto Miners and Bitcoin. I’ll discuss that below, and I have liked what I see developing.
.
I am leaving to go see my parents in the morning, I’ll be back later. ENJOY YOUR FRIDAY AND WEEKEND!
.
~ALEX
.
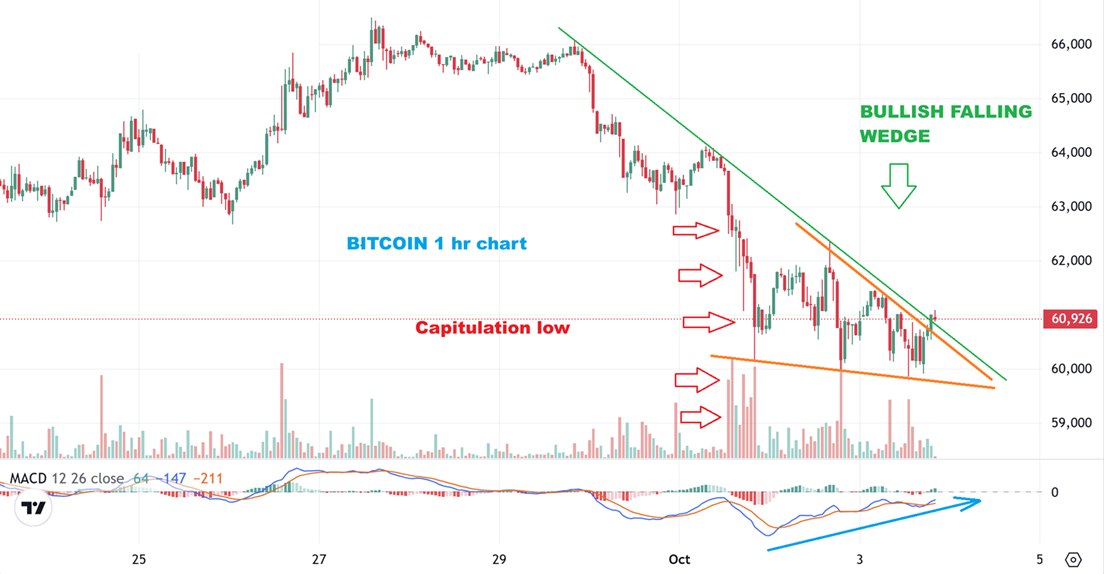
BITCOIN 1 HR CHART – This week I’ve been focusing on and watching BITCOIN intraday (& Crypto stocks) for clues of that day 60 low being in place and possibly the Cryptos bottoming first. On Wednesday Bitcoin broke the slam down capitulation lows and bounced. It did the same on Thursday, as the MACD continues to climb. I now see a bullish falling wedge possibly forming and I saw Crypto Stocks acting bullishly again on an intraday basis too. I’ll discuss that below.
.
BITCOIN in Thursdays report:
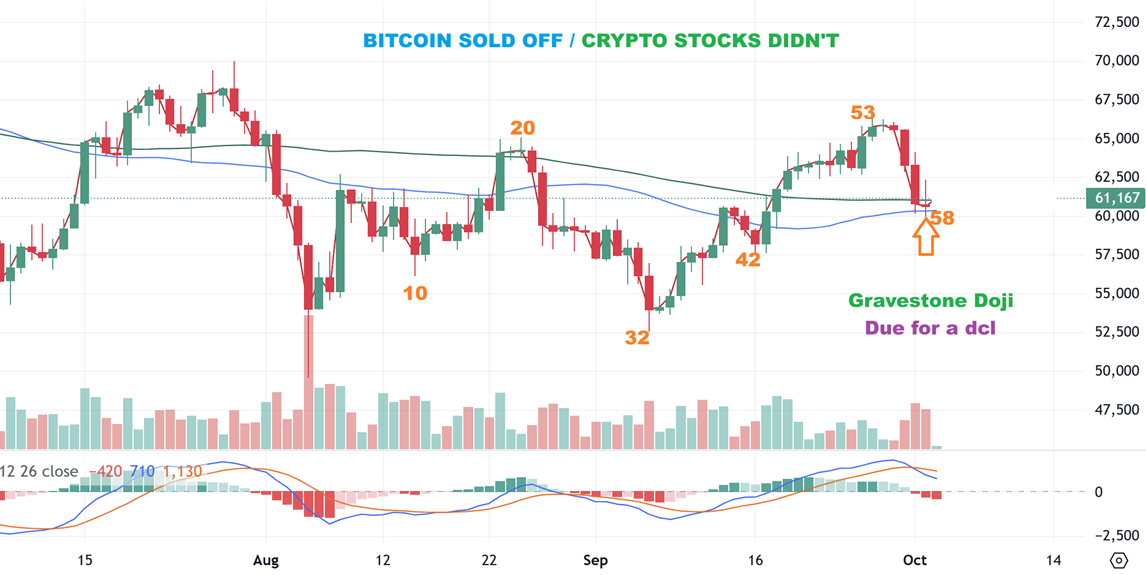
Bitcoin did a pop & drop and ended the day red, but I see a gravestone doji, and they can be bullish. We are due for a dcl around day 60 too, so I got the feeling that the crypto stocks maybe be under accumulation (They stayed green).
.
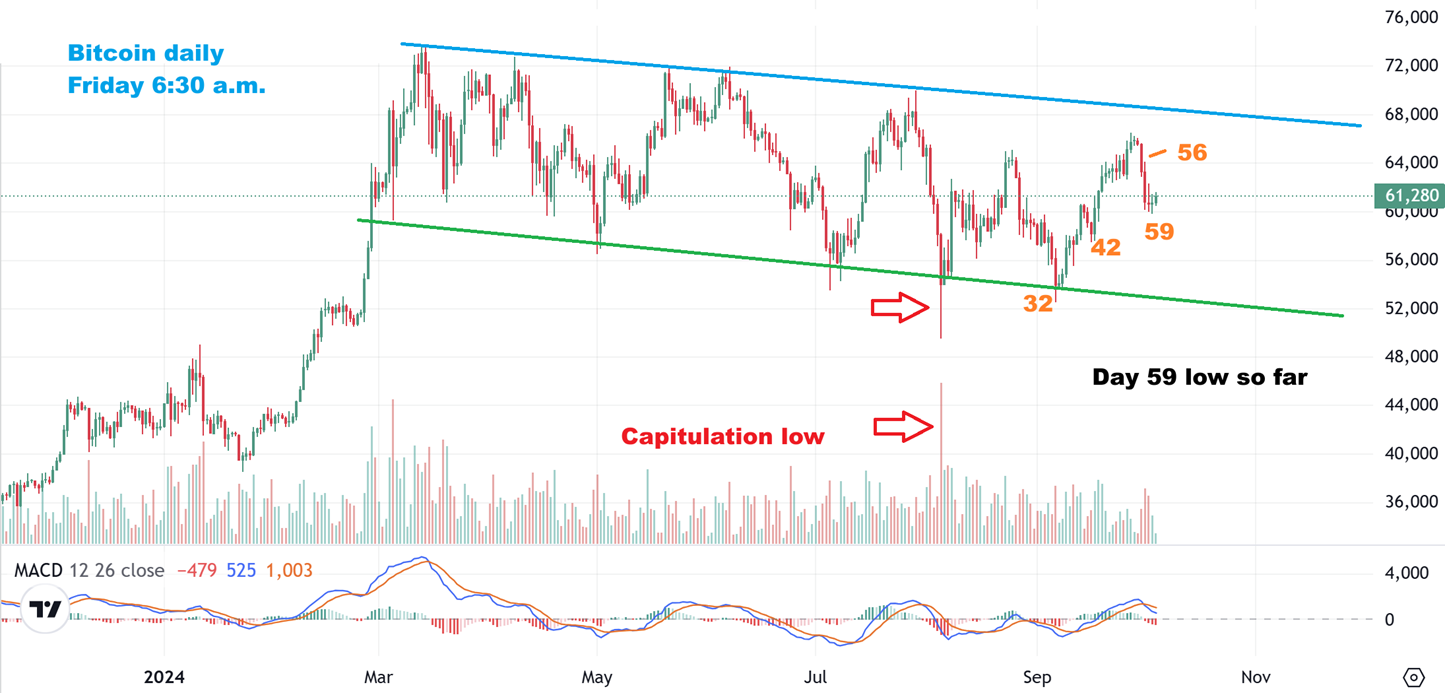
Bitcoin did make a slight new low on day 59. If the day 60 low comes in this high in the consolidation, it is very easy to picture Bitcoin finally breaking out and running much higher.
.
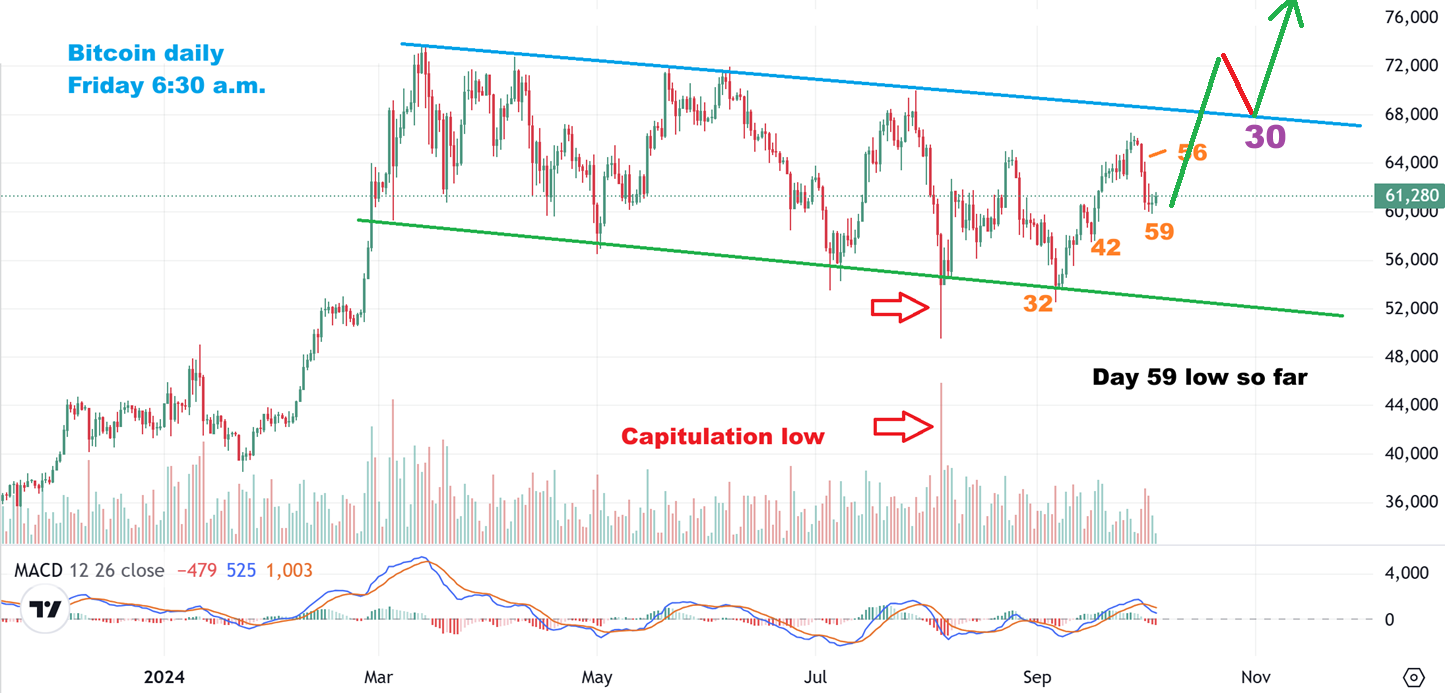
If the day 60 low comes in this high in the consolidation, it is very easy to picture Bitcoin finally breaking out and running much higher, like this. THIS would be a GREAT TRADE for ETFs or the Crypto stocks.
Speaking of Crypto Stocks: I have been trading them this week, but they may be turning into ‘Buy & Hold’ with Bitcoin so close to (or already at) the 60 day low. I mentioned yesterday that several closed Green when Bitcoin sold off to new lows and I have NOT seen that in a long time. Let’s look at a few crypto stocks…
.
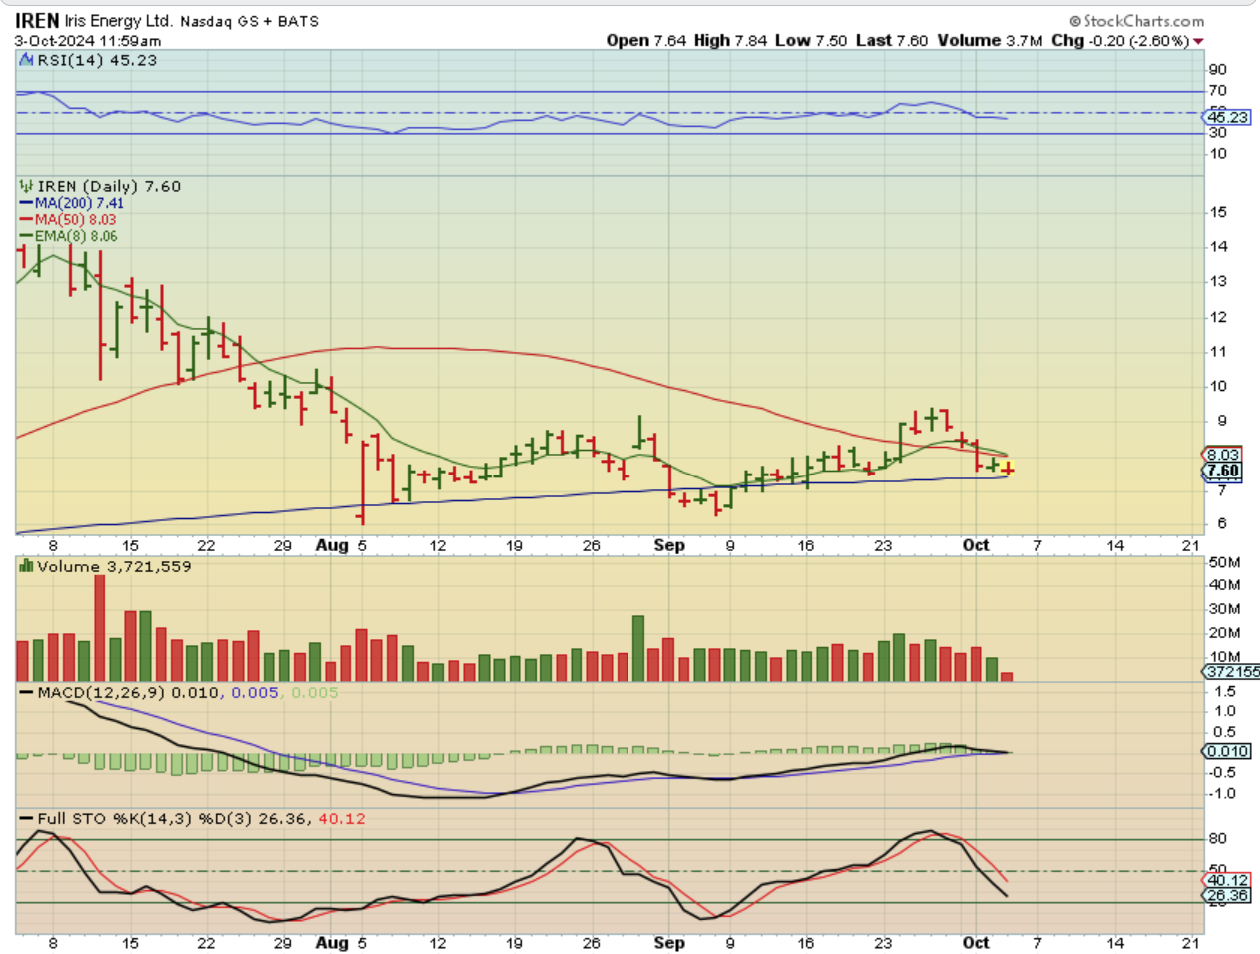
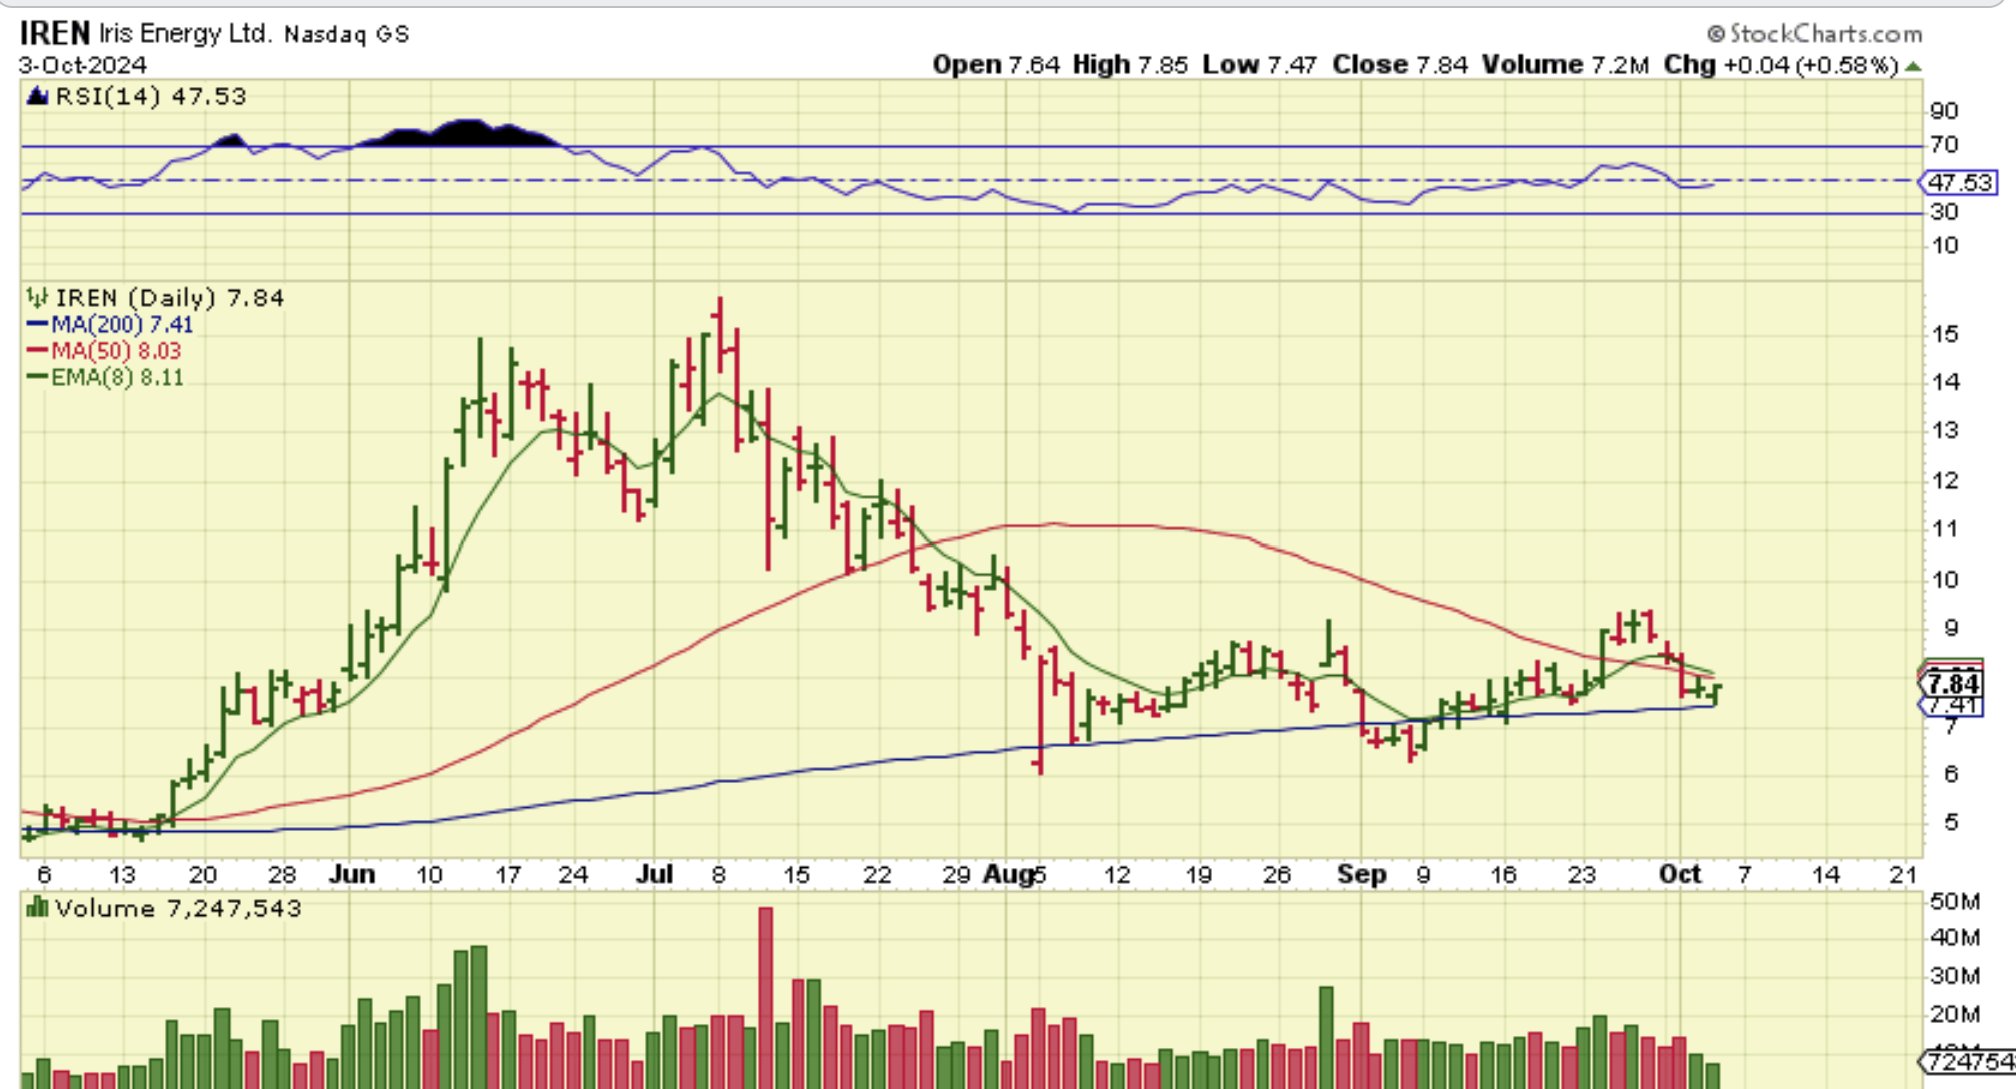
IREN WAS AT SUPPORT ON THE 200 SMA Midday, so I posted this in the commenting area as a decent place to start a buy at support with Bitcoin near day 60…
.
IREN had a very strong run in May to July, $5 to $15! It tripled or ran up 200% in 2 months! By the close IREN had the reversal in place. If it gets back above the 50sma next, this will really start to shape up, but as mentioned, it could already be a buy at the 200sma.
.
SOS has actually been travelling higher up along the 10sma (8 ema shown), and crawled under the 50sma. When earnings came out, it then broke out and has continued moving higher. This doesn’t look like much of a move yet, right(?), but it is actually almost 100% in September alone. And…
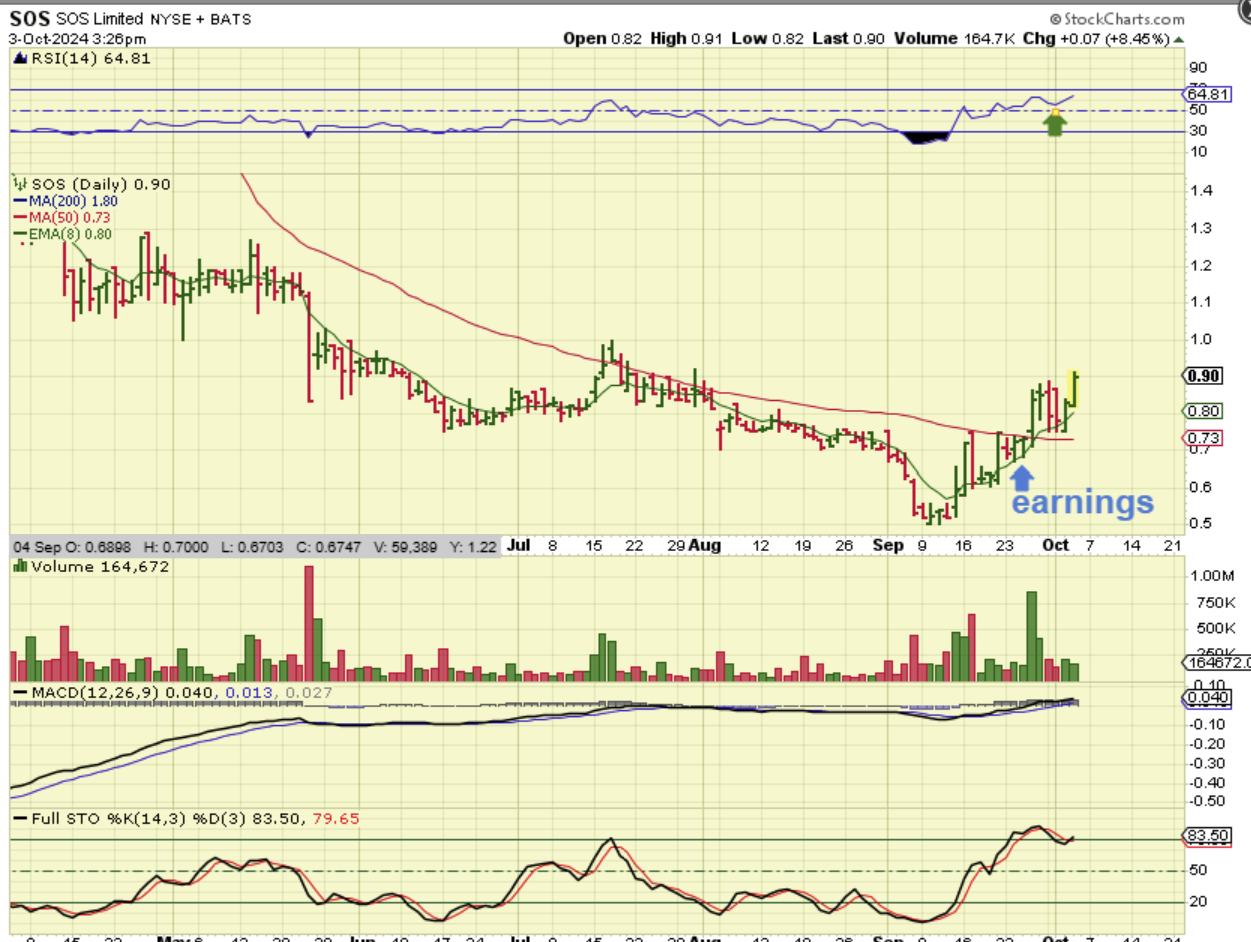
.
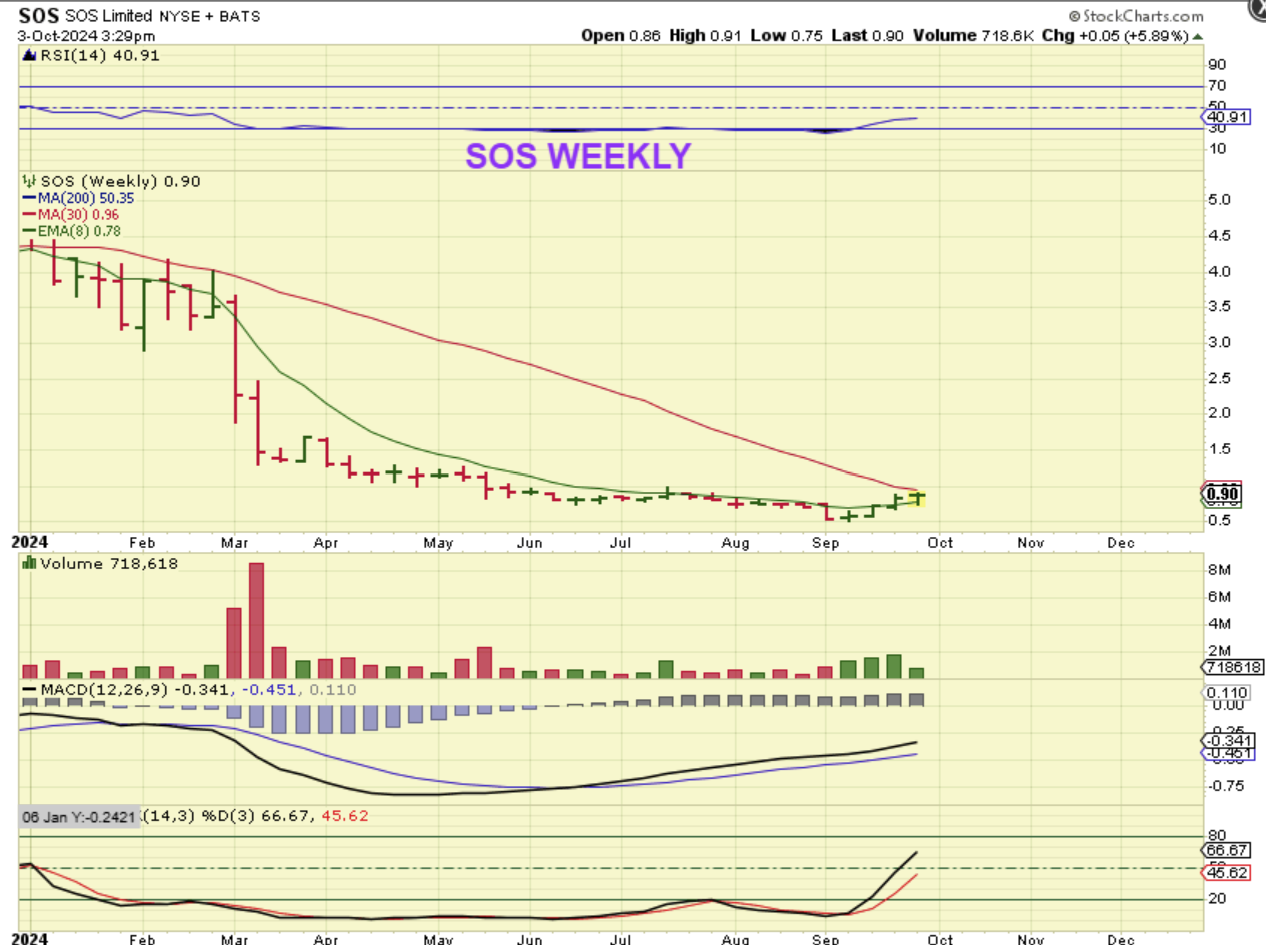
SOS WEEKLY – The potential is BIG if this base set up continues to play out with Bitcoin running.
.
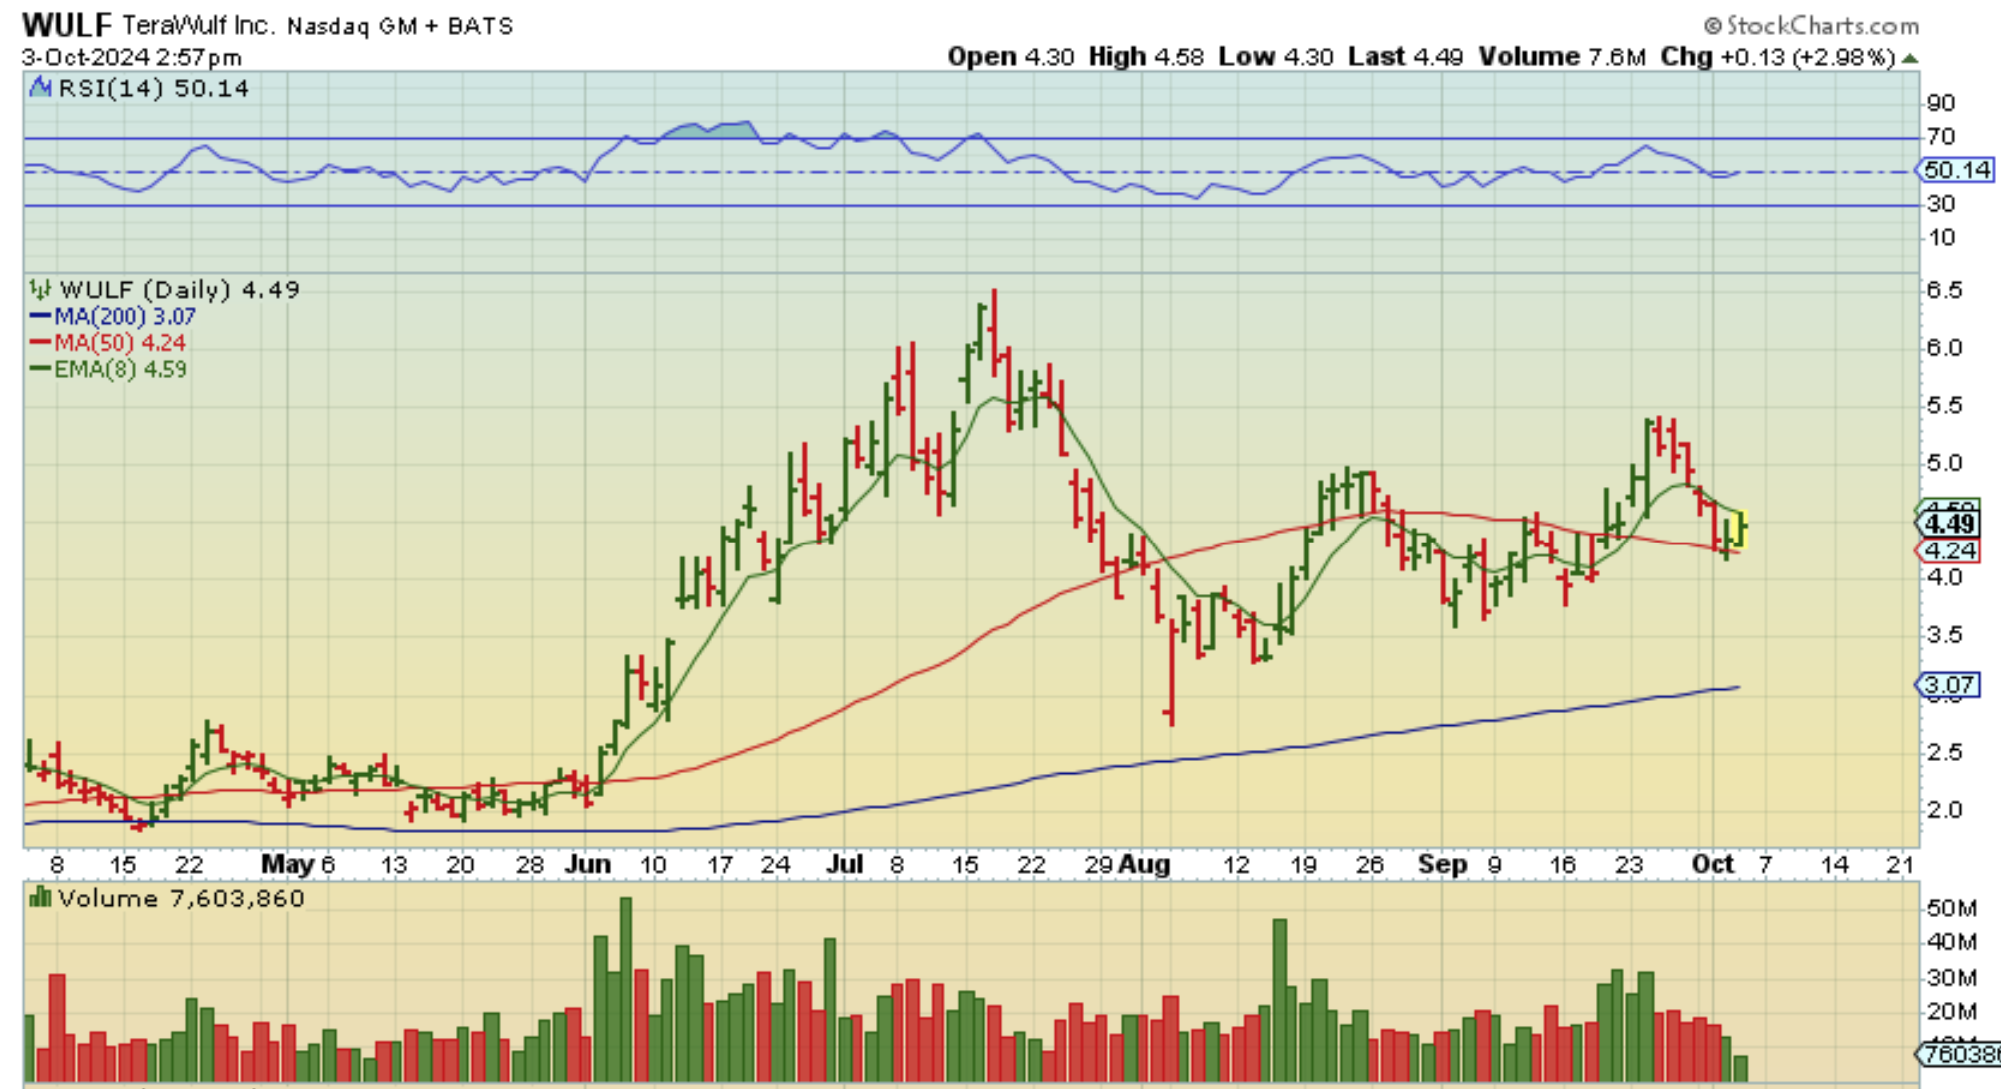
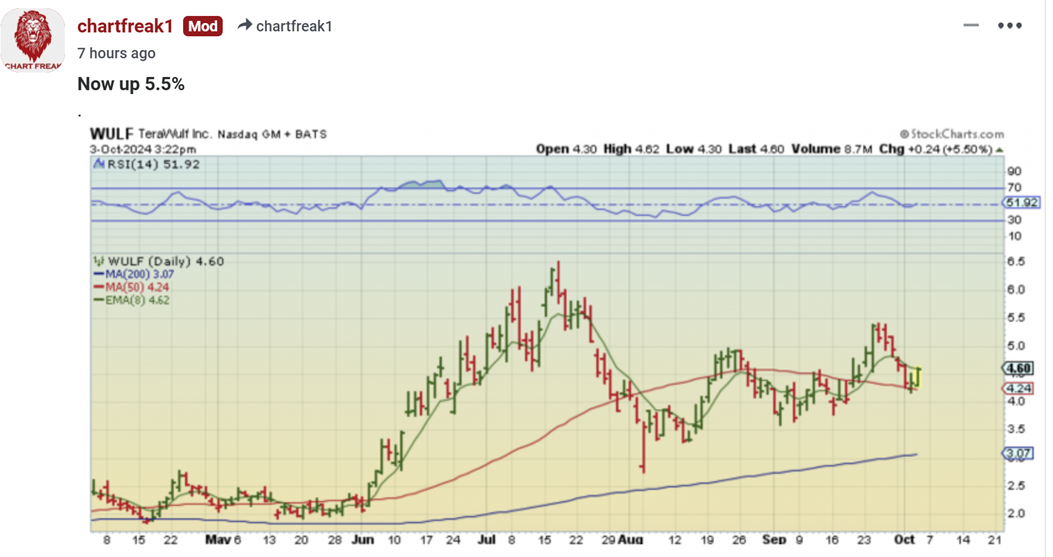
WULF was up while Bitcoin was at the lows –
1. WULF gapped slightly lower at the open and then reversed higher right at the 50sma,
2. So I posted this in the comments, because now it was up almost 3% nearing the final hr of trading with Bitcoin near the lows…
.
.
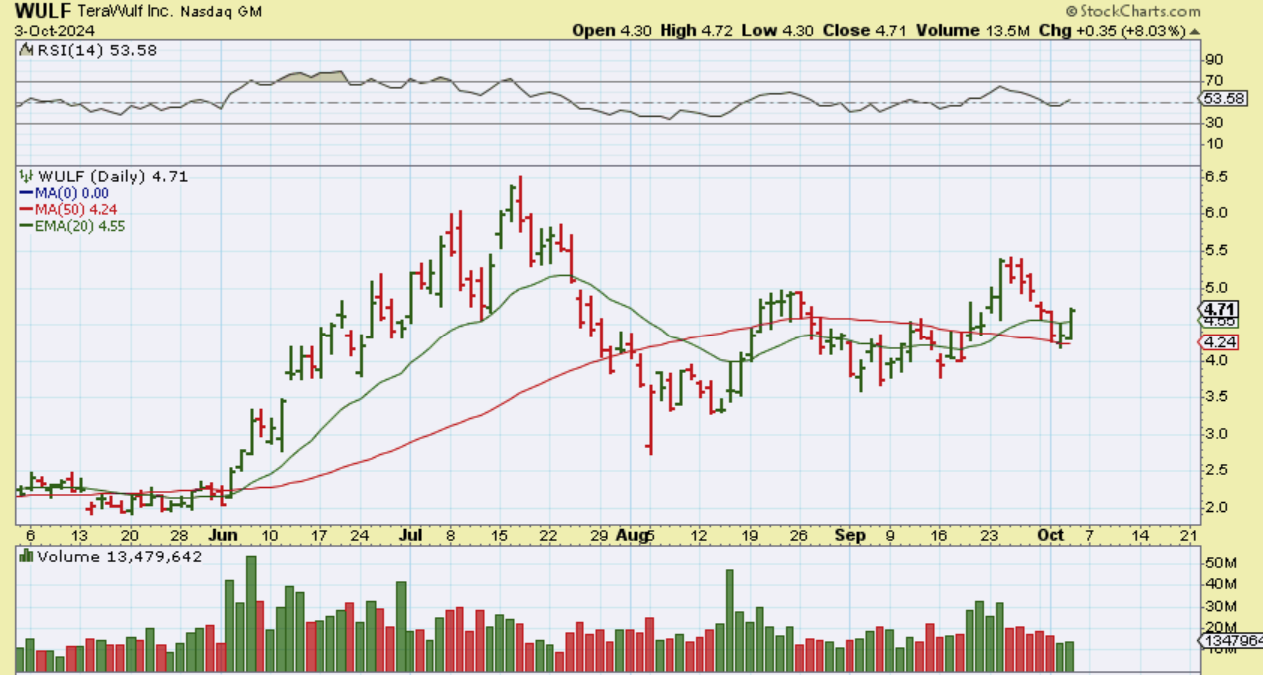
WULF was then up 5% in the final hr of trading, about half of an hr later, and it was also now pushing on that 20ema. And then…
.
WULF closed up 8%, pushed above that 20 ema, and this was while Bitcoin kept dipping down to the lows. So this was a nice 8% gain off of the 50sma yesterday.
Let’s see what happens on Friday, but Bitcoin MIGHT have the lows in place and I am seeing some slow progress in the crypto stocks. I also have put out that regular warning: These stocks can Open Green, drop 3-4% into the Red, and then close up 8% by the close. These may not be for everyone, so start small and see how things go. There will be Plenty of time to add along the way if we get a nice solid run.
.
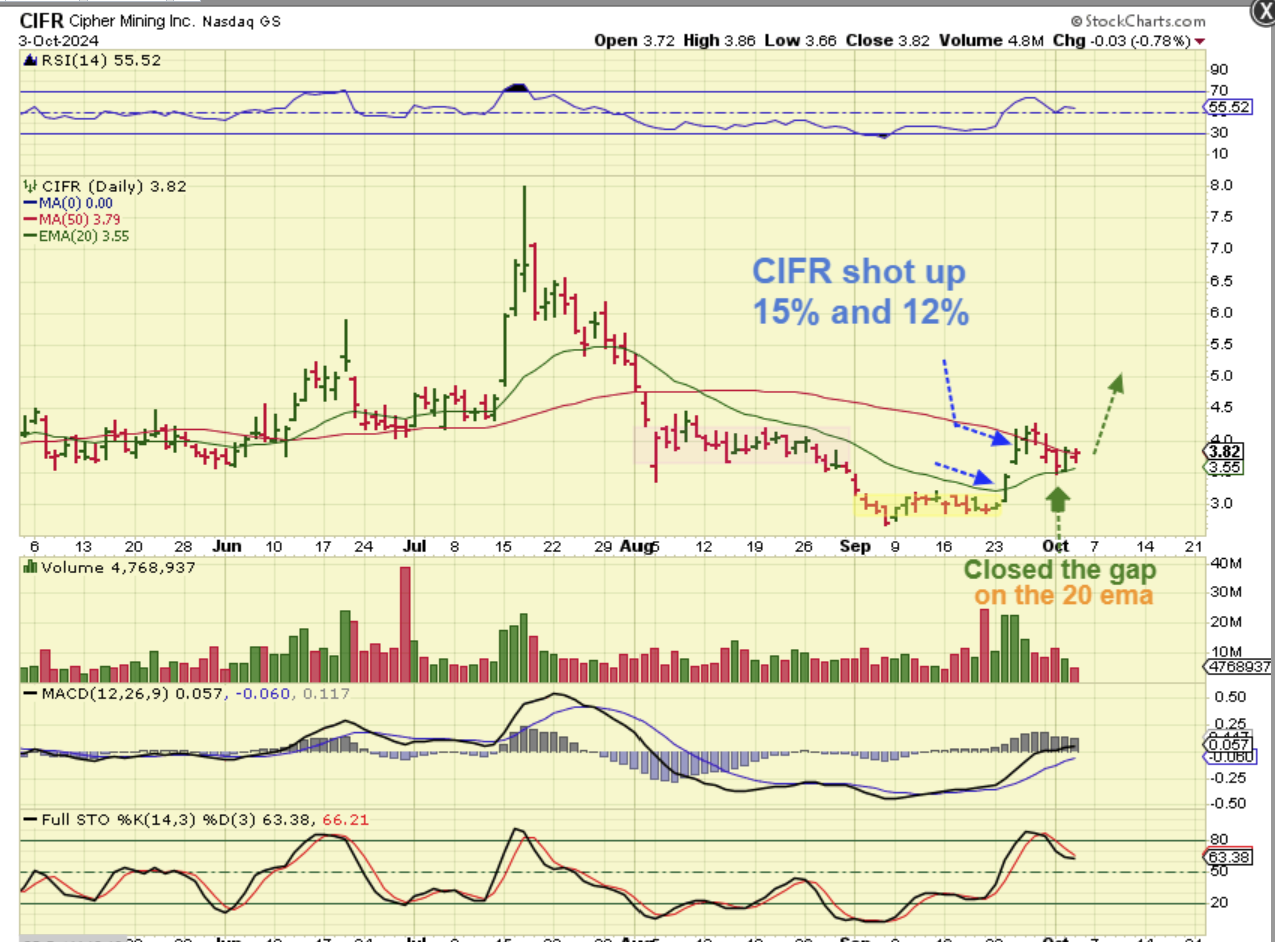
CIFR – Shot up recently on some good news and it was up 15% and 12%, but guess what? The gap filled and it has held up at the 20ema. CIFR is ‘PINCHED’ between the 20ema and the 50 & 200sma, but when Bitcoin rises out of the lows, this could really move higher quickly.