September 2nd, The Weekend Report: Observations
.
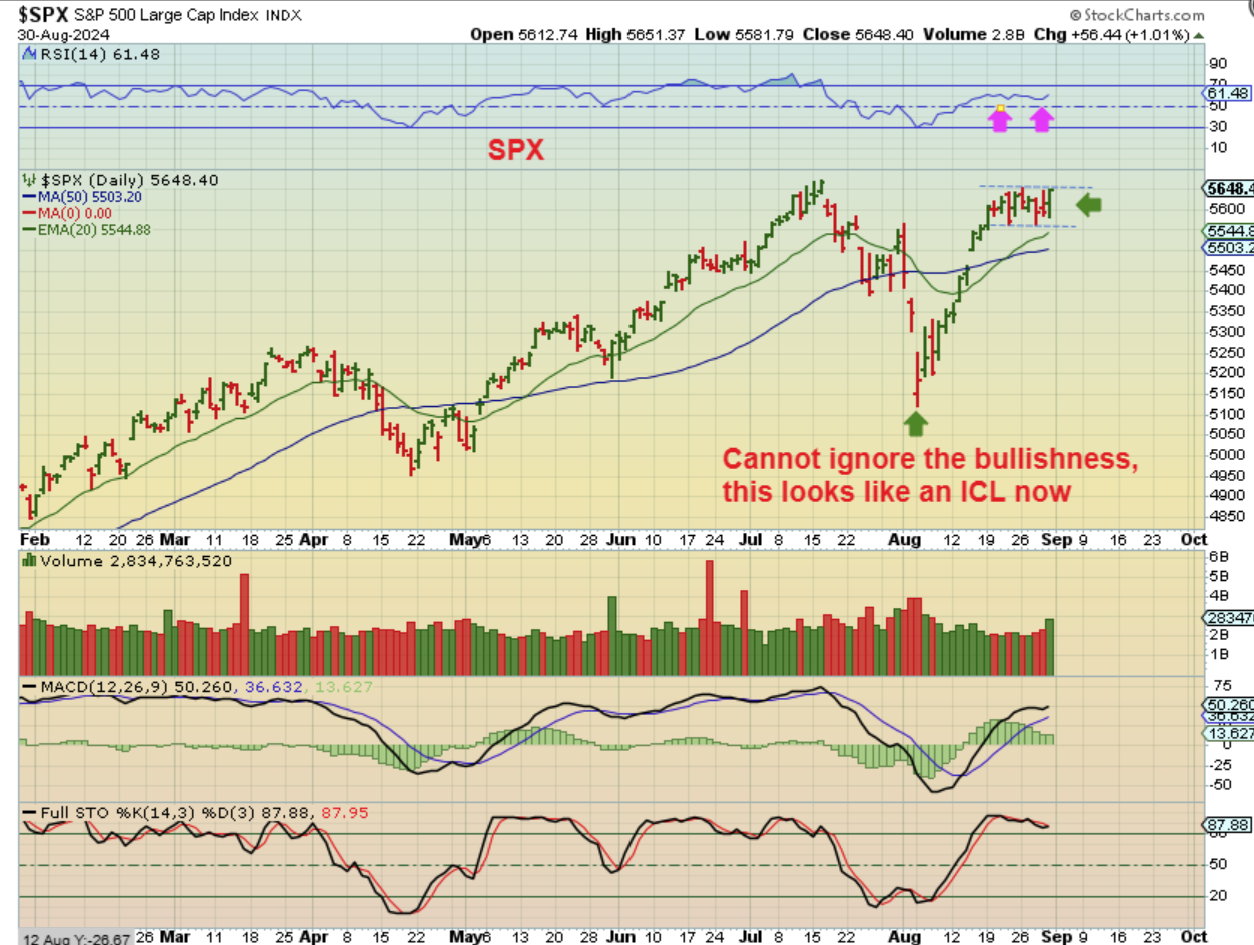
SPX DAILY – As of Friday we do see a bullish set up in the SPX Large Cap index. It looks ready to break out and it does have time to do so in this daily cycle. So, this really looks like an ICL, an anomaly at 3.5 Months ahead of the last ICL. And the weekly chart…
.
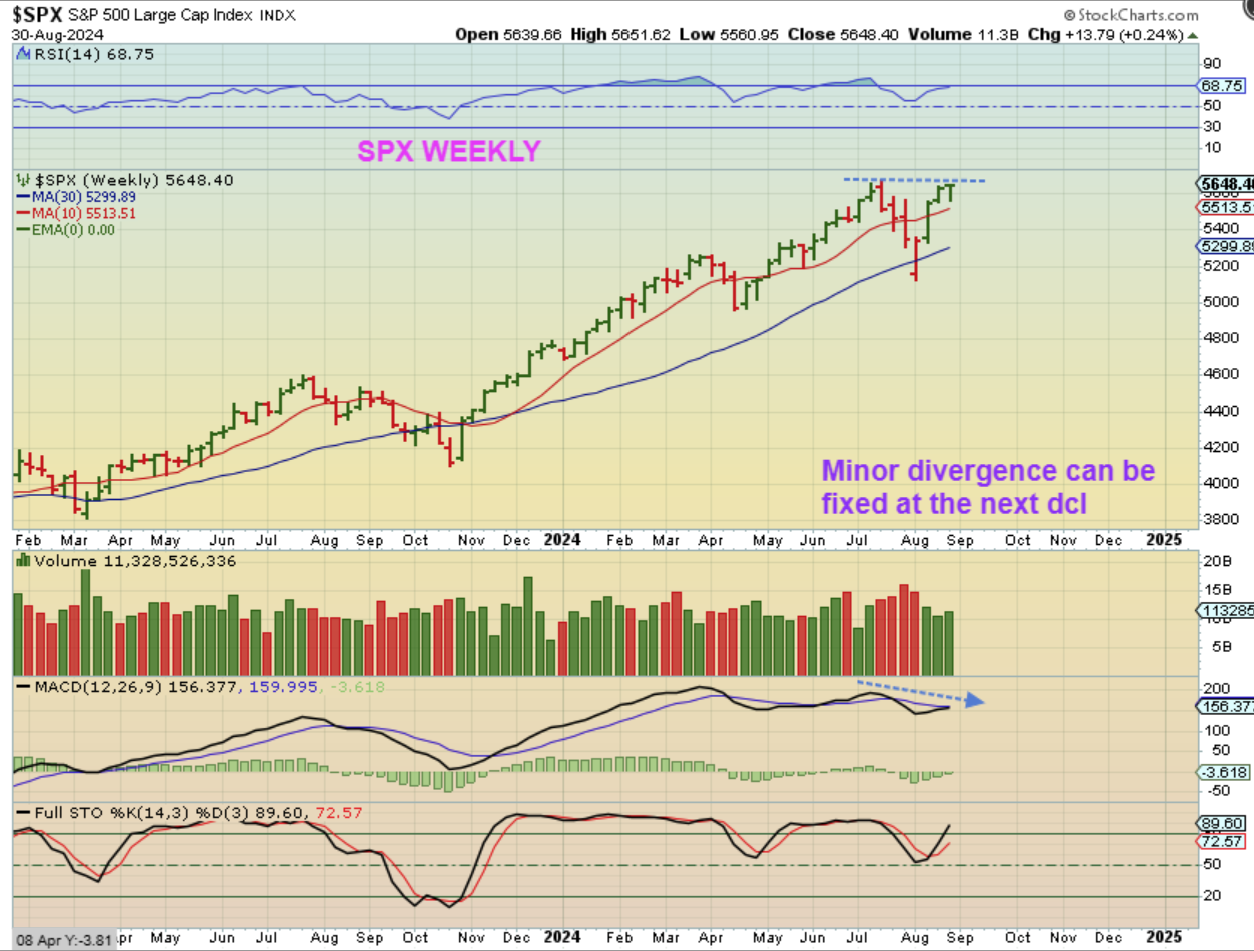
SPX WEEKLY – The weekly chart looks like a V-Bottom recovery too, and it broke above the downtrend too. That means that this would also make this look like an ICL took place on 3+ months after the last one in April.
.
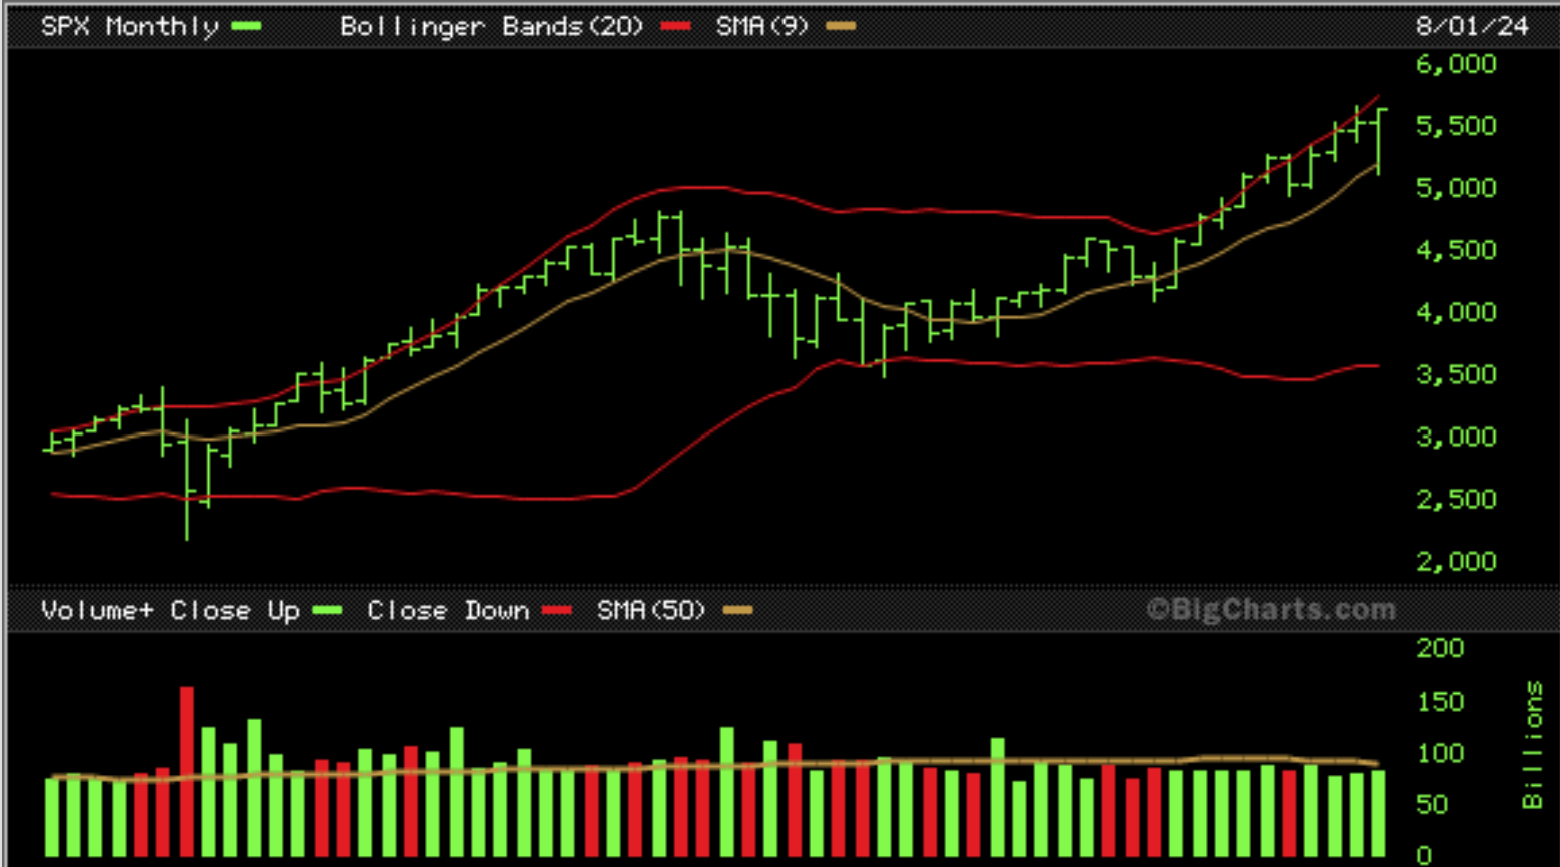
SPX MONTHLY – August has ended so a look at the Monthly chart shows a large drop and reversal monthly candle. ALSO…
.
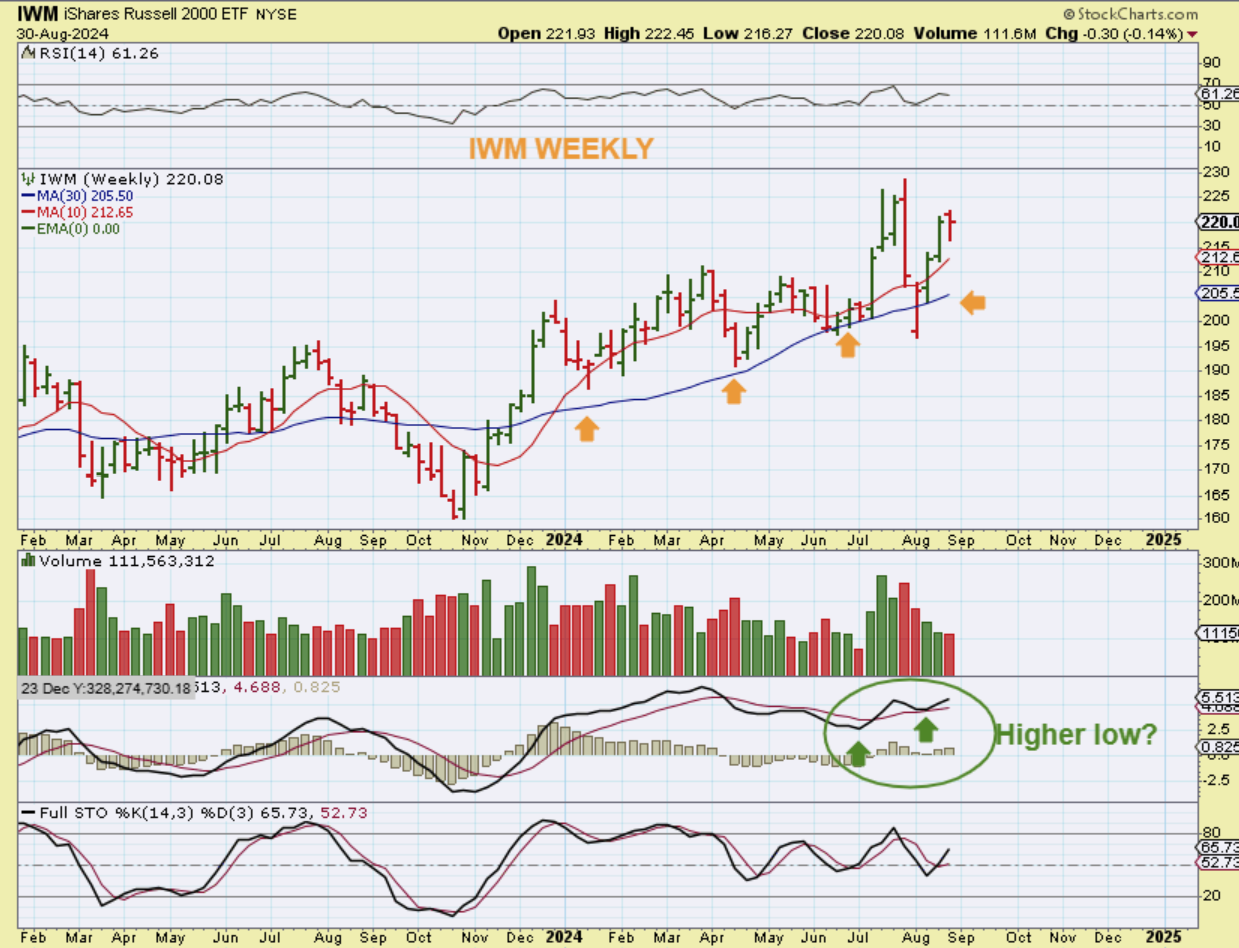
IWM WEEKLY –
When we take a look at The IWM, we see that it actually moved up and along the 30 week ma in 2024. With the ICL selloff recently, it broke below the 30 week ma, but it never closed below it on the weekly chart. That looks like a ‘shake out’ and a rally higher. Even the MACD here stayed noticeably healthy, so this doesn’t look concerning, HOWEVER, the Tech sector does not look quite as healthy with the QQQ and SOXX…
.
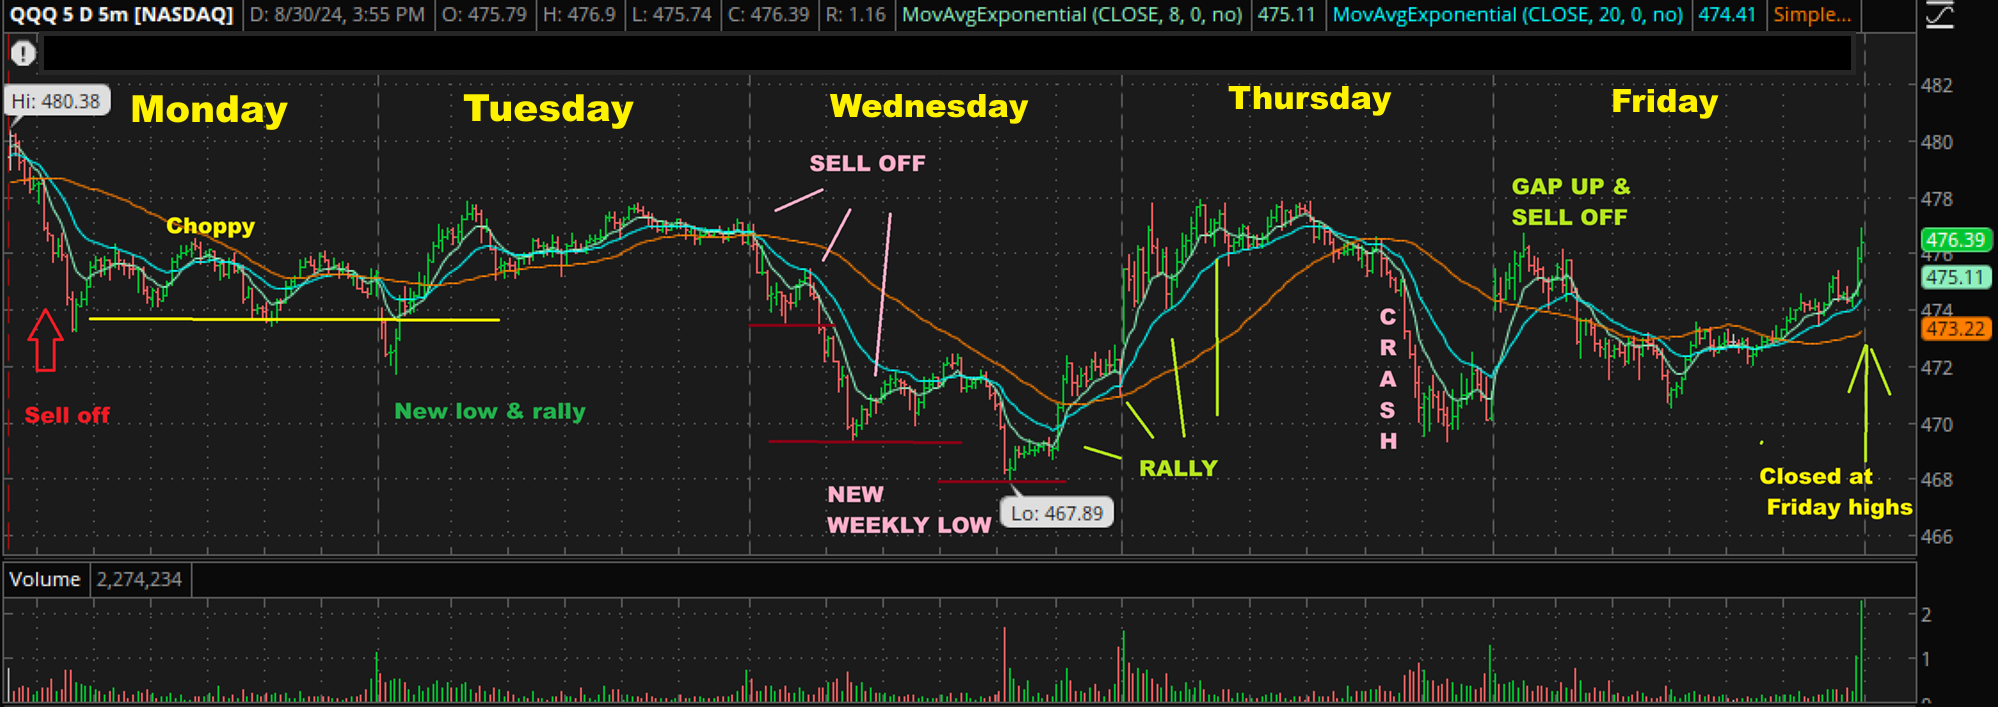
Just to show you what kind of a week we had last week, I have a 5 day chart of the QQQ (INTRADAY)- This is Horrible, please read this chart left to right, Monday to Friday. We dropped, chopped, popped, dropped, chopped, and so on.
.
That horrible Choppiness doesn’t show up in the weekly chart. I want to look at the Tech Sector and show you the differences.
.
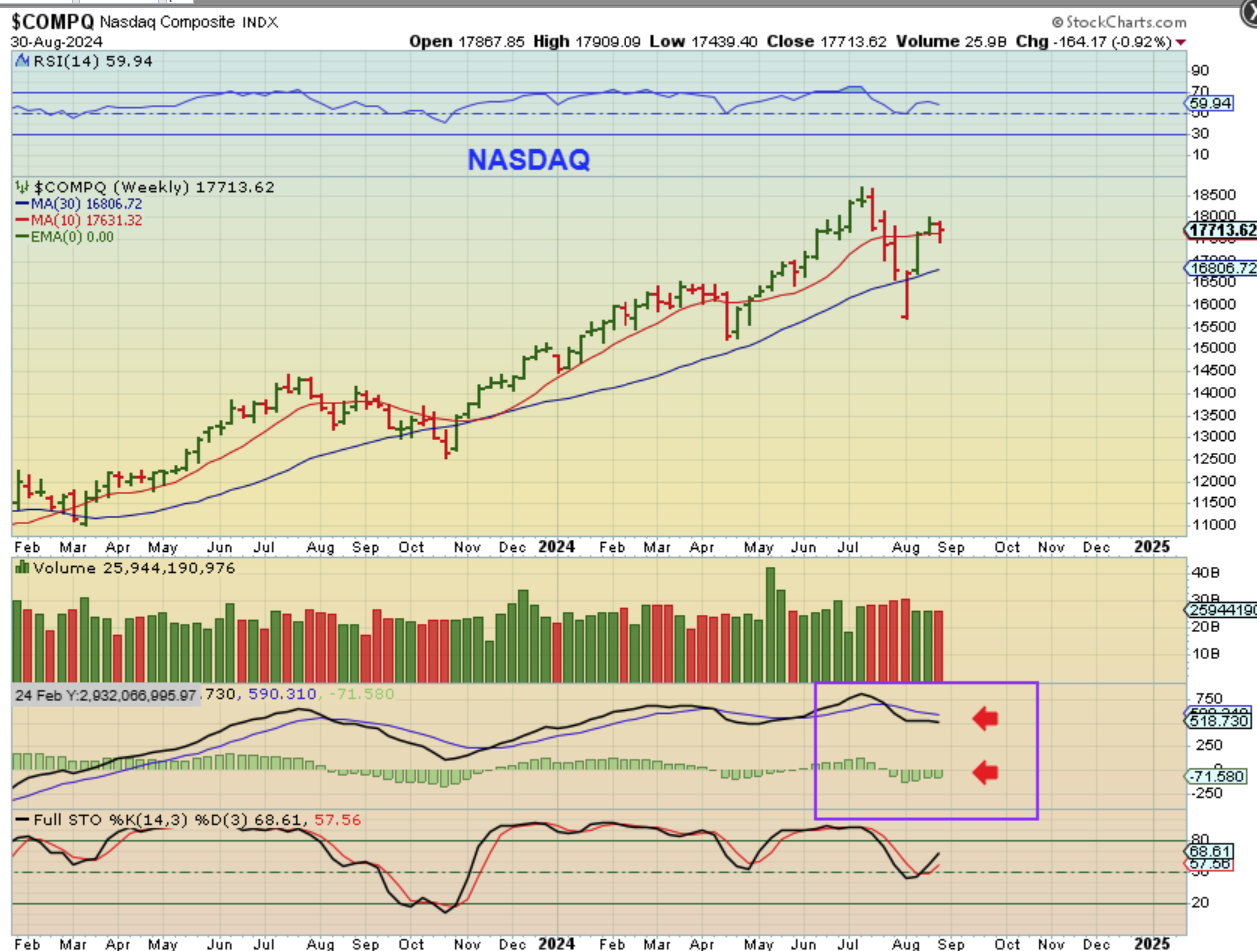
THE NASDAQ WEEKLY looks fine, but notice that unlike the SPX & IWM, The Nasdaq is only halfway back to the former highs. Also look at that MACD, and that is NOTHING like the IWM MACD. The Nasdaq MACD is not curling higher, so tech may be weakening.
..
.
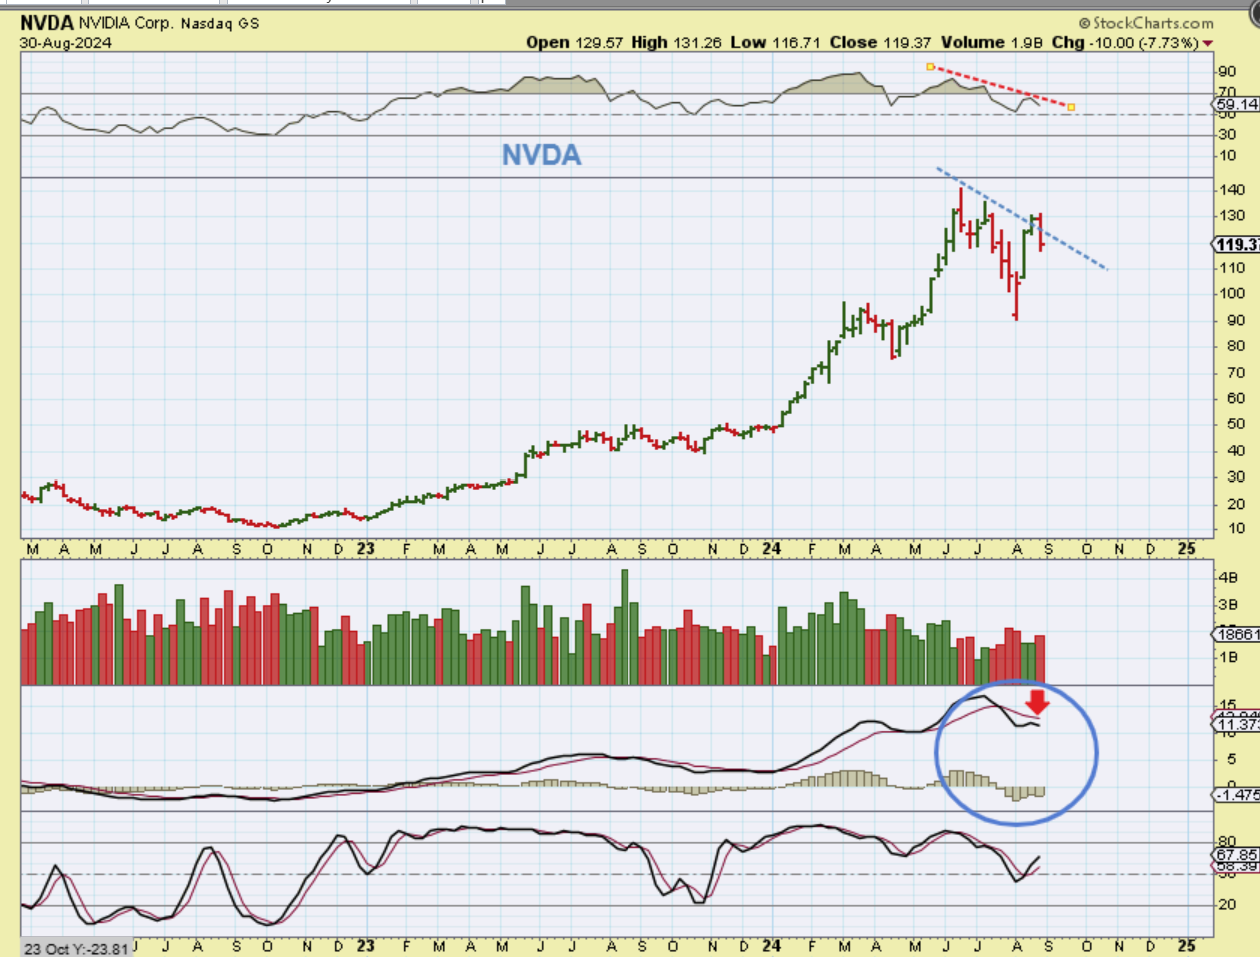
Let’s look at NVDA WEEKLY:
NVIDIA almost closed at the lows and had about an 8% down week, so if this finds follow through lower, it could drag down the markets.
.
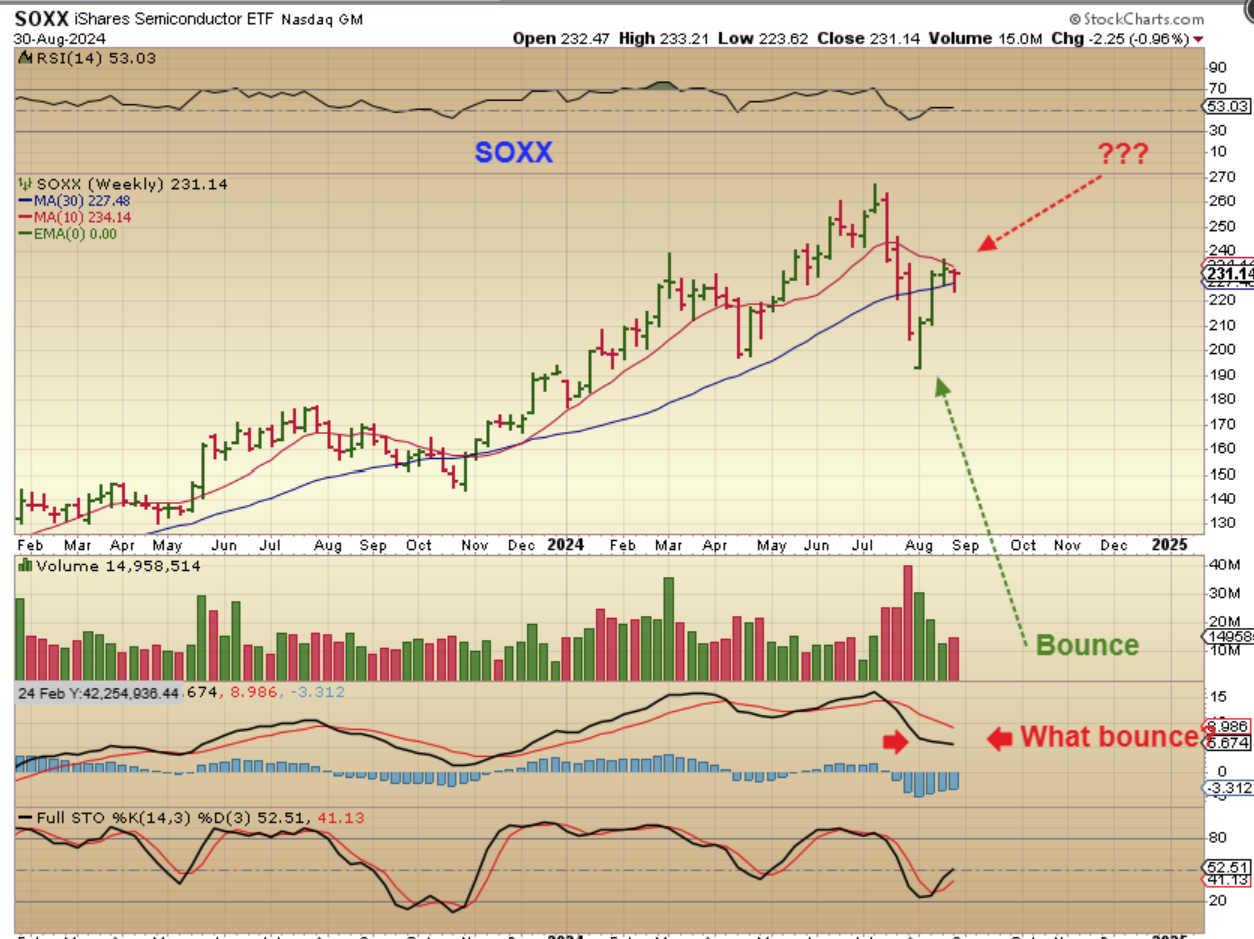
And then we look at The SOXX WEEKLY:
This has been much weaker than the SPX & QQQ, since it has only recovered half of that drop & still remains under the 10 weekly ma. Also, take a look at that MACD and it looks pretty weak with this bounce. That was a strong bounce with price, but it didn’t turn the MACD up at all? So…
.
So the various market sectors seem mixed strength-wise, with the SPX & IWM near the highs, but the tech Sectors remaining fairly weak with the recent bounce.
.
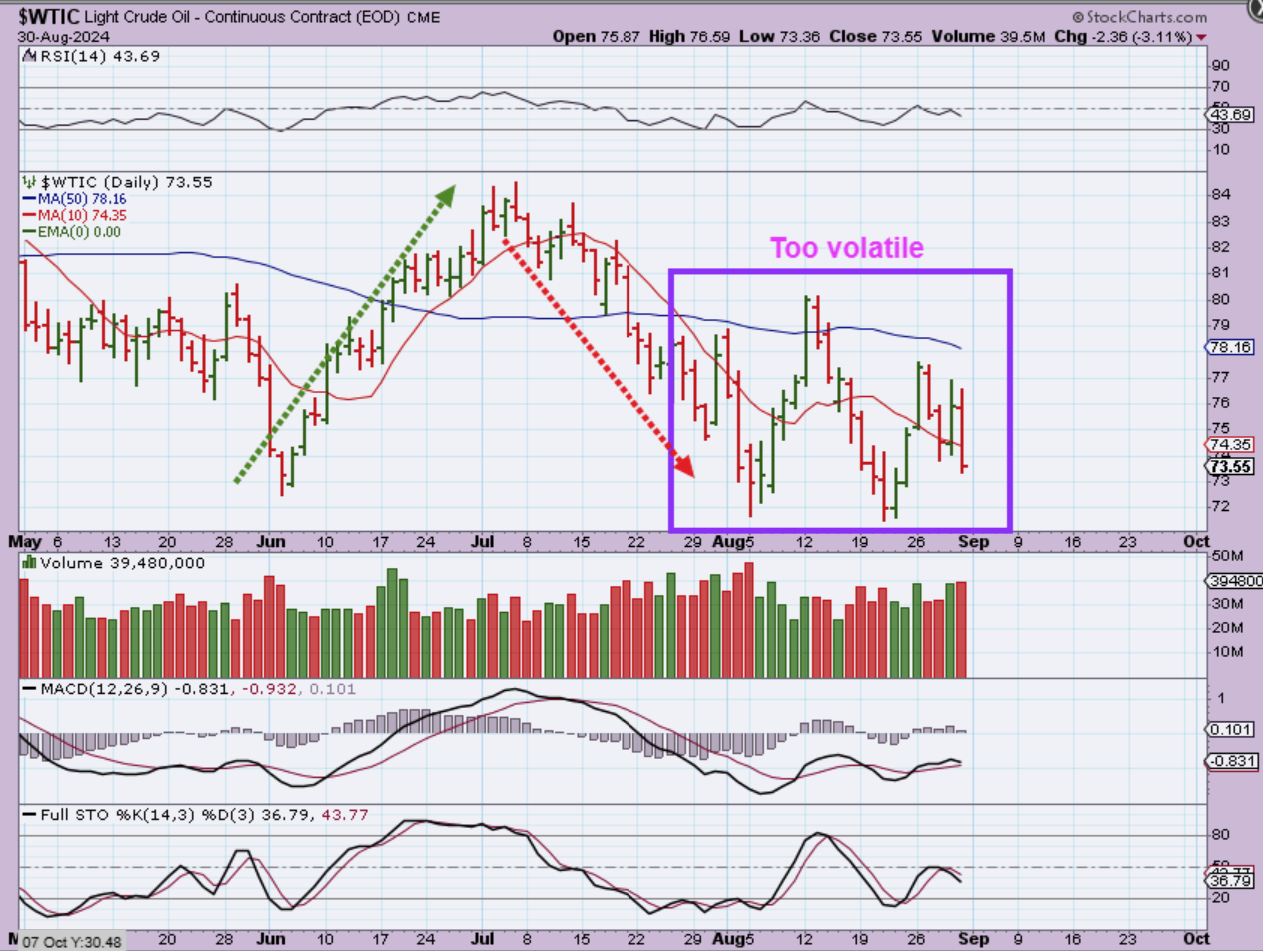
WTIC DAILY – Oil is very volatile and choppy, and as you can see, it was down over 3% for the week.
.
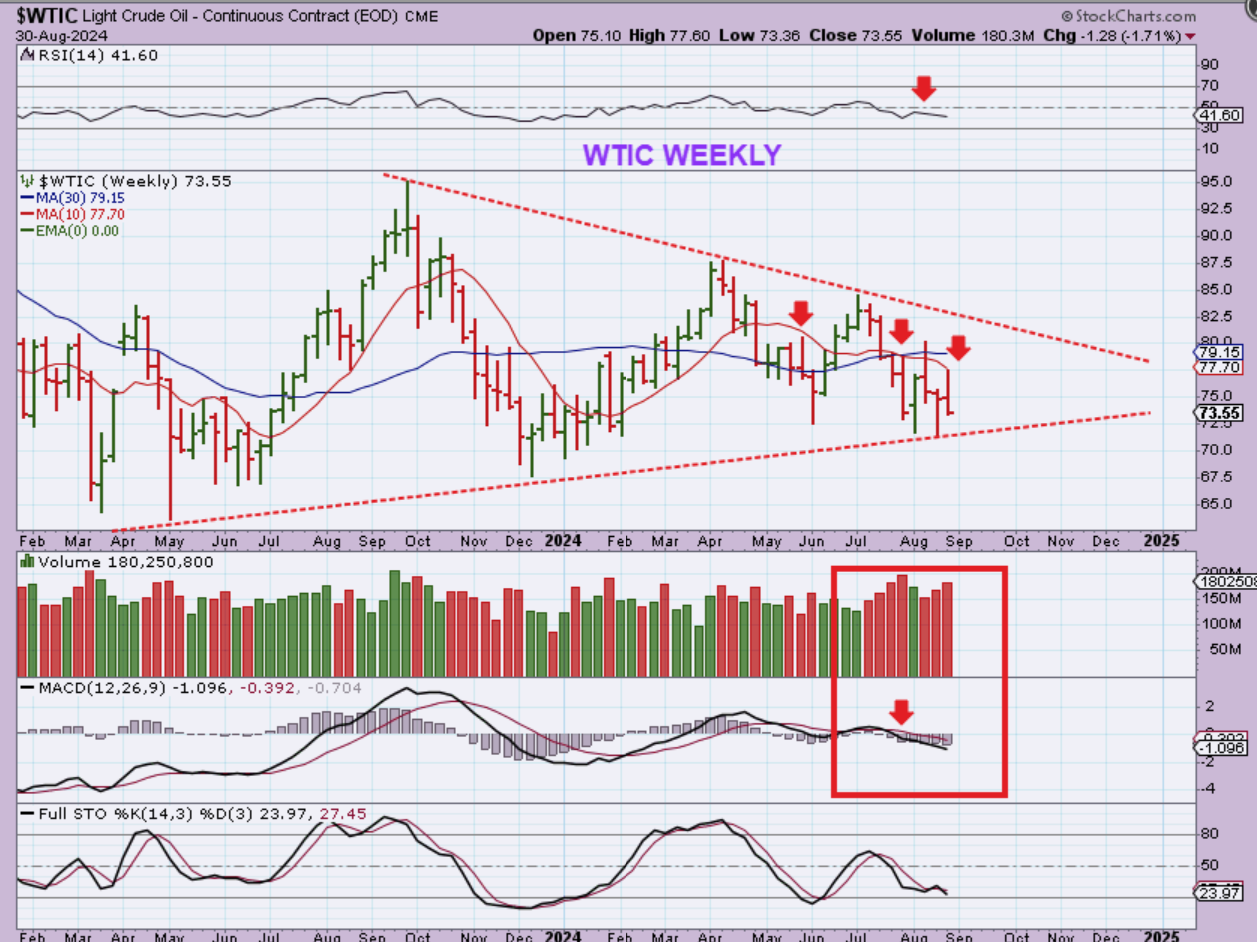
WTIC WEEKLY – When we take a look at that triangle that I have been pointing out, we can see that the price reversed again at the halfway point.
– Price is unable to get back up to the top of the triangle
– Price was rejected again at the resistance of the 10 & 30 week ma
– The RSI & MACD are pointing lower.
– Oil looks weak.
.
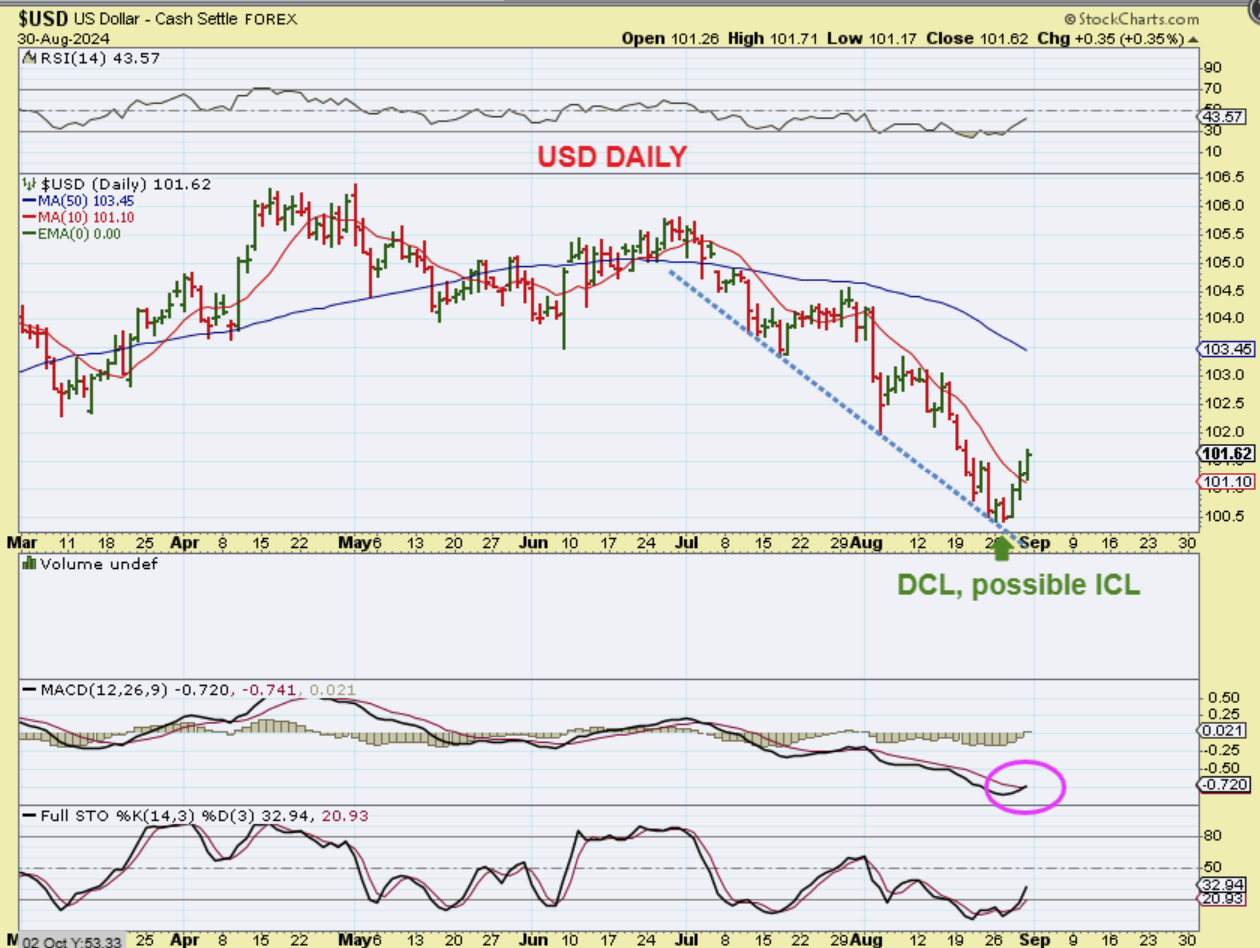
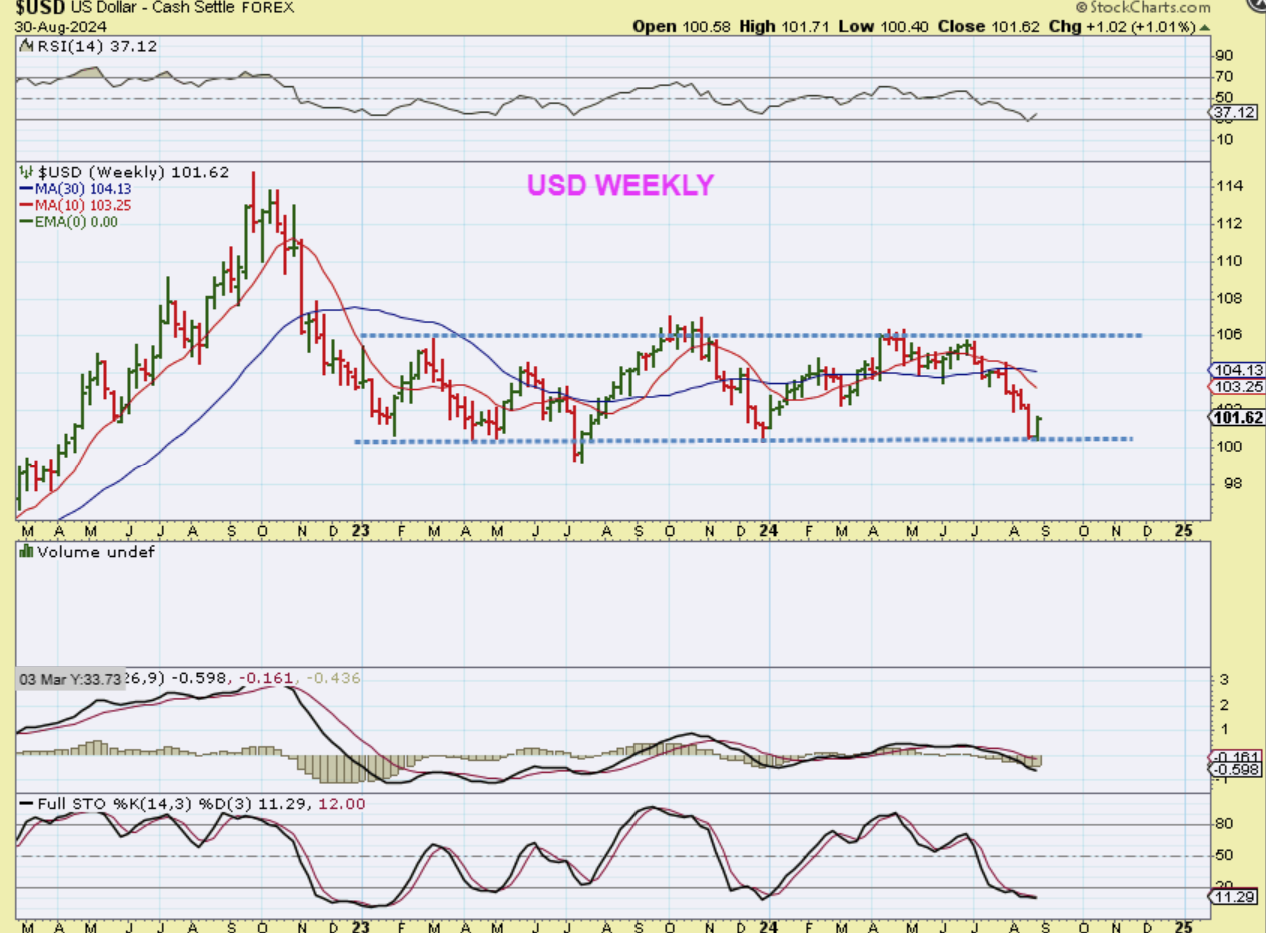
The USD was dropping steadily in July and August, but recently it has bounced out of the lows. It was due for a dcl and even an ICL, so we have a dcl here, and possibly even an ICL. IF THIS IS A USD LOW, will it hinder Gold & Silver?
.
IF THIS IS A USD LOW, will it hinder Gold & Silver as it runs higher? I think that it could.
.
So The USD WEEKLY reversed right where it would be expected to, and this could run fairly well if this is an ICL. If it is, that could peak the Gold run in the short term. DO TAKE NOTICE THAT THE USD SOLD OFF FROM JULY TO AUGUST .
.
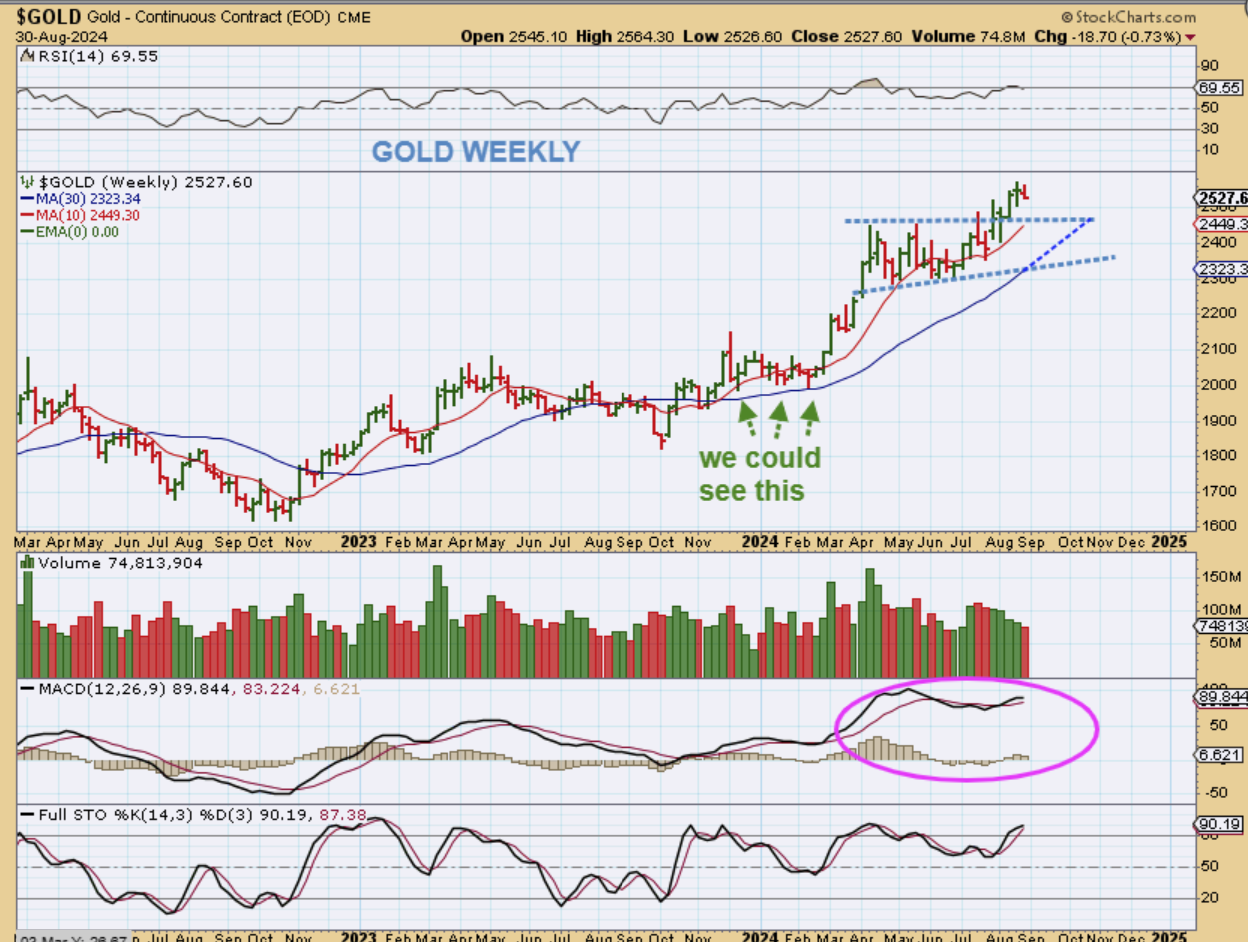
GOLD WEEKLY – As the USD sold off from July to August, Gold did push higher July to August. If The USD rallies out of this low that it looks ready to put in, GOLD might start to pull back, especially if the USD puts in a stronger run. We could see a choppy period as seen on this chart and back test the 30 week ma.
.
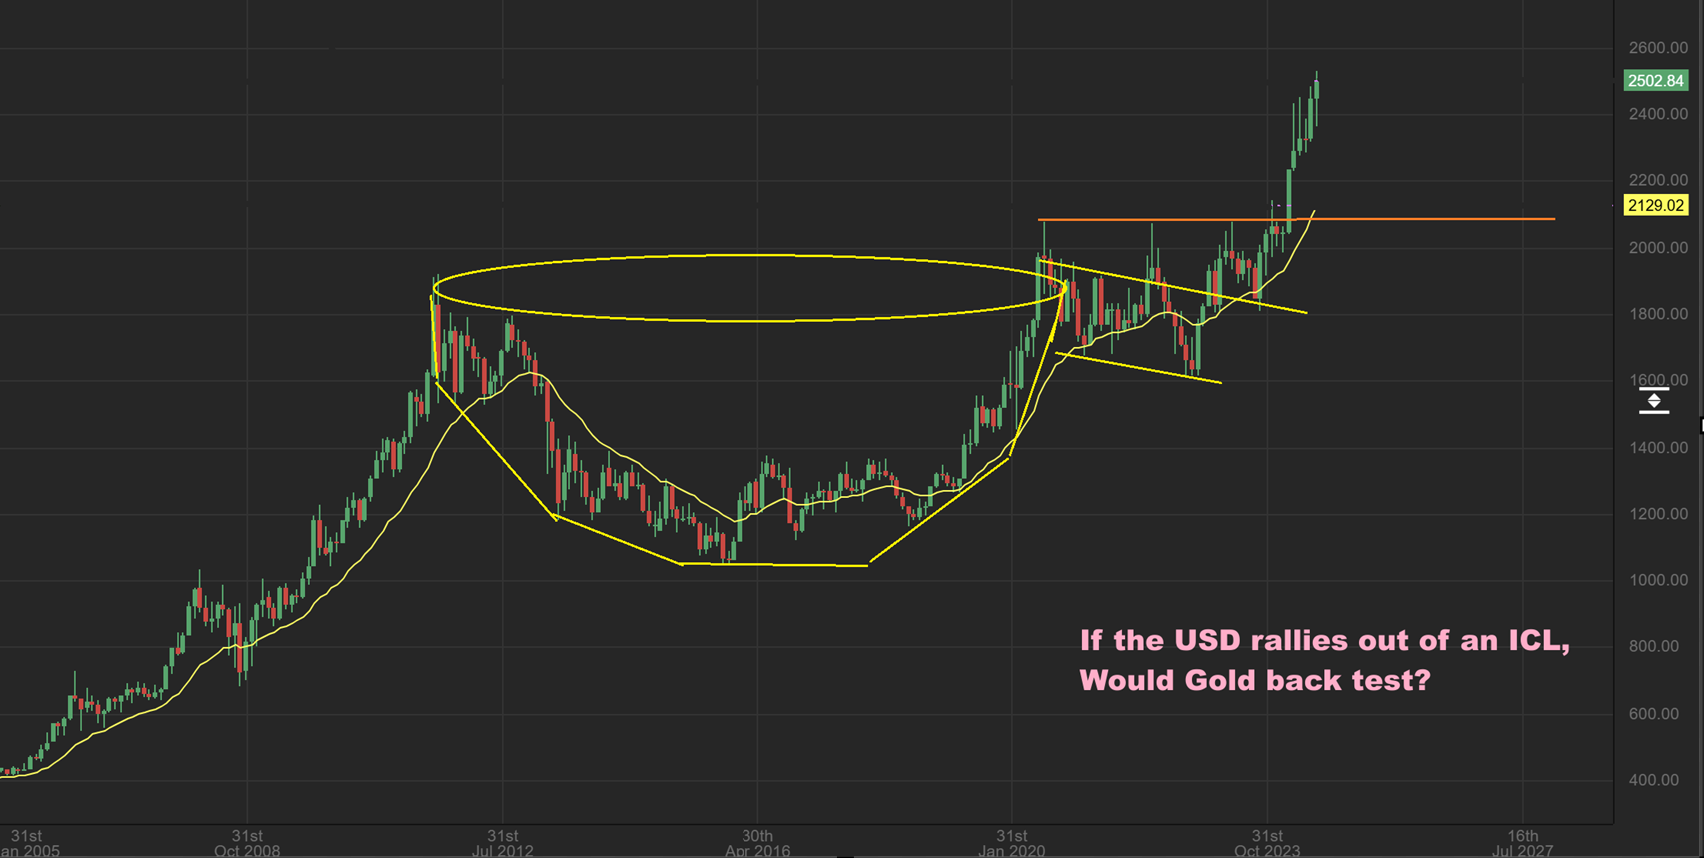
GOLD MONTHLY – Golds Monthly chart shows a beautiful bull rally out of that Cup that I used to point out. It did go straight up in 2024 on a Monthly basis, and again, I’m wondering if we’re going to see a pullback into an ICL start soon if the USD bottomed with an ICL of its own.
.
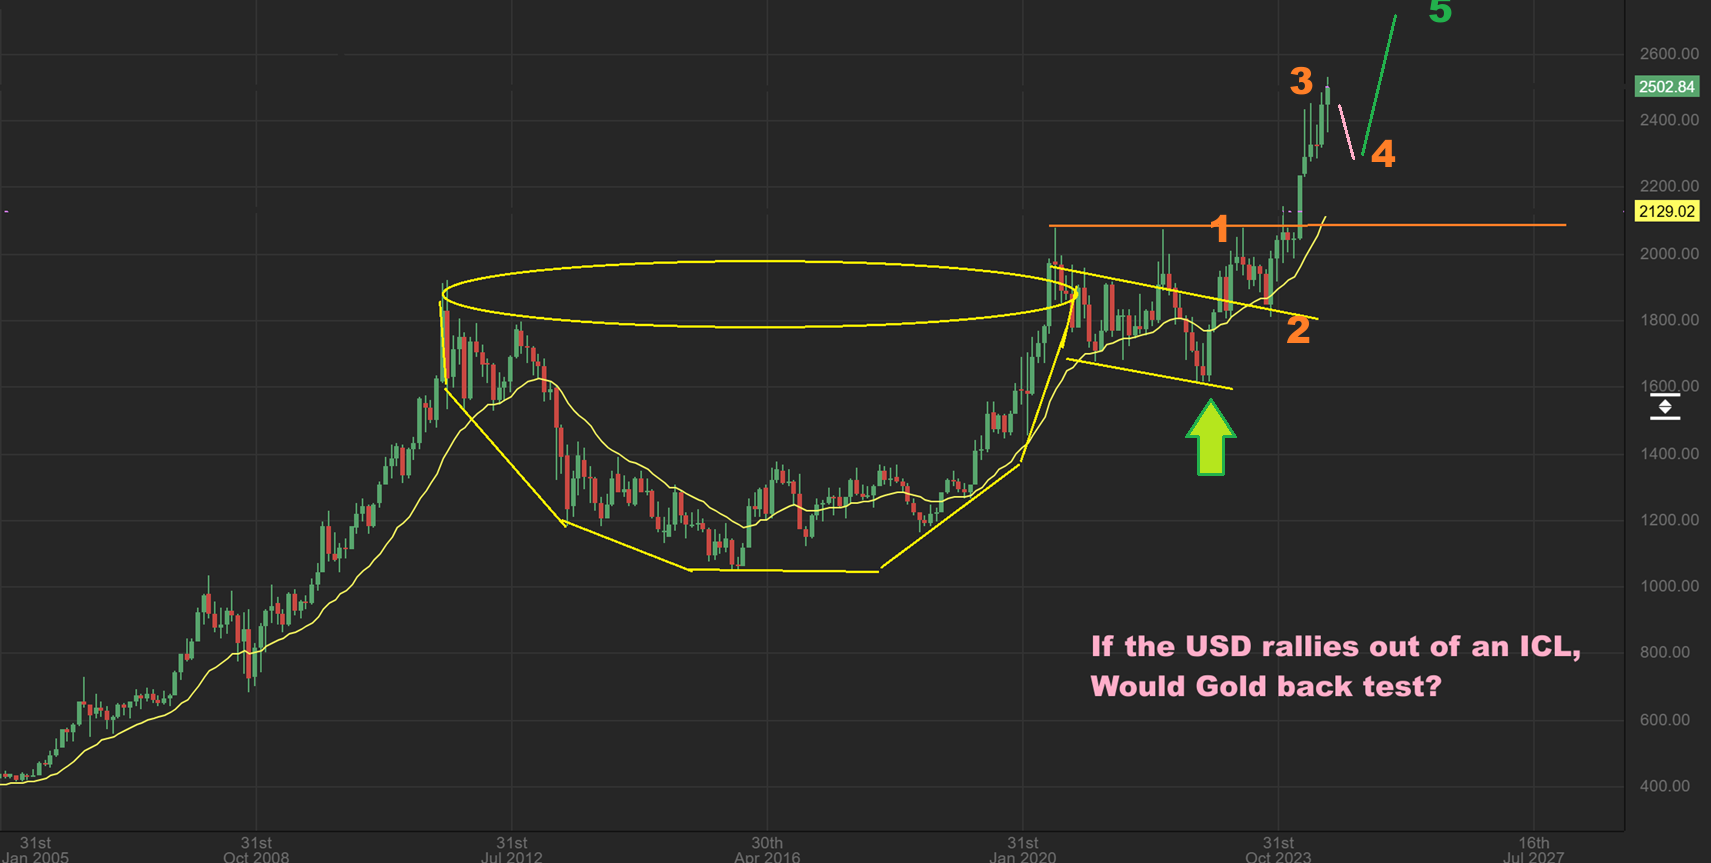
GOLD WEEKLY – If we are going to do a 5 wave run higher out of the Cups’ handle low, the next dip into the ICL would be wave 4 and then we’d see another run higher into the end of the year.
.
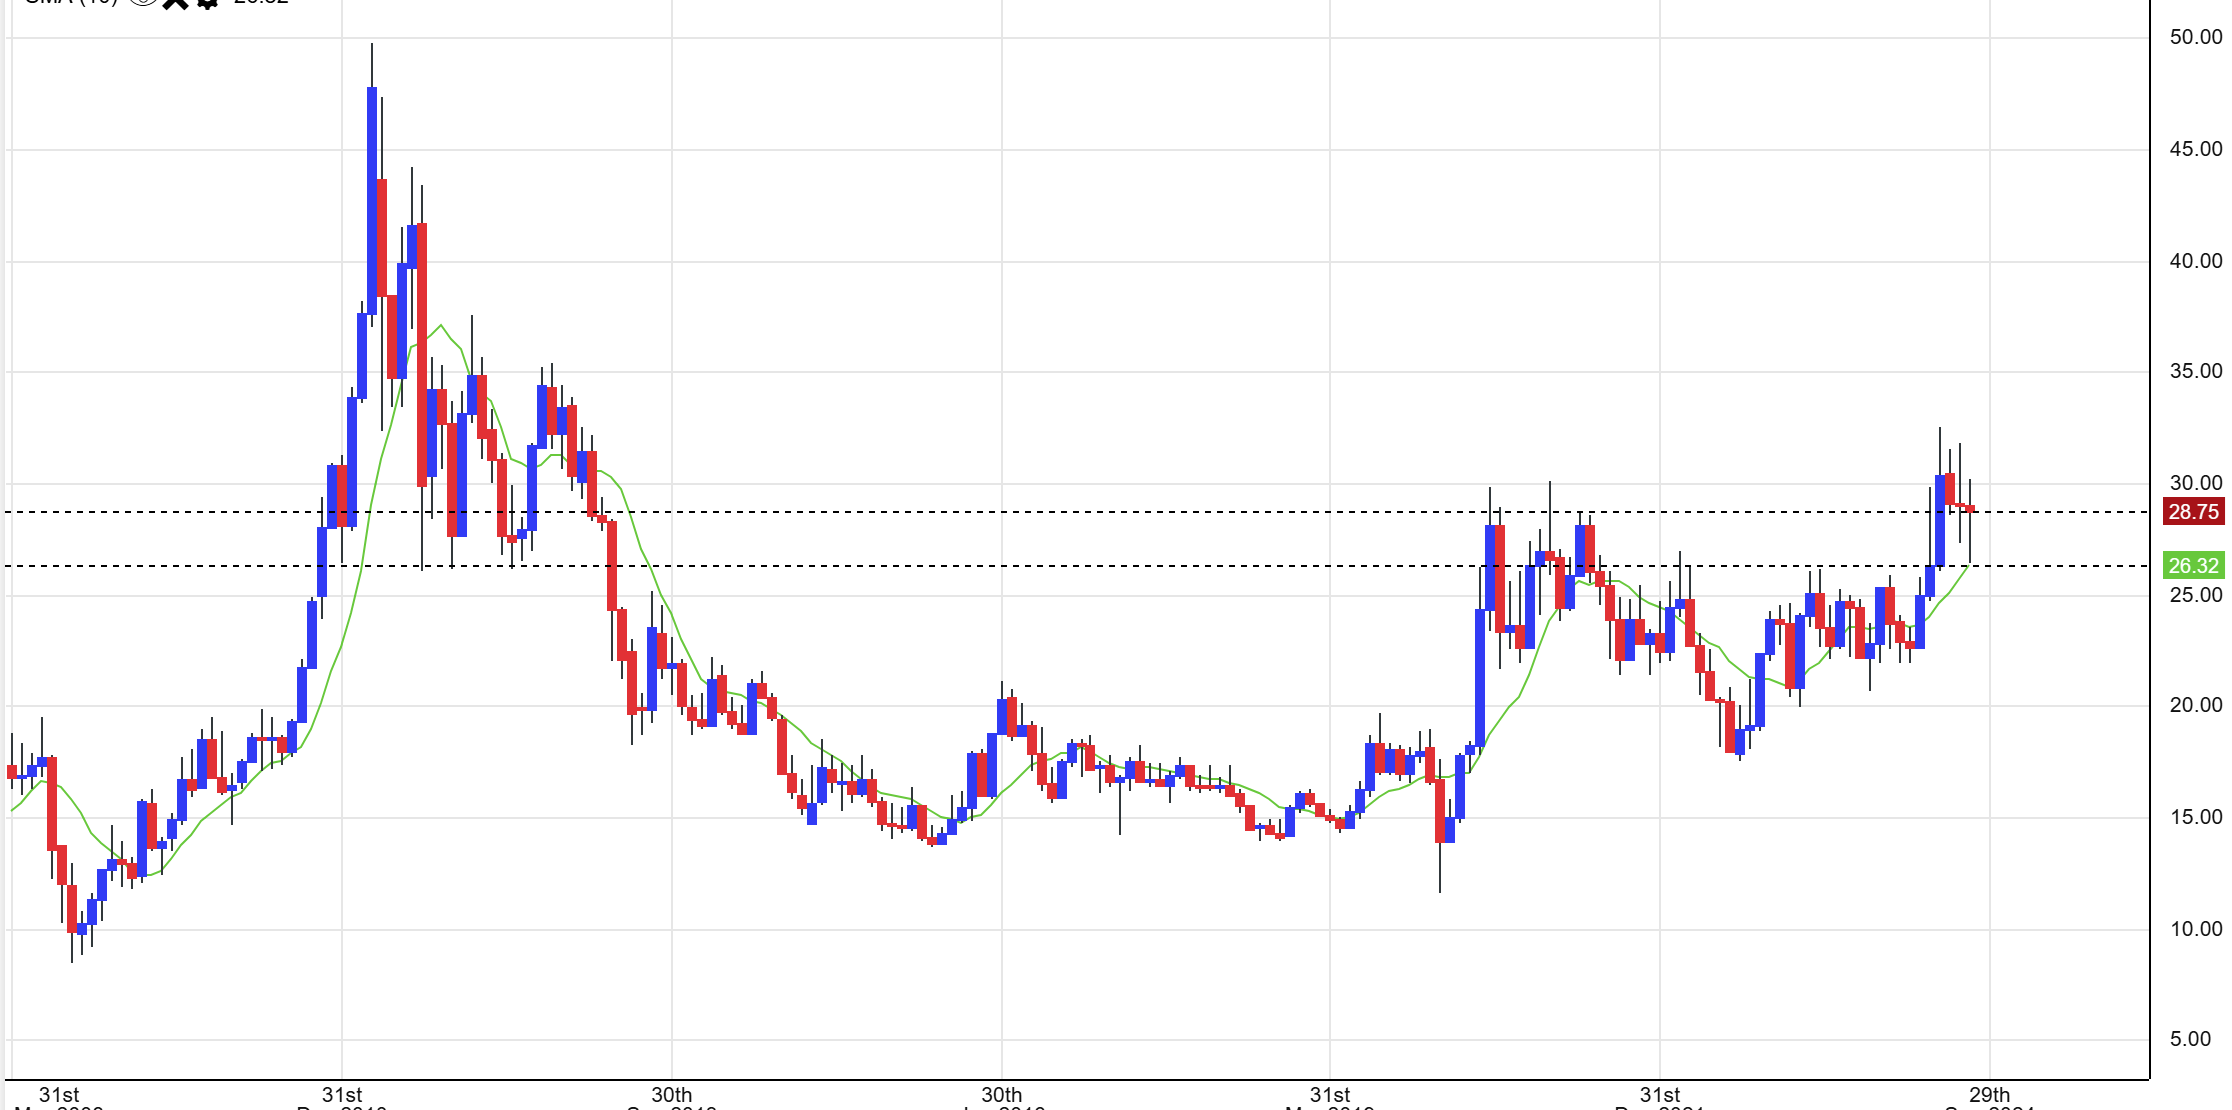
SILVER MONTHLY – Silver bounced off of the 10 month moving average and pushed higher, but did not close at the highs this month. It is also obvious that Silver has not been as strong as Gold, since Gold is at all-time highs and Silver is just trying to break out from this consolidation area. Once Silver gets running though, it usually makes up for any lag quickly.
.
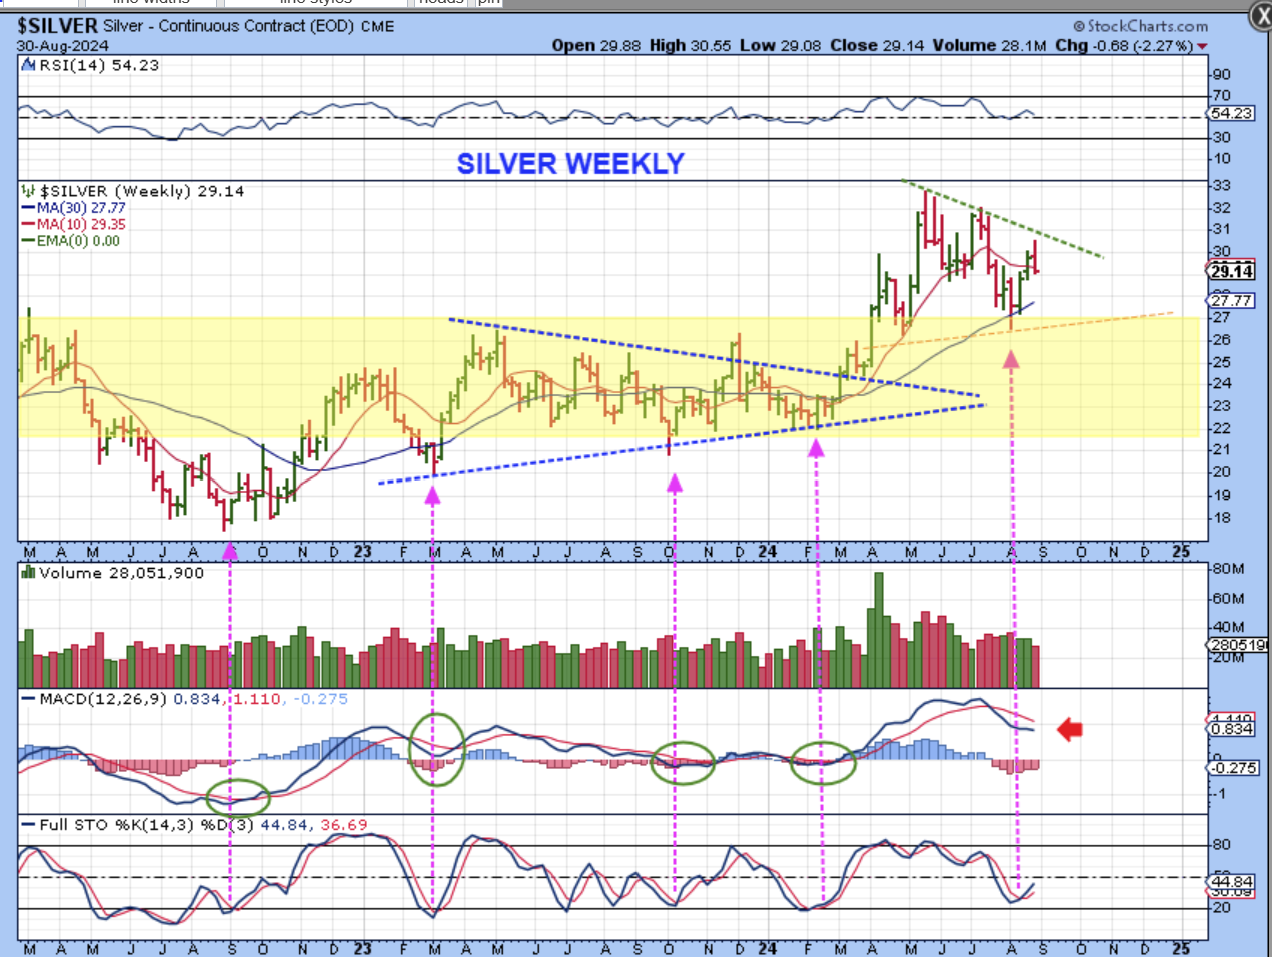
SILVER WEEKLY – Silver put in its low at the start of August and moved up for 2 weeks and pulled back last week. This may or may not be the ICL for Silver, so we need to see if Silver can move higher this week with the USD trying to move higher too. The MACD here looks a bit weak too.
.
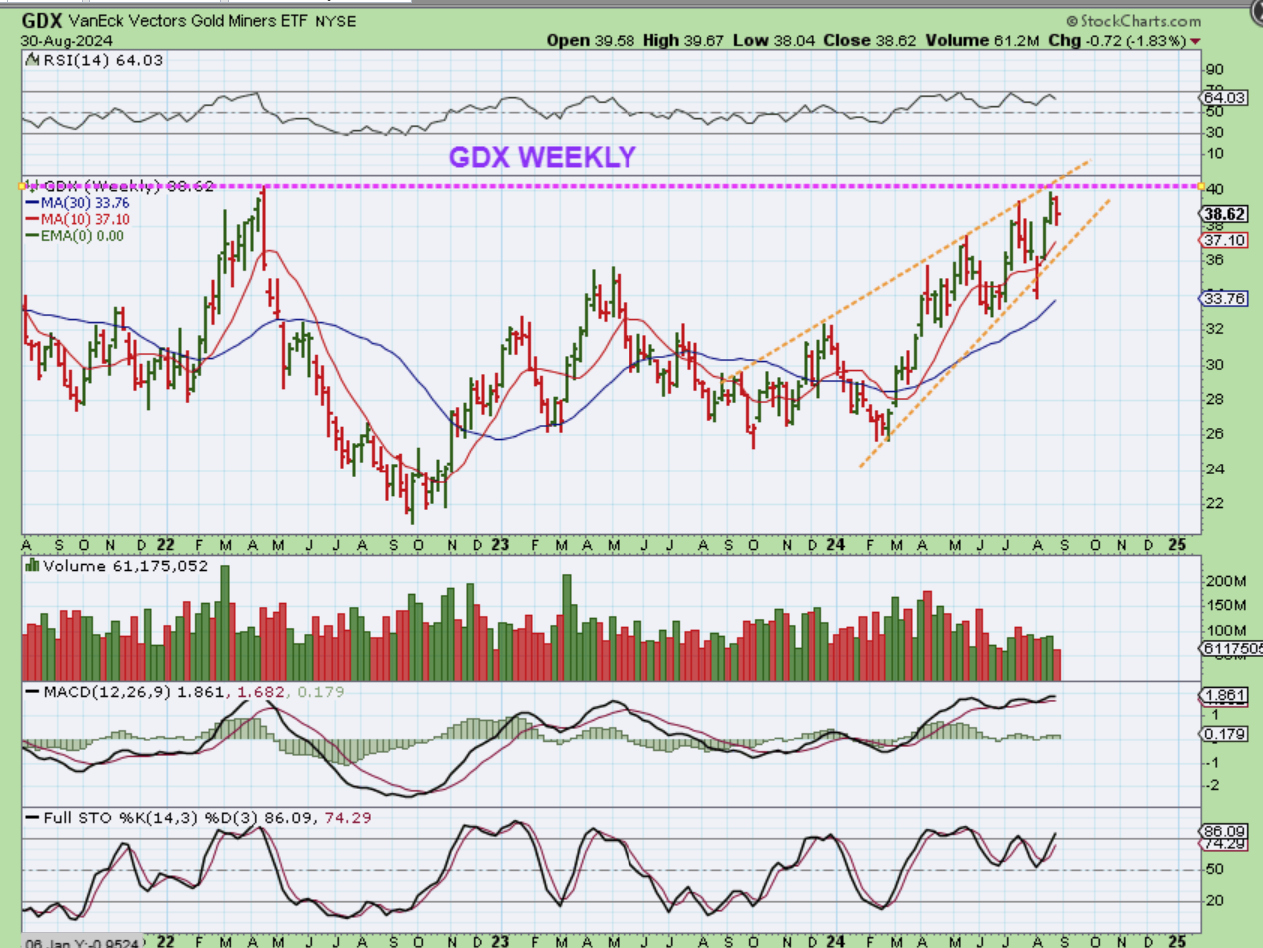
GDX WEEKLY – The weekly MACD for the GDX looks great and it has been pushing higher after the recent market sell off. In fact, GDX is at new highs and tagging that prior high from 2022, but it will pull back now if gold and silver dip lower too.
.
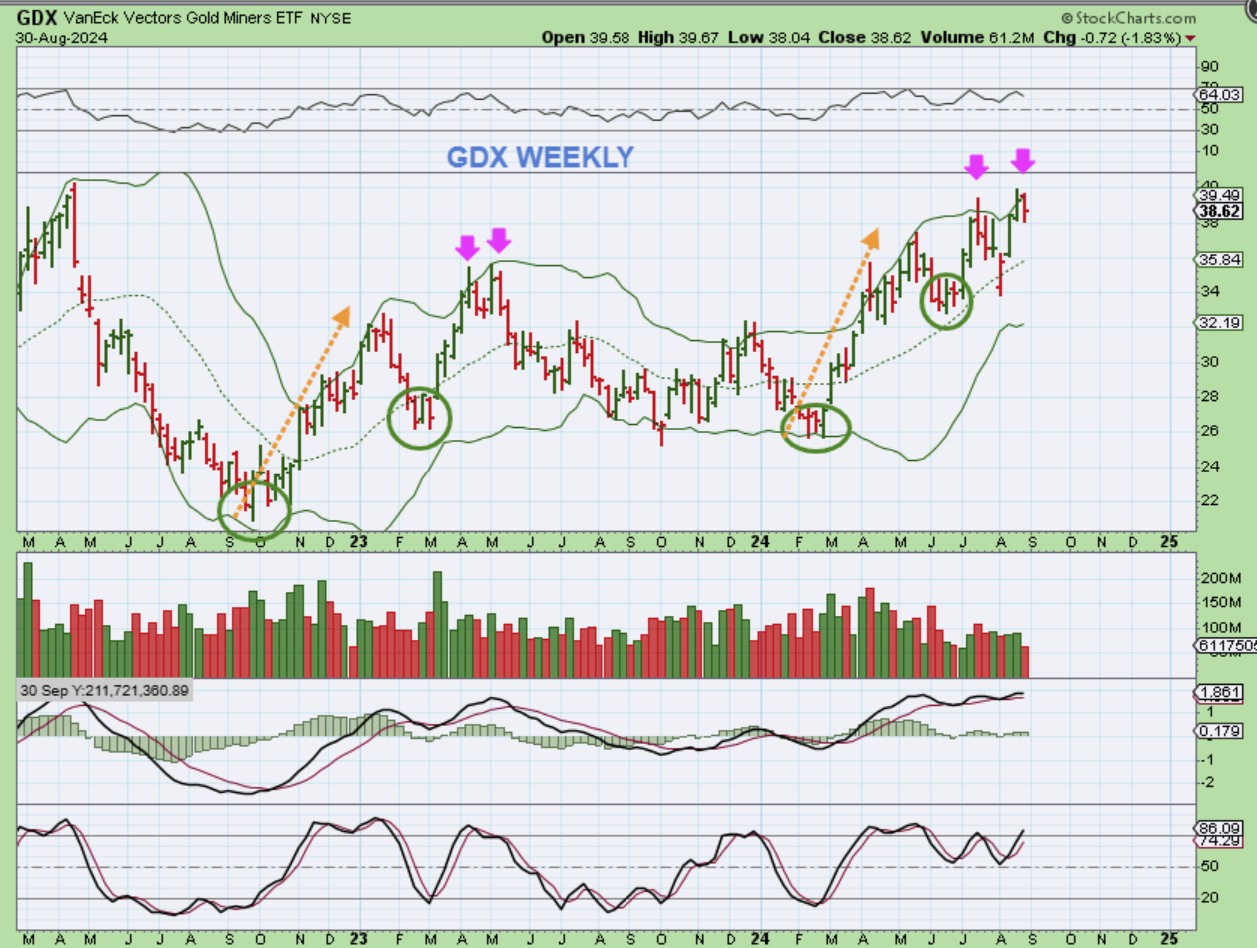
GDX WEEKLY – This looks fairly similar to the 2022-2023 move when you compare it to the Bollinger band area too, except that the MACD looks much better now and it may not pull back below that middle B.B. Line if Gold dips into an ICL over time from here. .
.
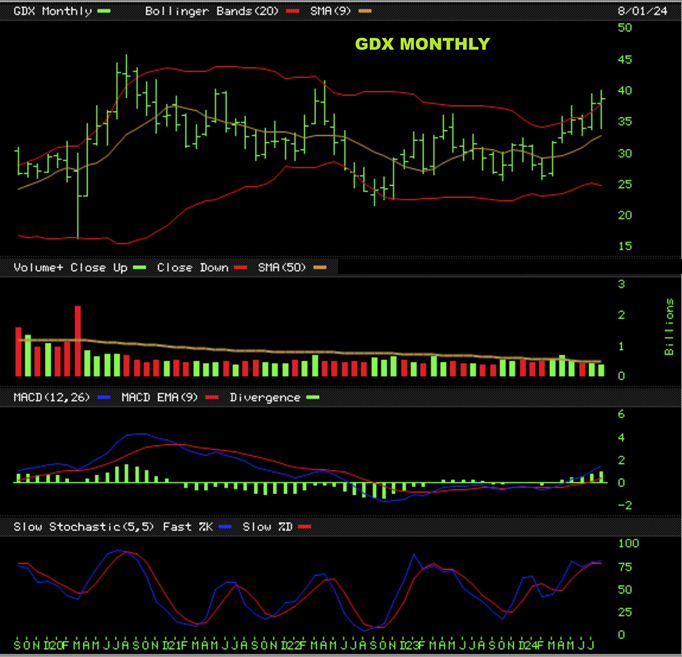
GDX MONTHLY – It has been a long choppy journey over the past few years, but the GDX does look like is moving to the prior highs over time. A breakout to new highs would be quite bullish. To be honest though, I am looking at the monthly chart because August ended, but this chart isn’t really helpful in the short term, it just shows slow progress as Miners moved out of the lows over the last 2 years.
.
So we’ll have to see how things play out with the USD now. We saw a reversal at the lows and it may be forming an ICL. The 2 big questions are: “Can Gold continue higher if the USD moves higher?” and also, ” How high or how strong with the USD become, if it moves out of this low as an ICL bottom?” It seems to be bottoming with the Rate cuts, so let’s see how this plays out this week. I Hope all had a great weekend (& 3 day weekend). Markets are closed in the US today, but Bitcoin trades 24/7 and it is worth watching right now. I’ll explain why below, happy Monday all!
.
~ALEX
.
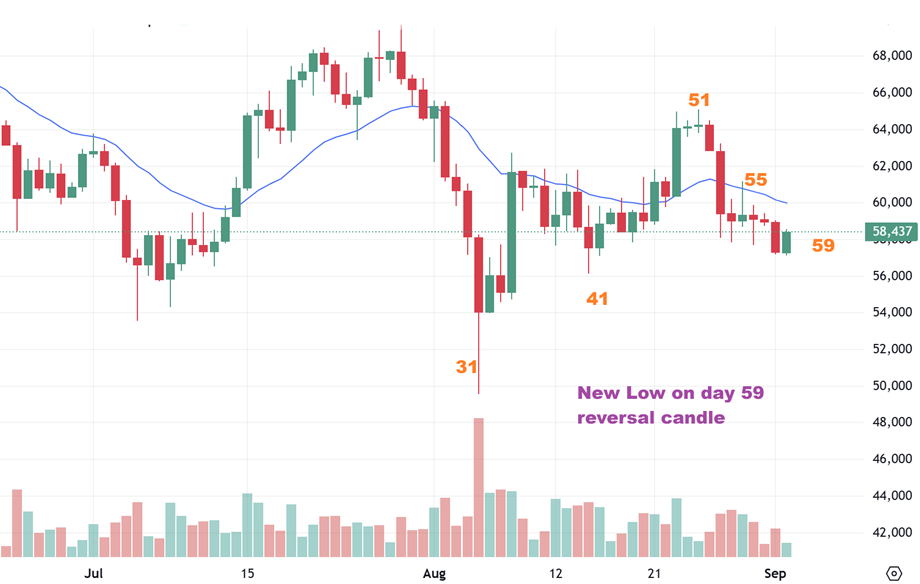
FROM FRIDAYS REPORT: We have been watching the cycle count for a low…
BITCOIN – Bitcoin rallied yesterday, but it also sold off into the end of the day. So now we are on day 56 Friday, and each pop so far couldn’t hold the gains . I do think that we’ll see one more dip to a new low, and then we might have a good buying opportunity.
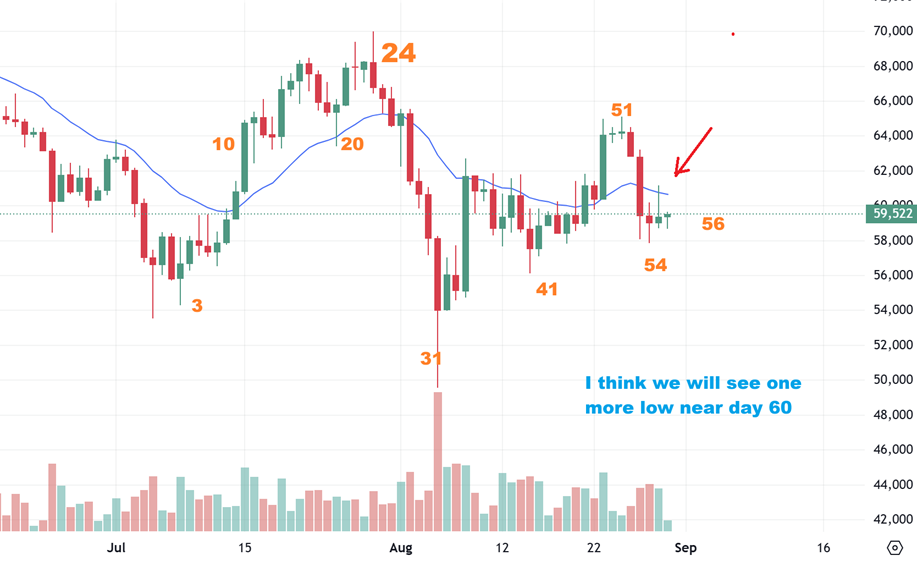
WE HAVE OUR DIP:
.
BITCOIN – This morning is day 59 and we had a slight new low and then price reversed higher today, so we are right in the timing for a low and I think that a push higher above that 20 ema (blue line) is a good clue that the lows are in place. Then we can also see if the Crypto Stocks want to join in on a move higher. We can see how those crypto stocks act in areas where the markets are open today, and in the U.S. tomorrow.