Wednesday September 4th
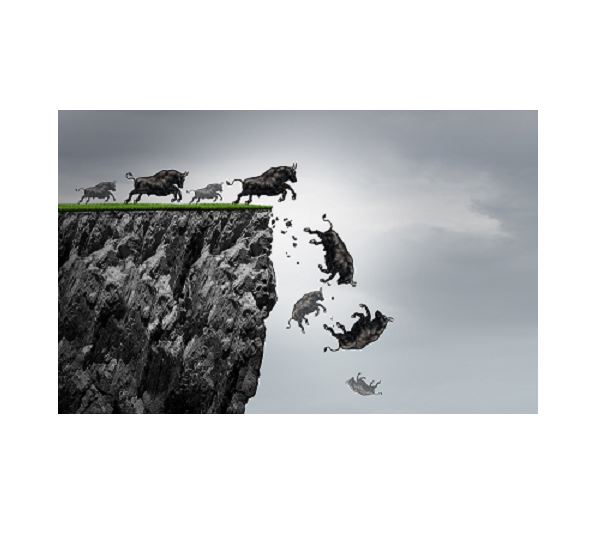
Just last week I posted this picture as my Theme Pic and asked, “Is that coming over here?”. The charts had signs of weakness and the ICL to what would be the next ICL was only 3.5 months, and I have been pointing out that I have never seen that before. Well, that storm seemed to arrive on Tuesday.

.
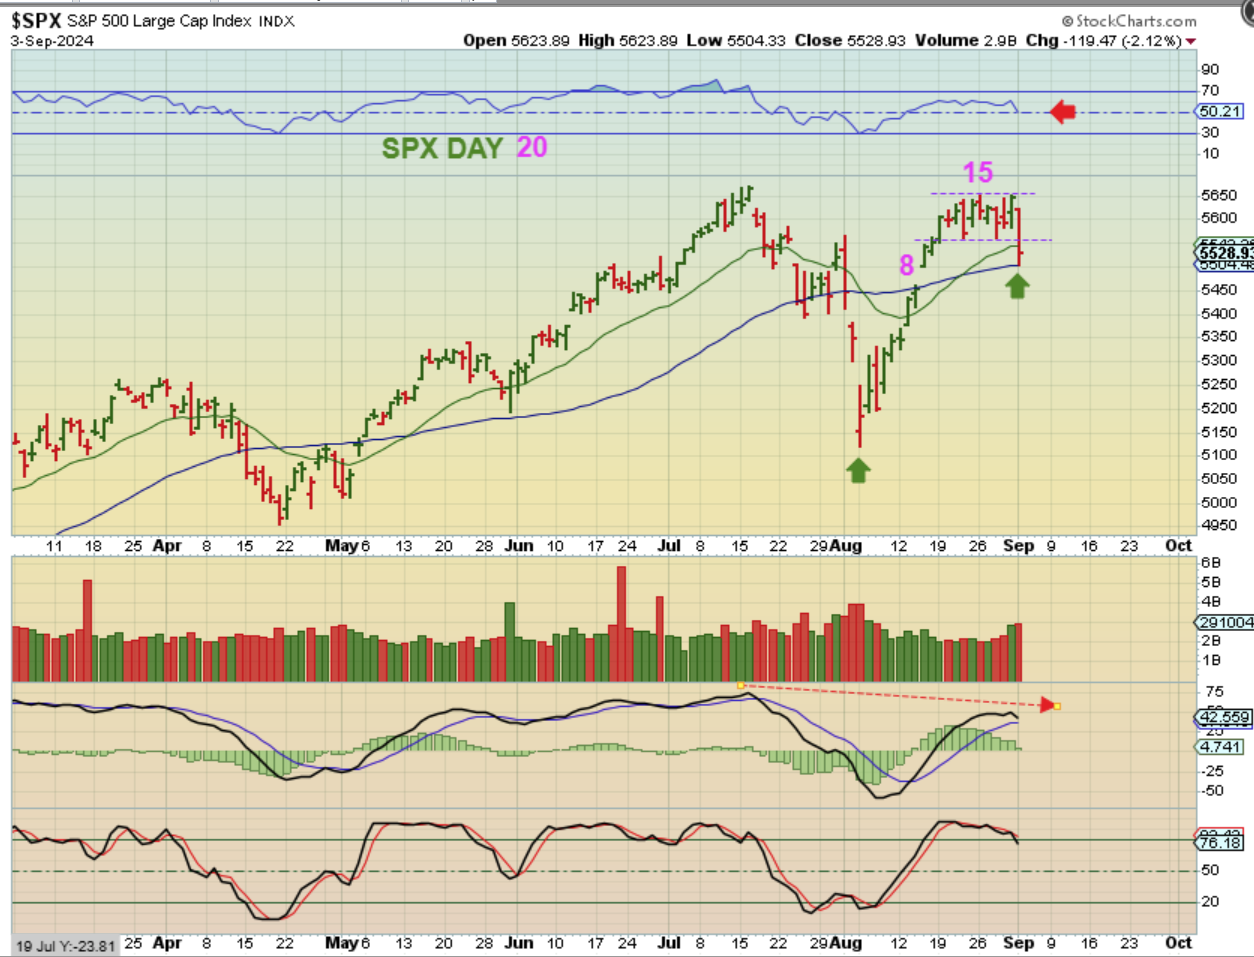
We left off saying that The SPX recovered right back up to the highs and looked rather good, but the NASDAQ & SOXX did not. So now, The SPX broke down from this channel, but it did bounce at the 50sma. Is it ok? I don’t think so.
.
As you know, about 4-5 weeks ago now, the SOXX dropped with a failed daily cycle and alerted me to the weakness coming into the markets. We had to be careful that the rest of the markets would now follow. They did then break down too, and we have to now expect that this could again break lower too, because…
.
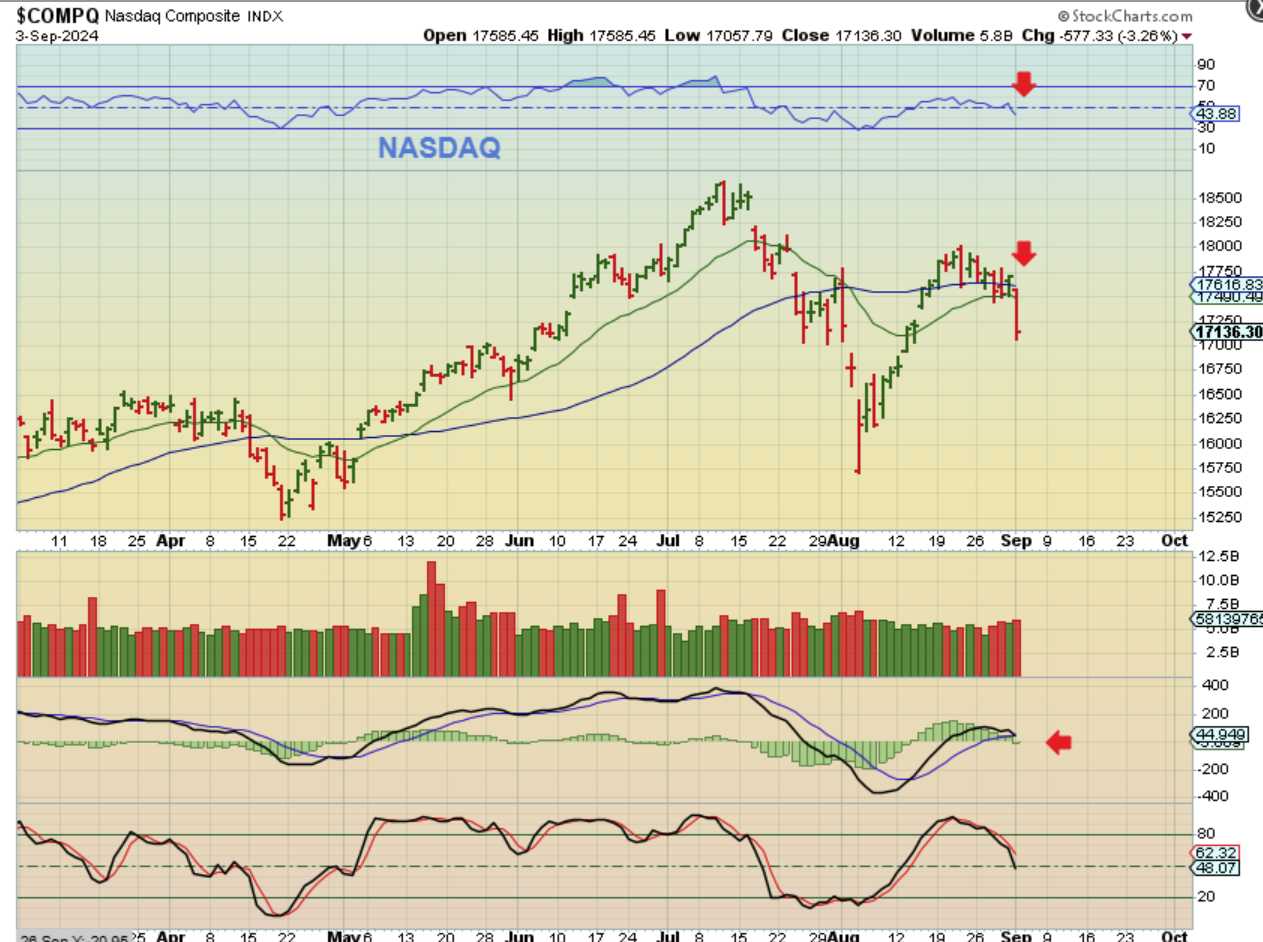
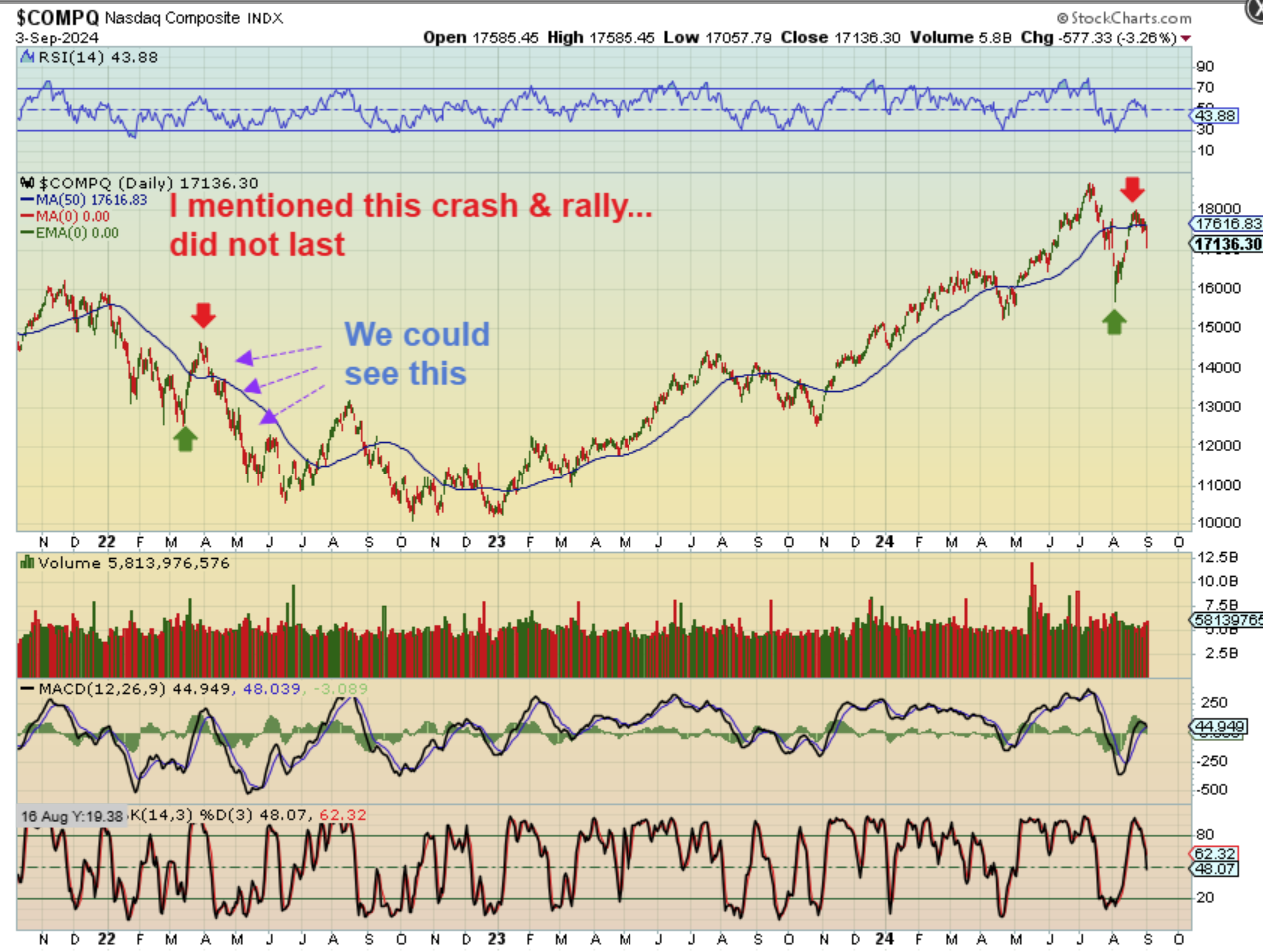
THE NASDAQ crashed on Tuesday and this does not look good in many ways. That said, you may recall that…
.
I repeatedly pointed out that we had a sell off in 2022 where the recovery looked very believable, but it rolled over. I said that we should be aware of that because of ‘failed daily cycles’ and an ICL at 3.5 months seemed way too early. Now look at this chart with todays drop. It looks eerily familiar and look at what followed in 2022. A prolonged sell off to new ICL lows.
.
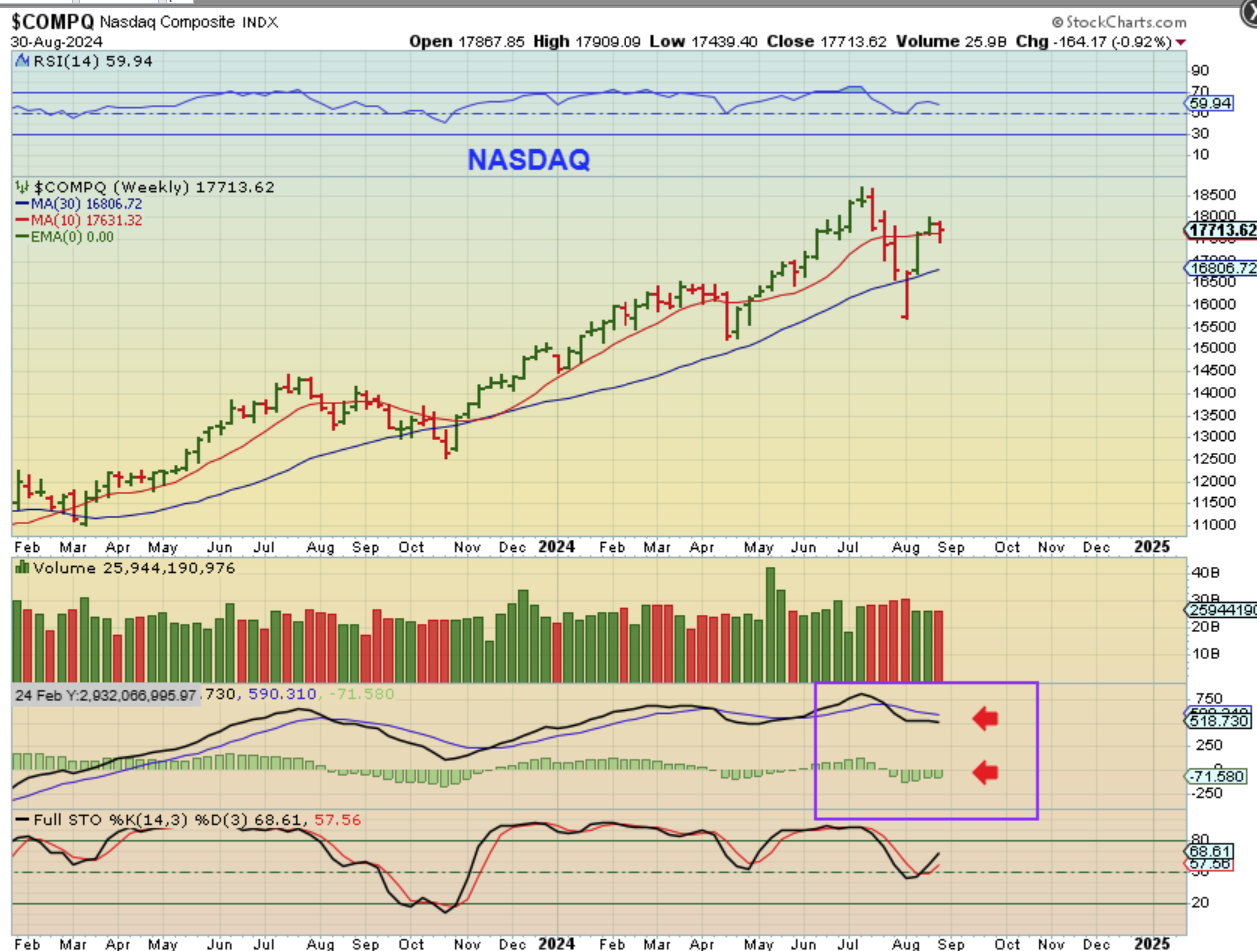
In the weekend report I mentioned that I didn’t like the WEEKLY MACD in these after the rally: I said…
.
The Weekly Nasdaq MACD is not curling higher, so tech may be weakening. Also, wasn’t it the SOXX that really started the downfall 4-5 weeks ago. So let’s look at the SOXX…
.
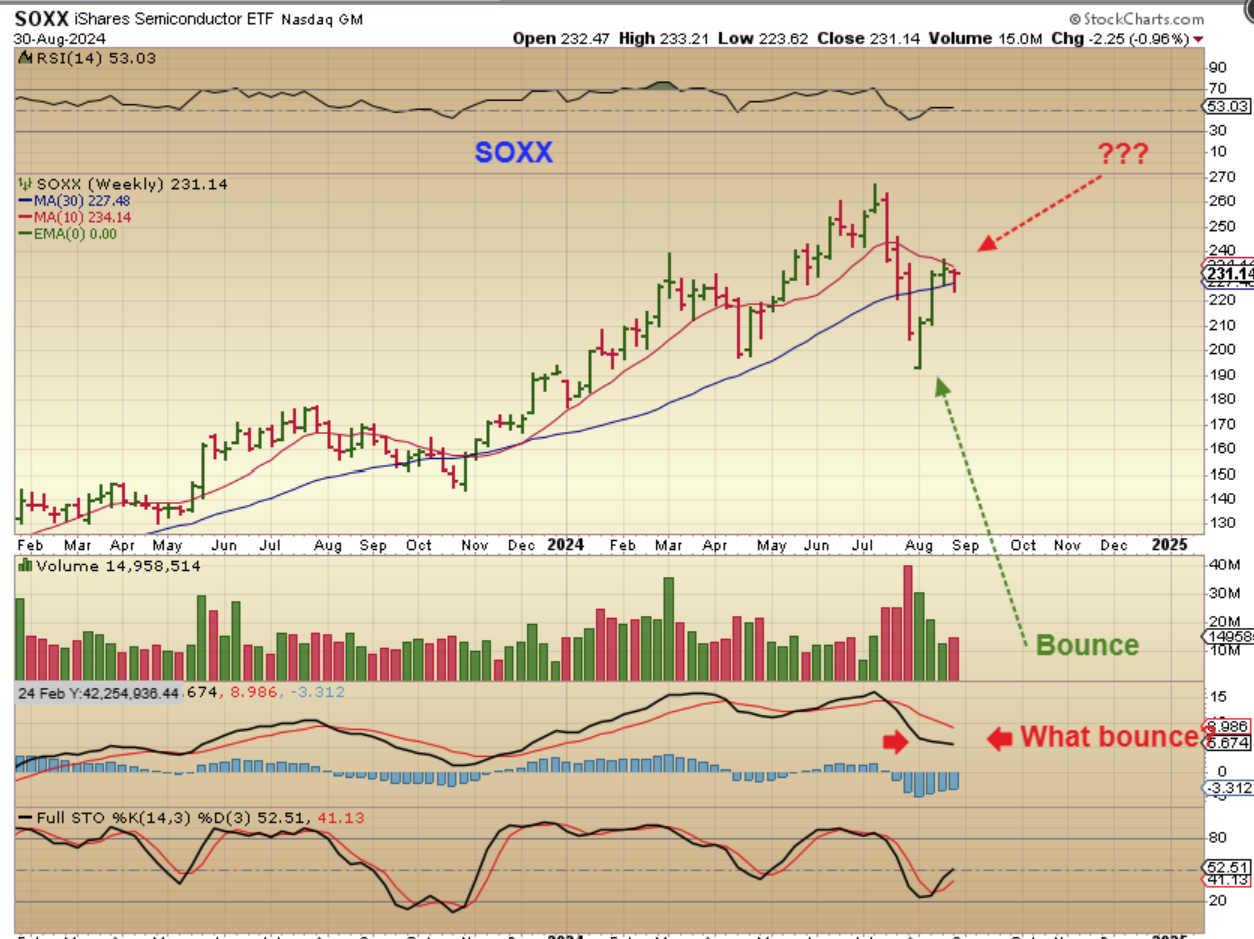
In the weekend report for The SOXX WEEKLY I stated that the MACD was very weak: I said…
.
This has been much weaker than the SPX & QQQ, since it has only recovered half of that drop & still remains under the 10 weekly ma. Also, take a look at that MACD and it looks pretty weak with this bounce. That was a strong bounce with price, but it didn’t turn the MACD up at all? So…
.
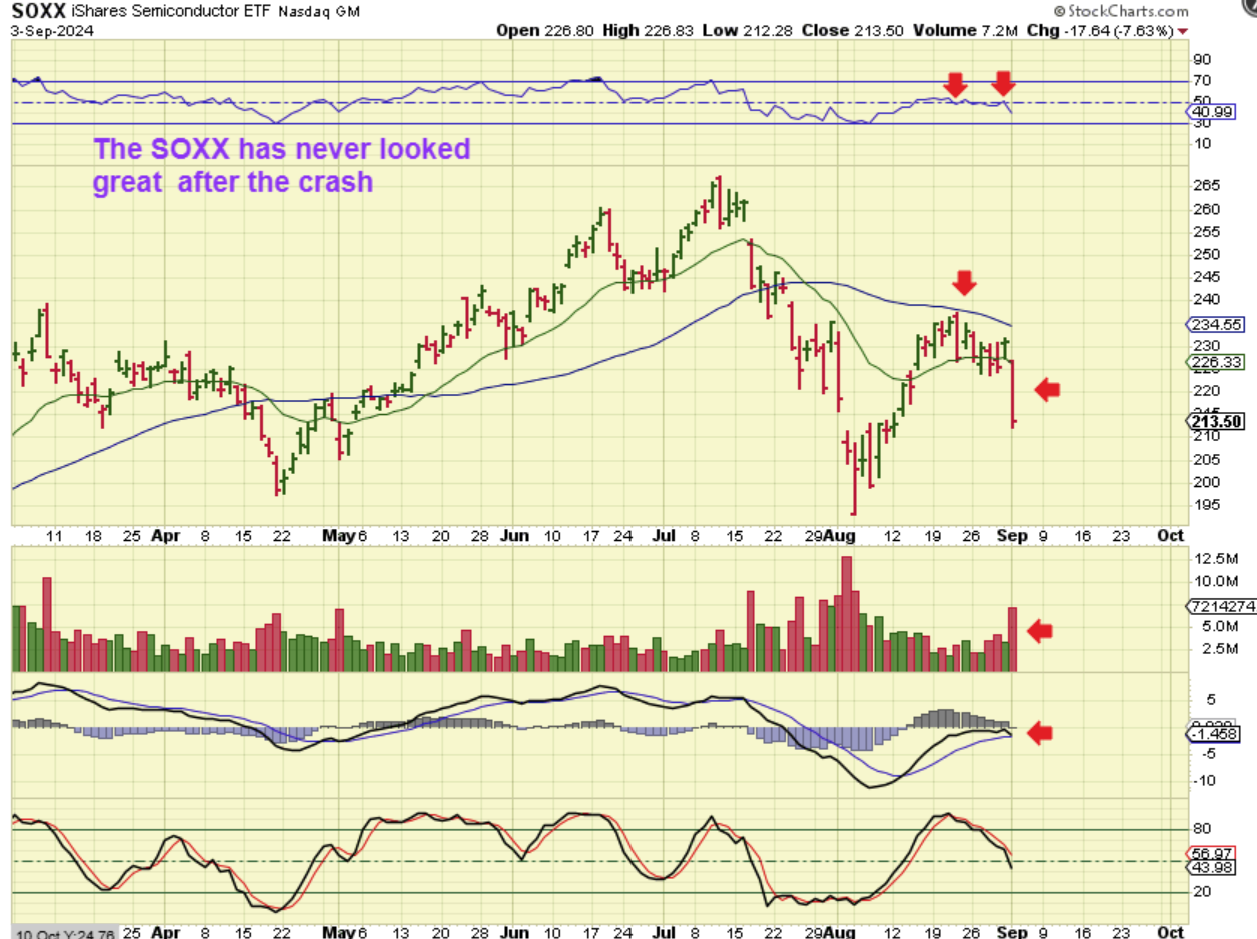
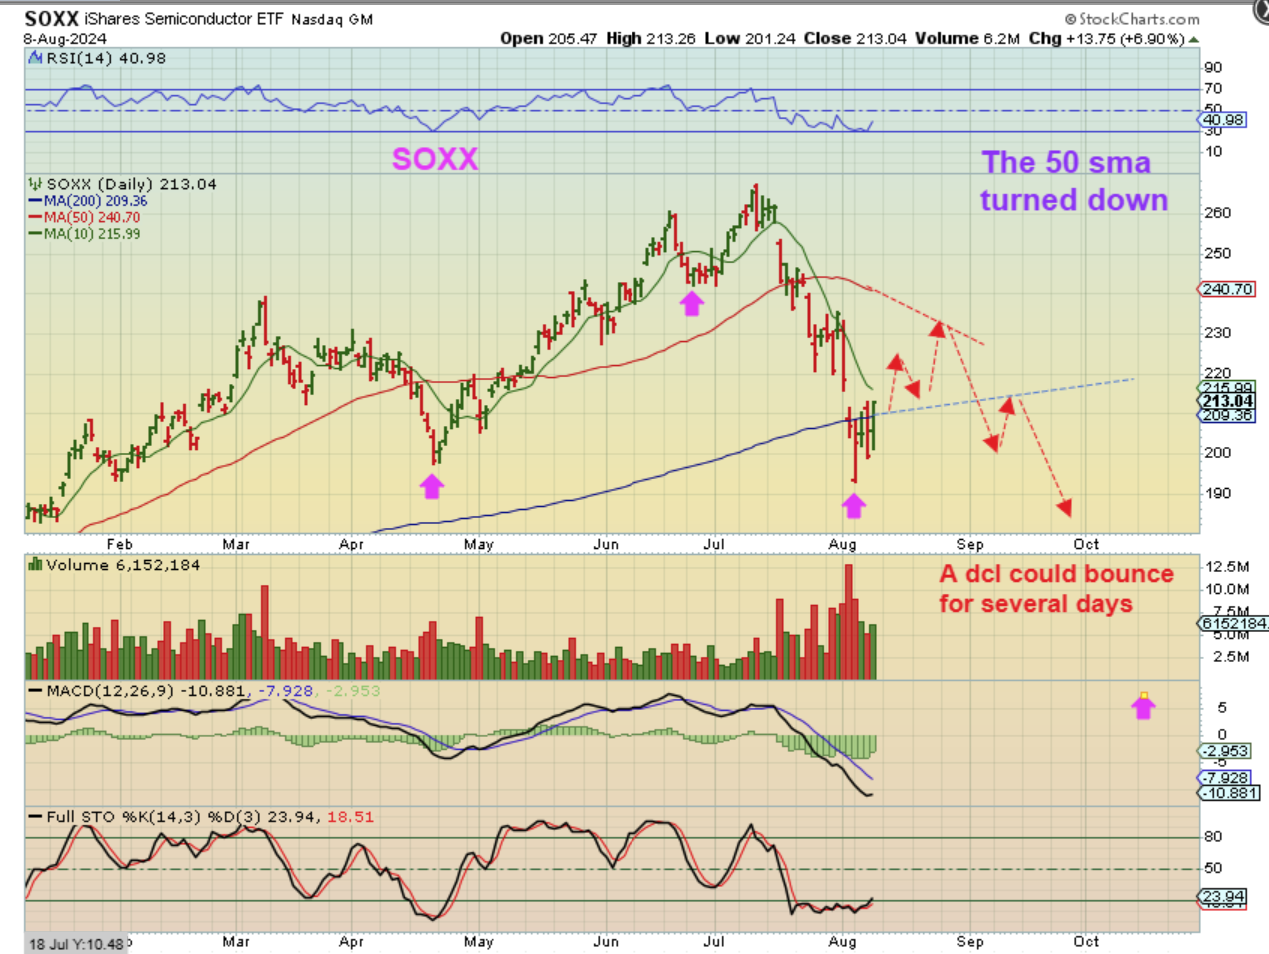
THE SOXX has never recovered the 50sma or the RSI 50, and now we have a 7.63% drop! This looks quite ugly, and I did mention many times that we saw a selloff in 2022 that almost recovered and then crashed again, so we needed to keep that in mind. In fact, take a look at this…
.
This was my SOXX prediction on August 8th. A rejection at the 50sma and a continued sell off. So far, that is what we have as seen above.
.
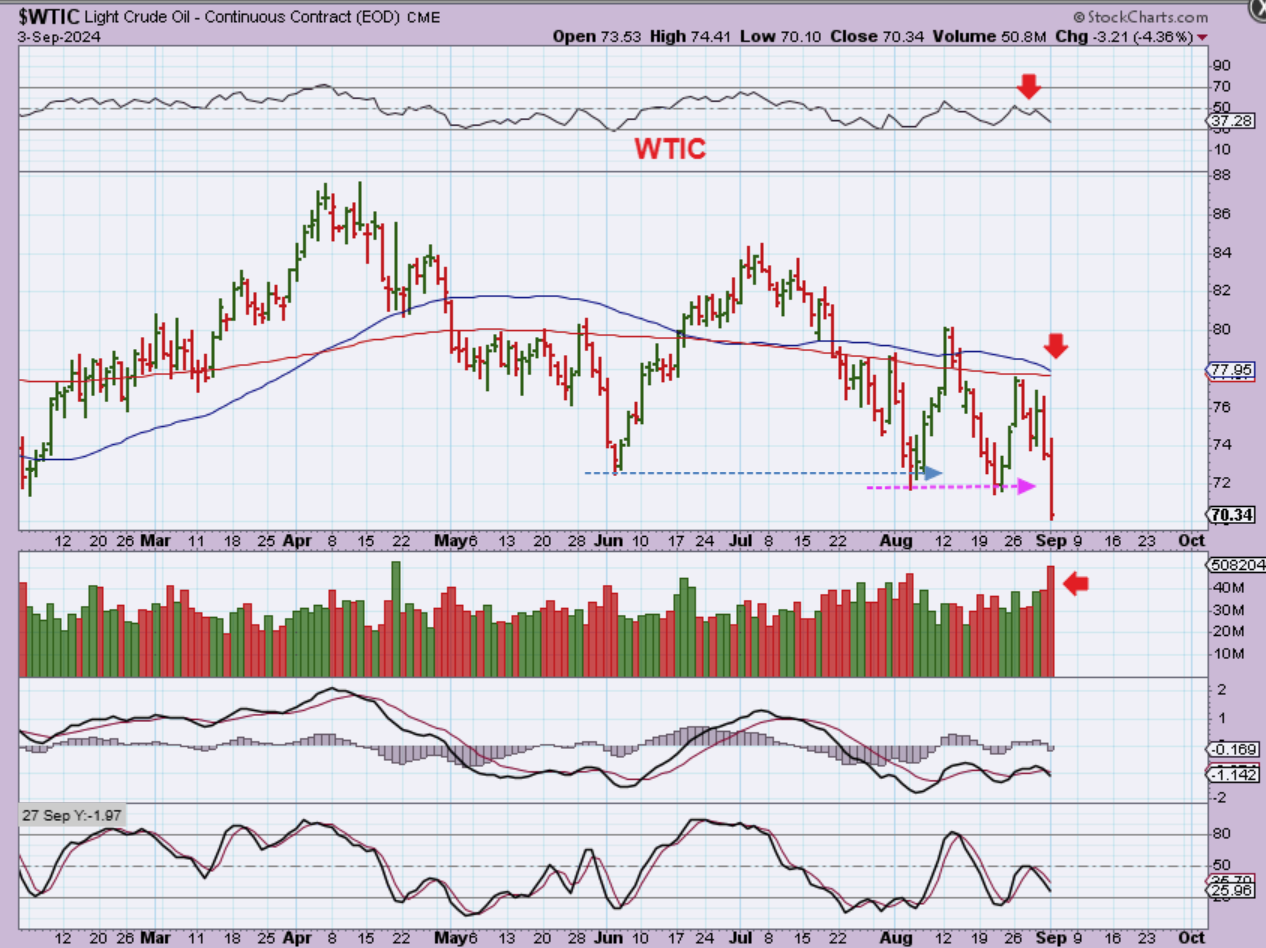
OPEC and LIBYA announce that they will be increasing Oil output. More Oil on the market would drop the prices, and that certainly did happen Tuesday!
.
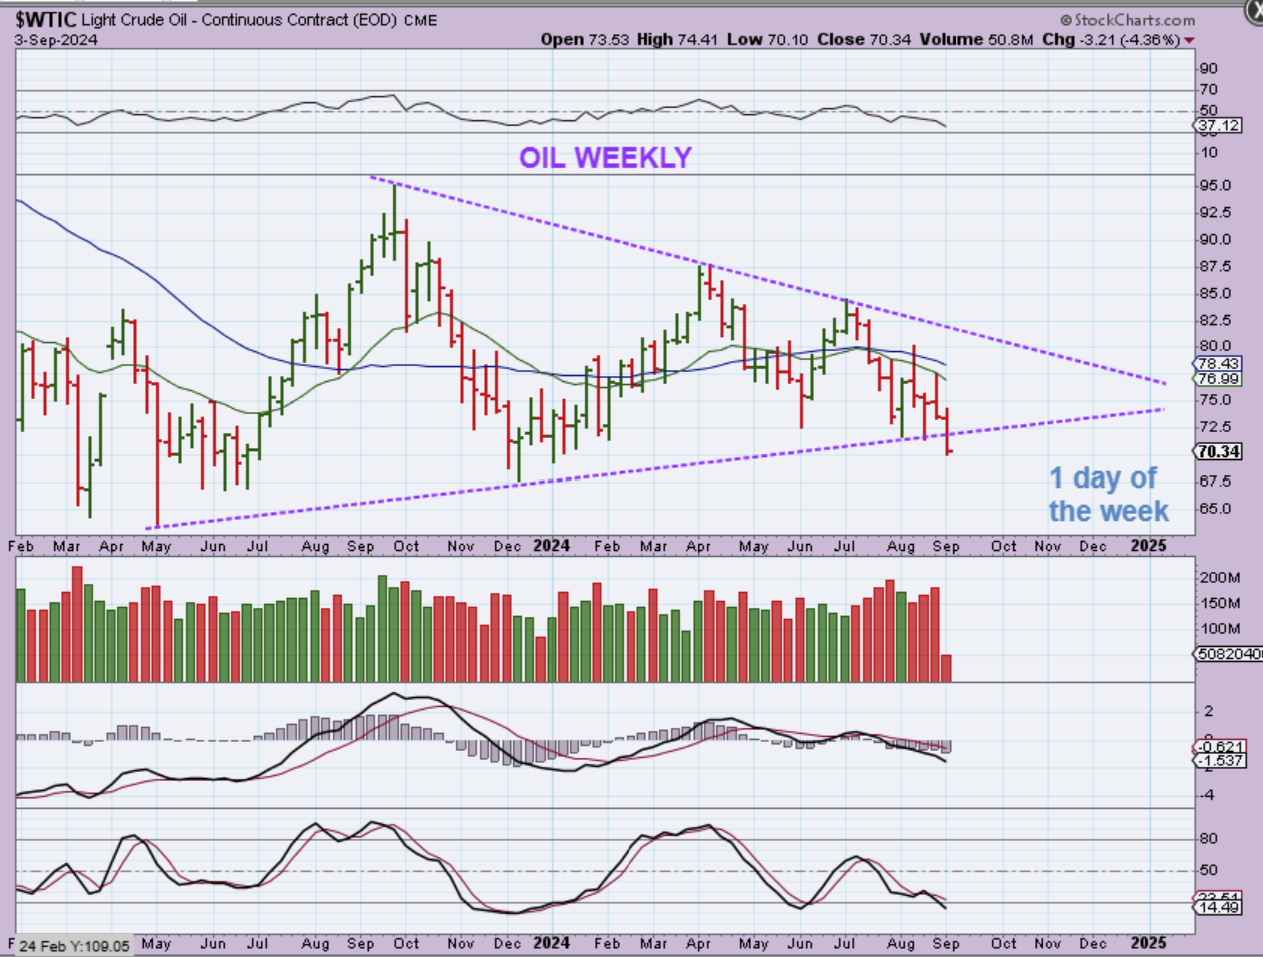
WTIC – Oil crashed to new lows again, hitting that $70 area, and it could drop further. When I switch to the weekly chart …
.
When I switch to the WTIC WEKLY CHART, we see that triangle that I’ve been pointing out now breaking down. The selling is taking place across all sectors.
.
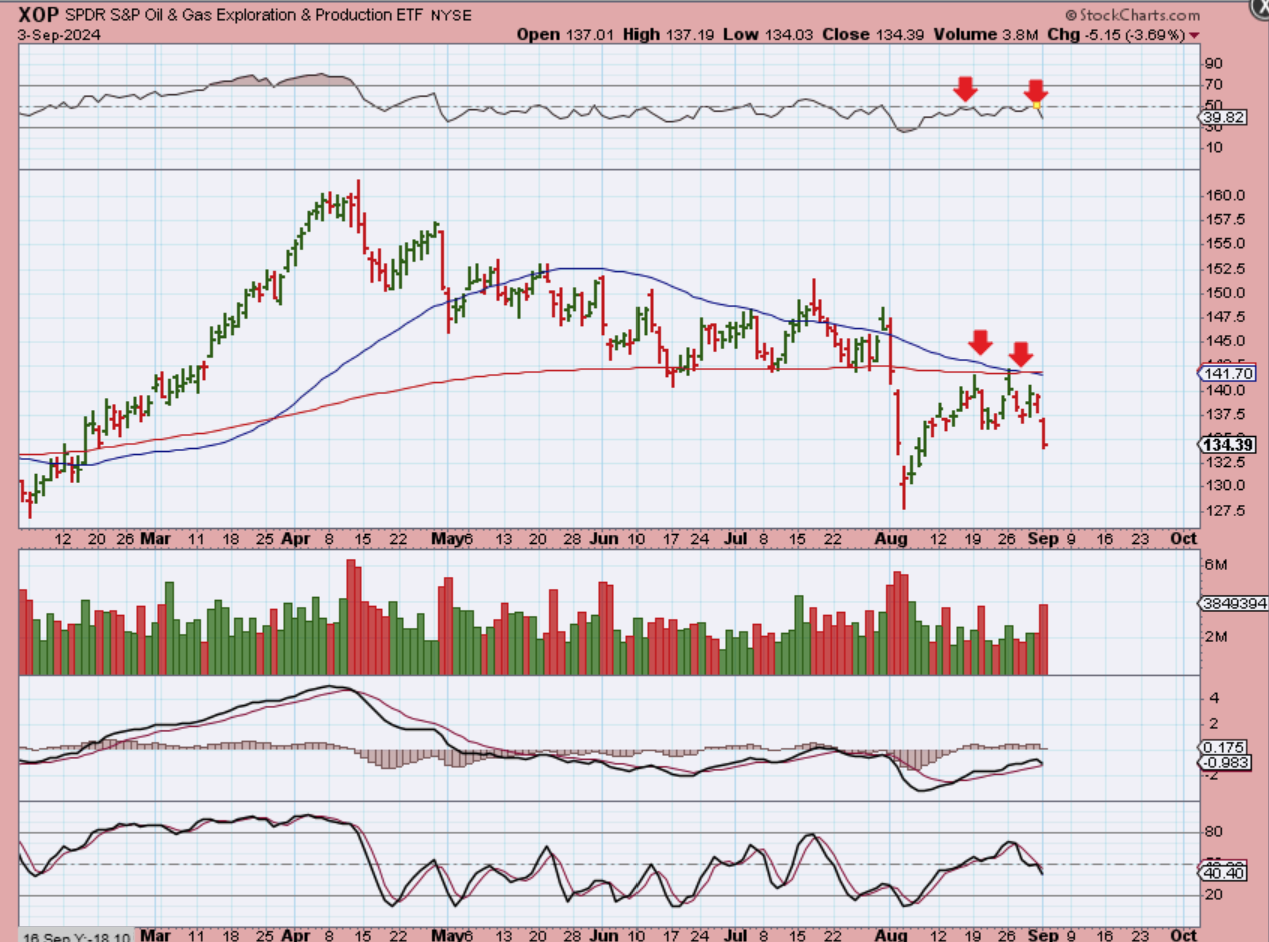
XOP – Oil stocks appeared to be crawling along under the 50sma with a possible breakout to follow. They broke down on Tuesday. This is starting to look like a broad-based sell off developing.
.
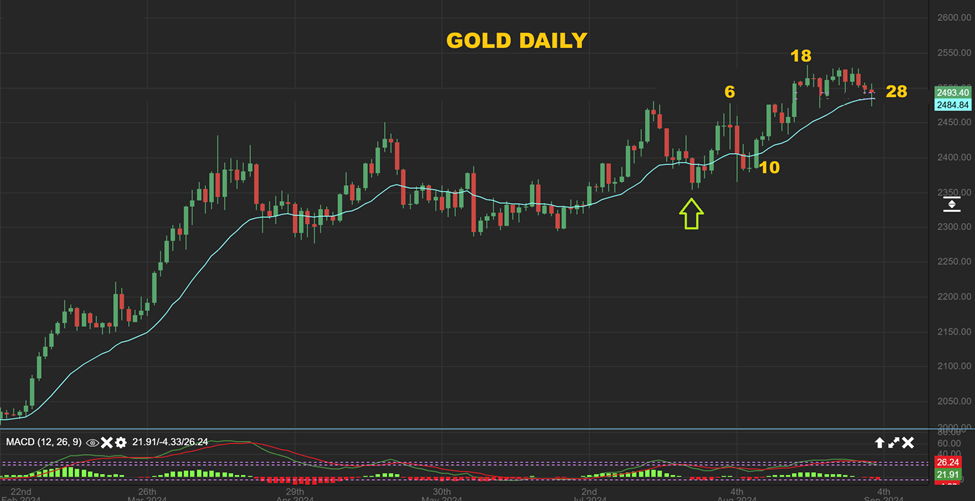
GOLD, however, did somewhat resist the heavy selling, with a smaller dip that only reached the 20 ema so far. Think about that. We are on day 28, so Gold could have plunged into a dcl, but it didn’t. This is Gold as of 11 p.m. Tuesday and it’s on day 28. Again, this is in the timing for a dcl. A drop to the 50sma could give us a dcl and it would remain perfectly normal.
.
So Gold did well in my opinion, but the problem might be SILVER. Do we have an ICL yet or not? Let’s examine that.
.
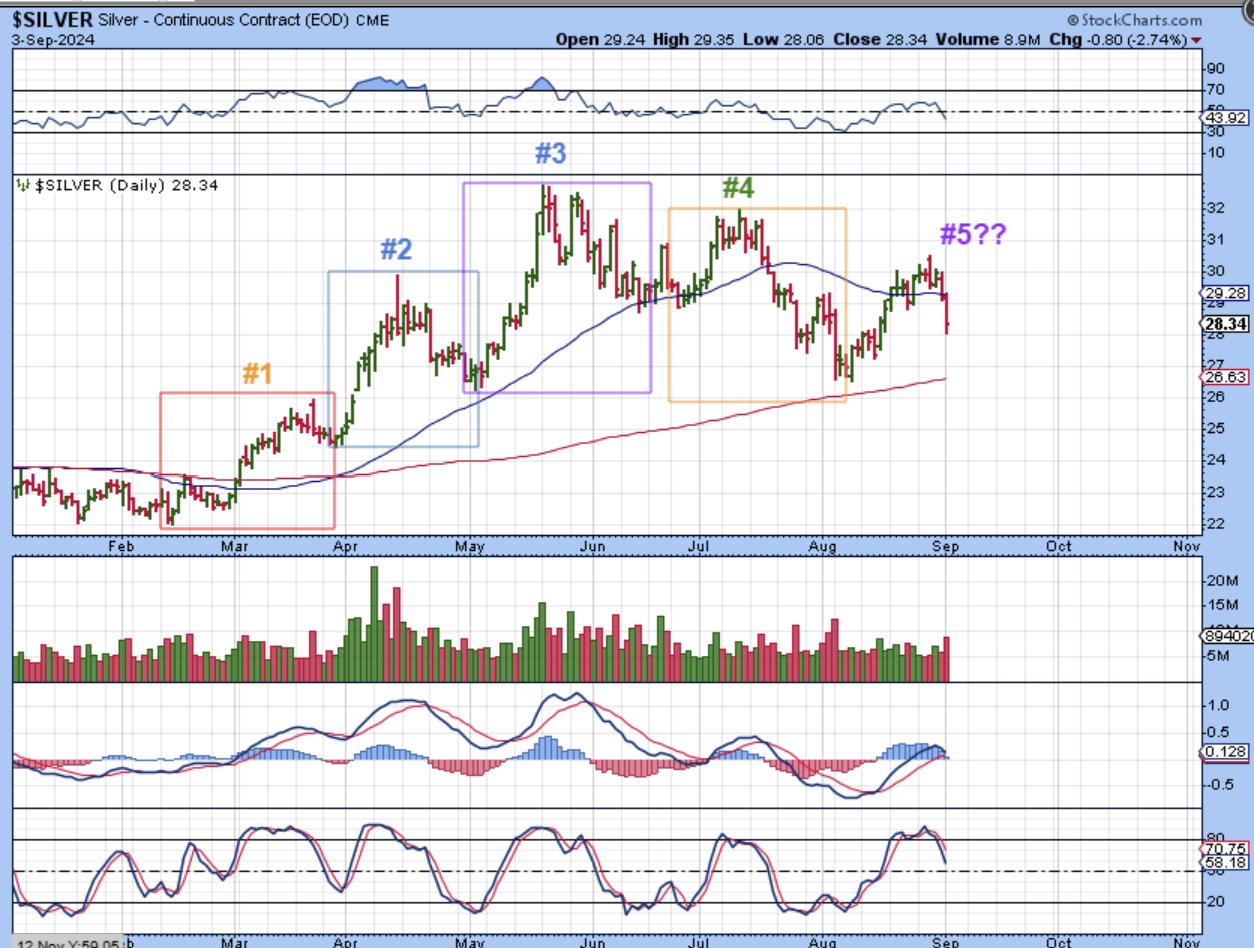
After a strong rally in the first 3 daily cycles, we had a L.T. 4th Daily cycle and the drop into an ICL started, but would it now take 4 daily cycles to get to the ICL or 5? Silver has a day 14 peak and is on day 17, so stay tuned. To be honest, I don’t love this chart, with the Stochastics near overbought and the RSI losing 50% on day 17, etc. This has room to drop one more time and some Silver stocks DID drop 7-10% on Tuesday.
.
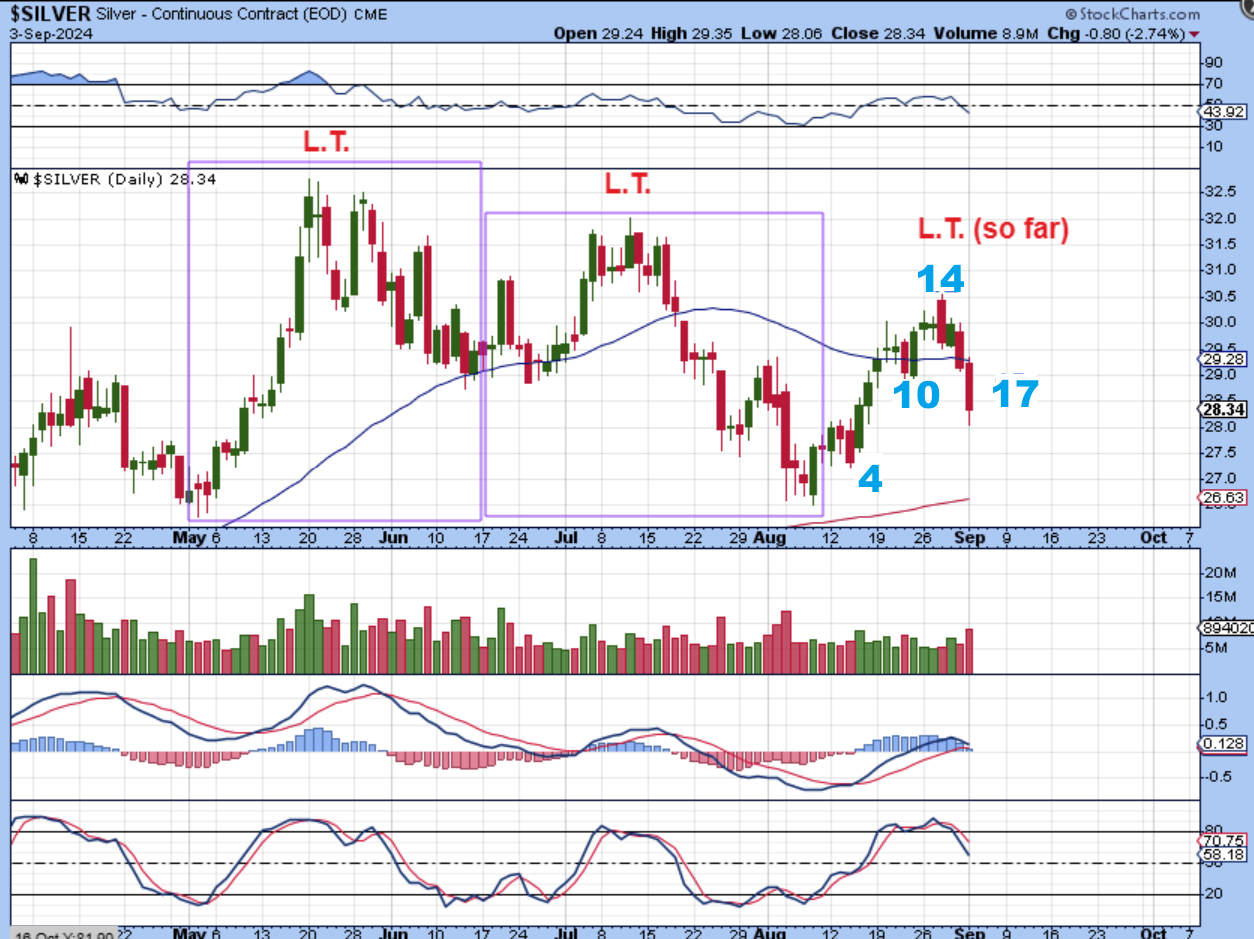
Let’s Zoom in on SILVER. You can see those L.T. Daily Cycles. Take note that Silver is still not in sync with Gold, and this could drop into an ICL from here with a possible shakeout at the 200sma. It also could bounce as a half cycle low, so we’ll watch it.
.
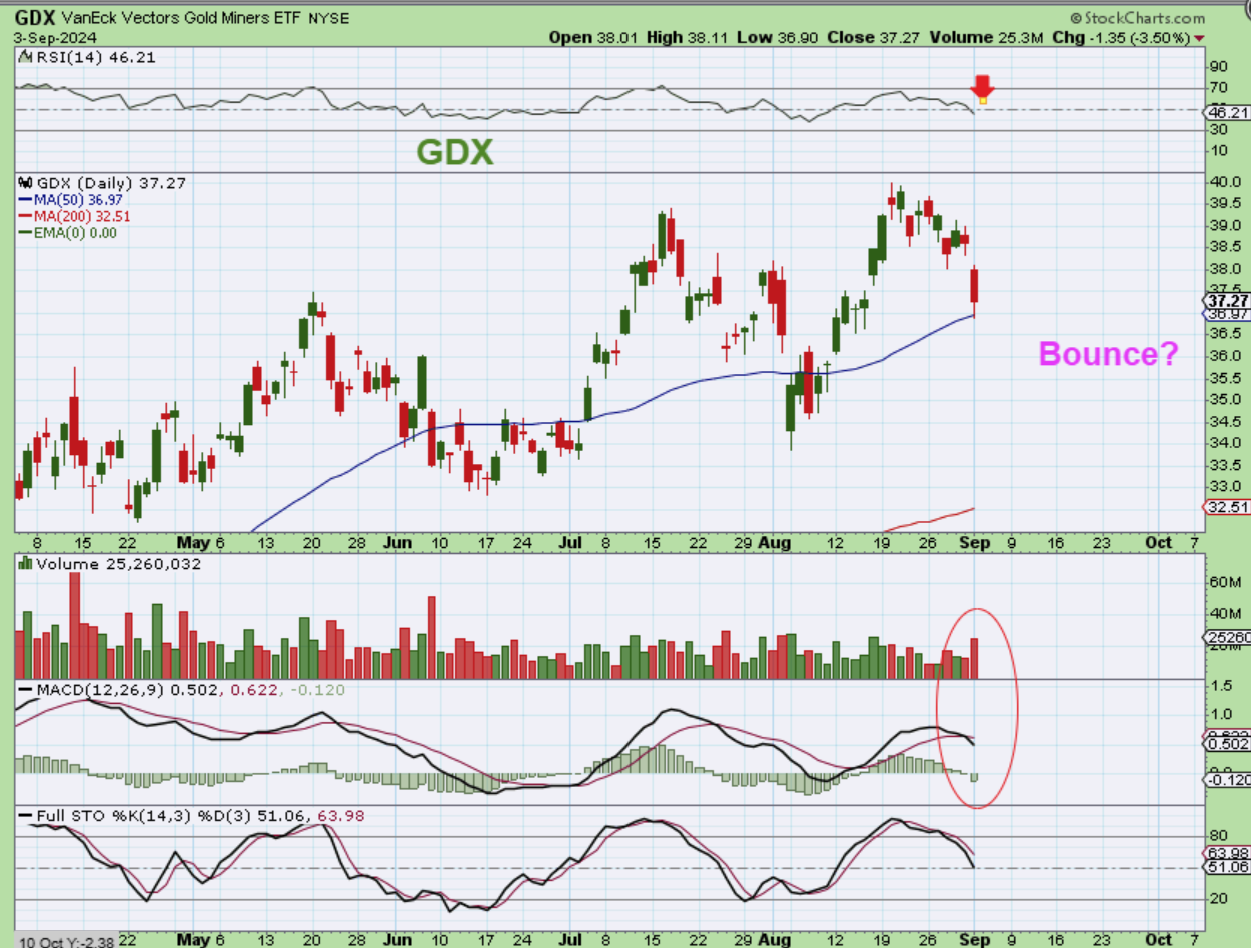
GDX dropped to the 50sma and bounced a little on Tuesday, so could it take off higher? Well, maybe with a bounce, but I have to be honest here. What do you think of the Divergence on the MACD at new highs, and now we see that MACD crossing down? This doesn’t look very promising short term.
.
So we did have a heavy day of selling, and I had been saying that the ICL to ICL being only 3.5 months apart was something that I had never seen before, and it just seemed too early. The SPX rallied back to the former highs, but the Tech sector and semiconductors (QQQ & SOXX) did not look healthy to me, so I said if you go long, have stops in place and be cautious. If the ICL is really ahead, we could sell off like the drop that followed that 2022 rally out of a crash. That means that if it bounces it could be shorted, but shorting a bull market is very hard to do, since sometimes the bounces can be sharp rallies.
.
Gold actually does not look bad, but Silver is a tough call, because it is not in sync with Gold. Silver and GDX could be at a half cycle low and bounce higher, or Silver might still be looking to drop into an ICL near the 200sma. This final drop to the 200sma for Silver as a 5th daily cycle could become a low for Silver and the Miners where they separate from the market selling. That HAS happened in 2000 and 2008. We DID see Precious Metals bottom on OCT 2008, while the general markets still sold off into 2009. Bitcoin is due to bottom here or soon and I am still interested in seeing if the Crypto Stocks can separate from the General Markets and rally or at least put in a solid bounce as Bitcoin pushes higher. I’ll discuss Bitcoin below. Let’s see what Wednesday does for the markets.
.
~ALEX
.
I like to post the reminder from the day before: So, this was in our weekend report…
.
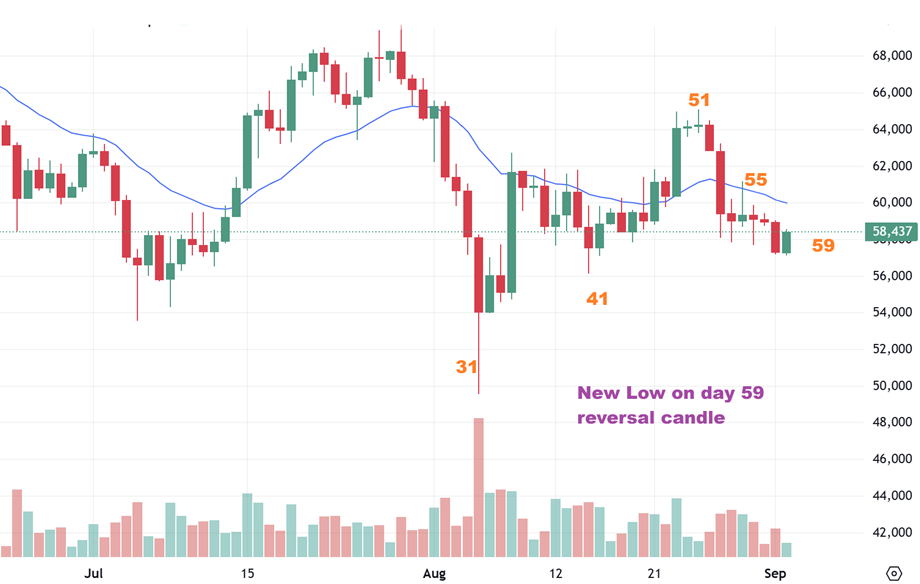
BITCOIN – This morning is day 59 and we had a slight new low and then price reversed higher today, so we are right in the timing for a low and I think that a push higher above that 20 ema (blue line) is a good clue that the lows are in place. Then we can also see if the Crypto Stocks want to join in on a move higher. We can see how those crypto stocks act in areas where the markets are open today, and in the U.S. tomorrow.
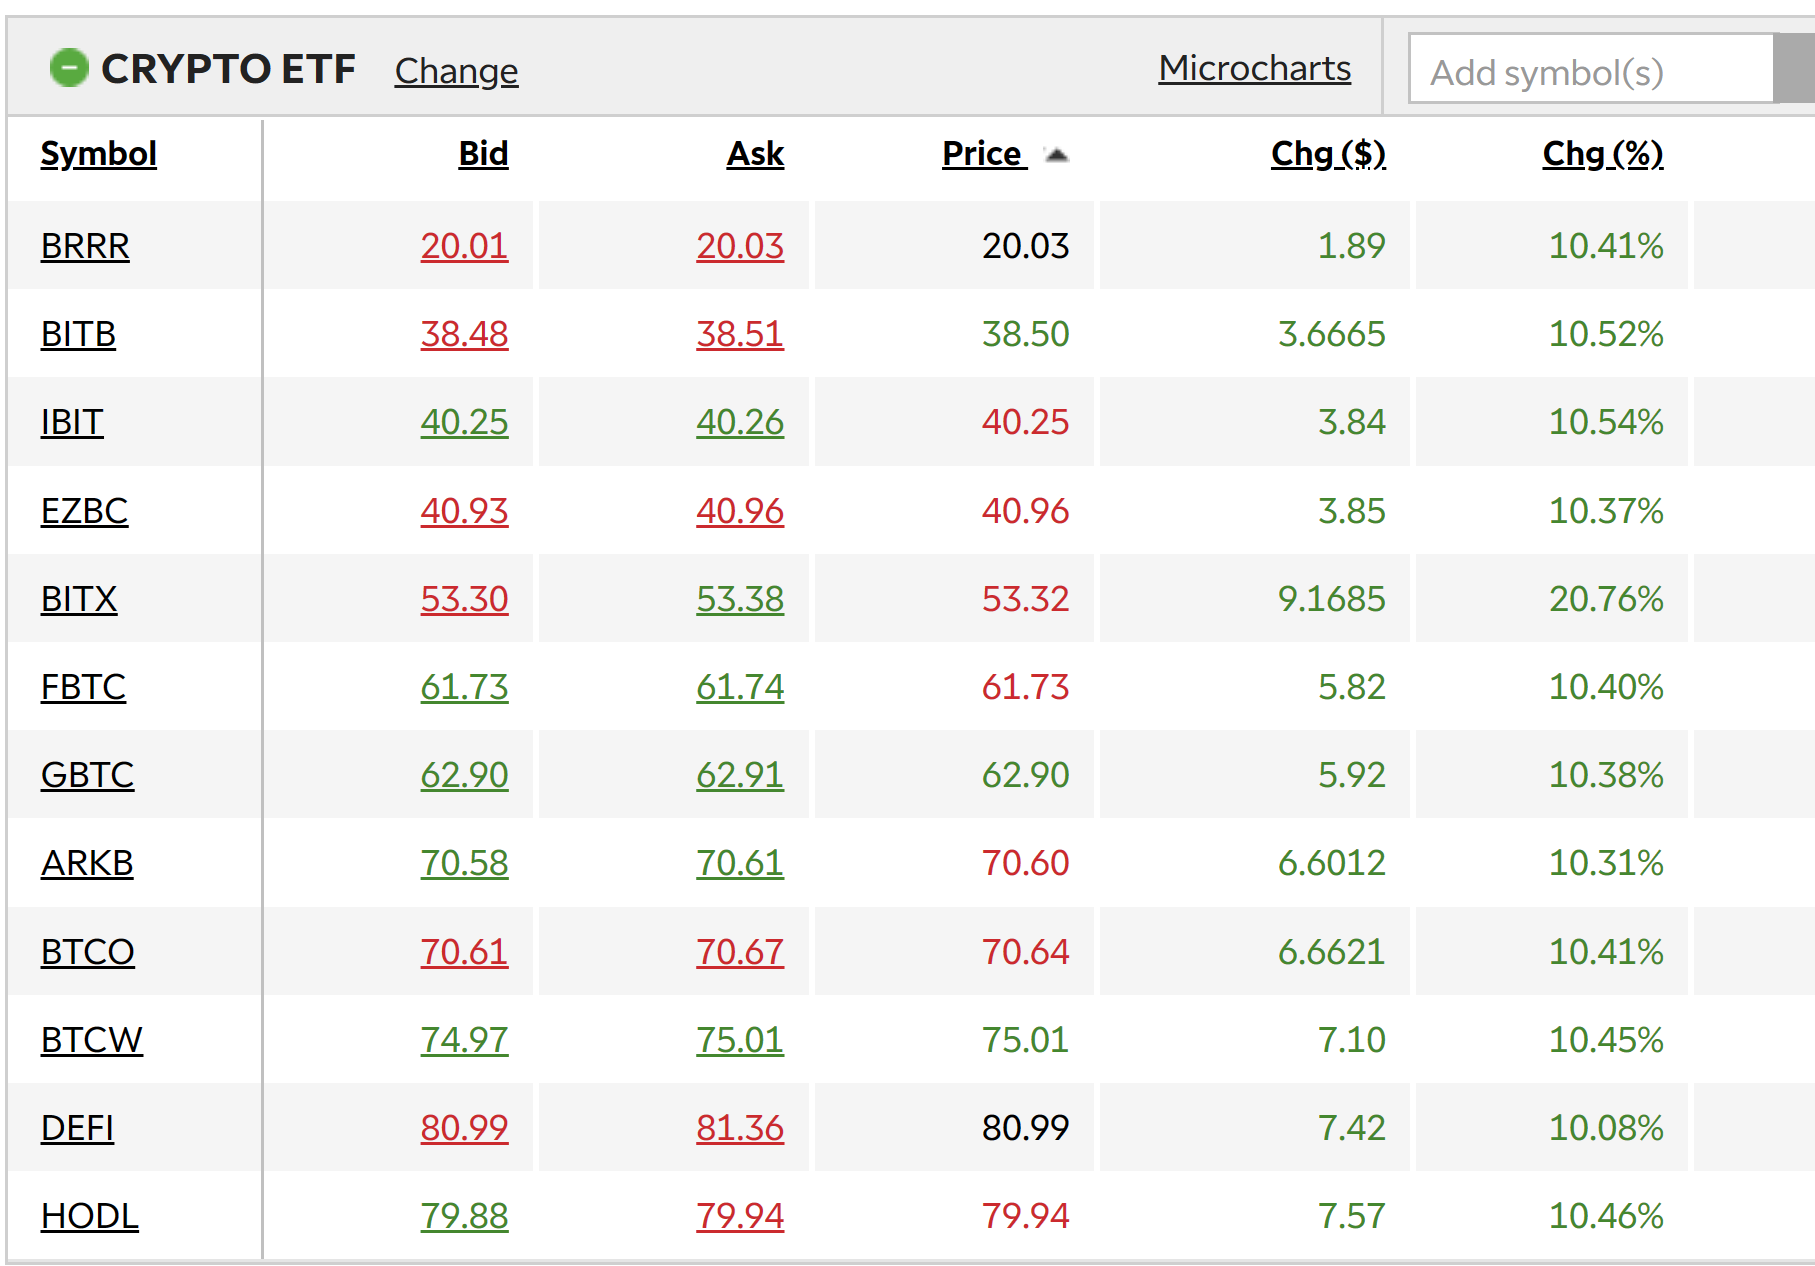
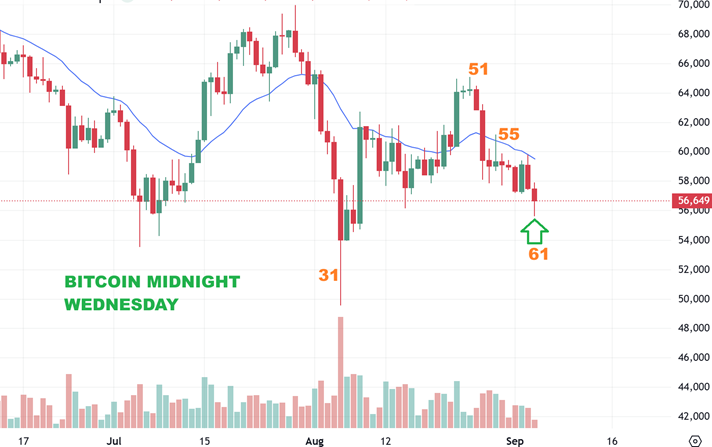
BITCOIN – Notice the rejection right at the 20 ema blue line. That is what I’m using as a guide but now look where we are cycle timing wise. We have arrived at Day 61. This is Bitcoin at midnight Tuesday into Wednesday, and we do have a reversal at the day 61 low. The ETFS are below…
If Bitcoin bottoms and ignores the General Market sell off, The ETFS are listed below, and I’ll be watching the crypto stocks for clues too. These are not current prices, this is an older snapshot.