Wednesday September 25th – It’s Not Straight Up, but it IS a Bull!
.
YESTERDAY I MENTIONED:
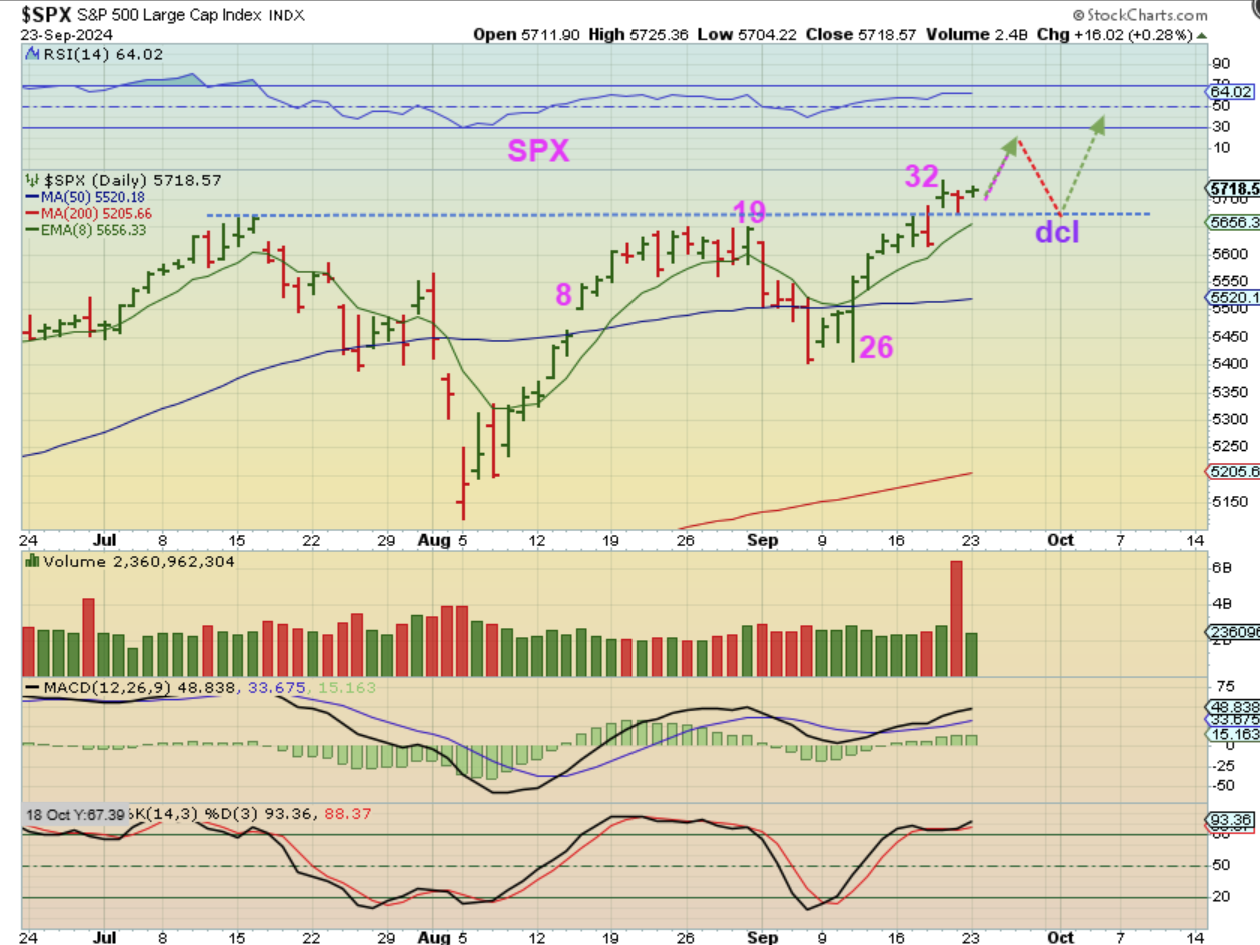
THE SPX ran to new all-time highs and is on day 35 today. These daily cycles can run from 35 to 40+days long, so I drew in a pop and drop as the next dcl, but it may just churn sideways and then drop too. The next dcl is a buy too.
.
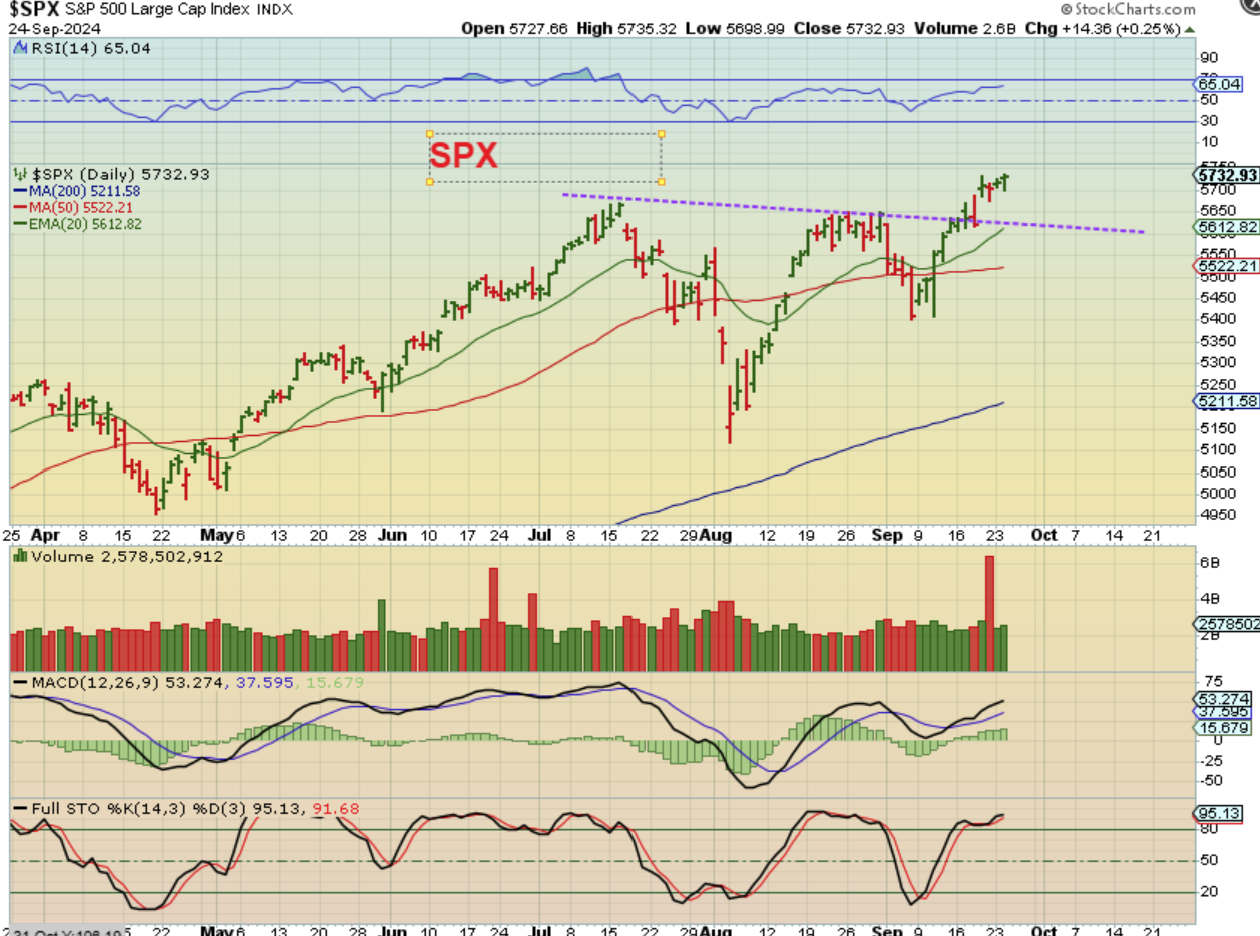
So now we have The SPX on day 35 and it did make another new high, but it should be due for a dip into a dcl soon, and that would be a buy the dip.
.
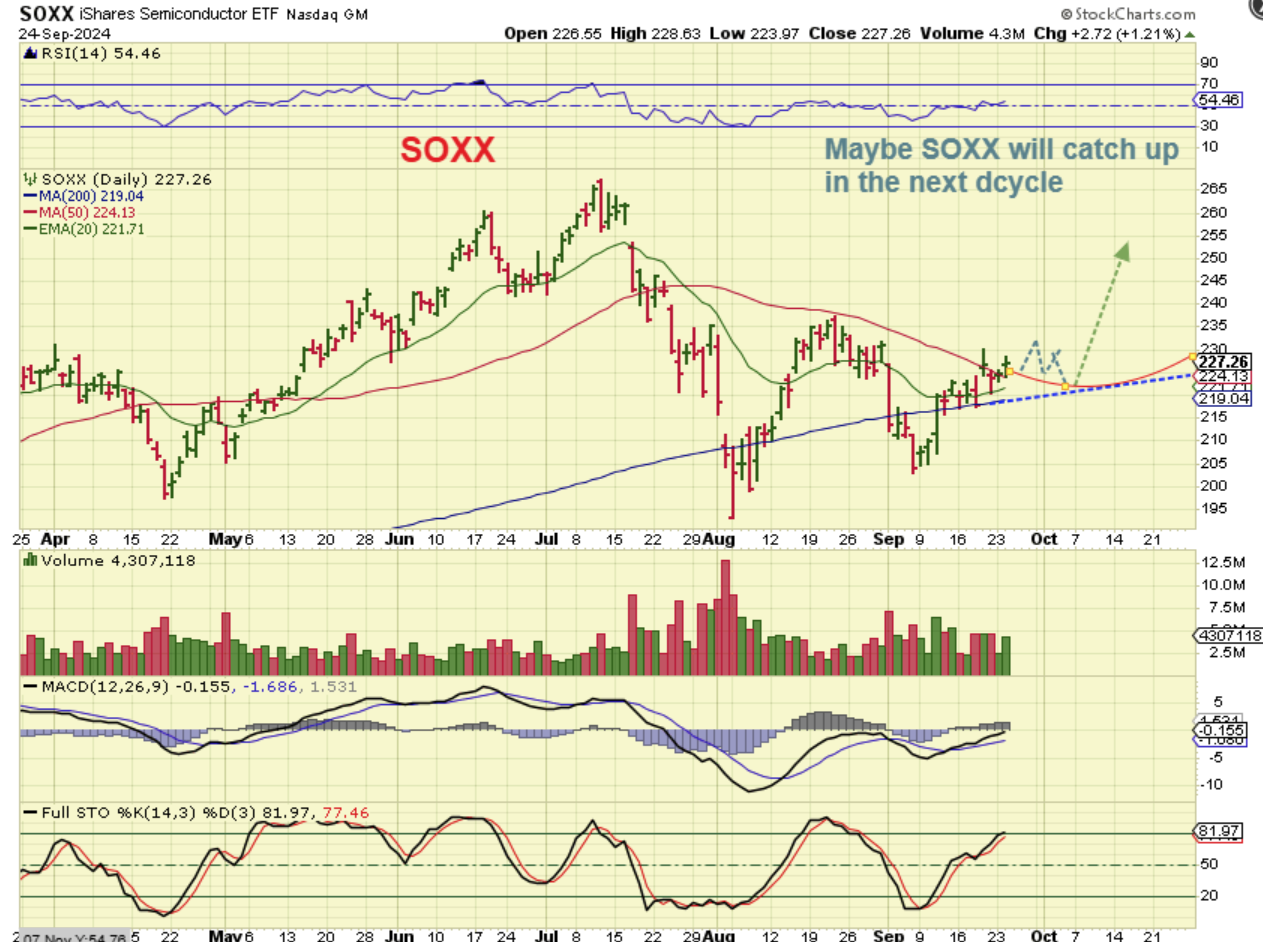
THE SOXX is still just choppy and it may remain that way for now, so we may have to wait for the next daily cycle to see if it can get any traction. IF IT DOES NOT get moving, it is likely that the General Markets will chop sideways and struggle too. If the SOXX runs up to its former highs as drawn here, the SPX & NASDAQ will continue the bull run too.
.
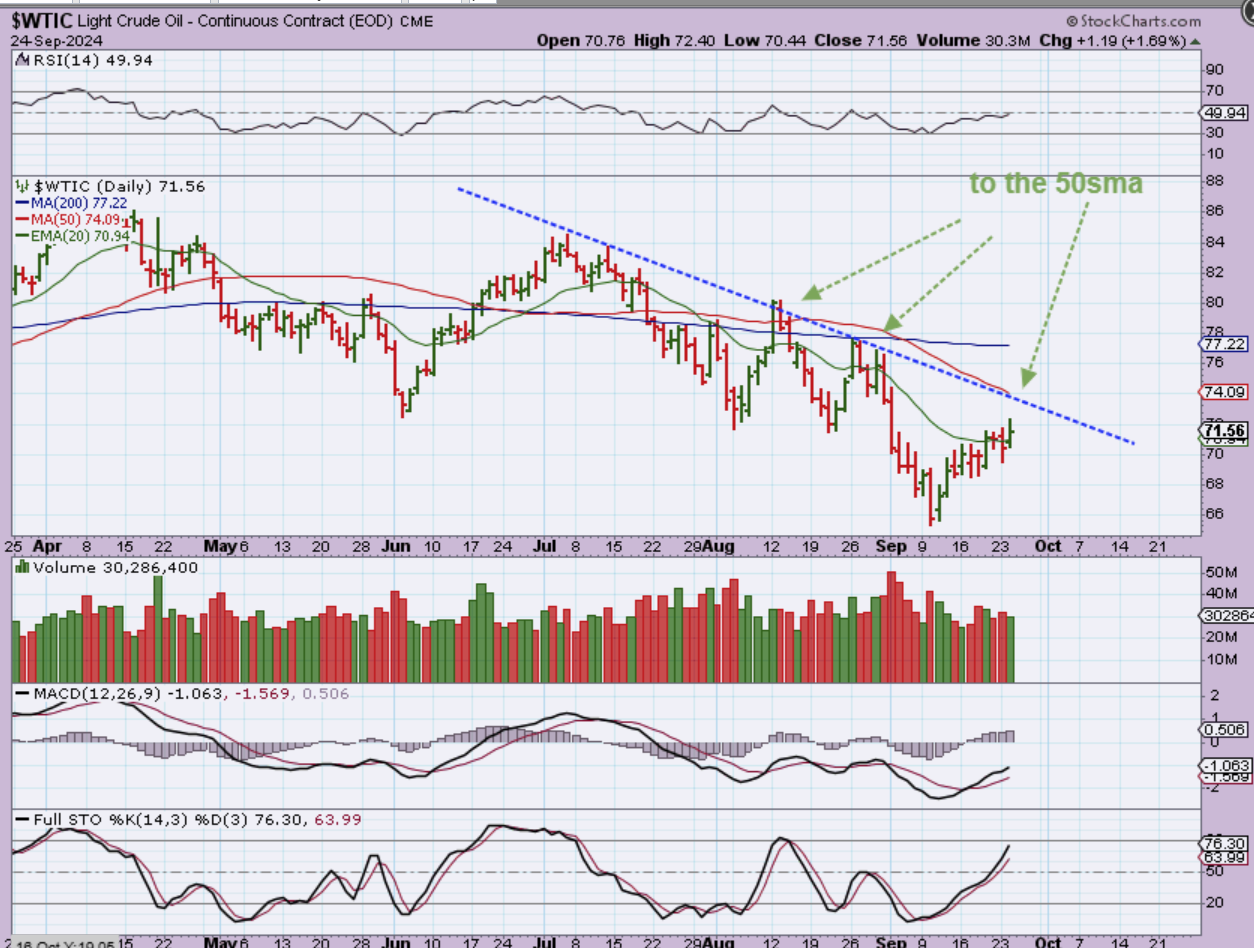
WTIC – This bounce should roll over, since the September lows came in too early for an Oil dcl. It may tag the 50 sma first.
.
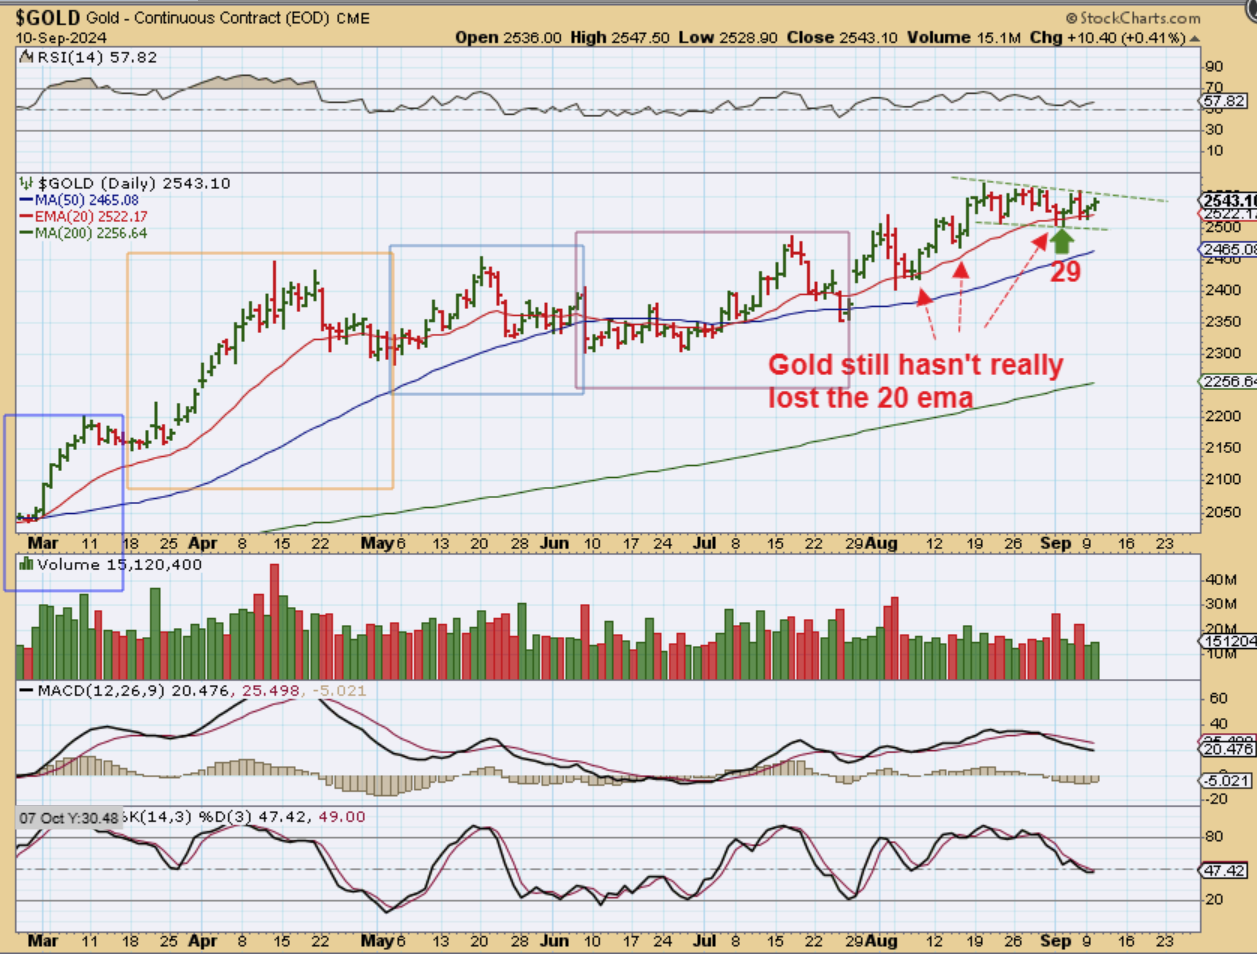
GOLD ON SEPTEMBER 10 – I had been pointing out how well Gold has held up. It really was riding the 20 ema now, and a dip on day 29 didn’t look like a dip deep enough for a dcl, but it could be? If it broke down, the dcl was ahead, if it broke above this upper green line, we may have the lows in place. VERY MILD.
.
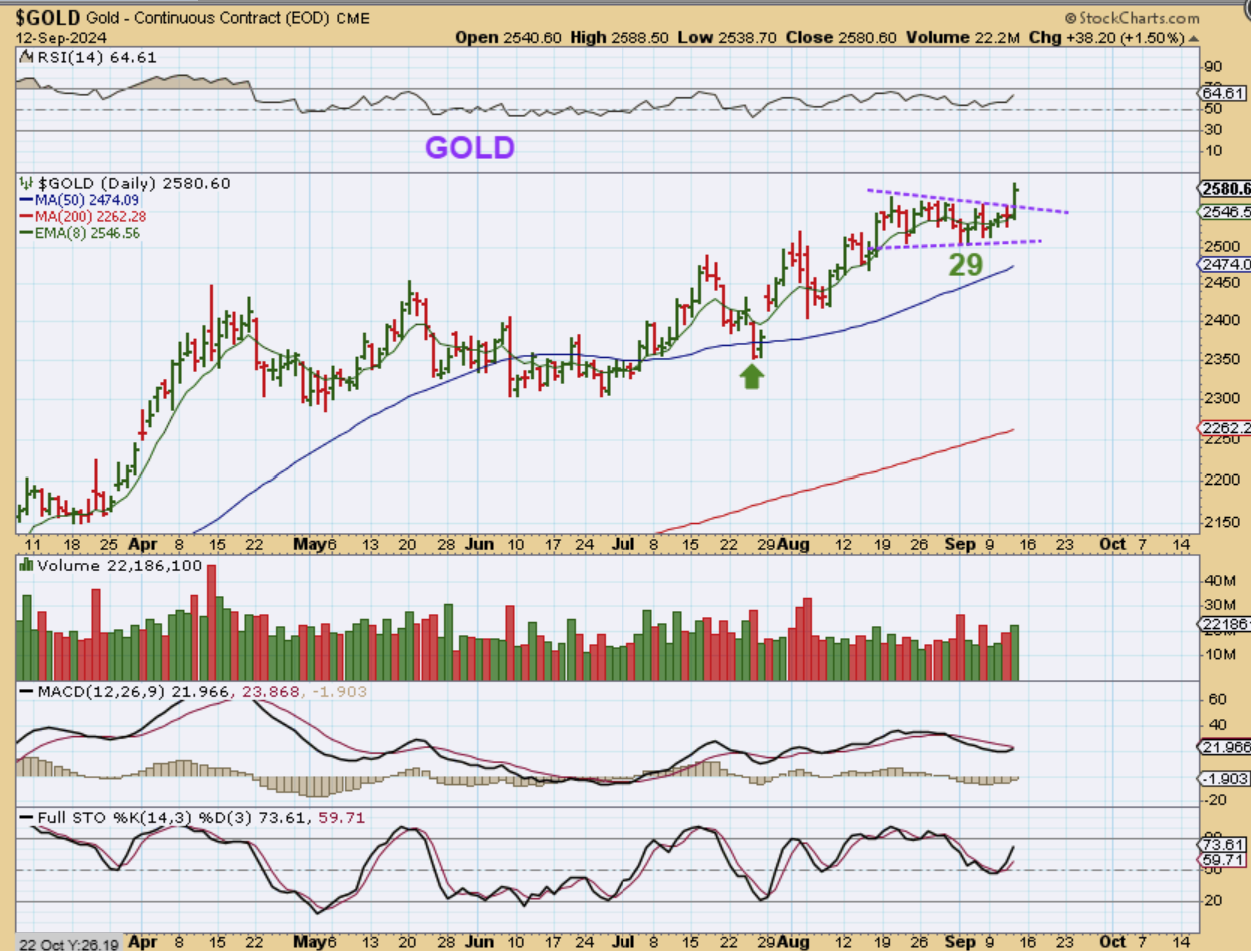
GOLD ON SEPT 12: Gold broke out and day 29 was now looking like the mild dcl.
.
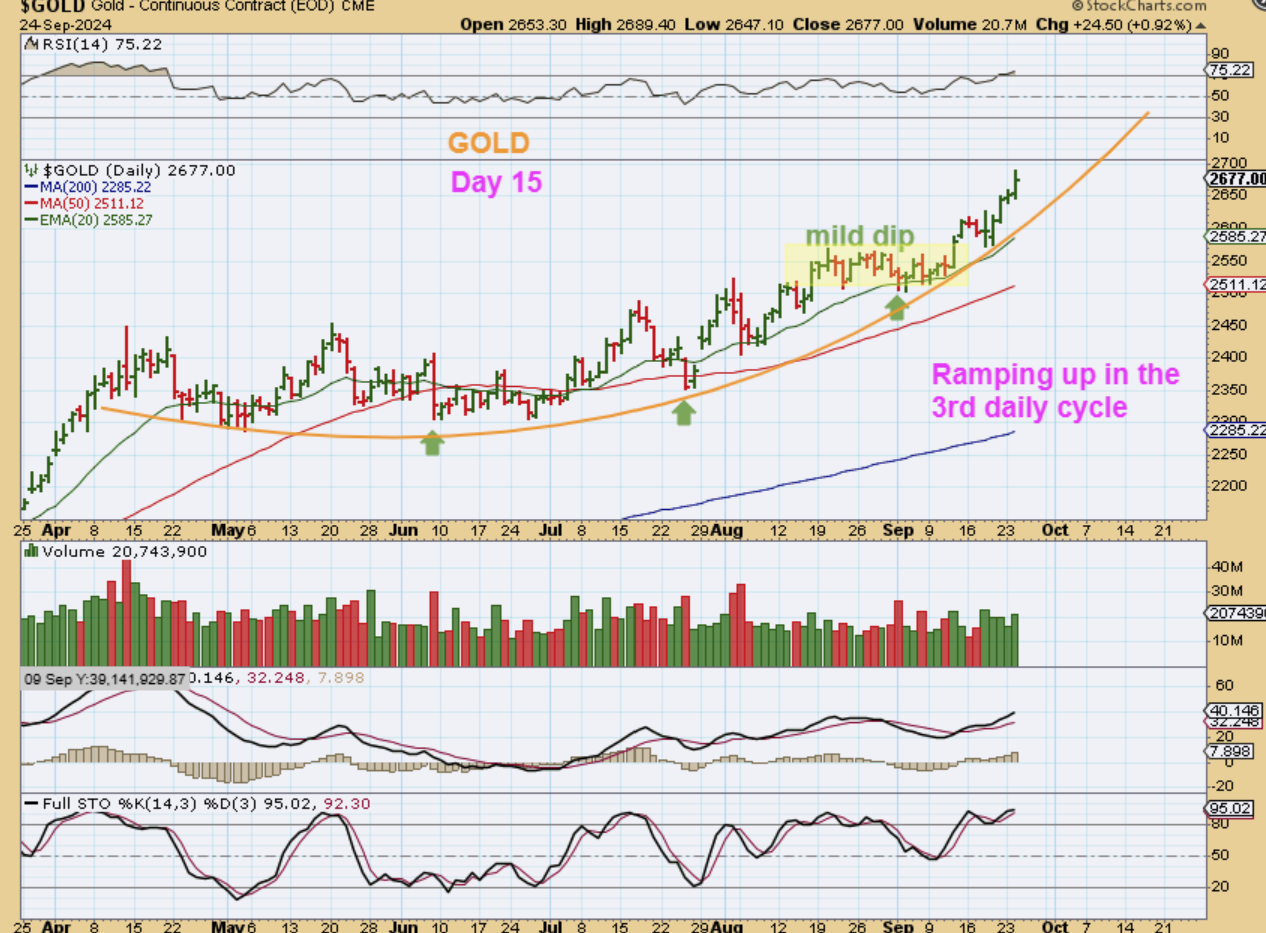
GOLD is now continuing to run up and along that 20 ema, and now it even looks to be a bit steeper as it runs higher in this 3rd daily cycle.
.
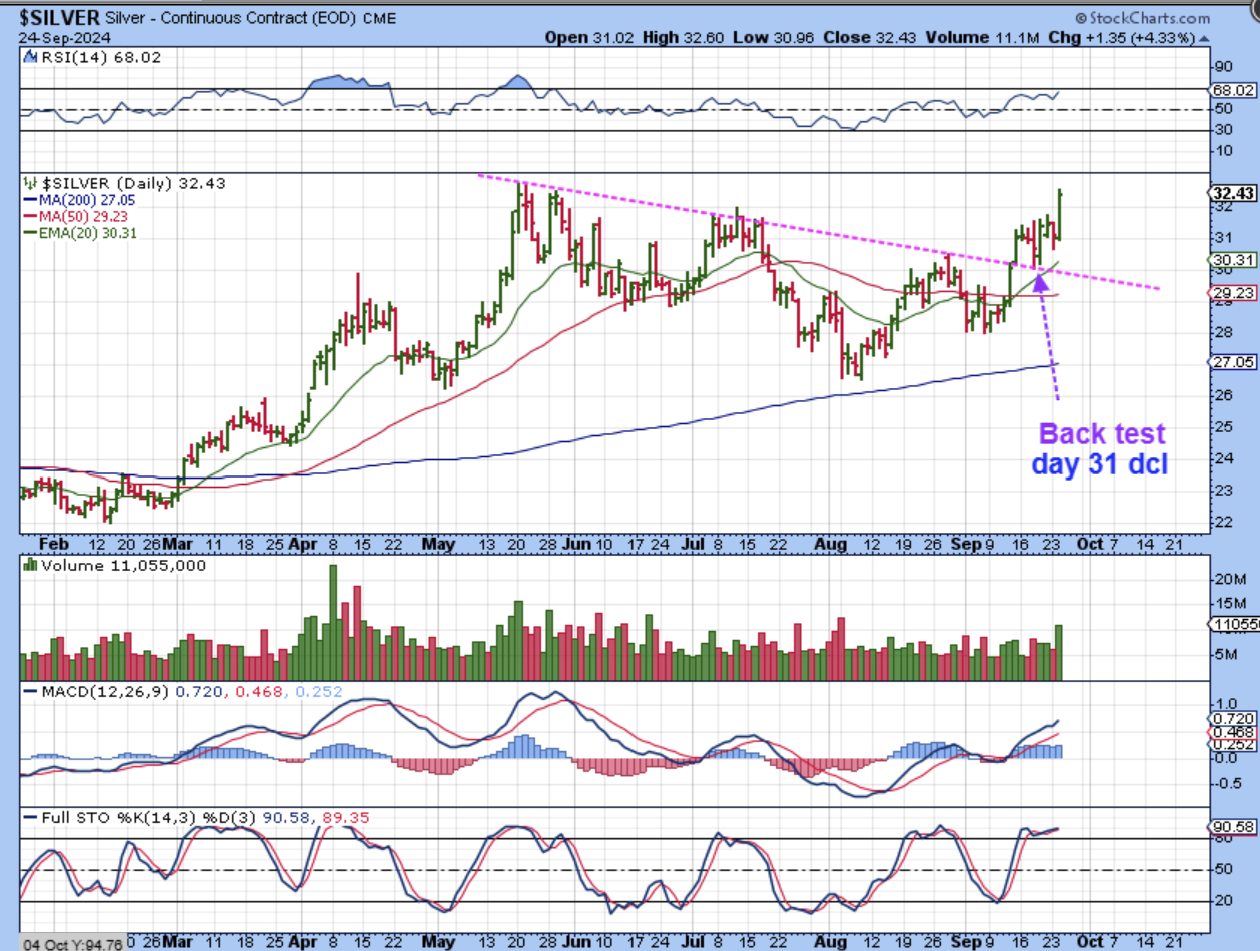
SILVER also broke out and back tested the 20 ema and the trendline too, on day 31. Was Silver now giving us a quick mild dcl too? Yes. We are looking at Silver also as having put in an ICL, so that DCL would be a buy for Silver & Silver stocks. This chart would make yesterday day 4, however…
.
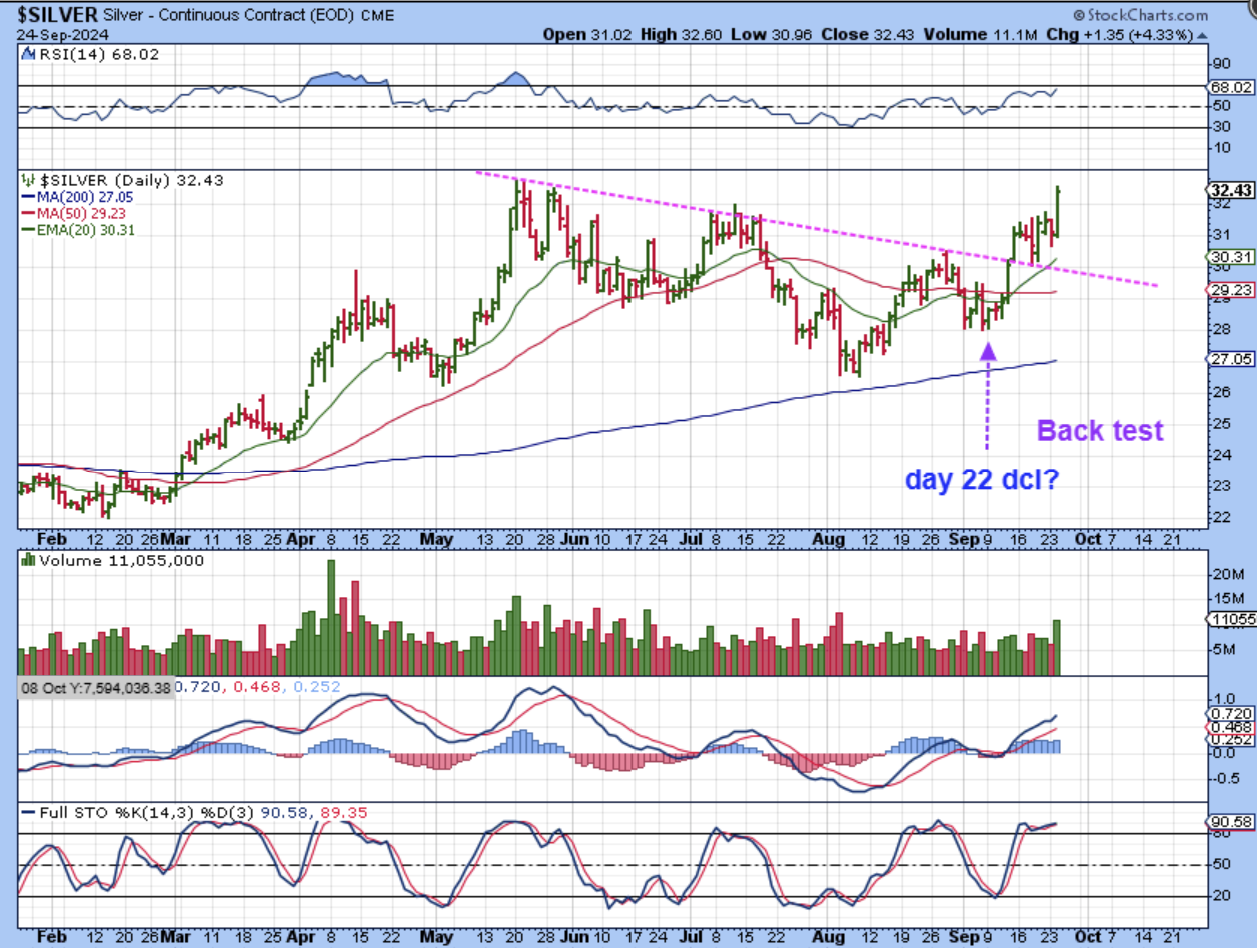
SILVER – Obviously we have to wonder about that day 22 dip as a possible early dcl. Take a look and you’ll see that we did have a day 24 dcl in that April-May daily cycle. This view would put us on day 12 for Silver if it has a day 22 dcl, but either way it can continue higher.
.
.
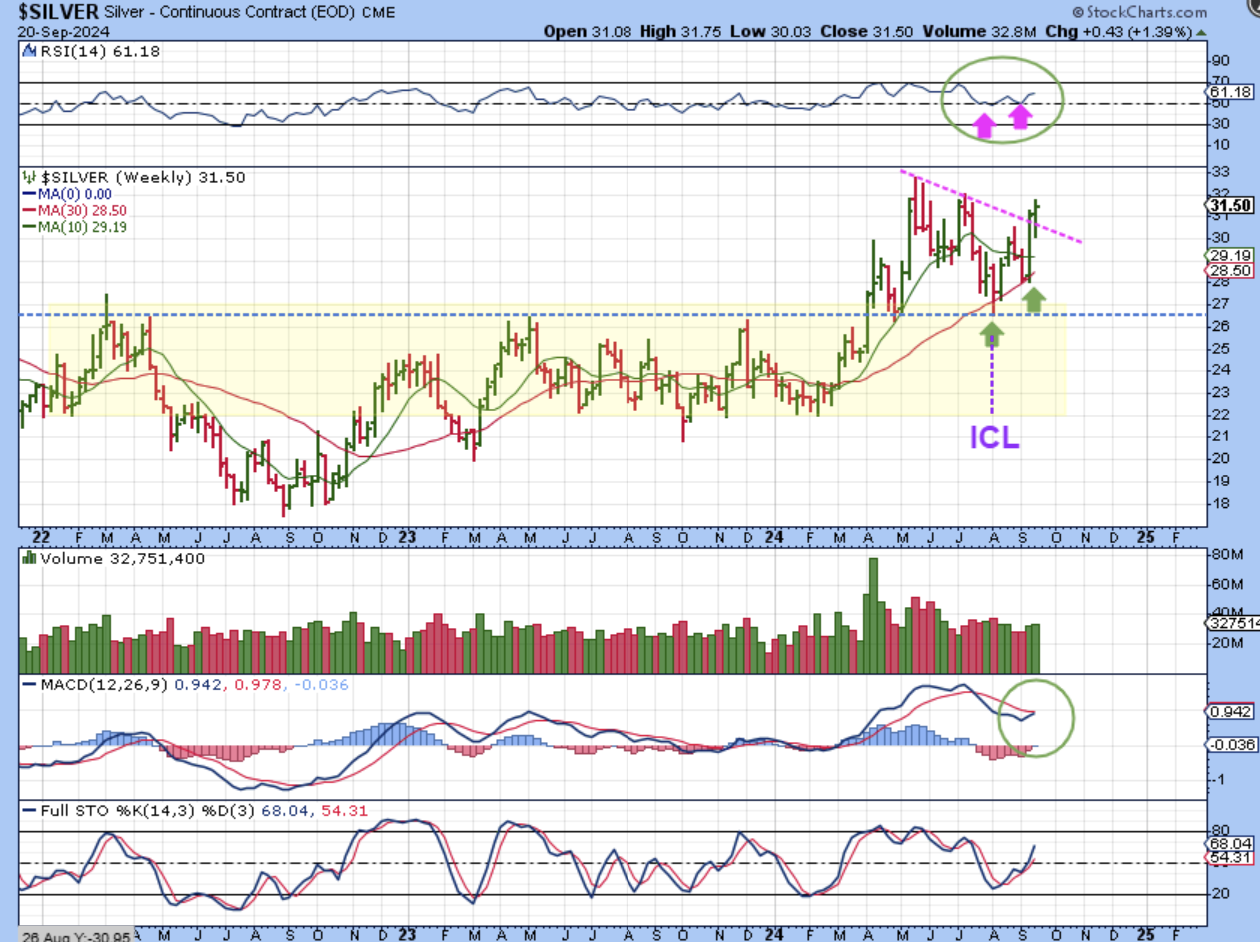
SILVER – In the weekend report I showed this weekly chart of silver tagging the 30 week ma twice. THAT MIGHT BE THE ICL & DCL, and now we are seeing nice follow through. This big picture is very promising.
.
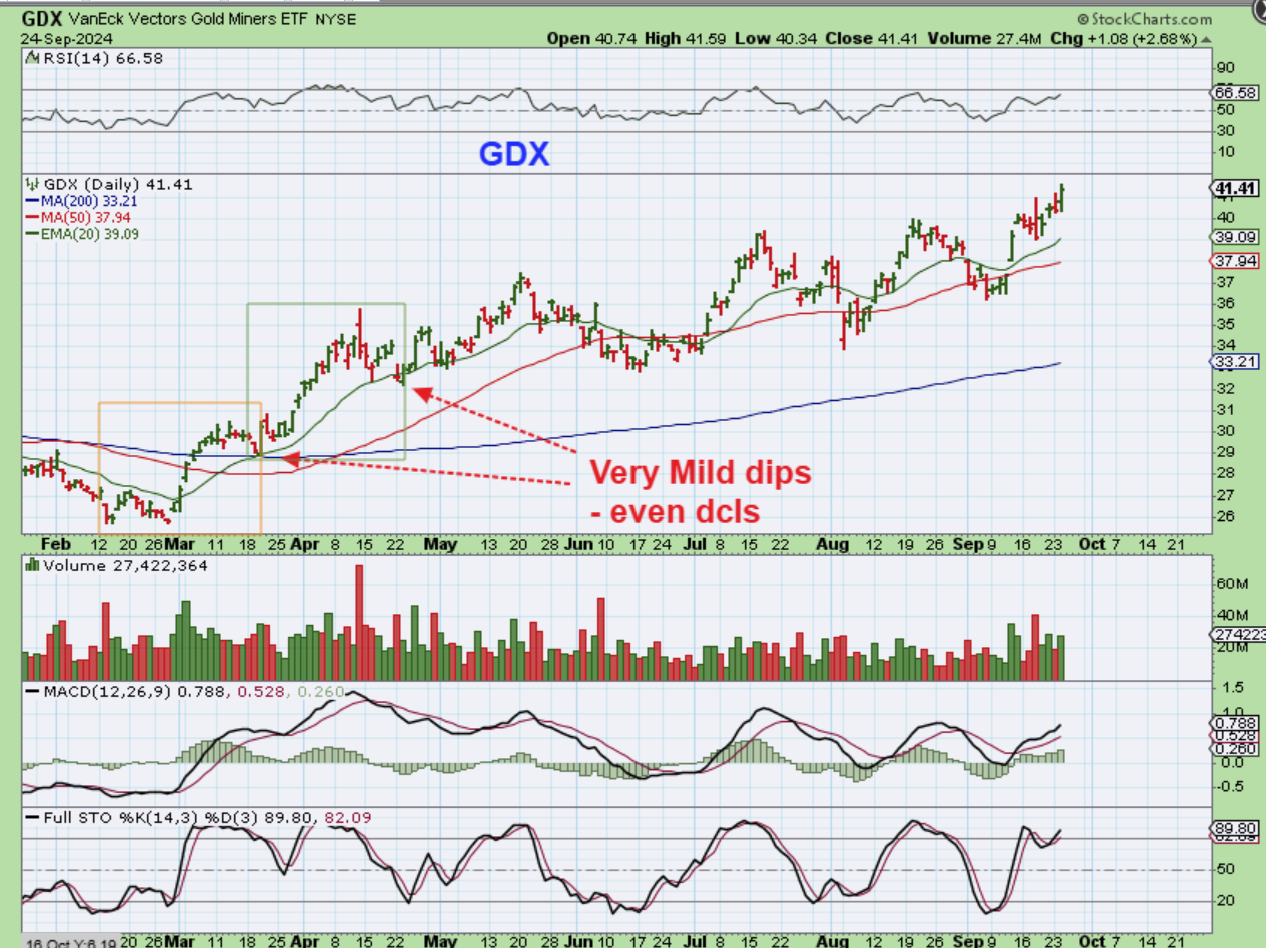
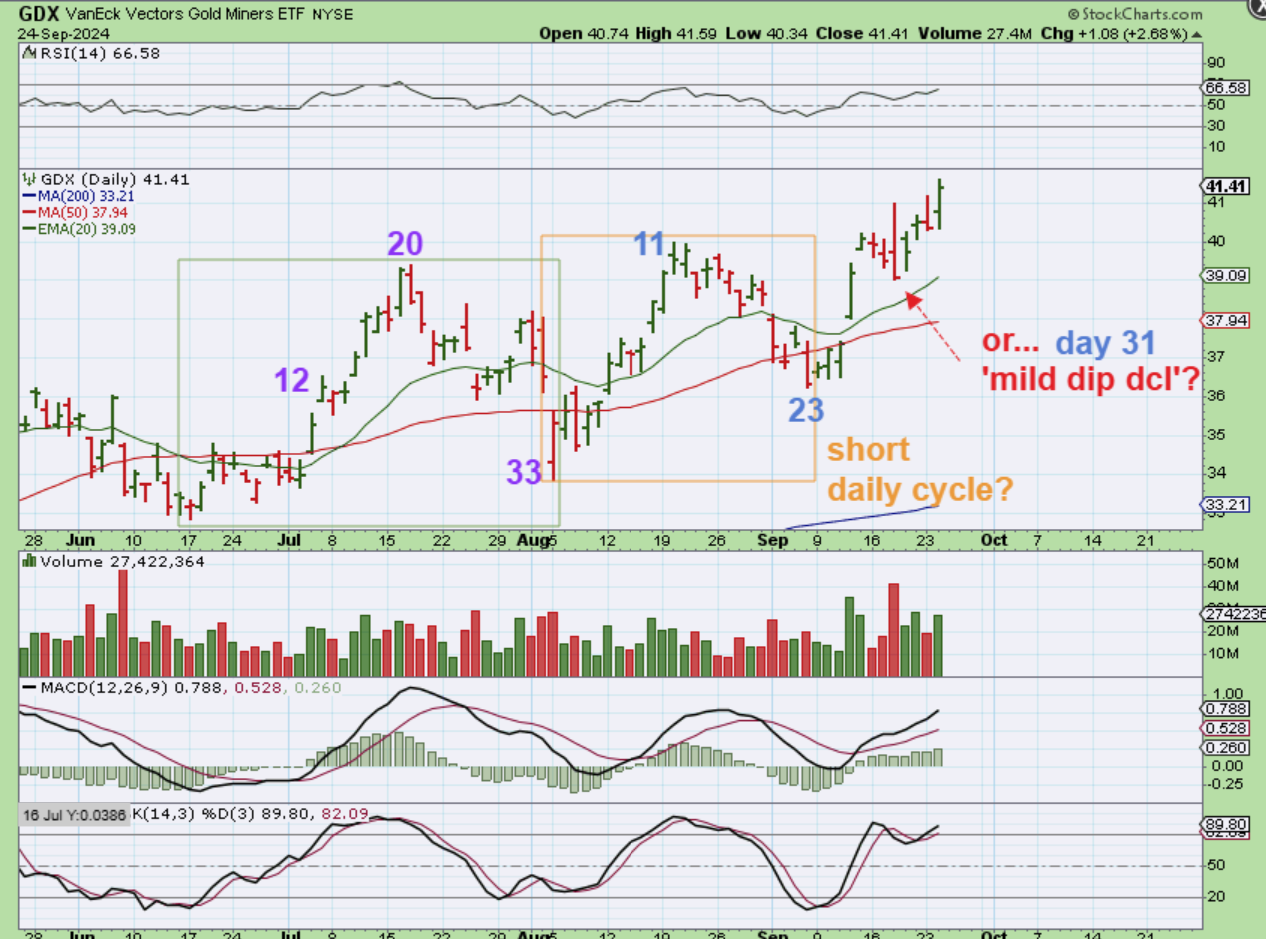
What about the GDX? It was looking similar to Silver on a daily chart? Is the dcl any clearer here? Not really, it still matches Silver.
.
GDX – In the pervious run up of February through June, we saw smaller daily cycles and very MILD dips, when it came to dcls. After that, the run became quite choppy with wide swings and deeper dips, so it does make GDX hard to guage just like Silver. MARCH TO APRIL had a 24 day daily cycle, so did we get another short one?…
.
GDX had a 33 day daily cycle (normal) from June to August. Next it did drop into a day 23 low (dcl???) and then a large pop and drop day on day 31 , and THAT pop & drop took place when Gold back tested the 20 ema and Silver back tested the 20ema and trendline. AGAIN, either way we count this, it is bullish and can continue higher.
.
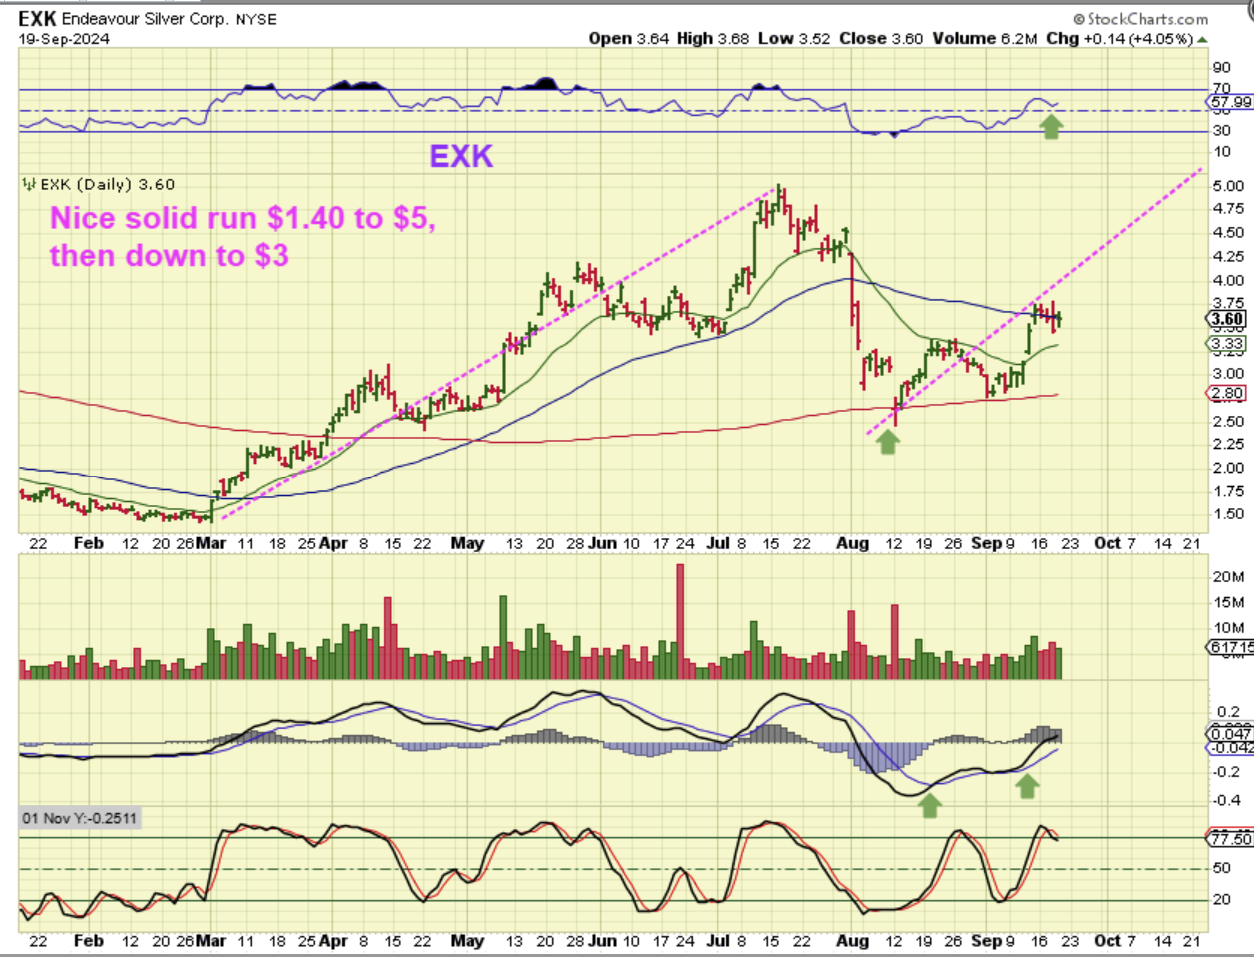
EXK – LAST WEEK I pointed out the Silver stocks and mentioned that a few double bottomed off of the 200sma and were crawling along the 50sma. Silver had an ICL, so these could be bought now or on the next dcl. This chart was in that report…
.
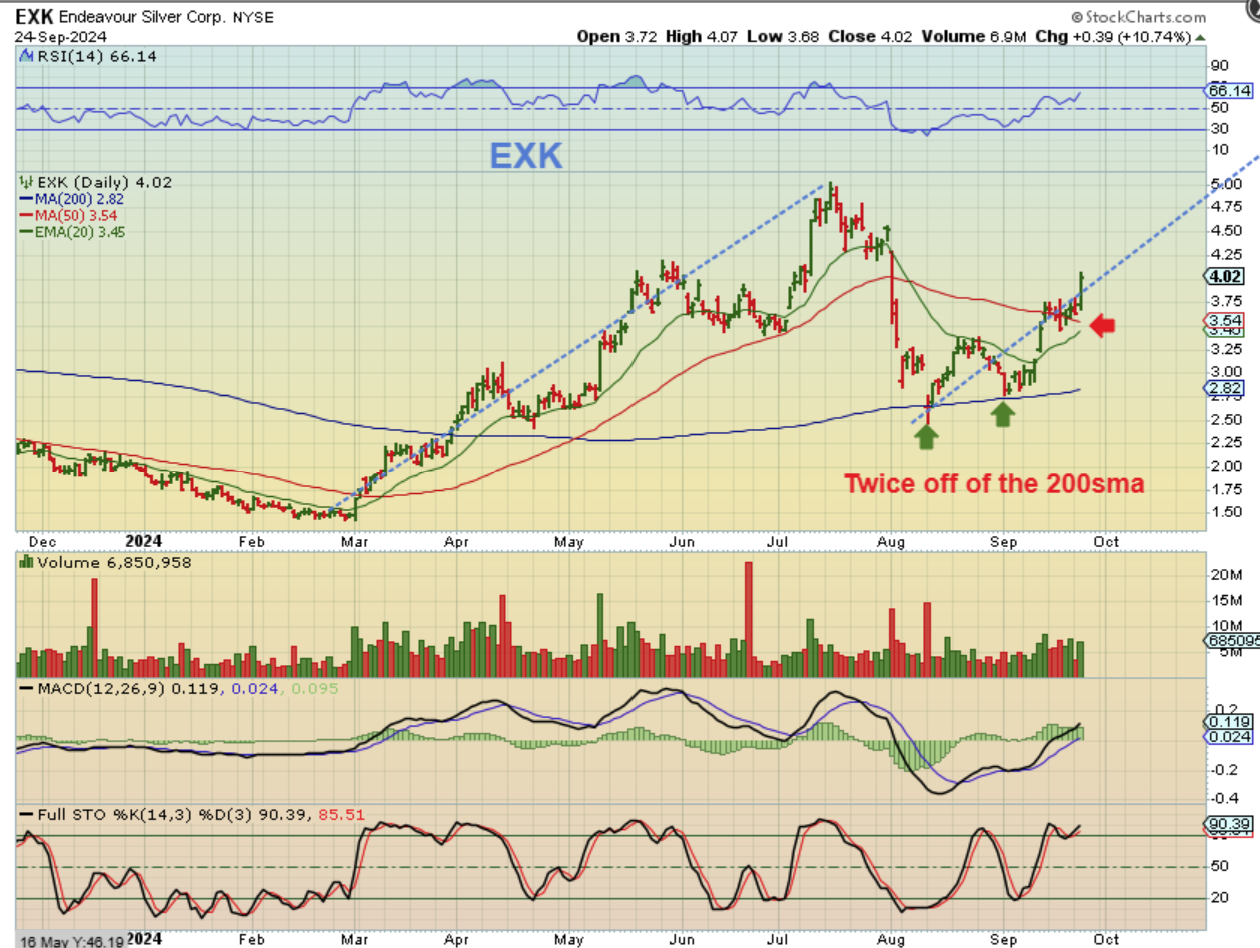
EXK crawled along the 50sma and popped sharply yesterday, up over 11% at one point.
.
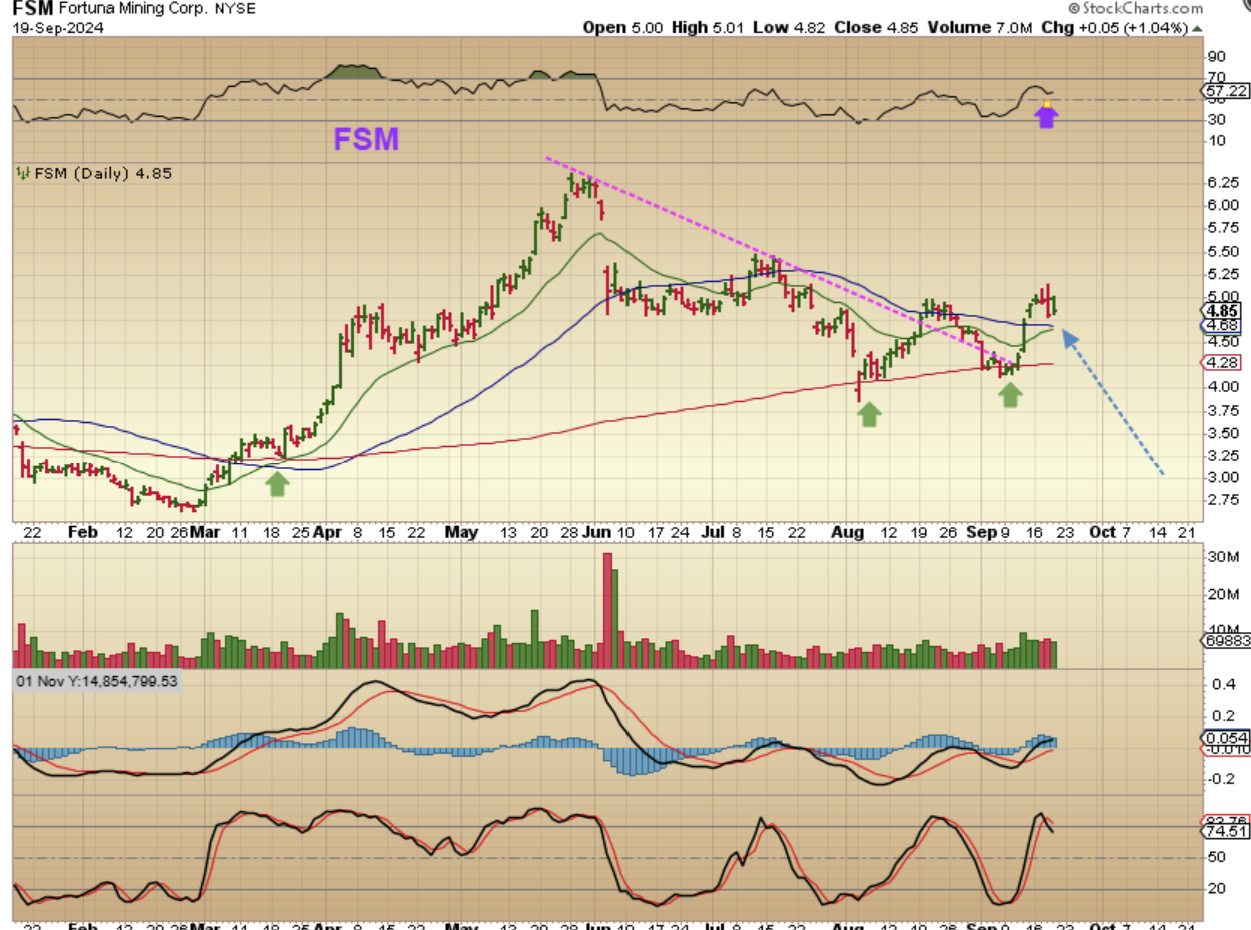
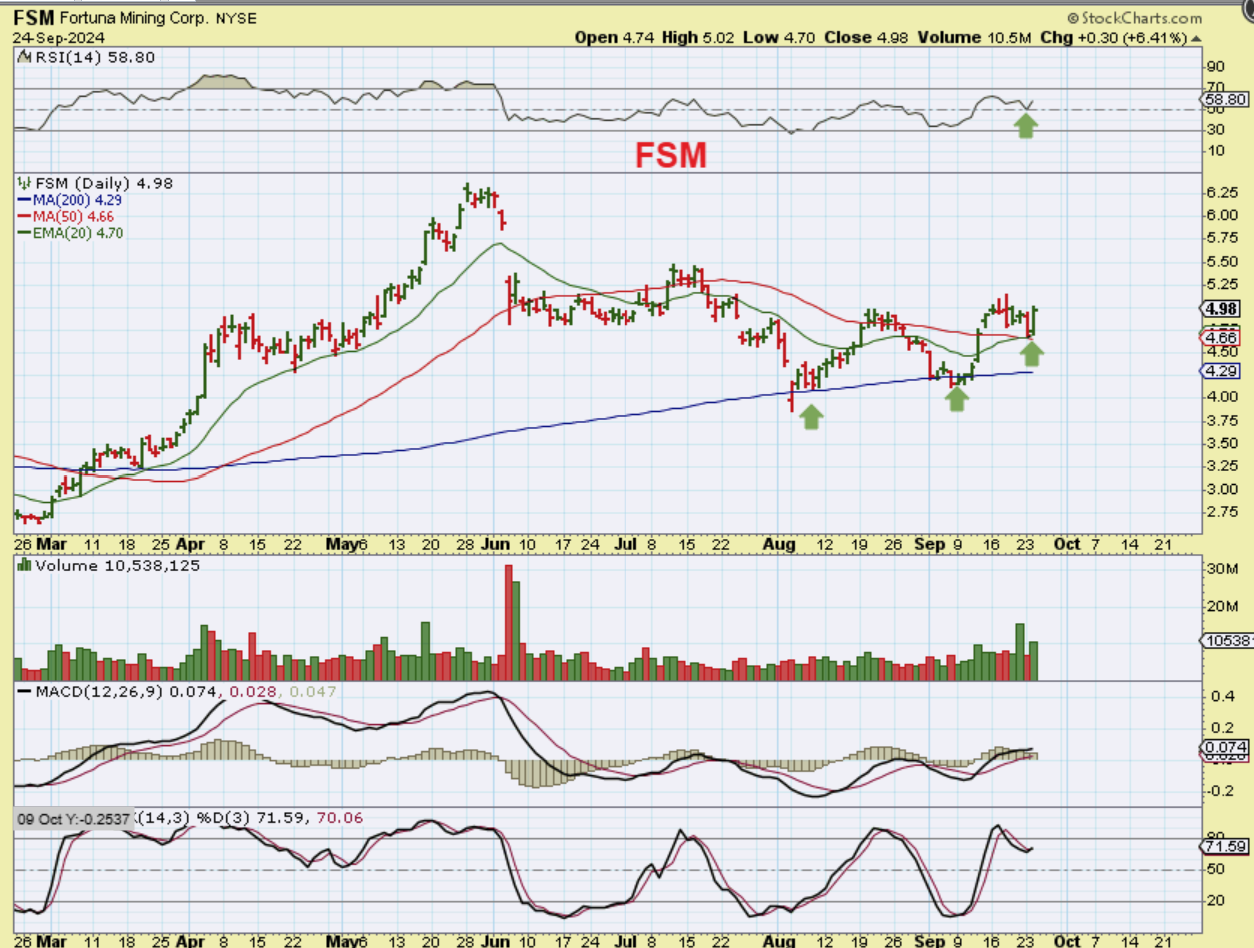
FSM – I also used this chart in that report, again showing a double bottom at the 200sma for the ICL…
.
FSM dipped to the 50sma and 20 ema and then it popped yesterday, BUT this looks a little like a lagger and so I think that it could run back up to the May highs.
.
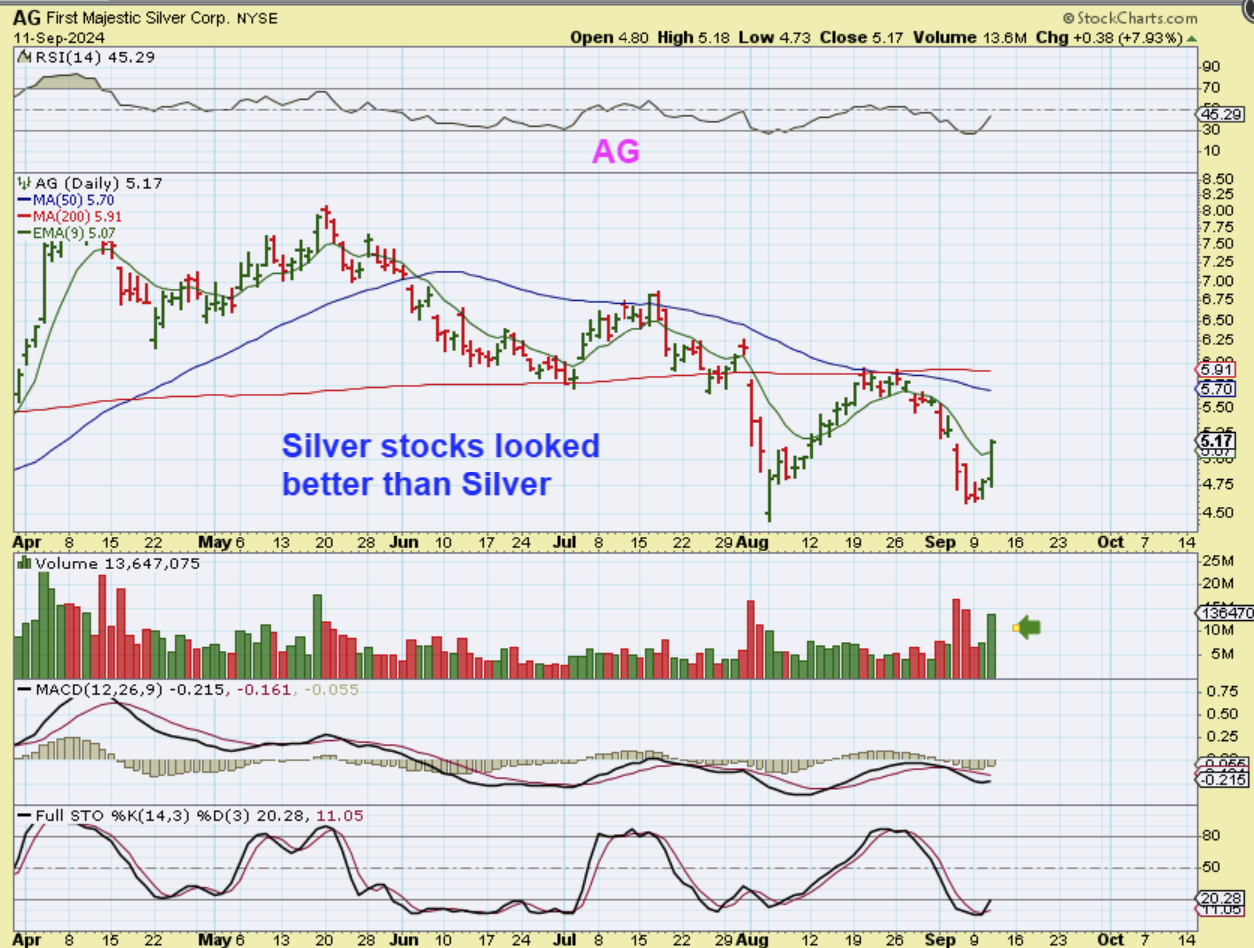
AG bought GATO, so it dropped on the news as the ‘buyer’, but it looked ready to try to recover on September 11th pop. I had this chart in that report. AG was oversold and Silver stocks looked better than Gold at this point…
.
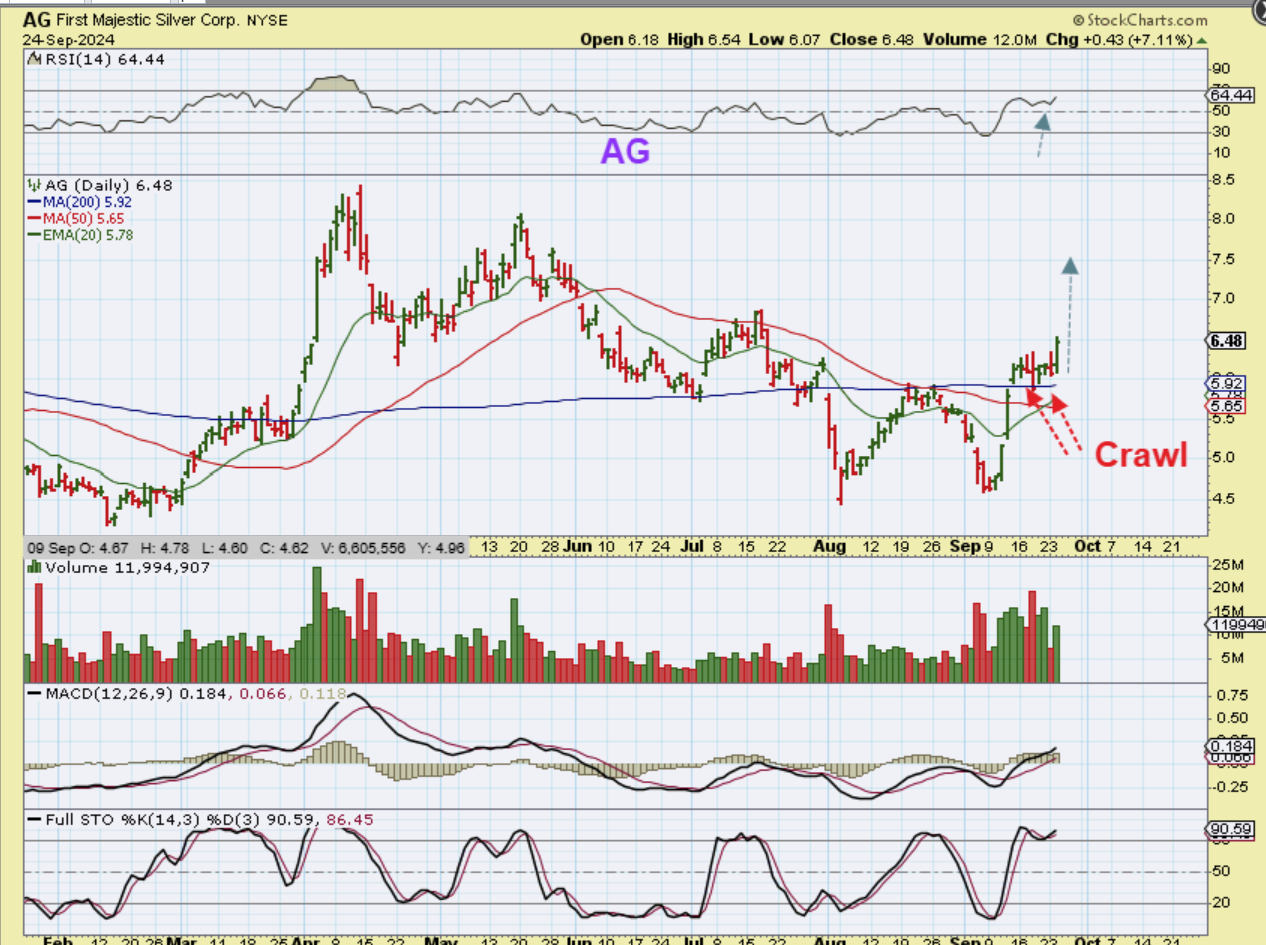
AG has done very well out of the double bottom lows and after crawling along the 200sma, it also started to push higher yesterday (7%). Even though First Majestic dropped with that purchase, it is a good company and Silver is pulling it higher as it started running higher out of that ICL. In Feb to April AG ran $4.50 to $8.50 and can do that again.
.
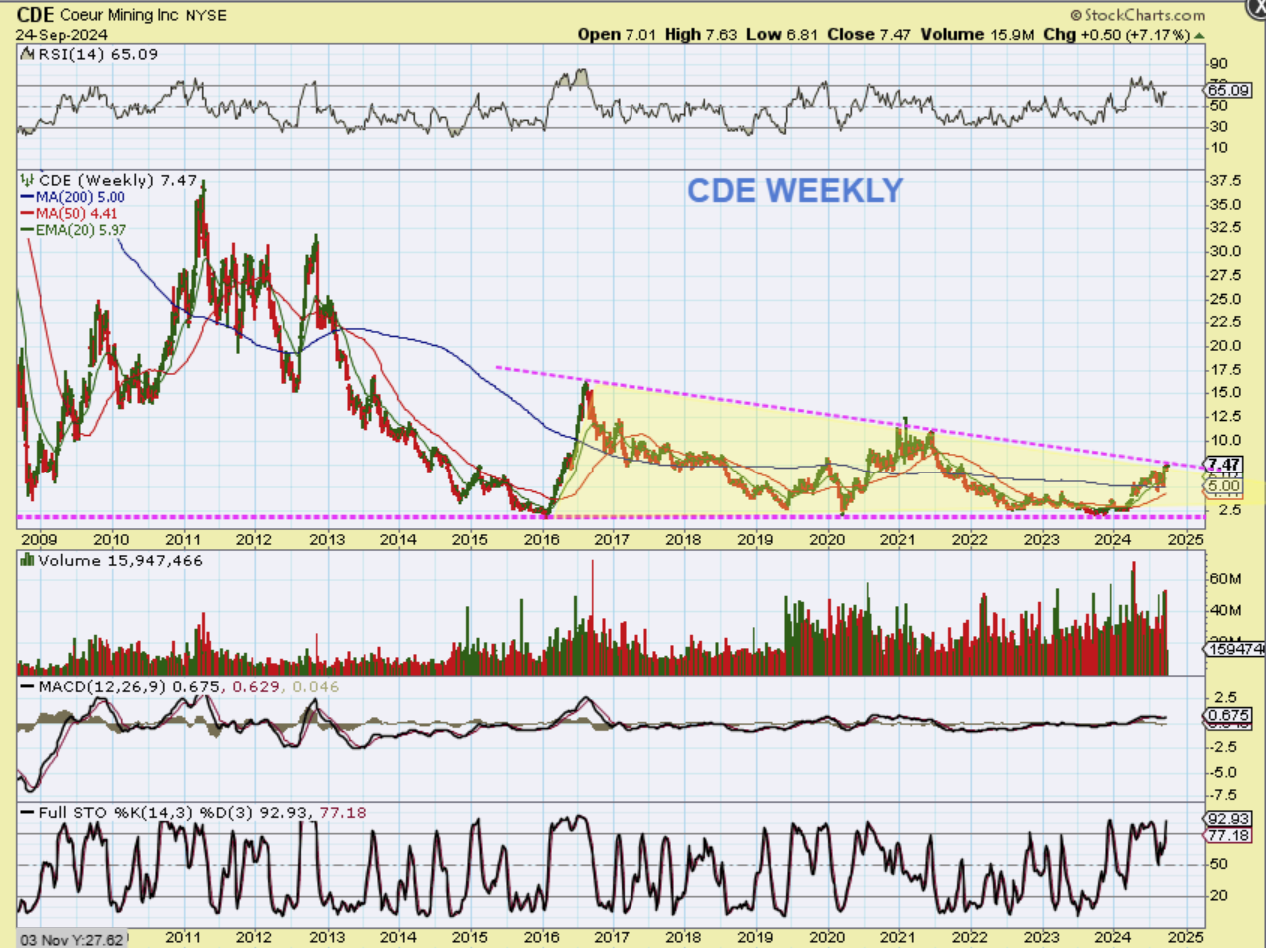
CDE WEEKLY – In 2024 CDE ran from $2.50 to $7.50 and now looks like it may be ready to breakout from this downtrend (wedge). This is the large base that has formed since the 2016 bull run and the 2020 bull run.
.
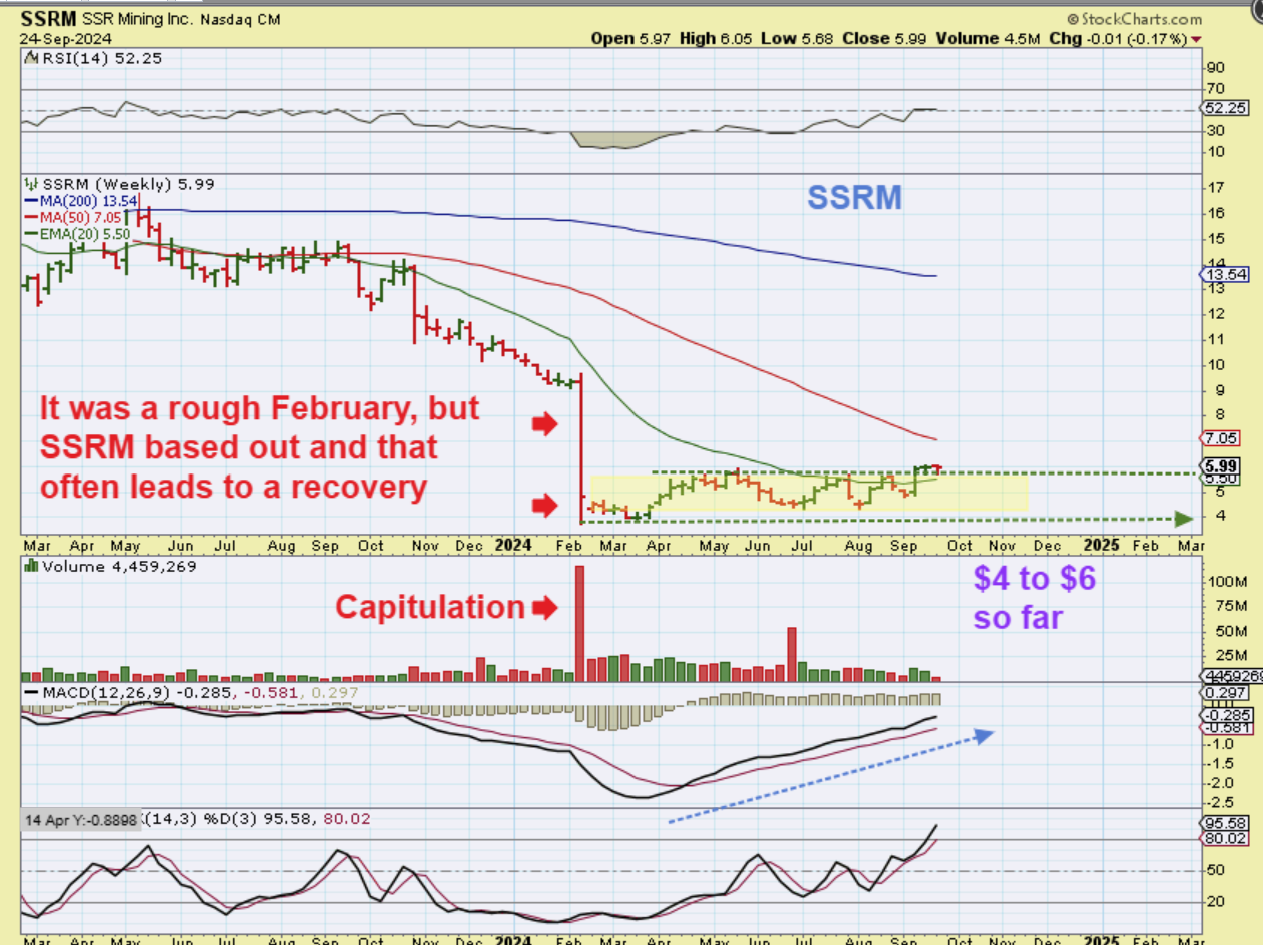
SSRM WEEKLY – Speaking of bases, SSRM is chopping sideways, but it has formed a long base and it too can recover over time.
.
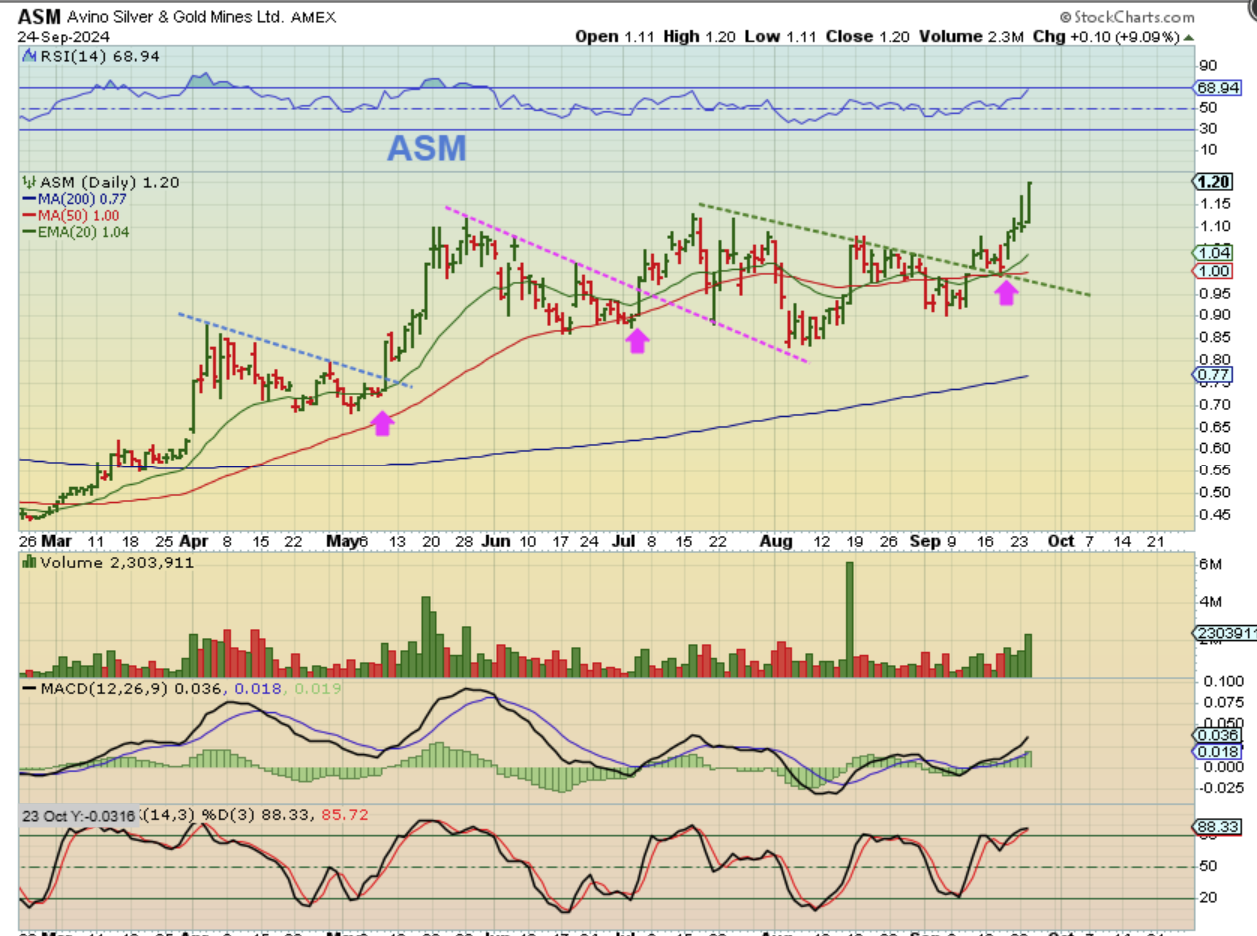
ASM WEEKLY – ASM has been very choppy as it dropped into each dcl, but you can see that after the recent ICL for Silver in August, it has moved from $0.85 to $1.20 and yesterday it had a 9% surge. Important why?…
.
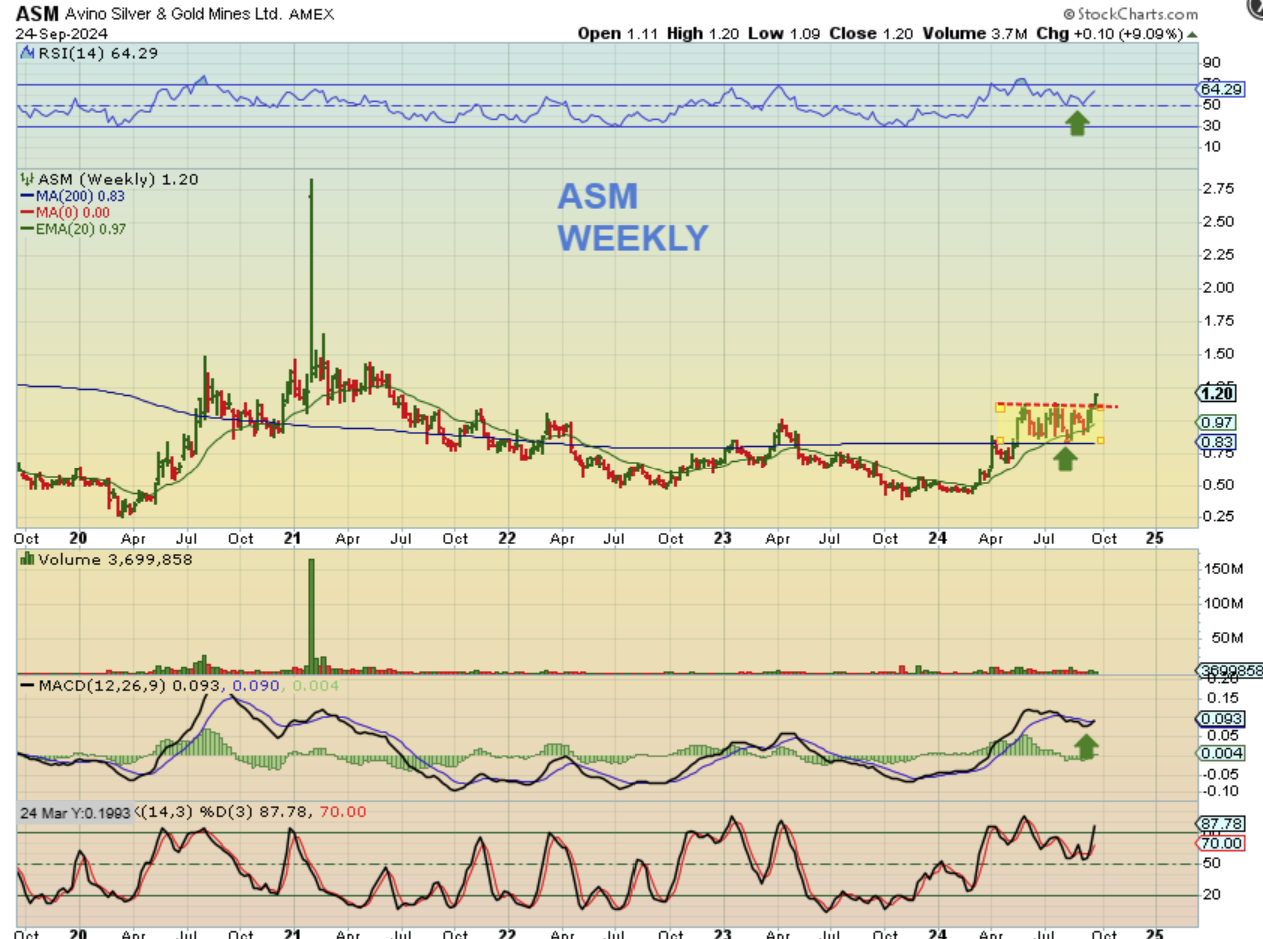
ASM WEEKLY – That choppiness appears to be a long bullish consolidation on the 200 week ma, using this weekly chart, and that surge this week is breaking out from that area. The weekly MACD is curling up, the weekly RSI held 50%, and this is a longer term bullish chart, so the Silver sector continues to look good in the short and long term.
.
The Bulls are running, and it is possible that the Crypto Stocks are now starting to become bullish too. I’ll discuss that briefly below, enjoy your Wednesday trading!
.
~ALEX
.
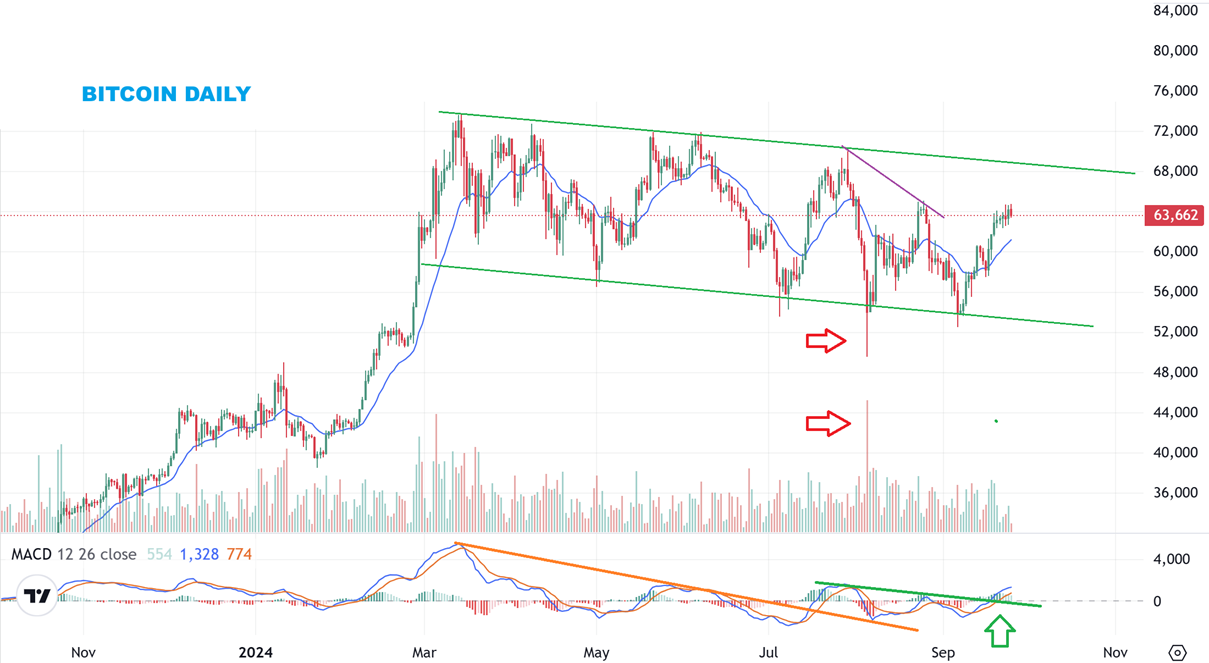
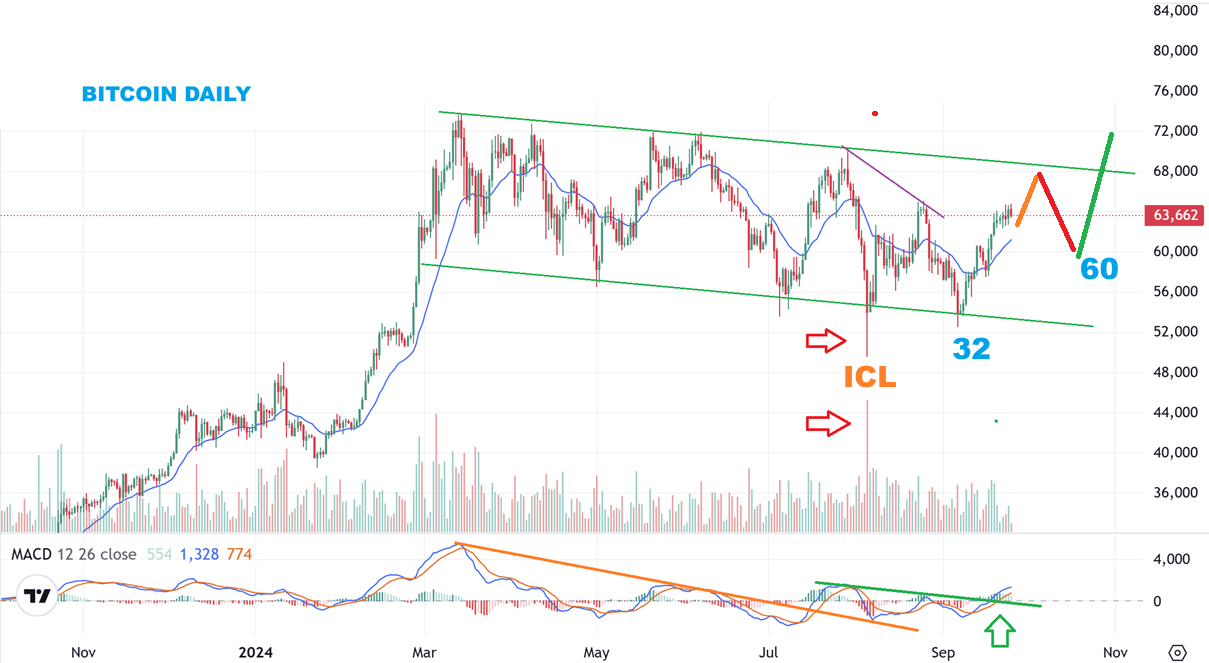
BITCOIN is chopping sideways this week, but I did see bullish action in several of the Crypto stocks now. Does that indicate that Bitcoin is ready to breakout from this massive consolidation soon? Possibly. If so..
.
We are on day 50, so we could rally, dip into day 60, and then breakout, or it may just continue to chop around into day 60ish, and then take off. We’ll keep an eye on things each day.
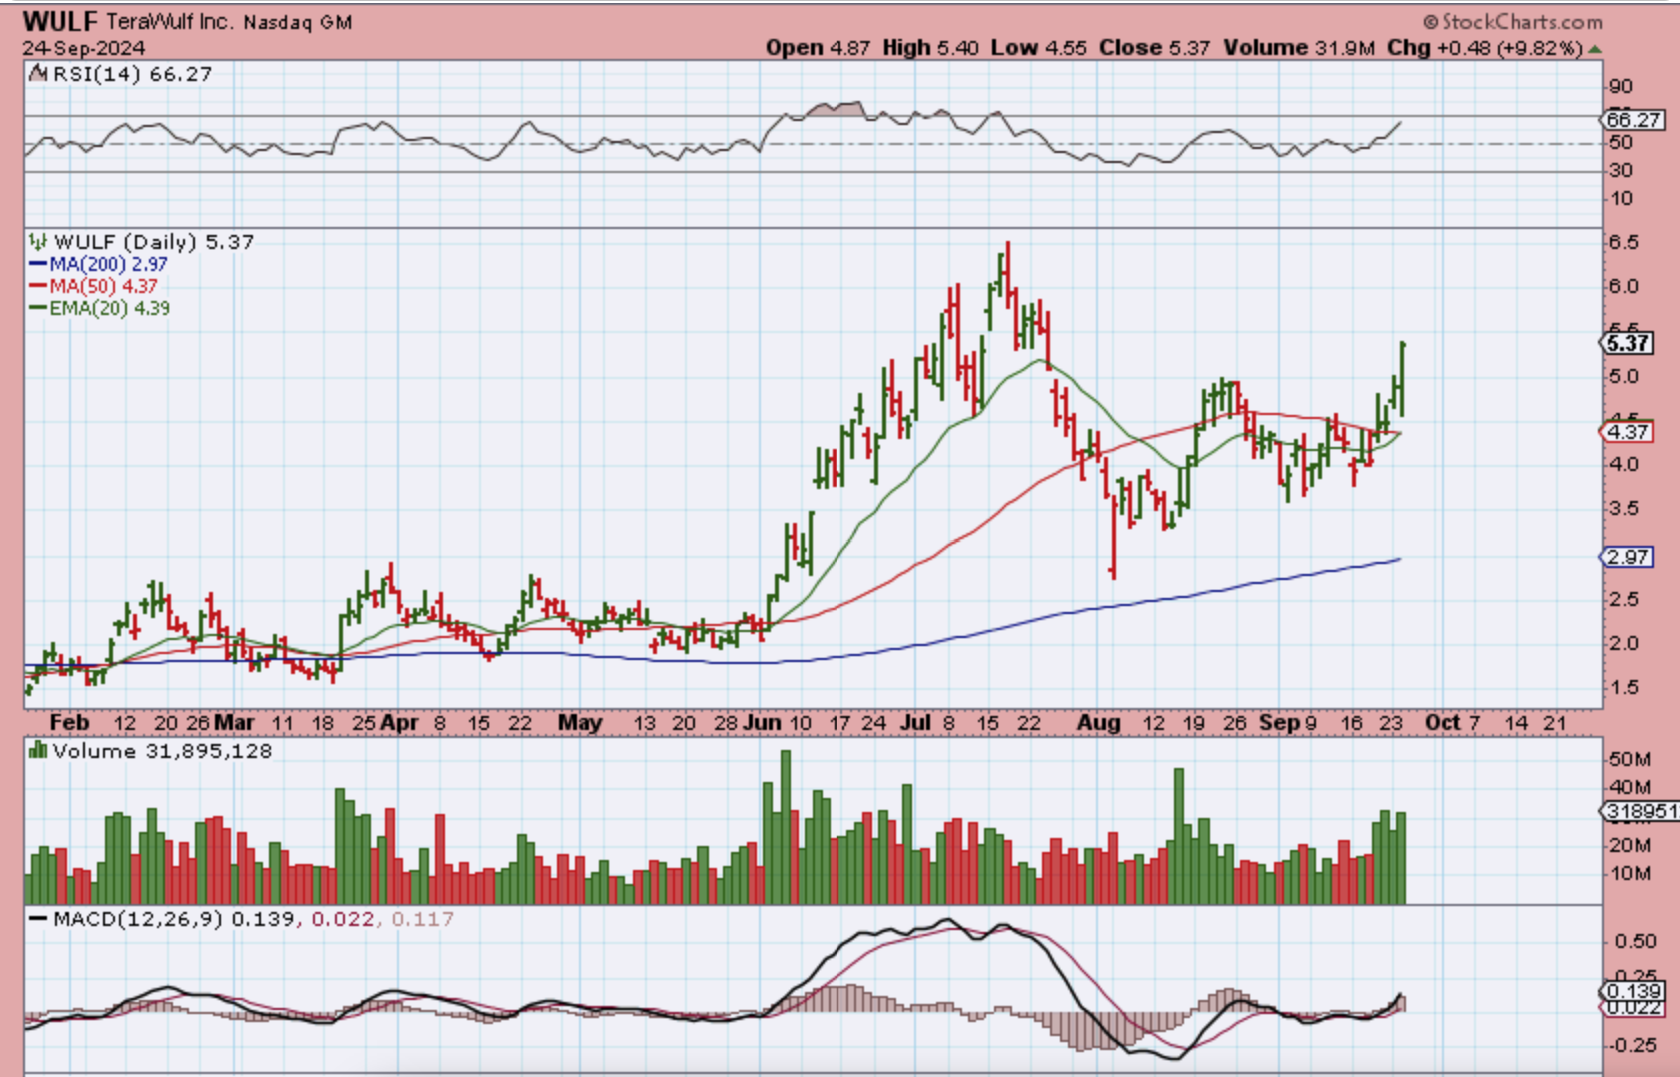
WULF has been very choppy, but suddenly, over time it has now proven to be a bullish set up that popped 10% yesterday.
.
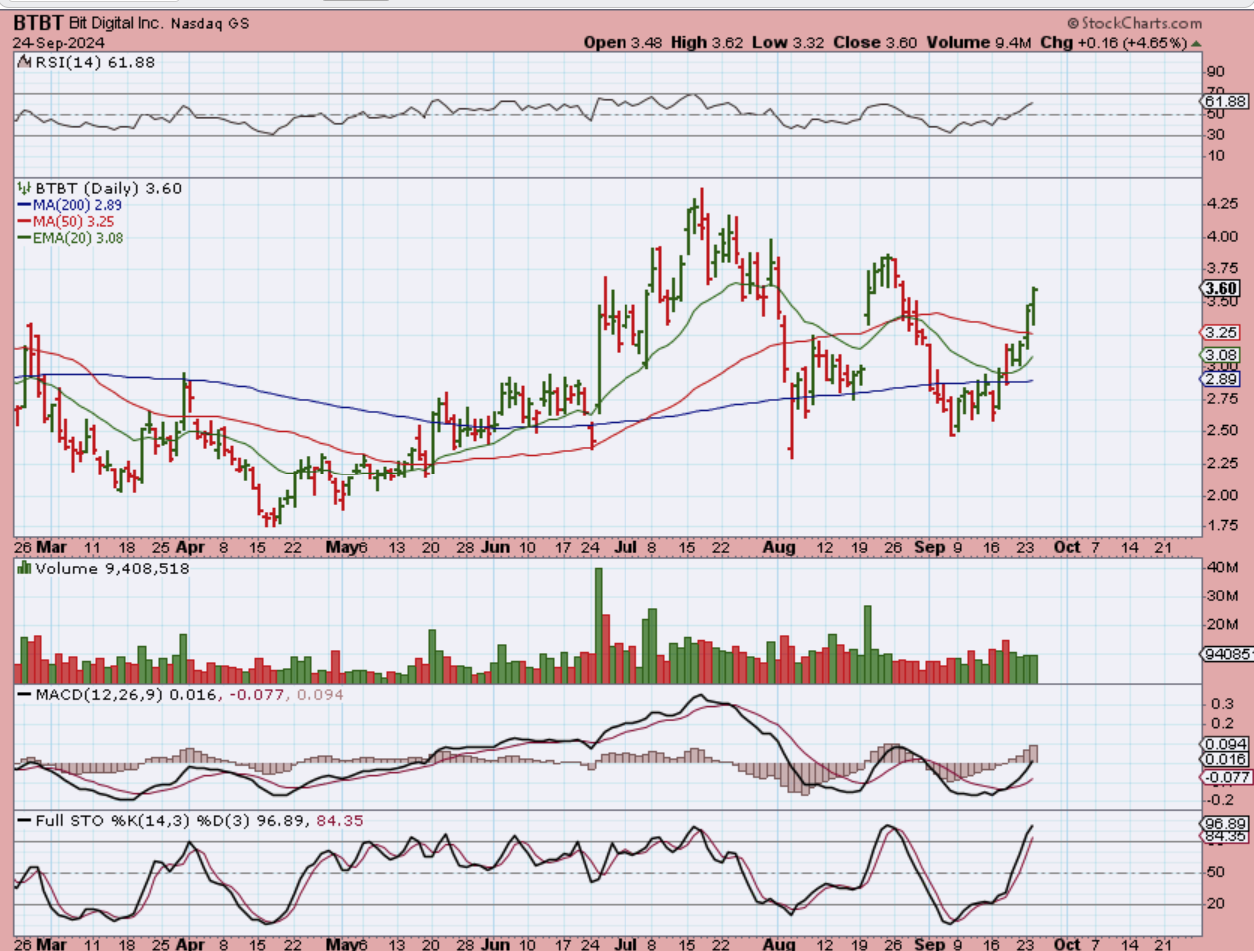
BTBT has been horribly choppy, but when it runs, it runs. It is now trying to recover with Bitcoin.
.
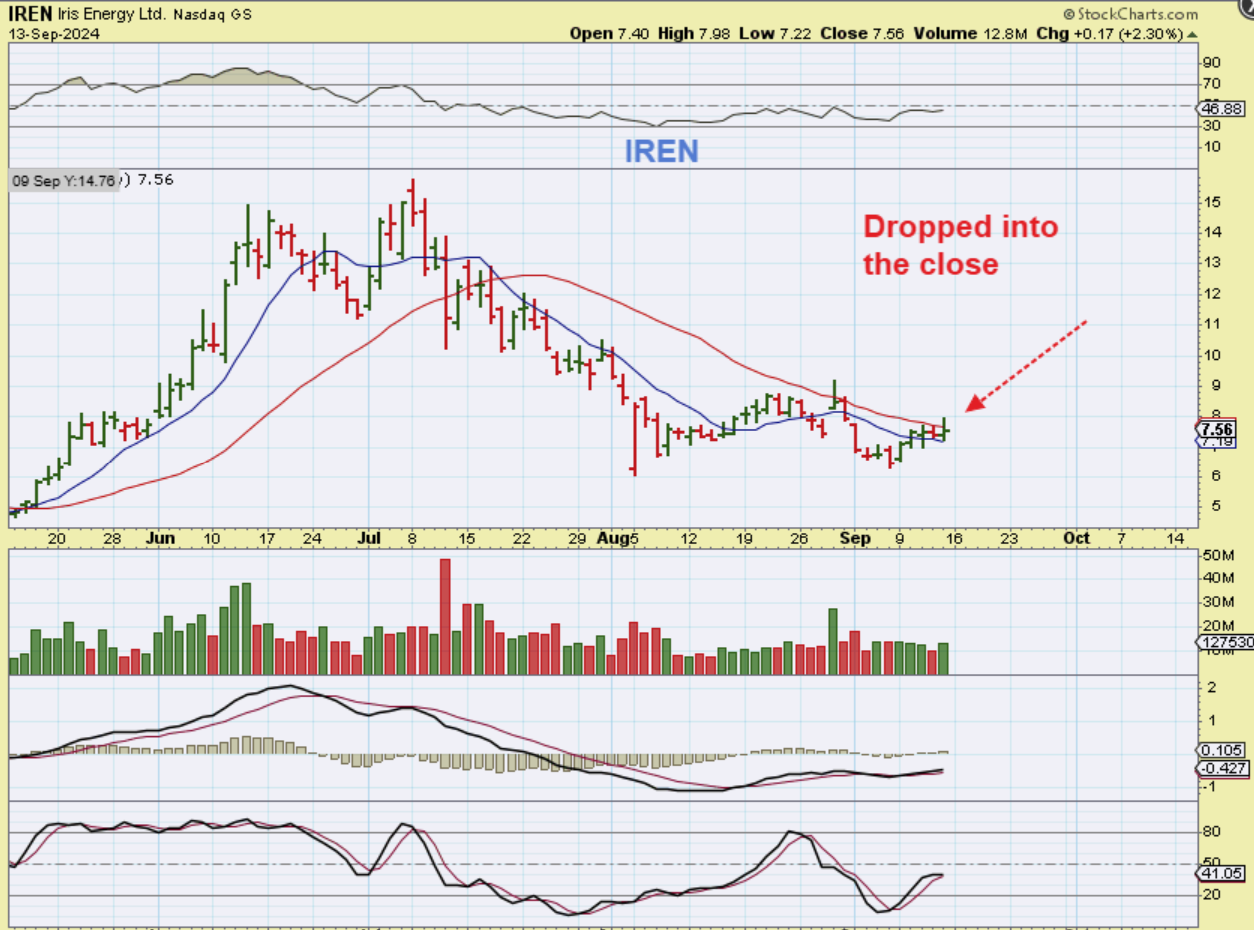
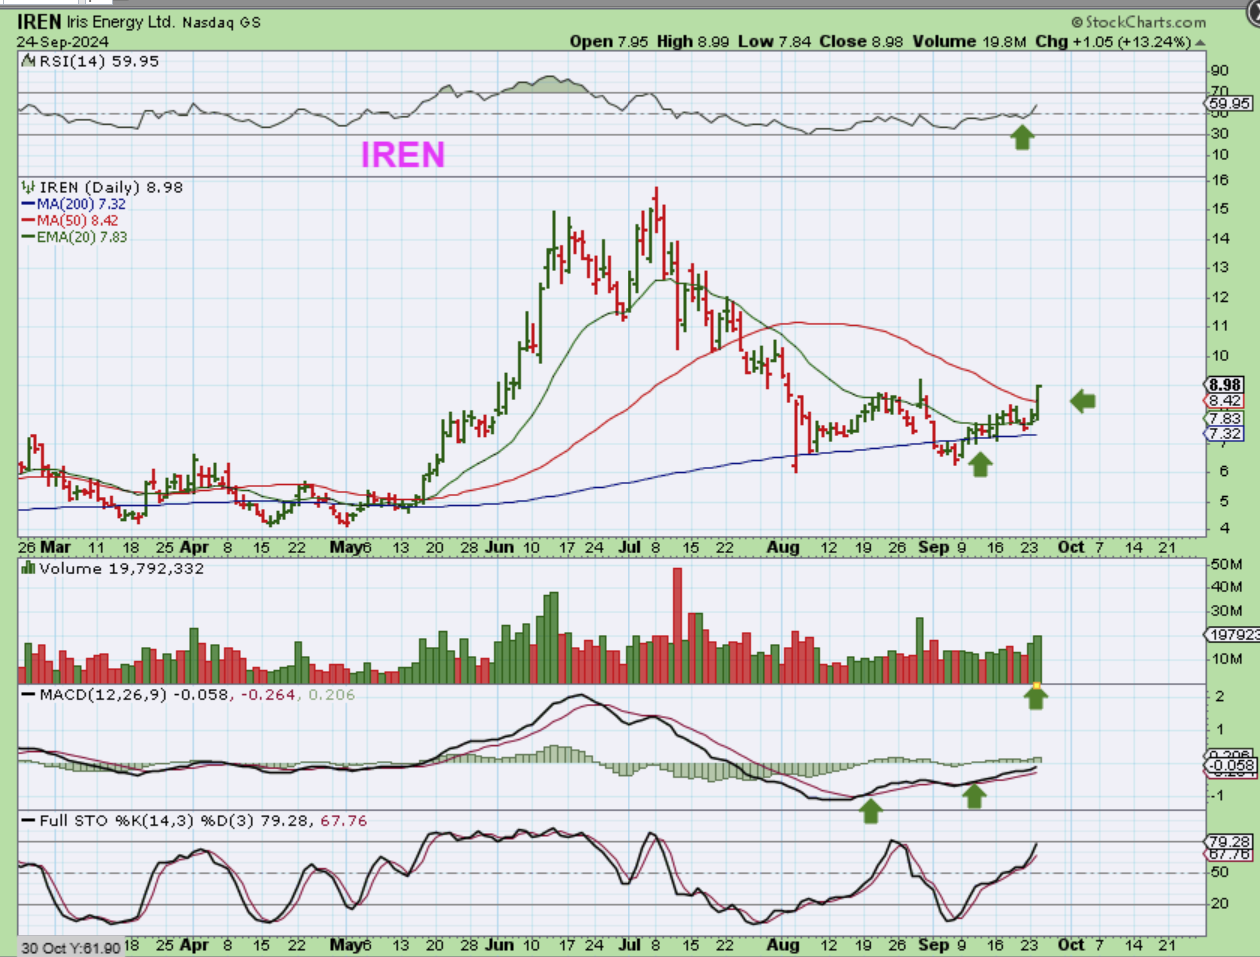
IREN was choppy, I owned it, and I sold it. This chart made it look like it just wasn’t ready to follow Bitcoin as it ran higher. Well…
.
IREN was just chopping along that 200sma and suddenly yesterday it shot up 13%. I sold it last week near $7.50 and here it is at $9. These move quickly, so while this can drop 7% from here it also could just surge 20% from here too. These are tricky, but it does seem that this sector is starting to perk up and therefore Bitcoin MIGHT be preparing to break out. If that is the case, I will own these again.
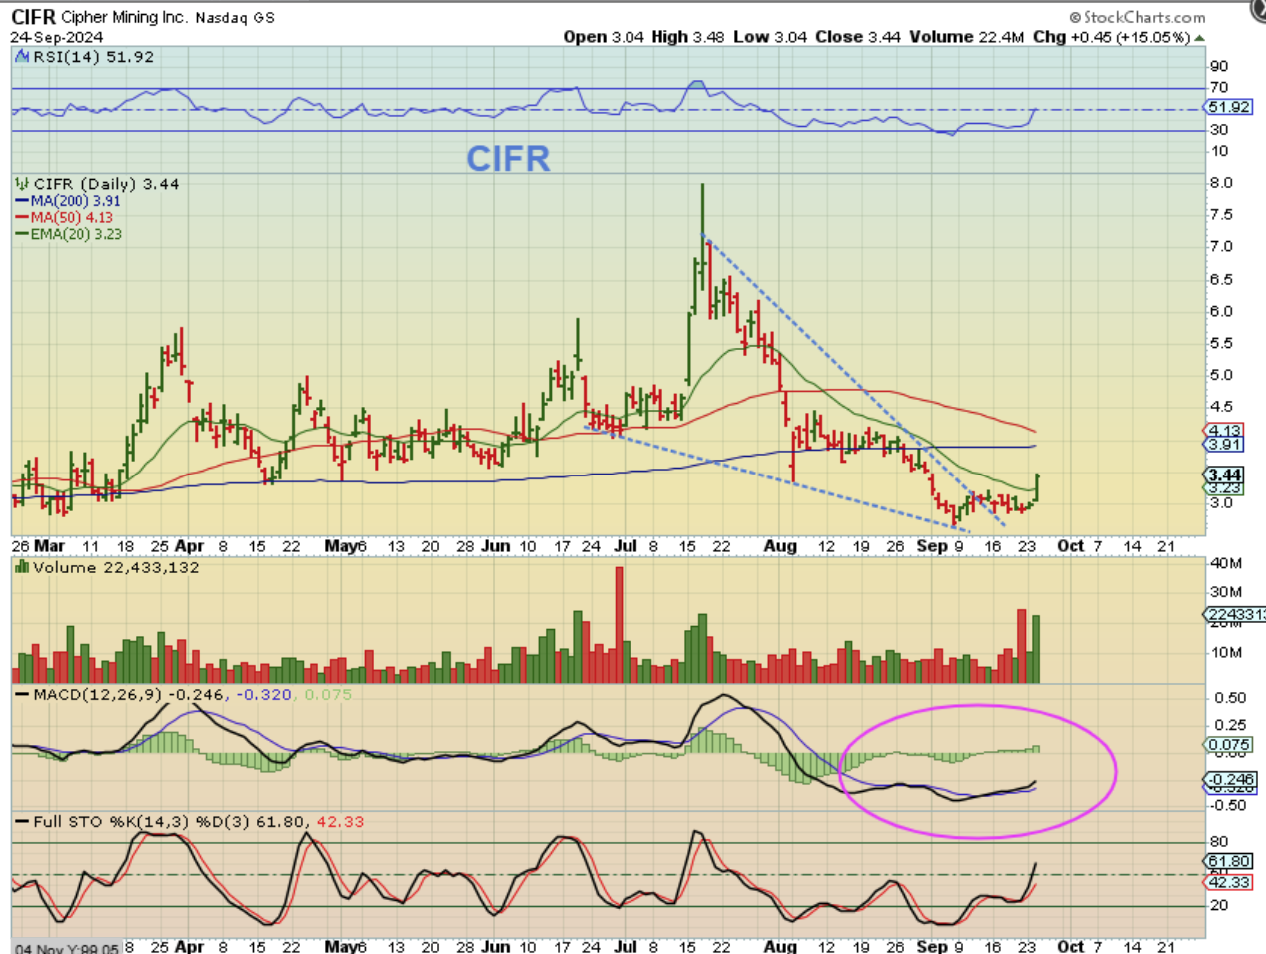
CIFR, CLSK, MARA, RIOT remain near the lows, but suddenly CIFR popped and in after hrs it was up over 23%.