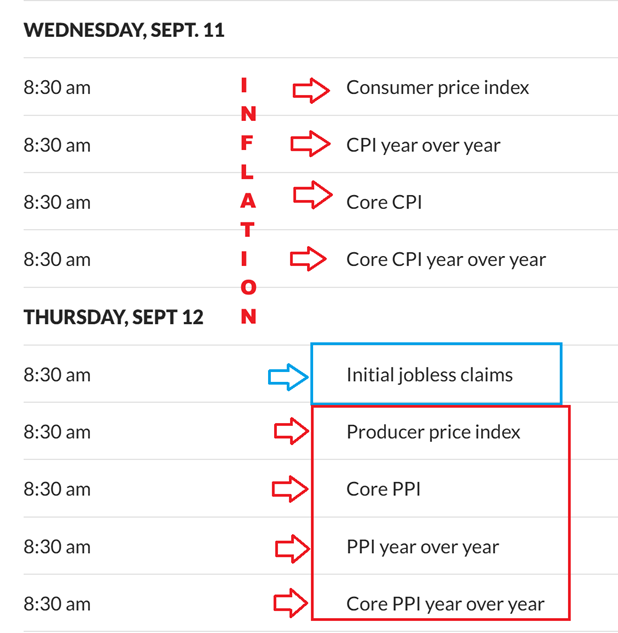
Wednesday September 11
DATA – Our Data today is inflation based, and should move the markets, but lately the markets have moved in a different manner than they used to during the stronger bull phase. The markets would rally more often than not with data suggesting a rate cut was coming, but more recently, it can go either way, so let’s look at the charts…
.
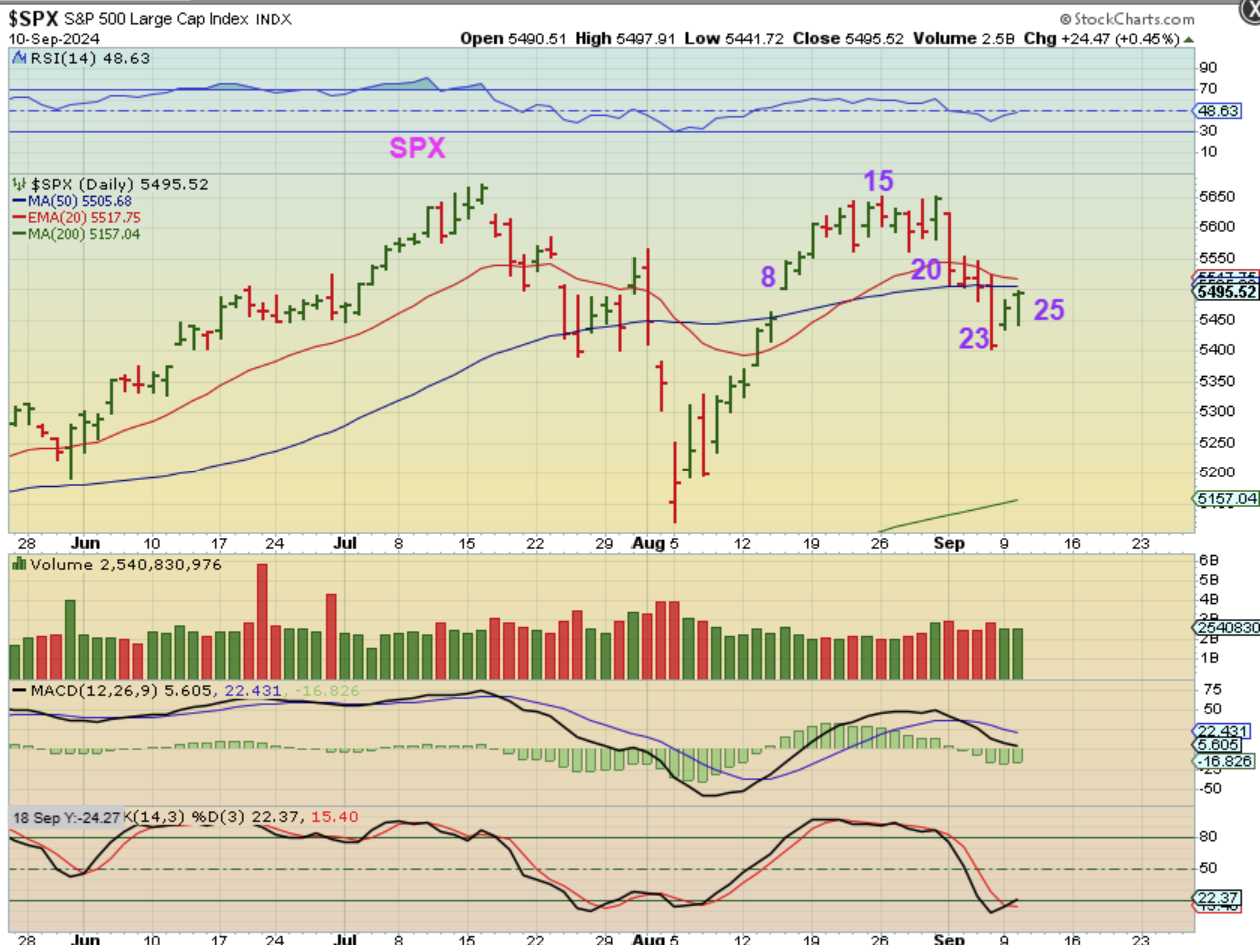
With The SPX I discussed that we would either see the pause stop at resistance (that 50sma) and the selling would resume, OR, we put in a half cycle low, bounce a little more to draw in more bulls, and then the sell off continues. Today looks to be the deciding factor with price right at the 50sma.
.
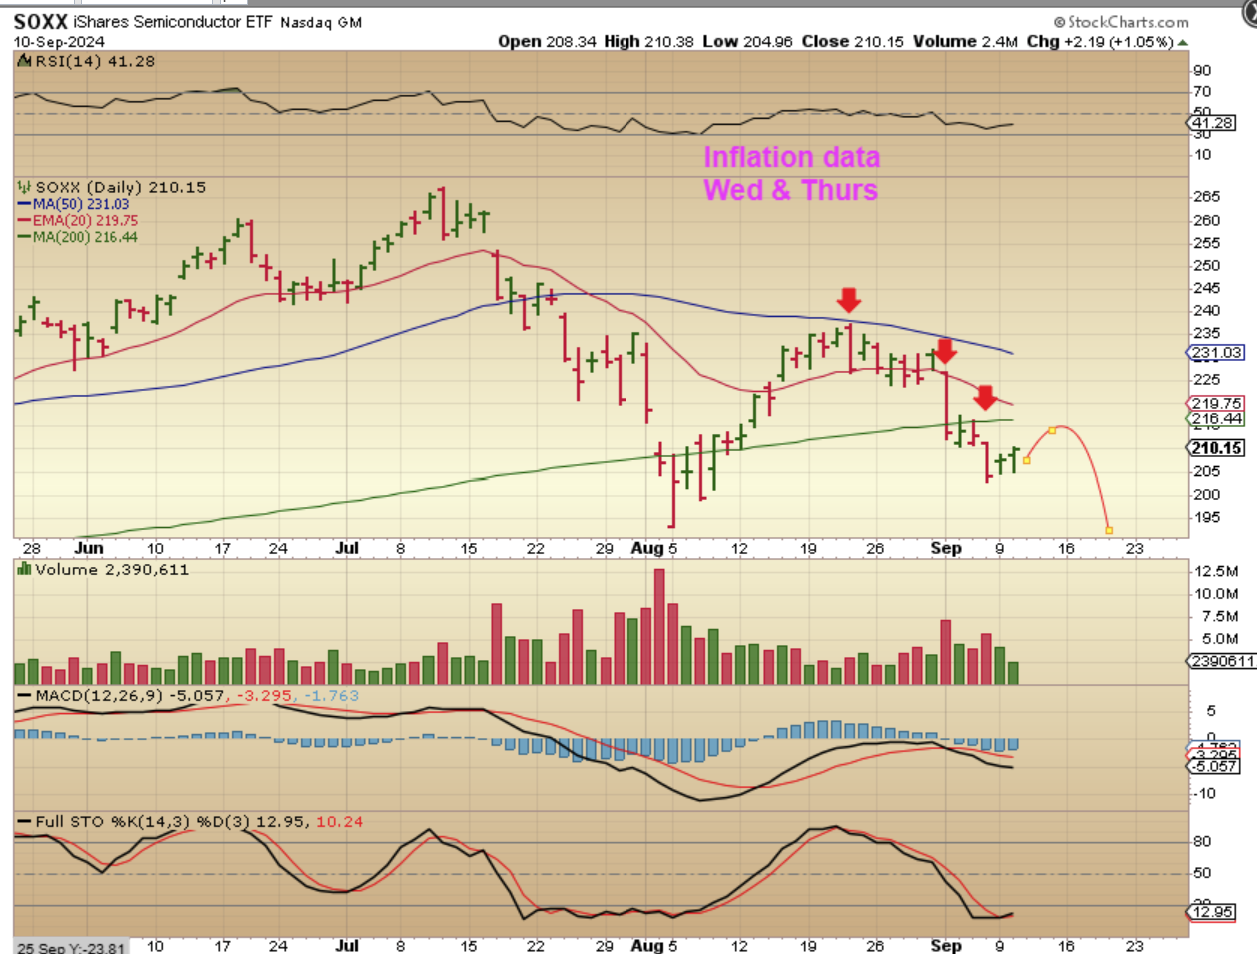
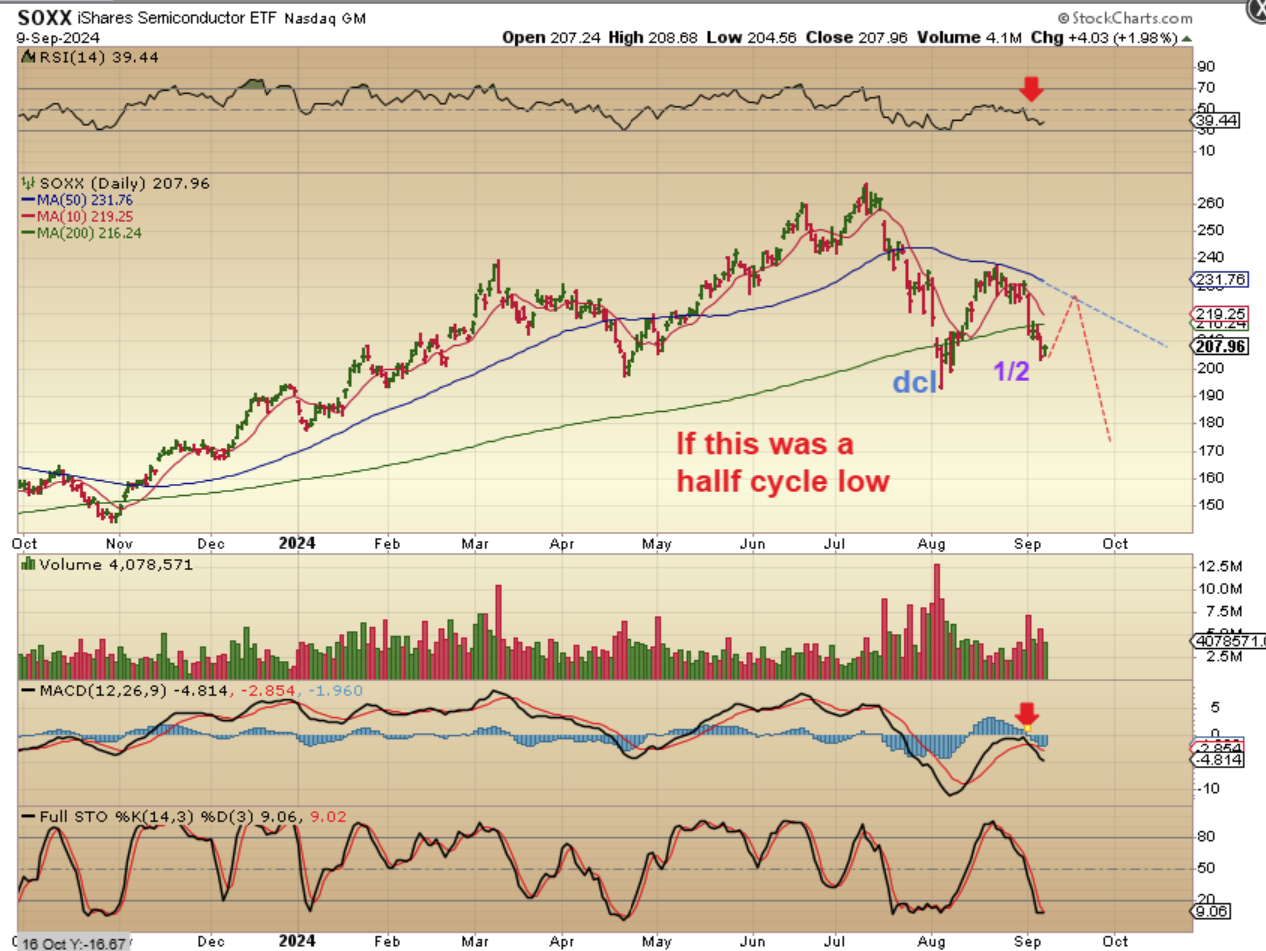
SOXX – My initial thinking is that the SOXX cannot get back above the 200sma, because it has been weak. That said, I now see very strong divergence in the MACD and it is oversold, so I have to wonder if we get a bigger bounce with the Inflation data and this will become a half cycle low. I want to see a reversal before I go short, and I mentioned that yesterday…
.
YESTERDAY I SAID: There is one exception to the General Markets continuing to drop this week, and that would be if we now put in place a half cycle low and bounce.
.
A half cycle low could ‘pause’ the selling & cause a bounce for a few days. If that happens, we would still be going lower in the long run, but in the short term we could get a weak bounce out of this weeks data that could last a little longer than a 2 day pause. I am thinking of going short at the 200sma, but I will wait for a reversal there first, so I can use a tight stop.
.
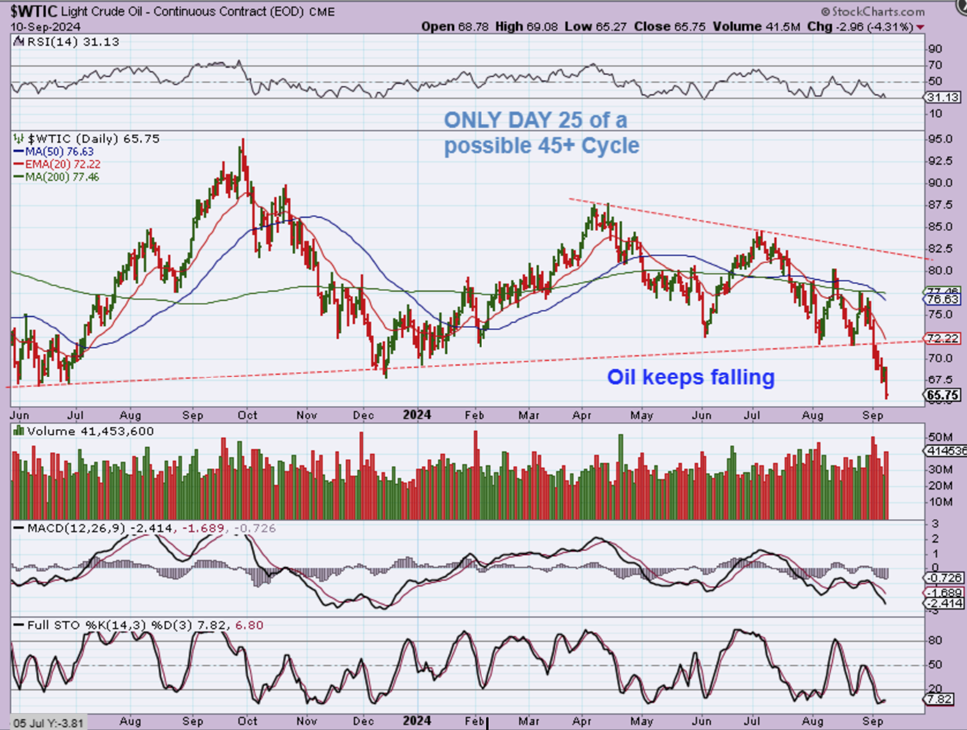
WTIC – Oil is only halfway through this daily cycle and I have mentioned recently that it broke down through the bottom of the triangle. I also mentioned 2 other interesting factors…
1. OPEC has stated that they were ramping up production, and I said that that move would drop price, and
2. OIL traded under $10 in the year 2020, so let’s not think that Oil cannot drop a lot lower. We are at $65.
.
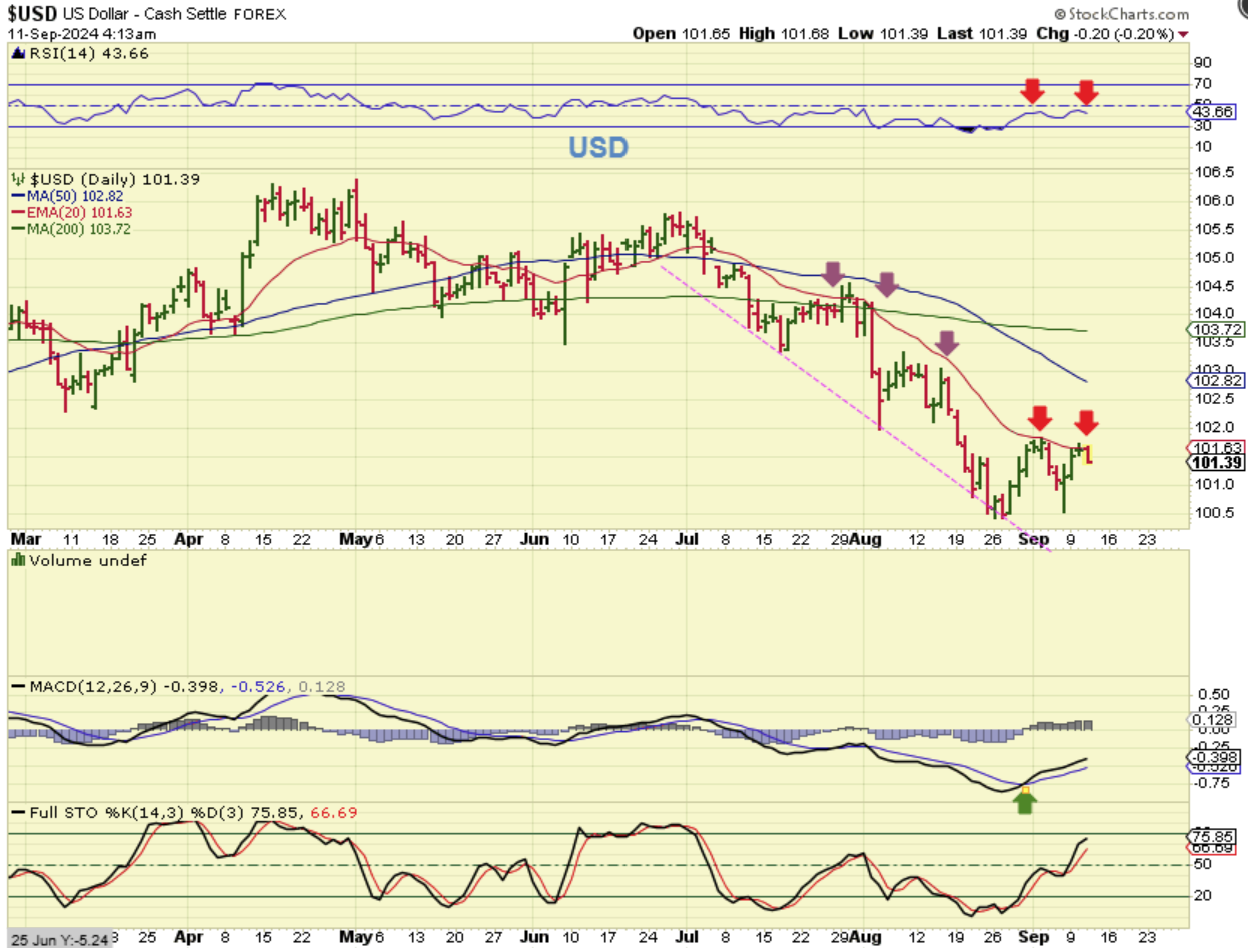
THE USD bottomed with a dcl, but it is finding a little resistance at the 20 ema.
.
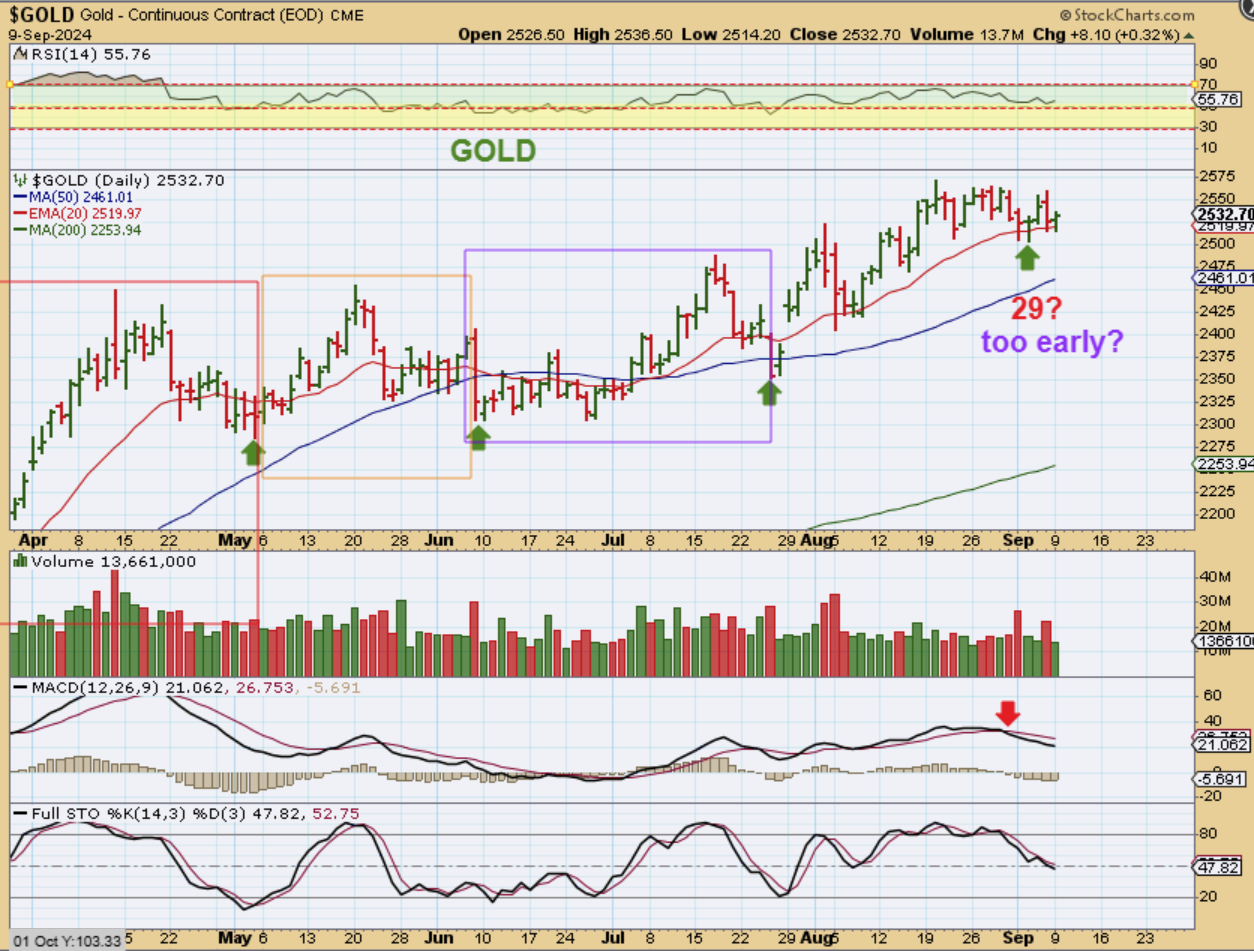
Yesterday I said: GOLD reversed at the 20 ema and held up over the day 29 low, so we are in the timing for a dcl, but is that too early or is that the dcl?
I was actually hoping for a Monday and Tuesday drop into a day 33 low, and then Wednesday data reverses the selling. That would have given us more confidence to go long with a clear day 33 low. Day 29 might be the dcl, but it is possible that we now need to drop one more time too.
.
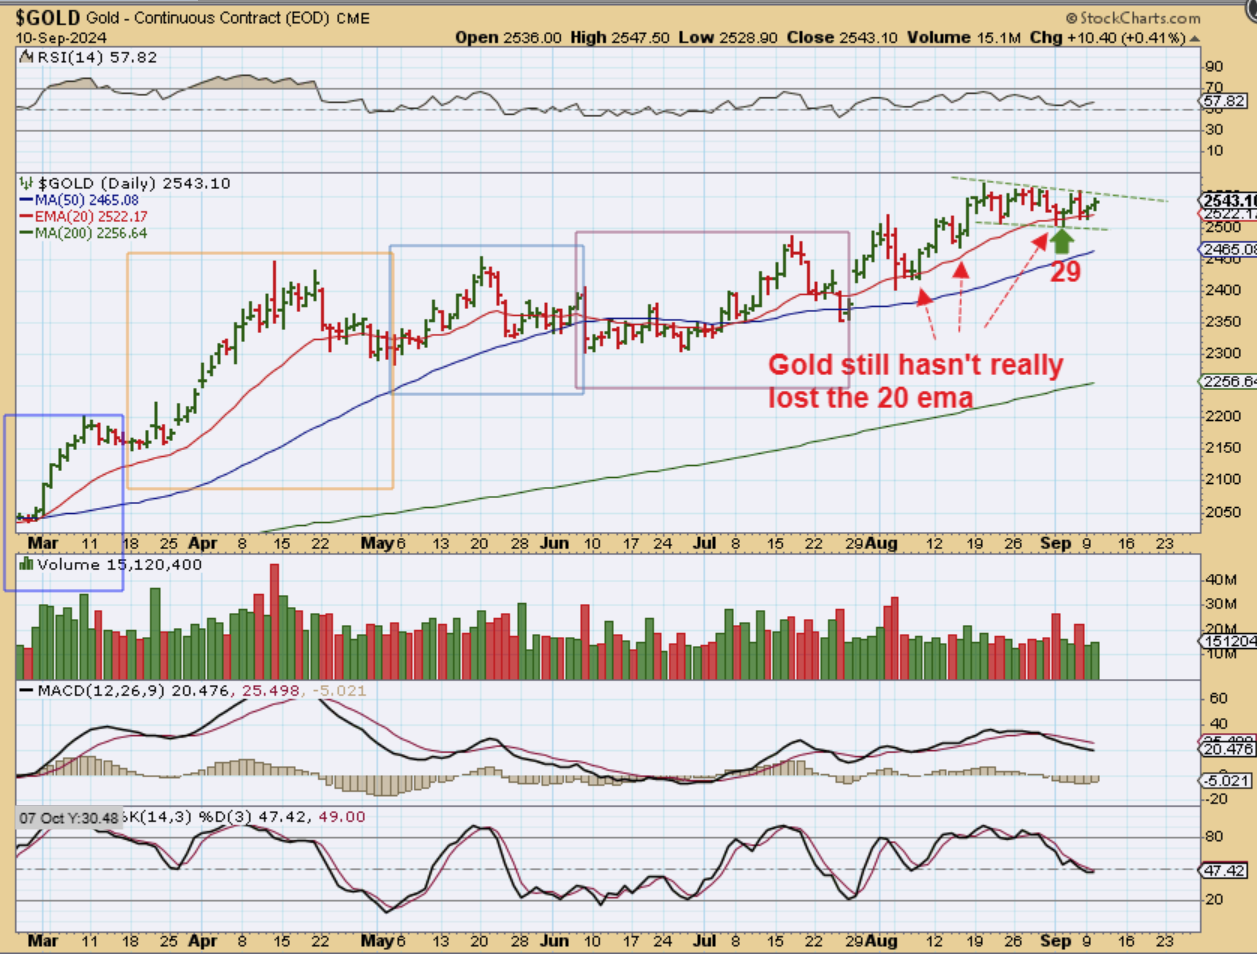
On Tuesday GOLD moved higher and it still has not lost the 20 ema.
.
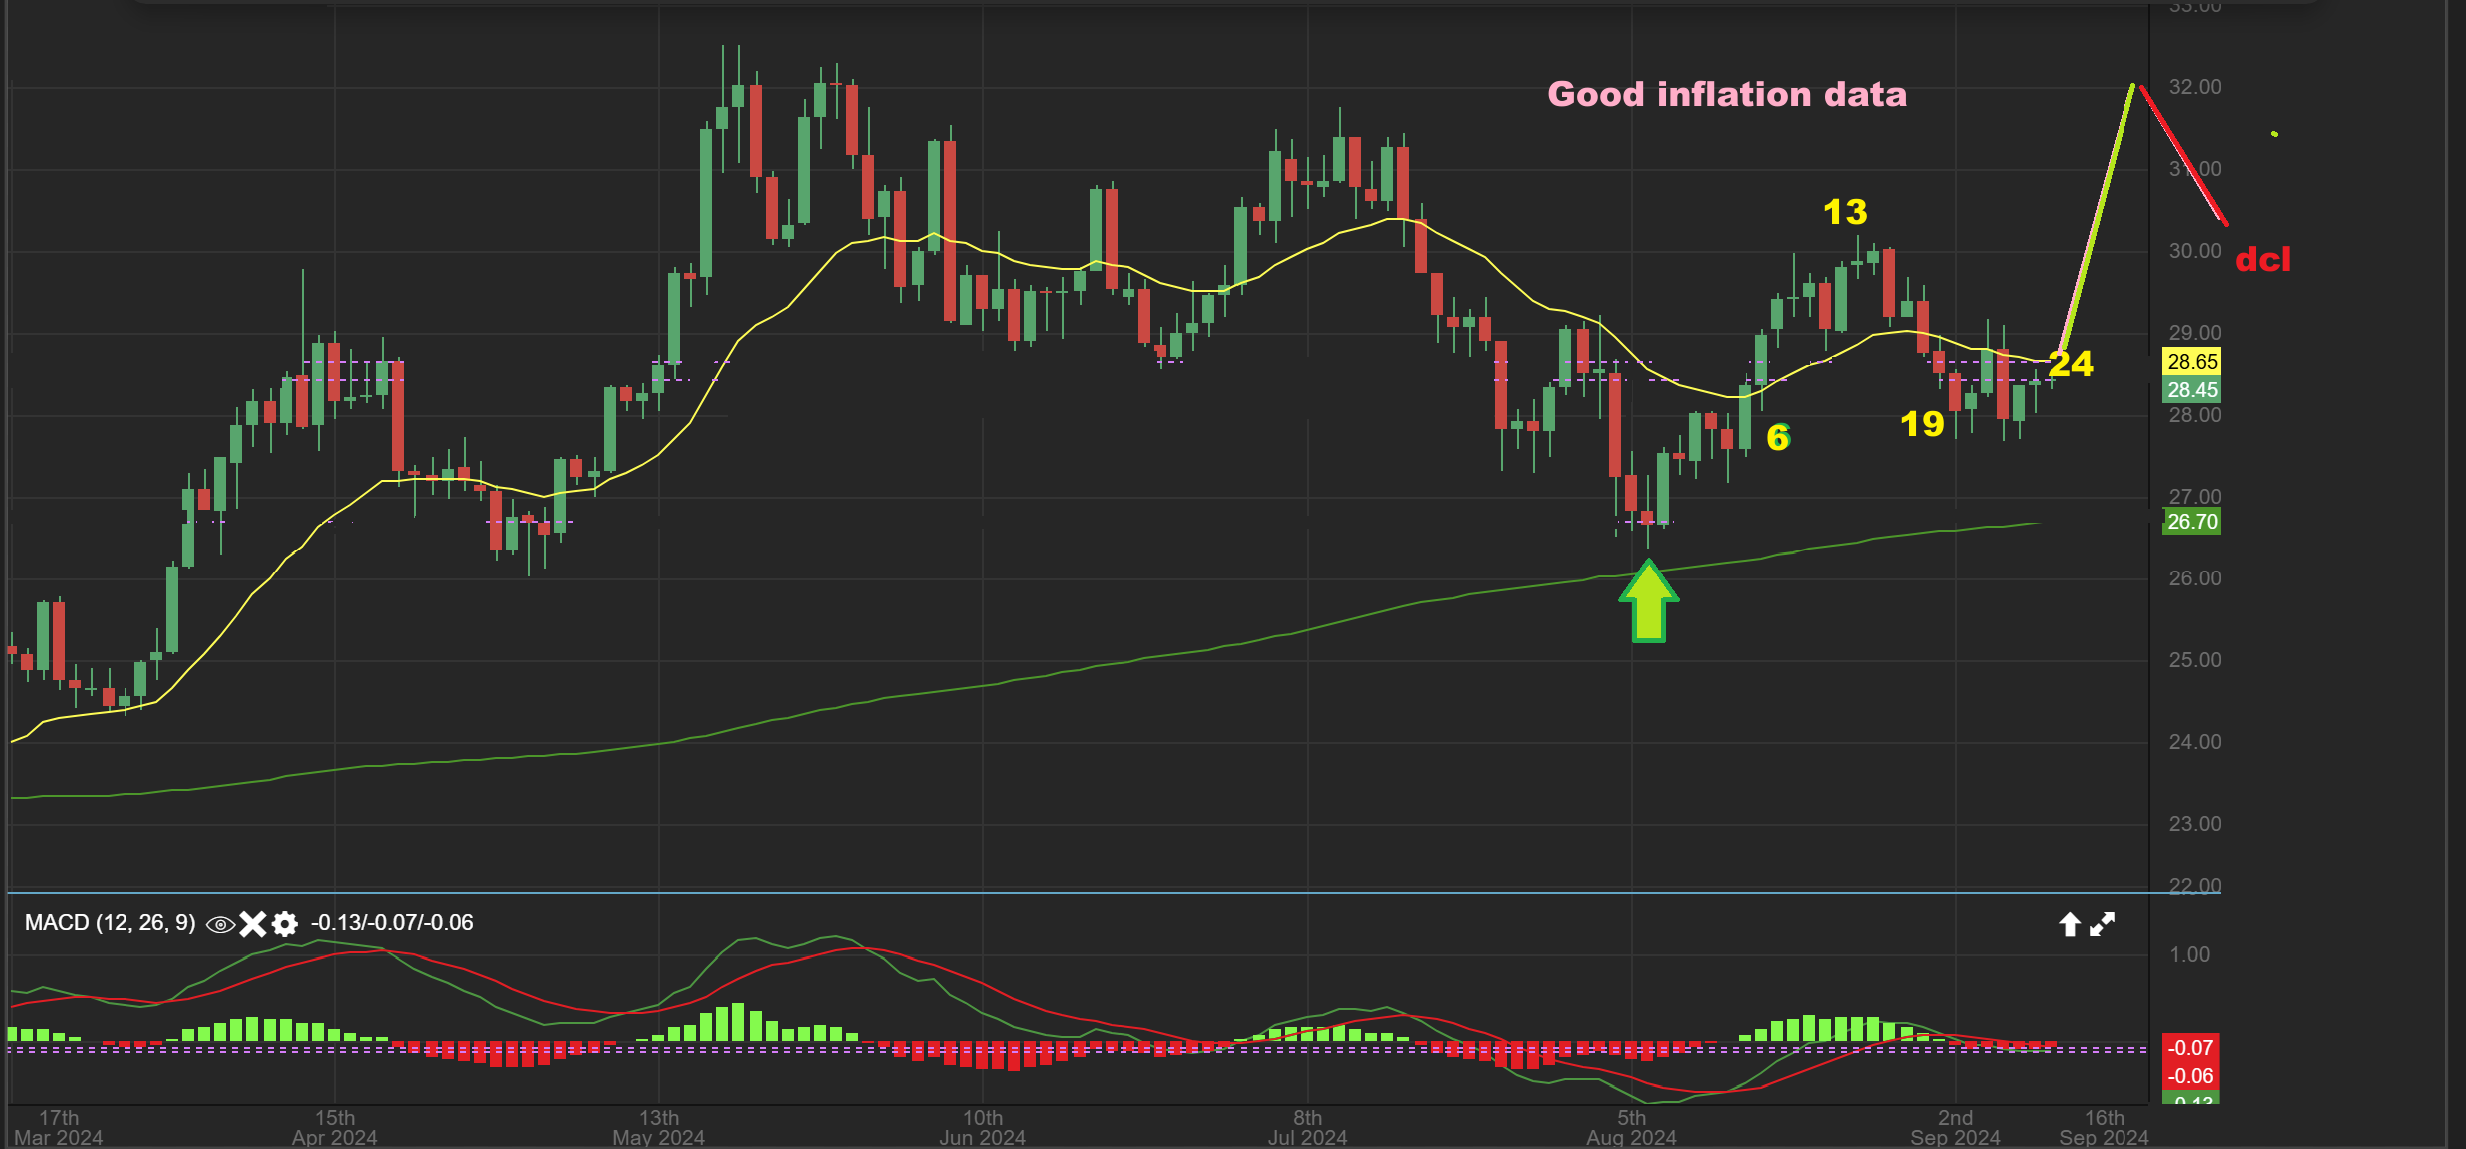
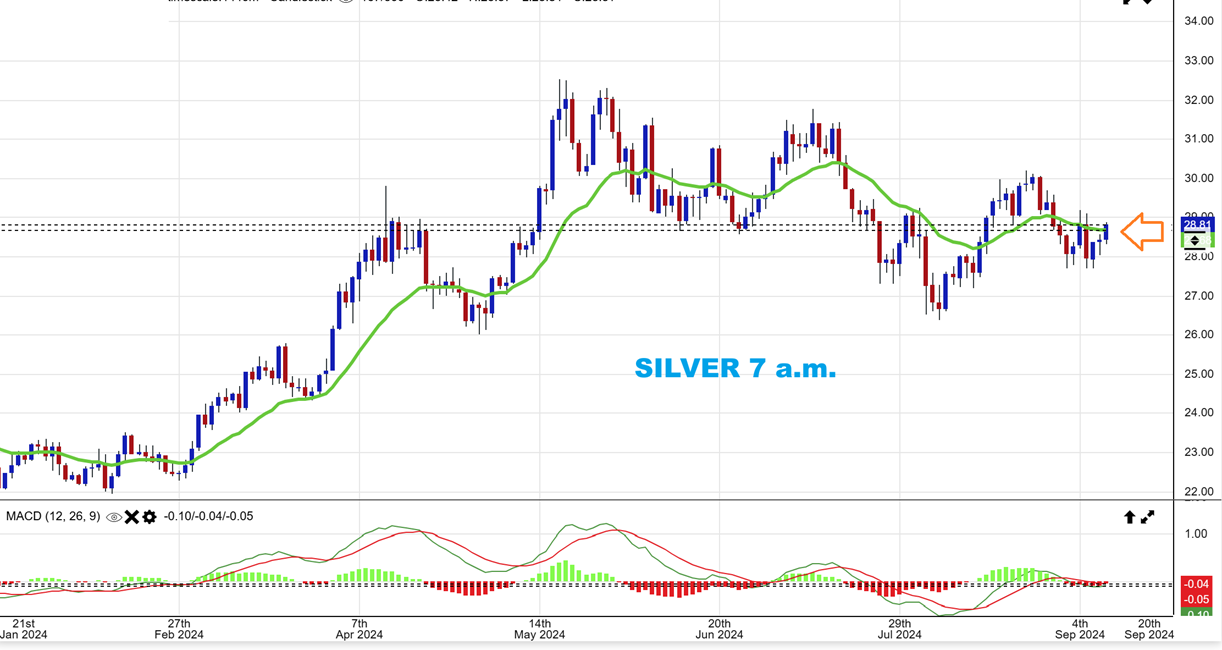
SILVER – If the inflation data is viewed as bullish, Silver could still run higher and then drop into a dcl. It is on day 24
.
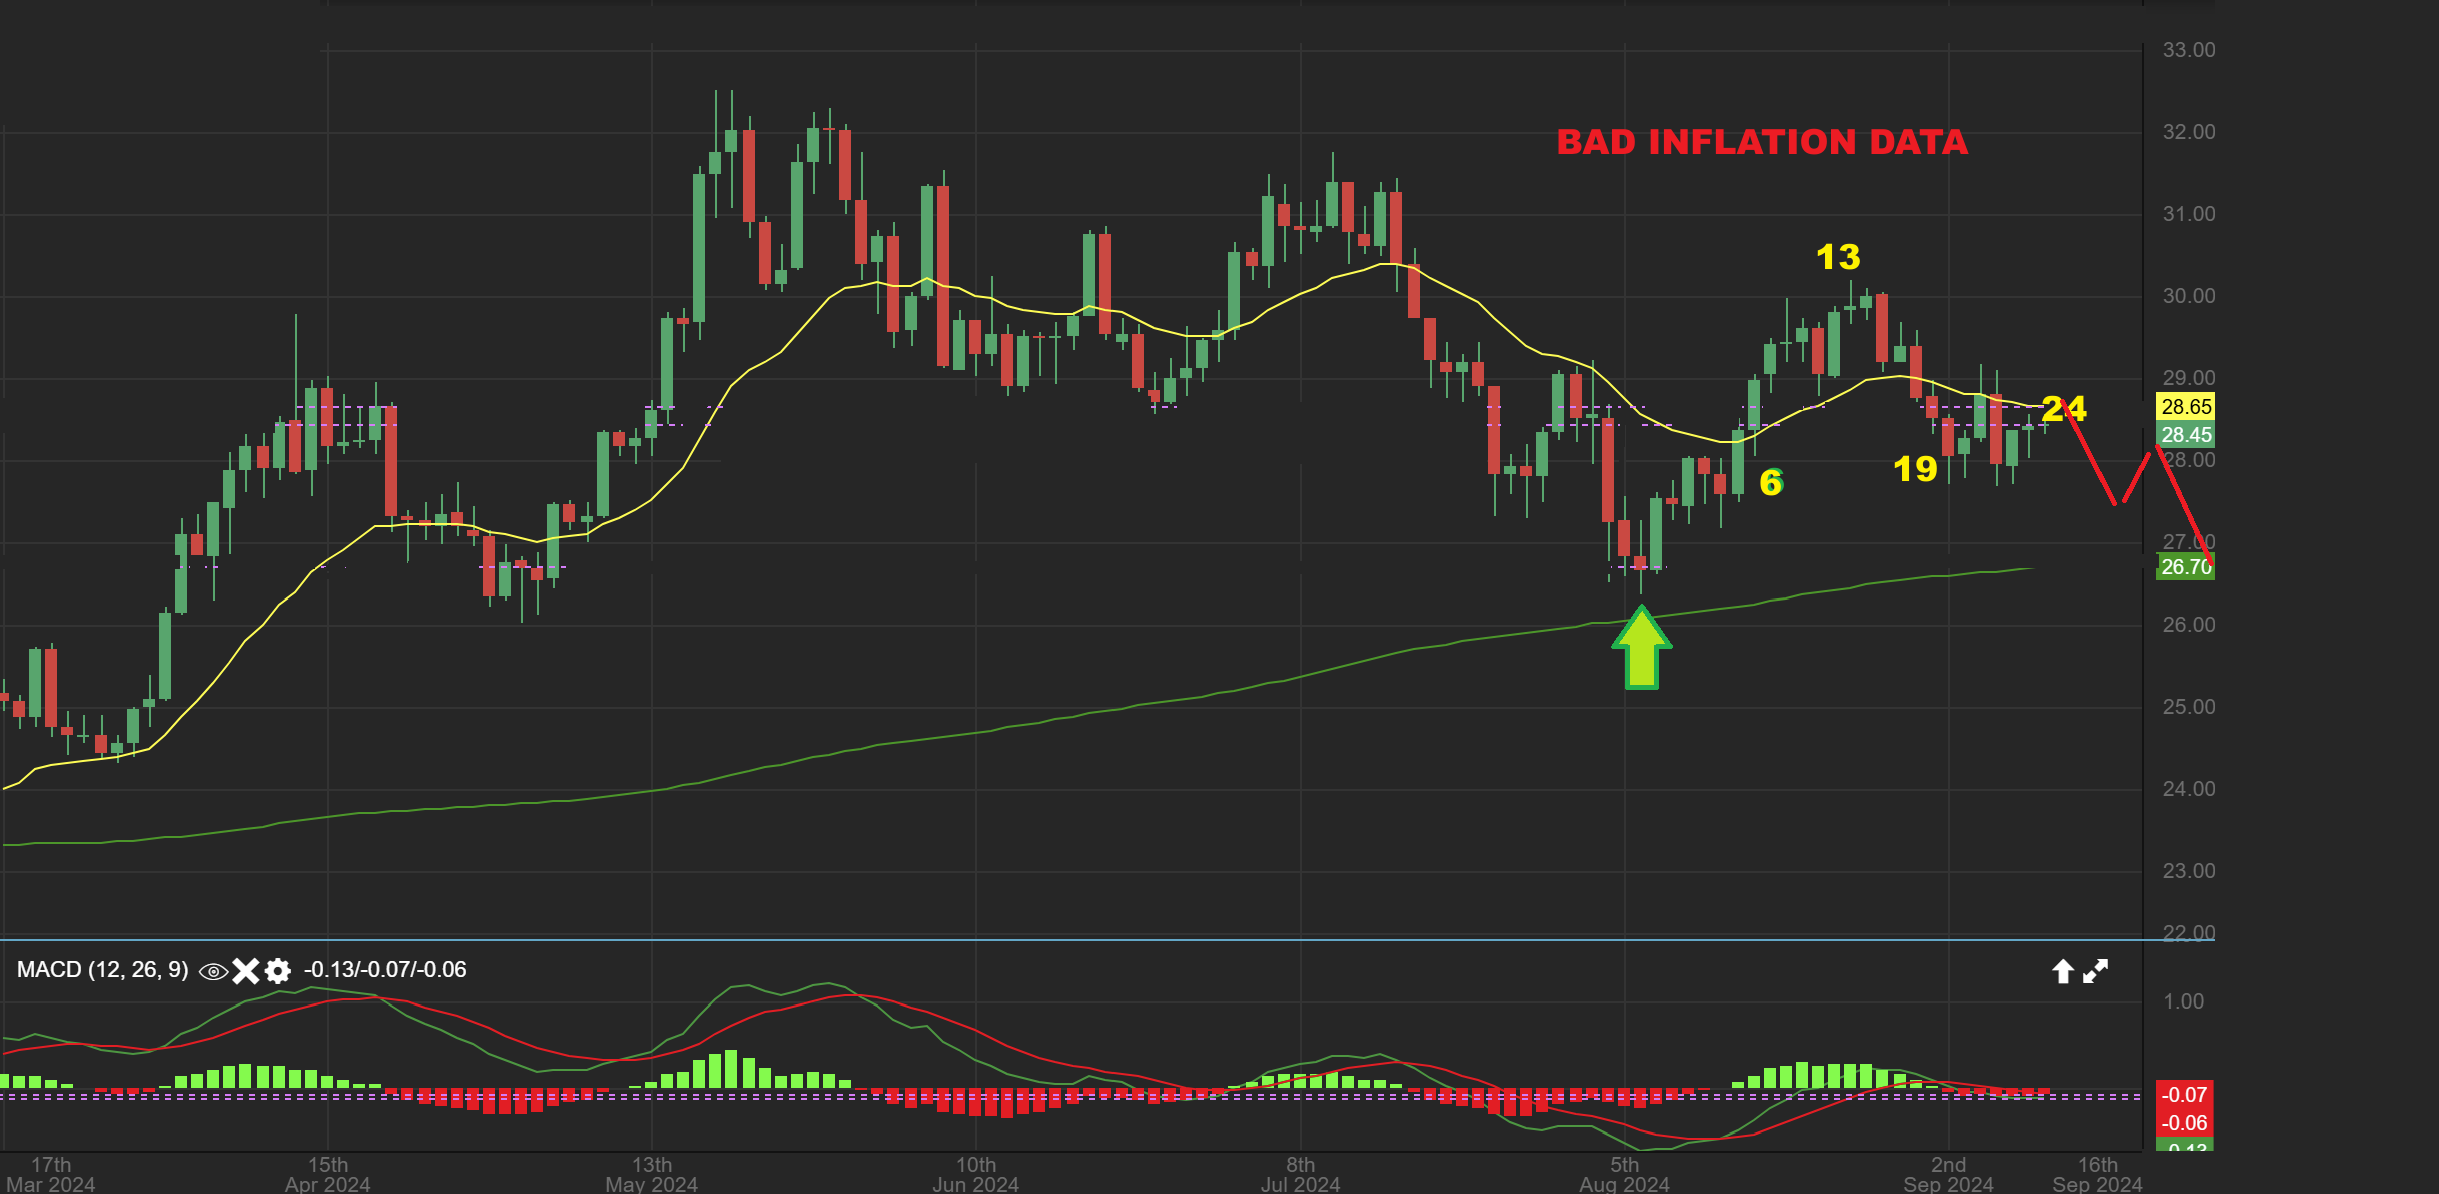
SILVER – Inflation data viewed as bearish would start to drop into a dcl immediately.
.
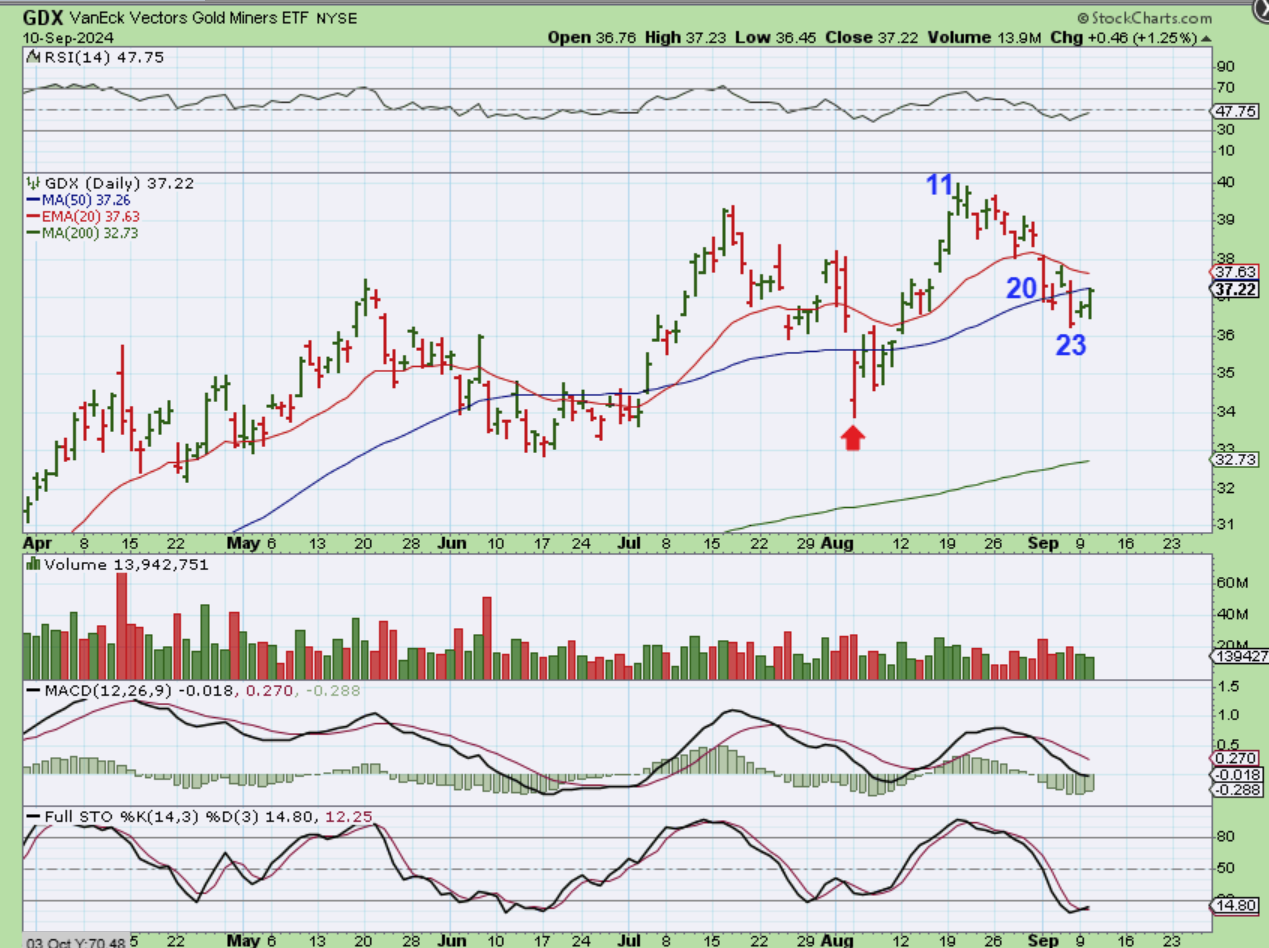
THE GDX seemed to follow the General Markets again and is now pushing on the 50sma.
.
Gold and Silver are moving slightly higher in pre-market, and Silver just crossed the 20 ema , as seen below, but let’ see what todays inflation data does at 8;30 a.m. Enjoy your Wednesday trading!
~ALEX
.
IN TUESDAYS REPORT:
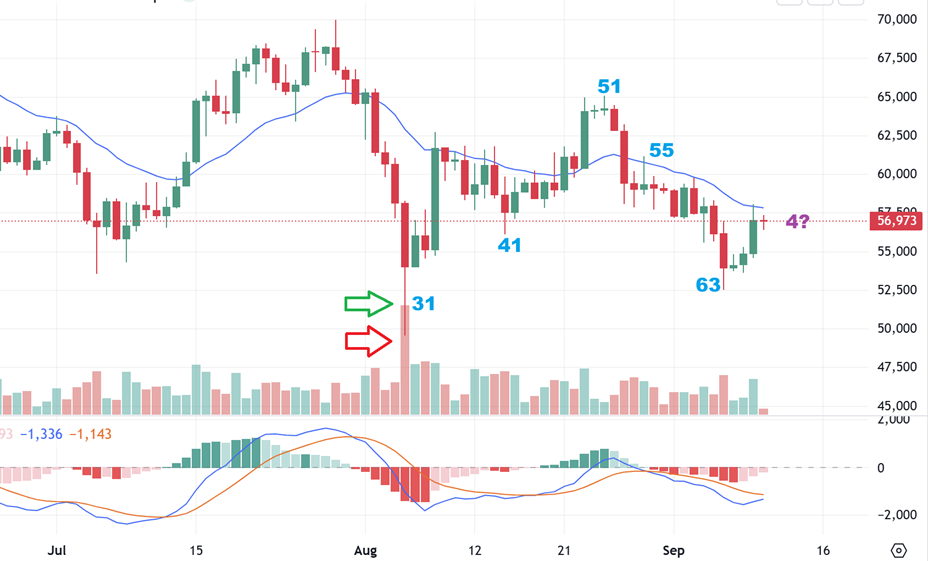
BITCOIN started to slowly move higher after that day 63 reversal candle, but it has yet to take over the 20 ema. This could be day 4 and a break above that 20 ema should be a bullish sign. Crypto stocks actually looked pretty good Monday, but they are coming up out of THE lows, so even the ones that put in over 10% gains didn’t look all that great.
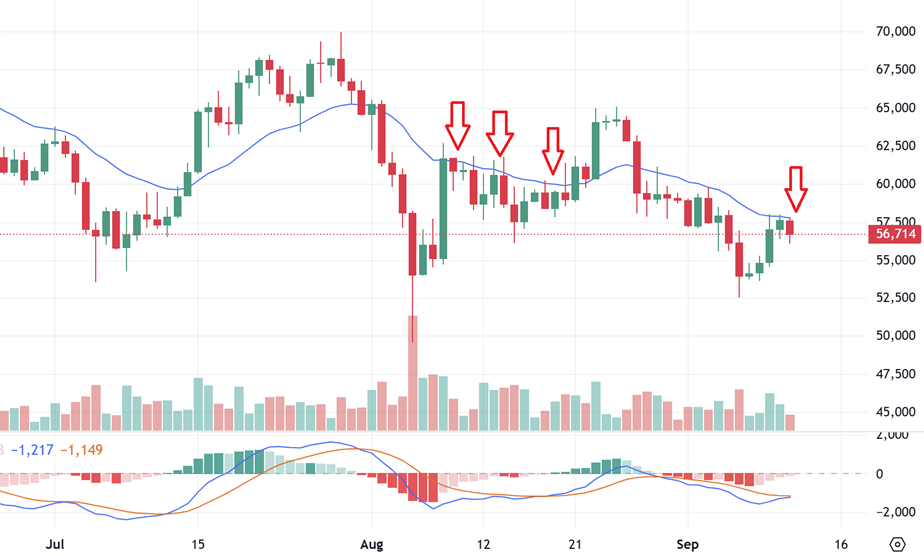
BITCOIN stopped right at that 20 ema on day 5, and now we wait for a breakout. You can see how long it took to be able to close above that 20 ema after the last low was in place. I’m hoping for a quicker break this time, and maybe the Markets moving with the inflation data and anticipation of that rate cut can push it through today.
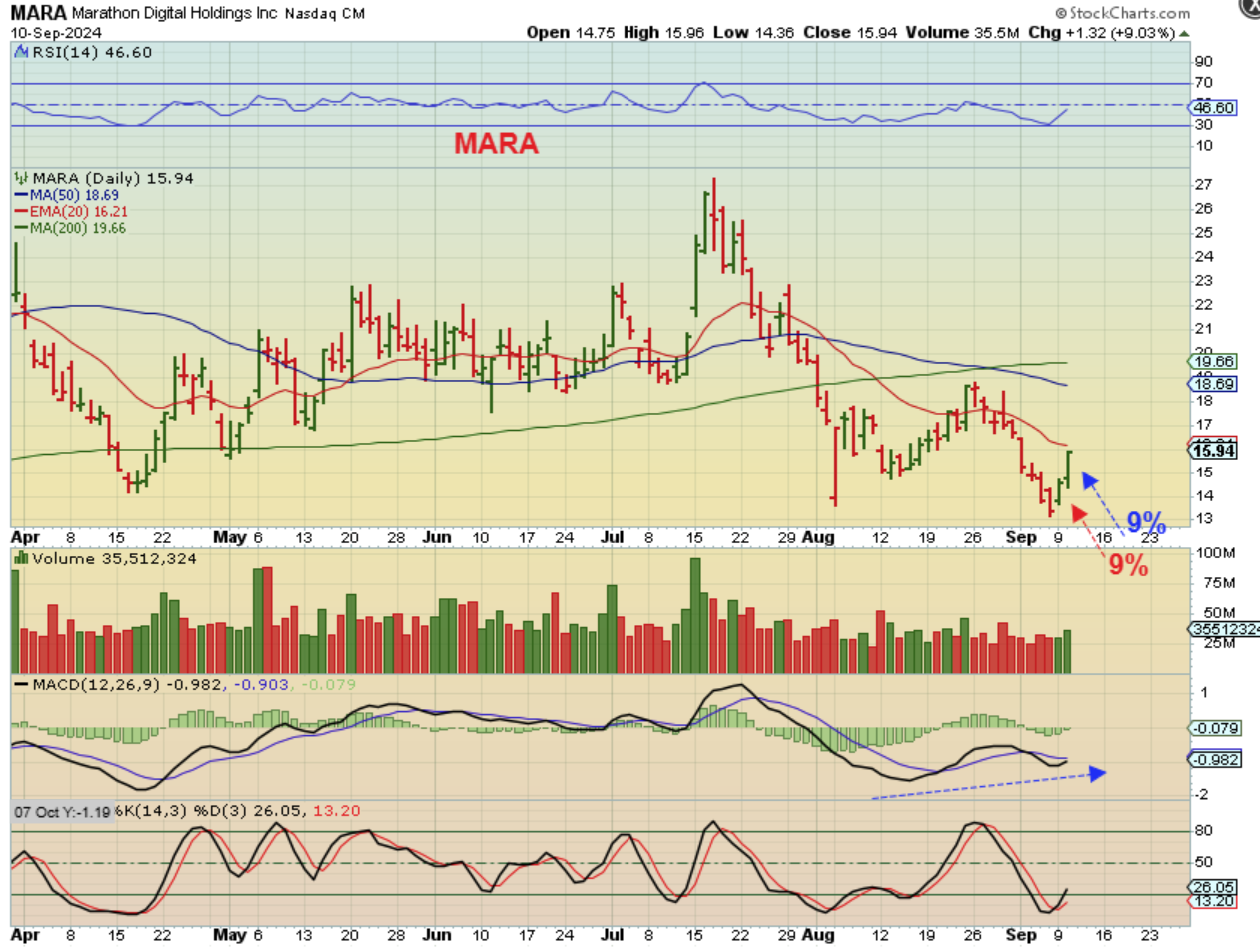
MARA I have pointed out that the crypto stocks are moving off of the lows, and they do make fast gains right away, but they can also pull back just as much. I have seen them RED each morning after the open, and then they start to rise on an intraday chart, so I trade them daily. What we really want to see is a steady trend start though. That way you can buy and hold and the down days ‘pain’ is erased quickly with a few up days, because these often double or triple when Bitcoin is ready to run. For now they have only been day trades for me, and I often sell most of my positions by the end of the day or in after hrs.
.
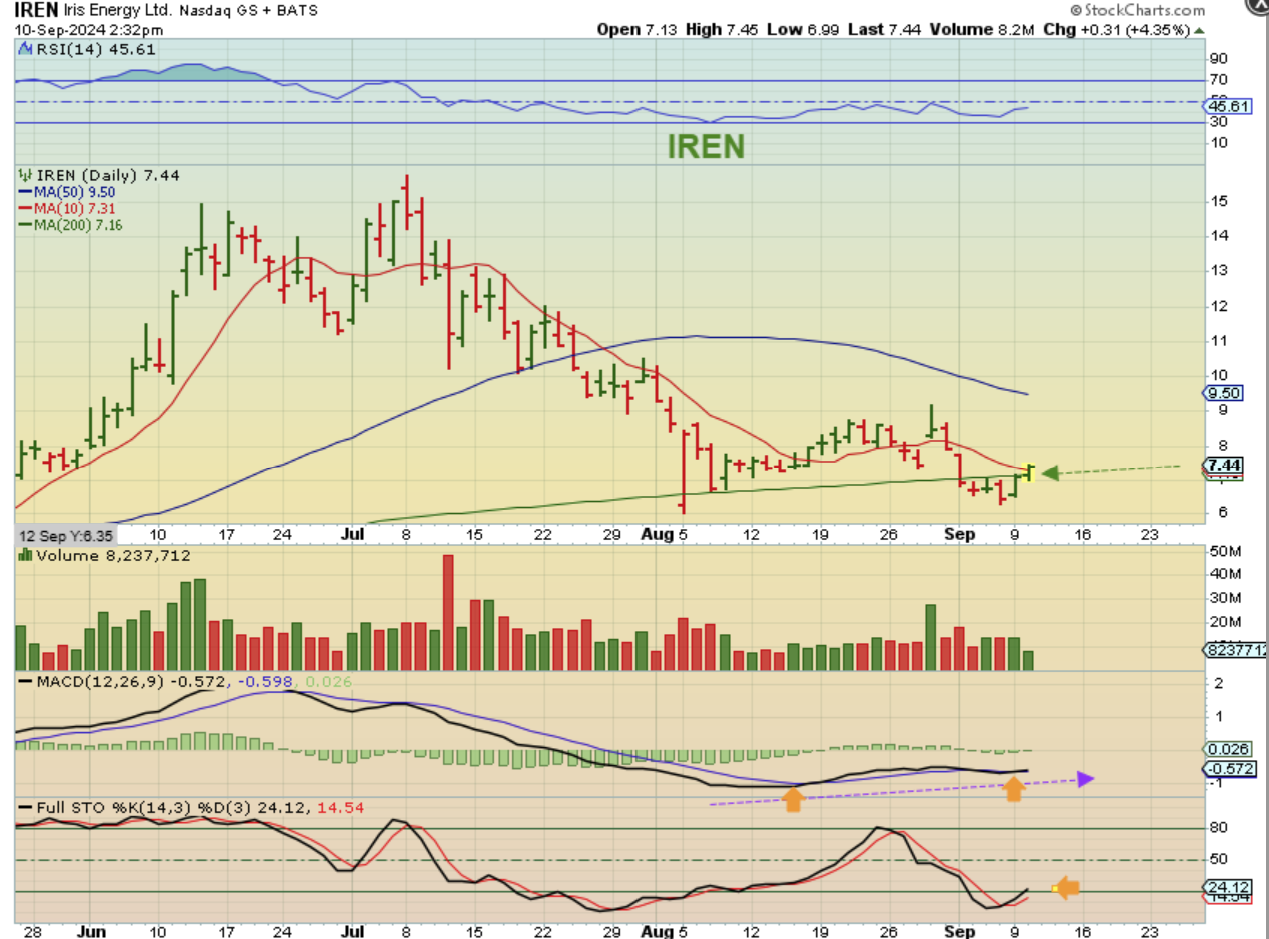
IREN Popped on Monday and on Tuesday it was pushing at the 200sma, so I posted this in the live area. A recovery could be viewed as a shakeout…
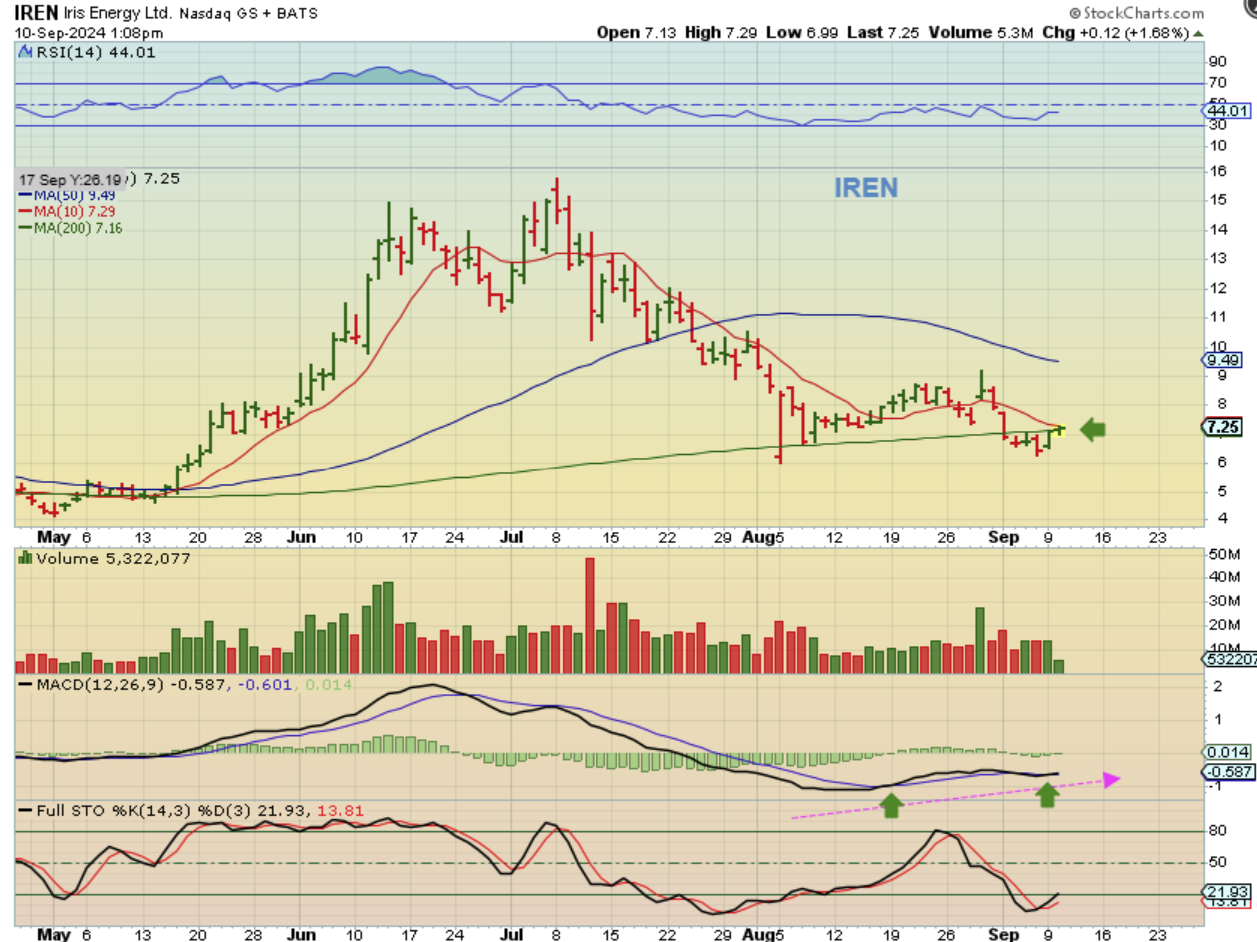
IREN recovered, and I grabbed this, but it closed at $7.53, so I hope that it holds and I only sold 3/4 of my position yesterday. I will add if it acts correctly, but I haven’t been comfortable holding overnight.