Tuesday September 10th – Markets Rising?
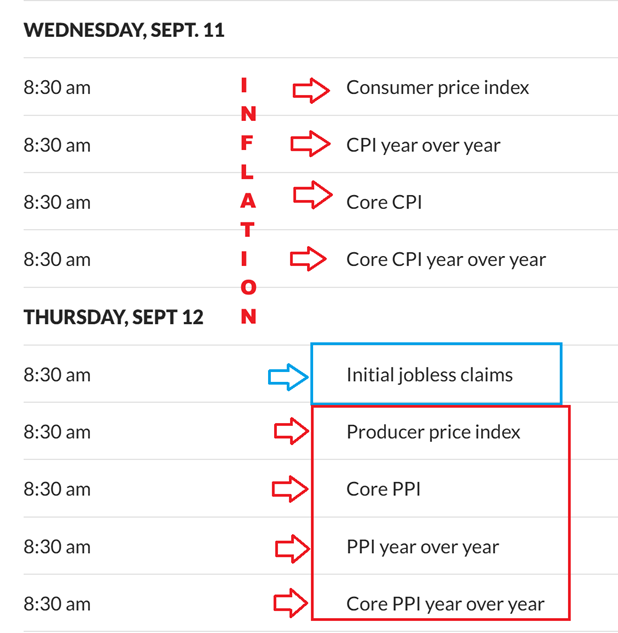
LOOKING AHEAD AT DATA: This Data for Wednesday and Thursday has been bullish for the general markets in the past, often indicating that inflation is dropping and a rate cut is coming, but more recently it has not been enough to entice buyers or hold the markets up. That said, I am thinking that the Markets may be ‘pausing’ their drop here, but then the drop should continue. That drop may resume after some data is released. Let’s look at the charts…
.
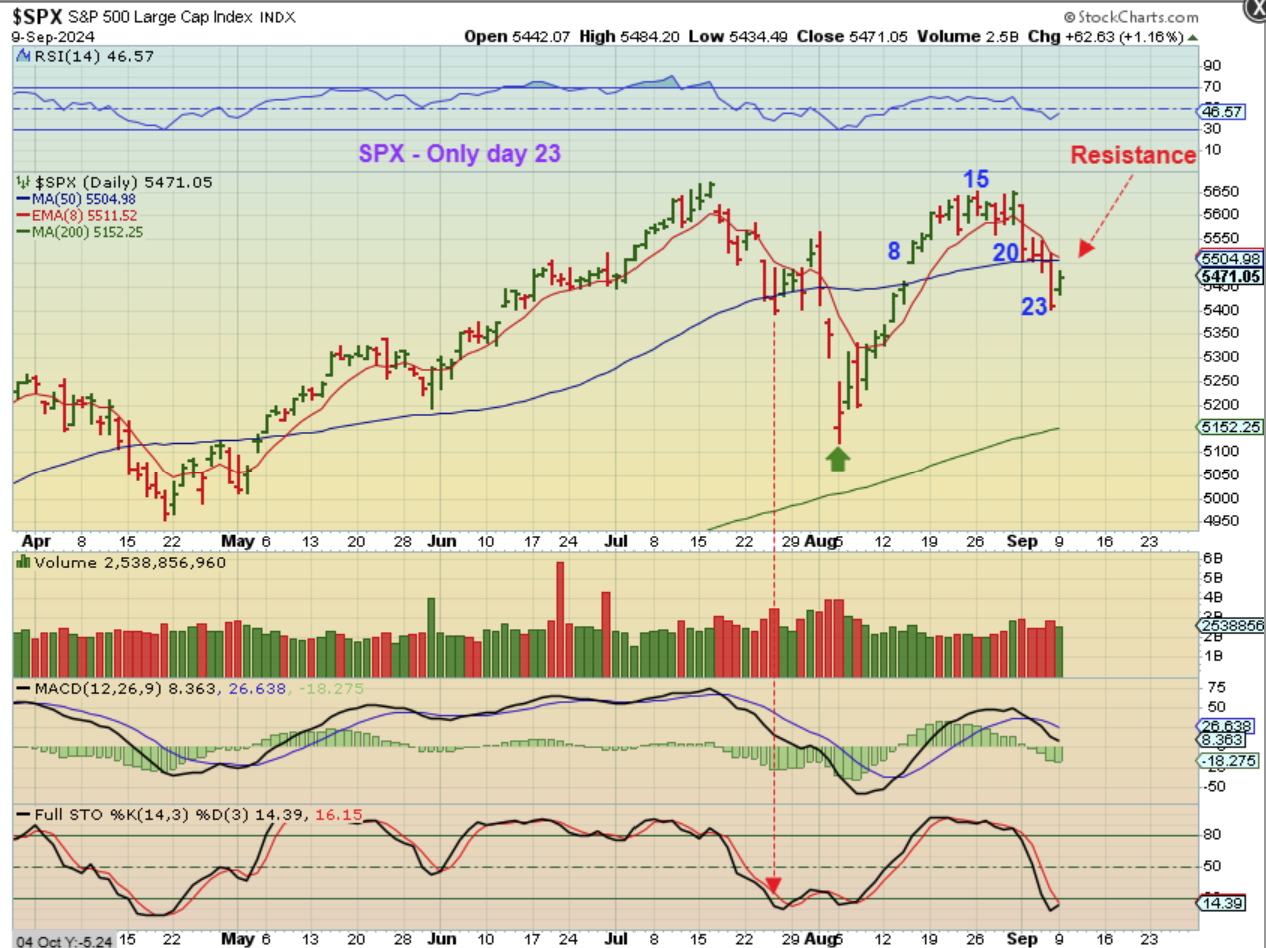
SPX is only on day 24 of a possible 35+! The sell off is pausing, but now look at the day 20 drop. We saw that day 20 drop and it looks like the day 23 drop, but we also saw a 2 day pause, so we may be pausing here and then we’ll see another drop. A move to the 10sma or to tag that 50sma is possible.
.
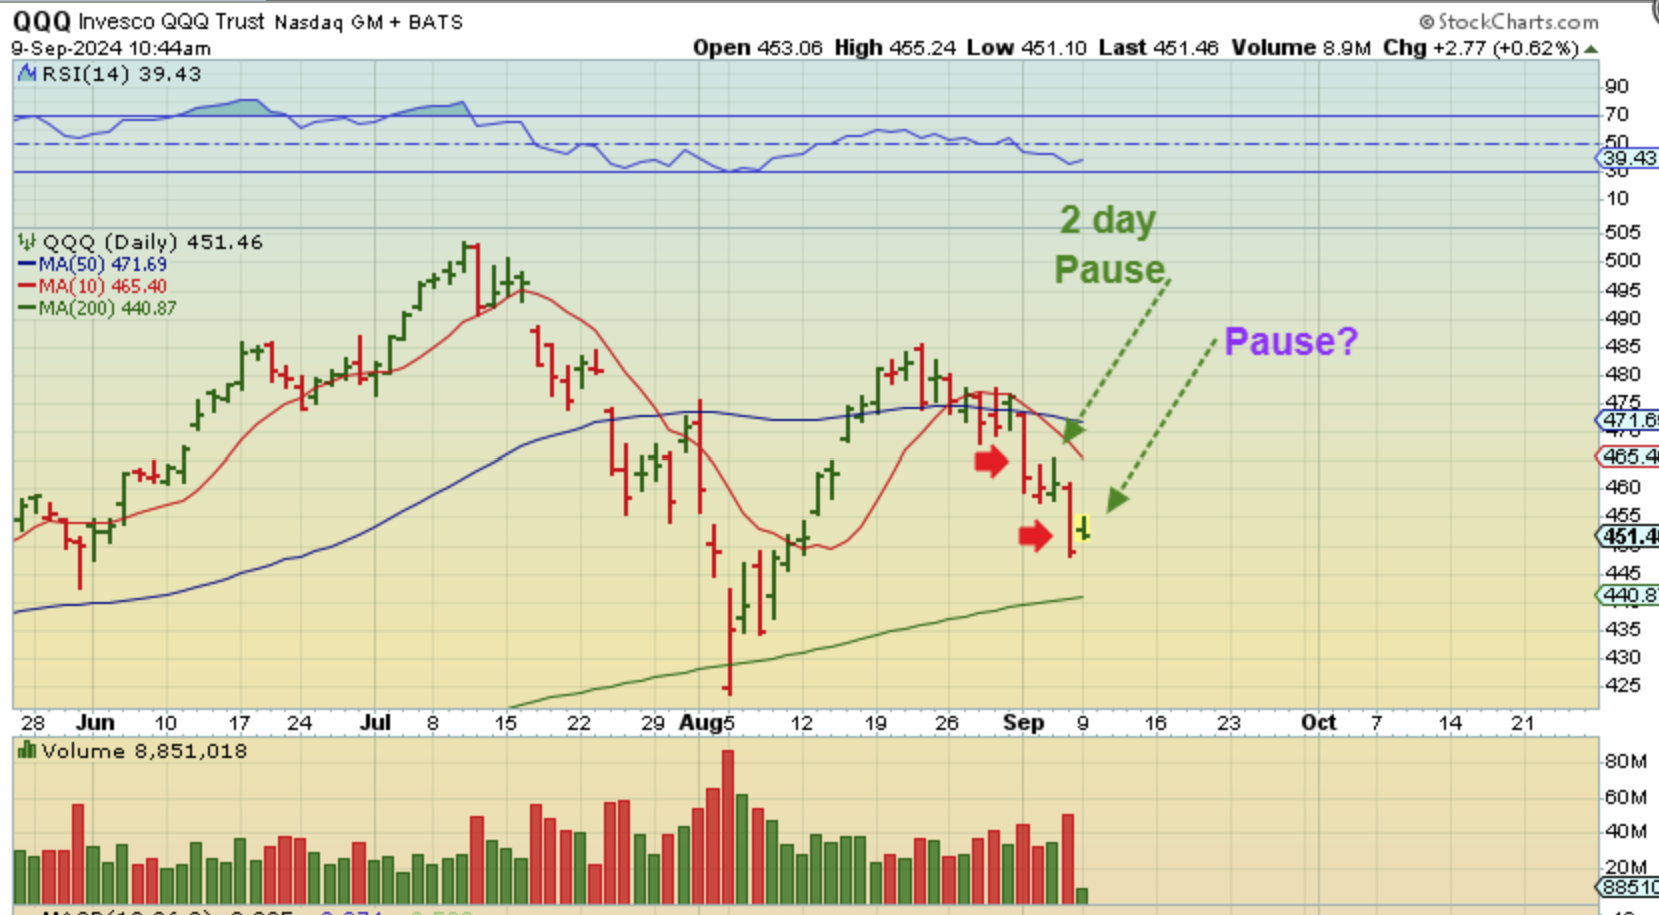
I pointed out that idea of a ‘pause’ in the commenting section using The QQQ on Monday morning. We could see a bounce to the red line, for example.
.
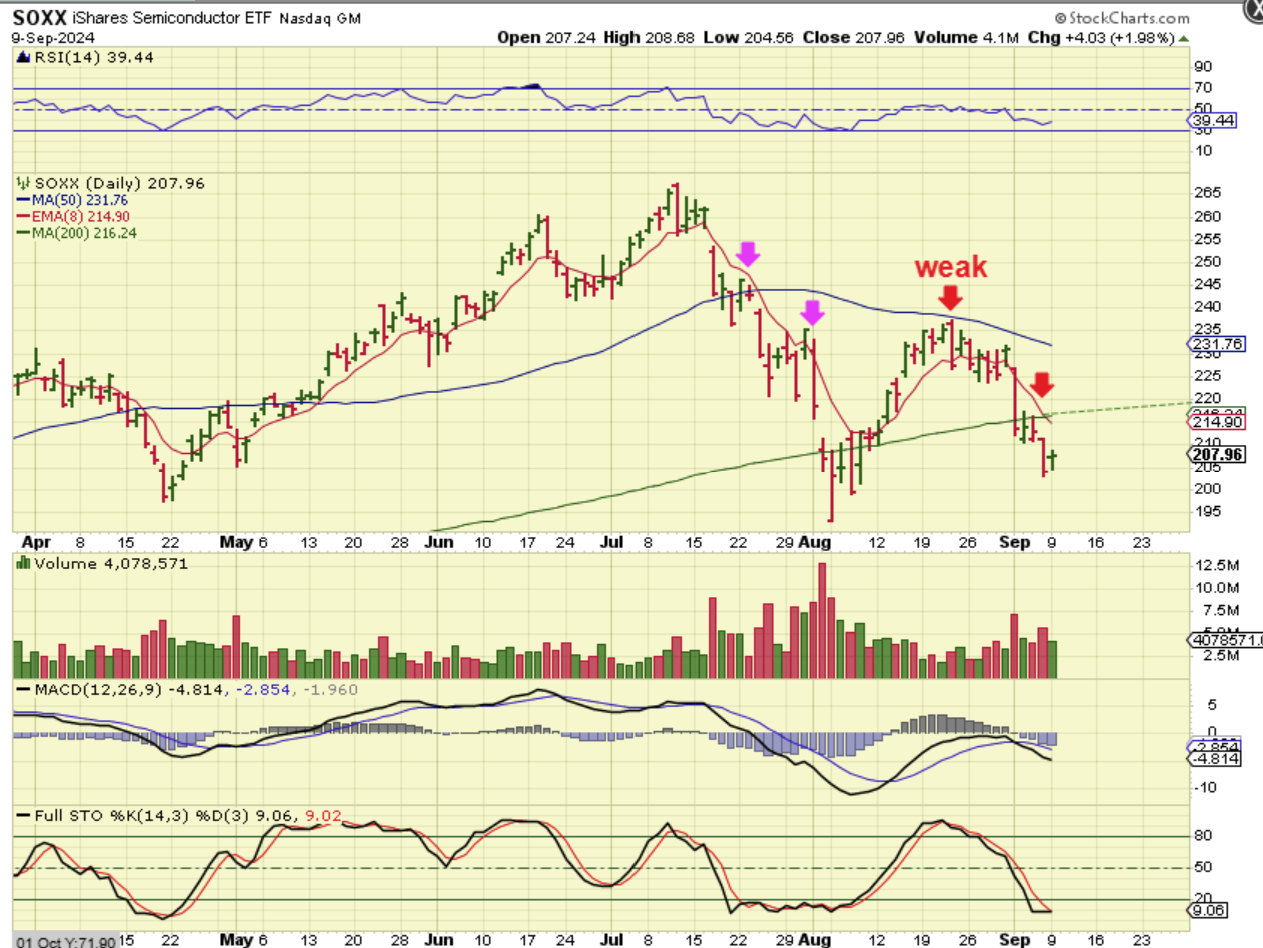
The SOXX is weaker again. It broke below the 50sma in July, a bounce was rejected at the 50sma and then price broke below the 200sma too. Price is now currently still under the 200sma. I honestly would not normally expect price to get back above the 200sma, and I would normally short a tag and rejection at the 200sma, but let me show you a valid possibility with to the General Markets…
.
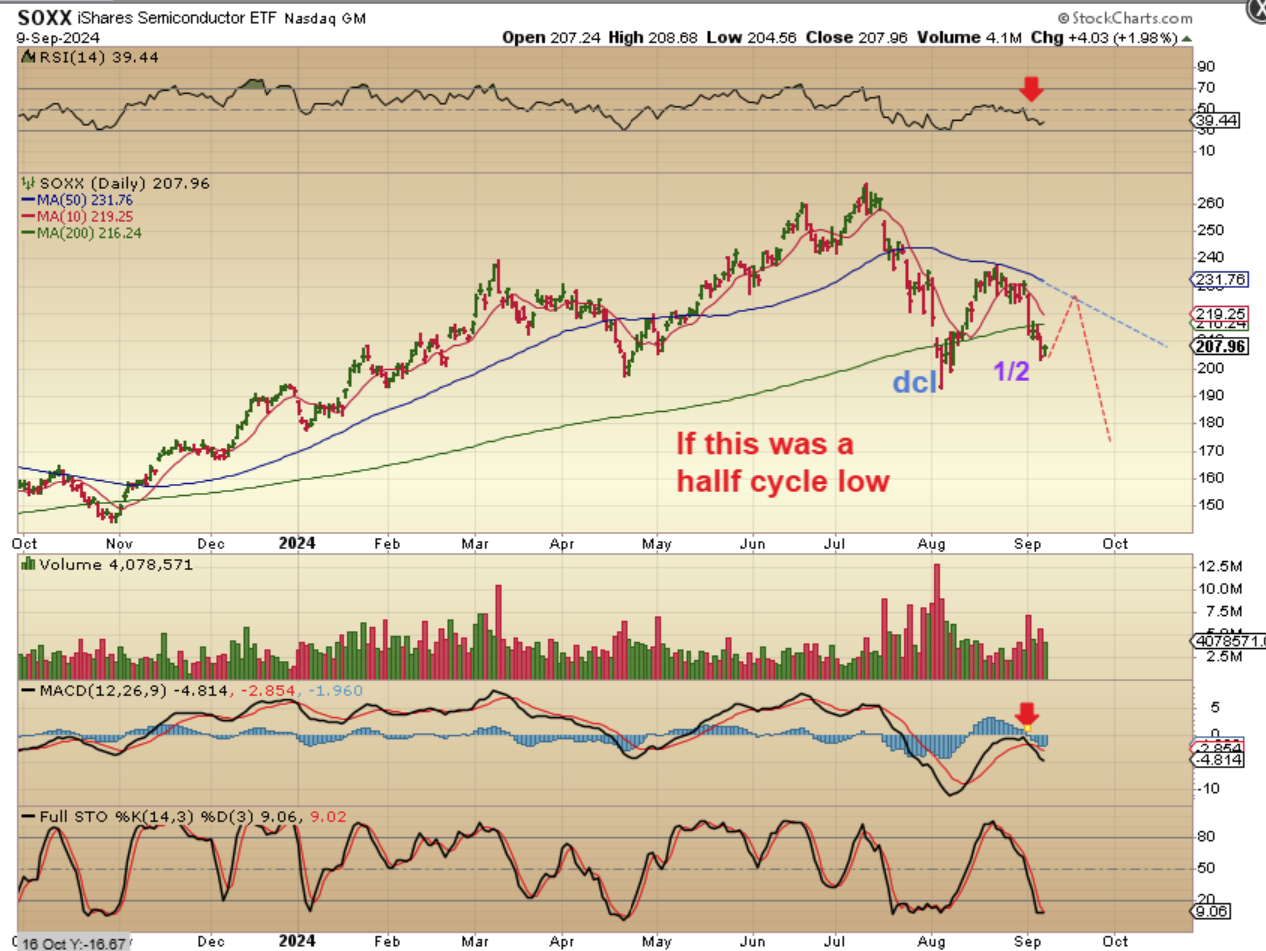
There is one exception to the General Markets continuing to drop this week, and that would be if we now put in place a half cycle low and bounce.
.
A half cycle low could ‘pause’ the selling & cause a bounce for a few days. If that happens, we would still be going lower in the long run, but in the short term we could get a weak bounce out of this weeks data that could last a little longer than a 2 day pause. I am thinking of going short at the 200sma, but I will wait for a reversal there first, so I can use a tight stop.
.
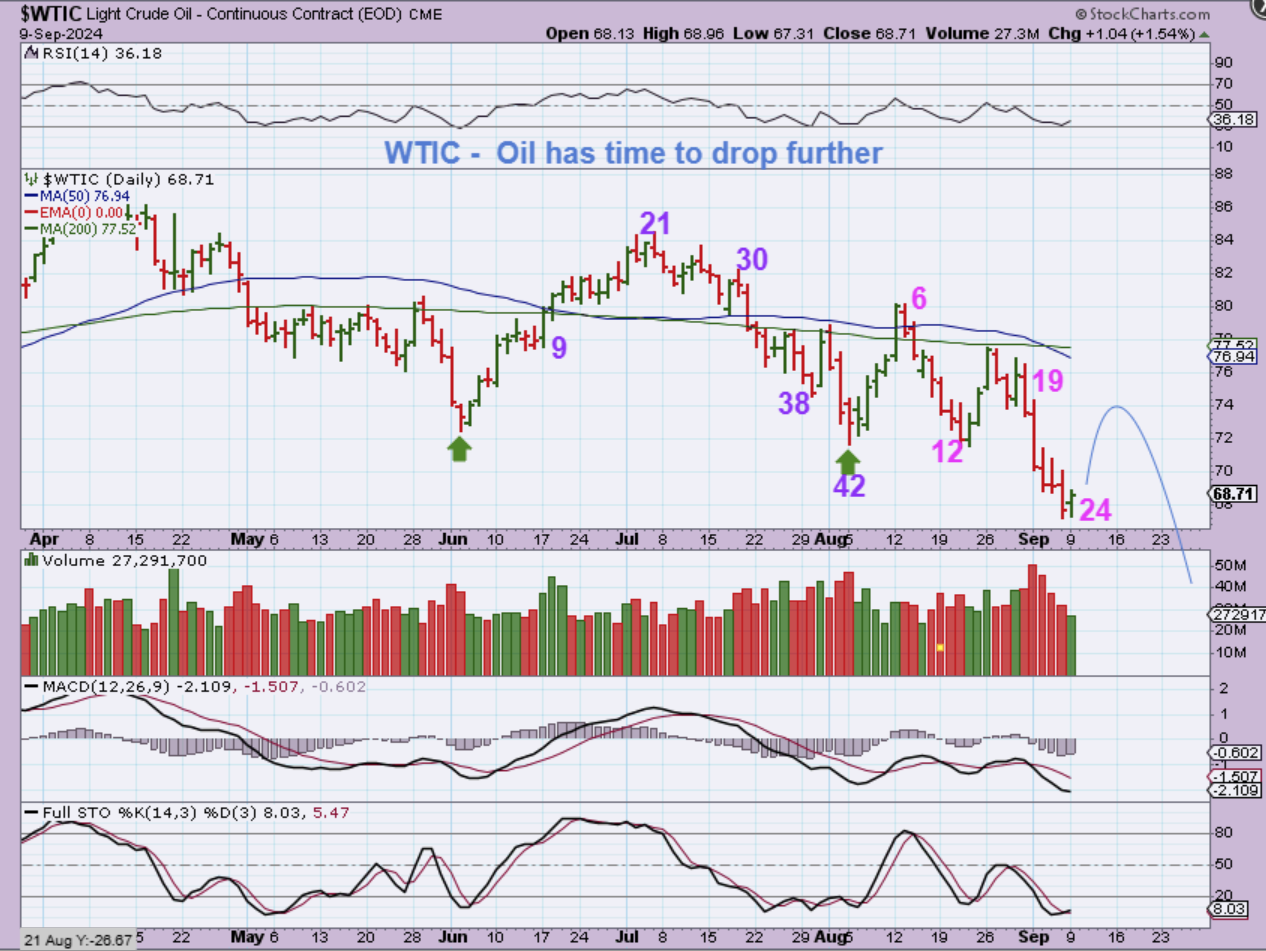
WTIC – Oil can bounce here, but it also is breaking down and has been weaker on each bounce. This is also only a halfway point on the timing for an Oil Daily Cycle.
.
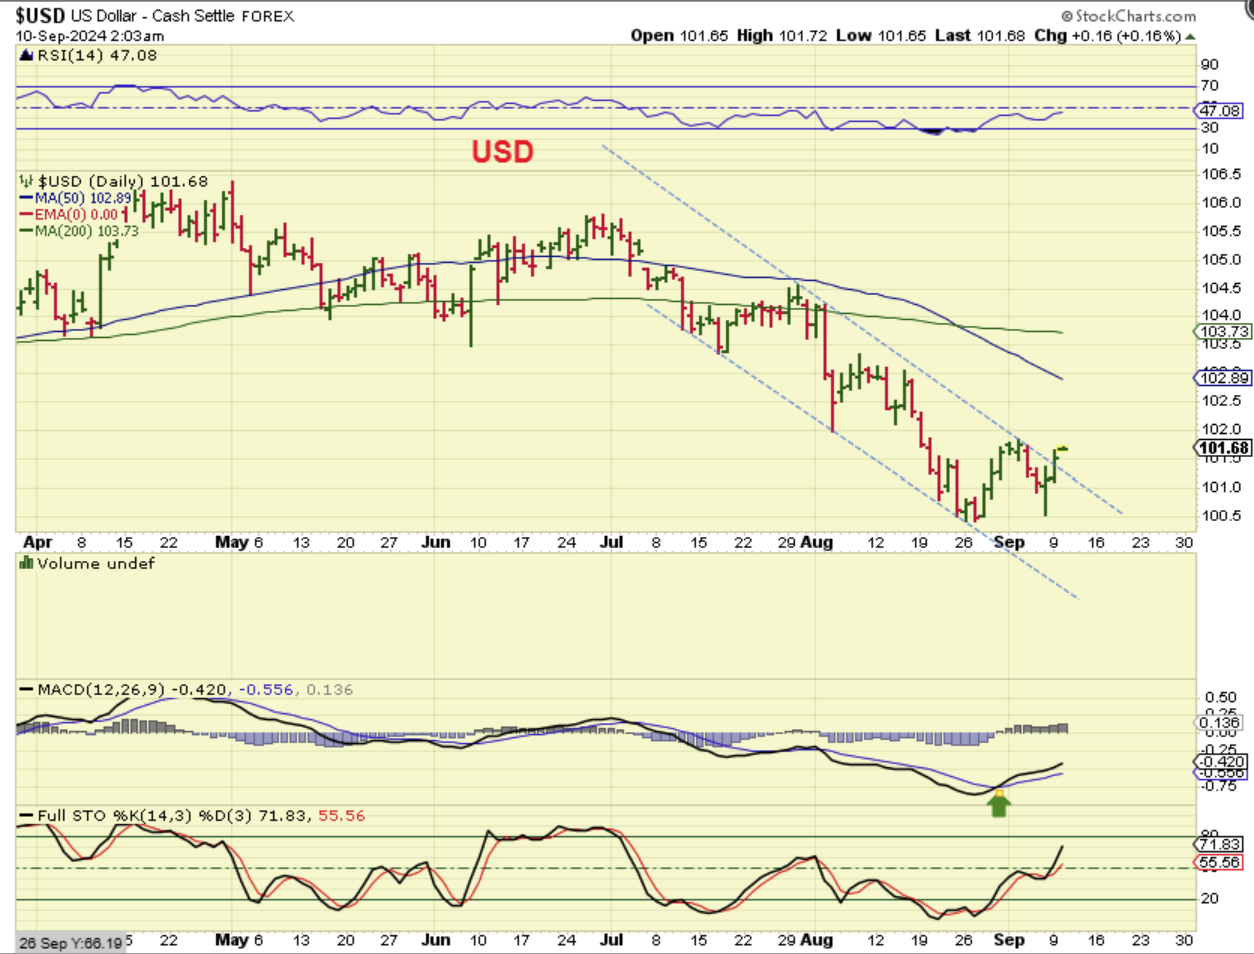
THE USD is moving higher out of a dcl and a possible ICL. The good news is that even though the USD was up on Monday, Gold and Silver were green too.
.
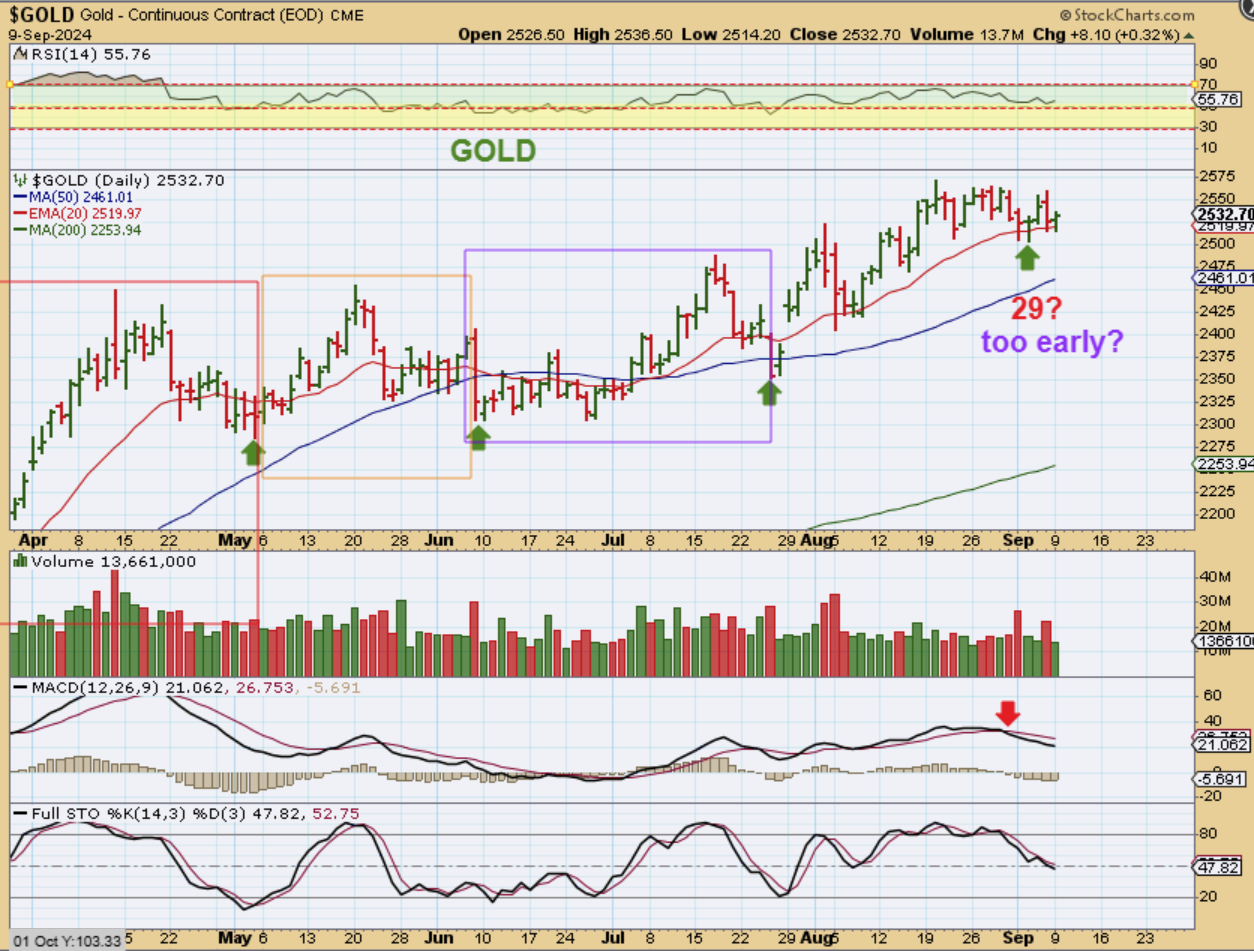
GOLD reversed at the 20 ema and held up over the day 29 low, so we are in the timing for a dcl, but is that too early or is that the dcl?
We have inflation data on Wednesday and Thursday, which affects a rate cut and should move Gold. I was actually hoping for a Monday and Tuesday drop into a day 33 low, and then Wednesday data reverses the selling. That would have given us more confidence to go long with a clear day 33 low. Day 29 might be the dcl, but it is possible that we now need to drop one more time too.
.
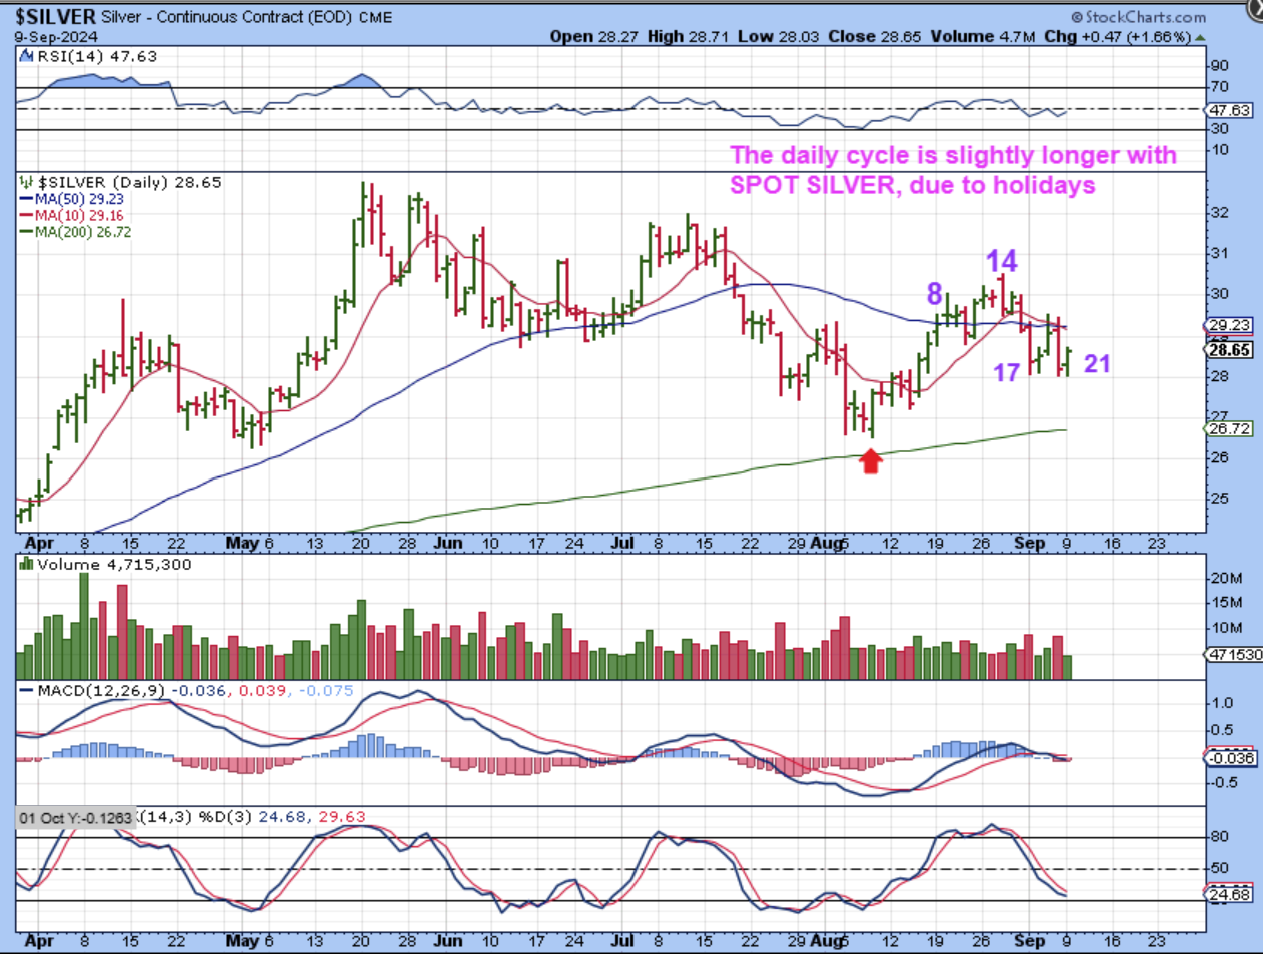
SILVER also pushed higher on Monday, despite the USD move higher. Silver is currently weaker than Gold and it is trading under the 50sma. A good inflation number COULD push this higher, so this is very worth watching. I’ll show you a possibility…
.
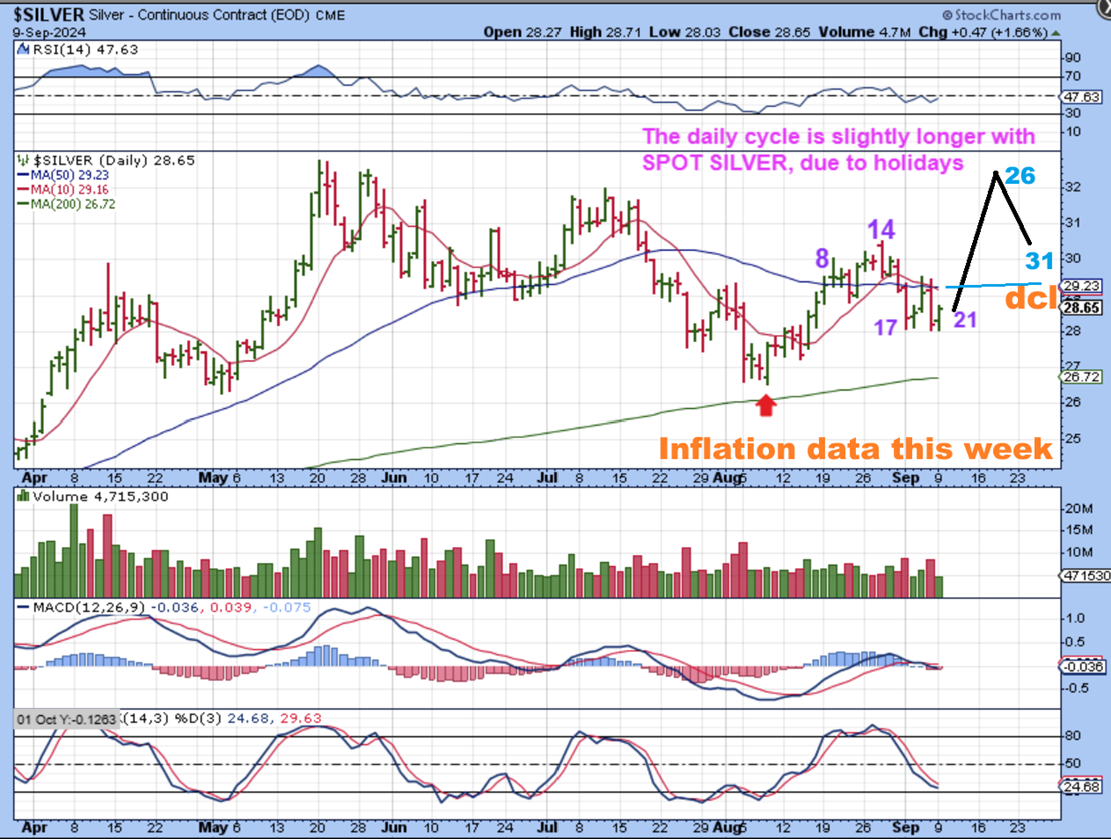
SILVER is on day 21 and it could react positively to the inflation data and run higher for a few days to the May highs, before pulling back into a dcl. This could happen as Gold runs higher out of a dcl. The choppiness has made Gold, Silver, and The Miners tough to read.
.
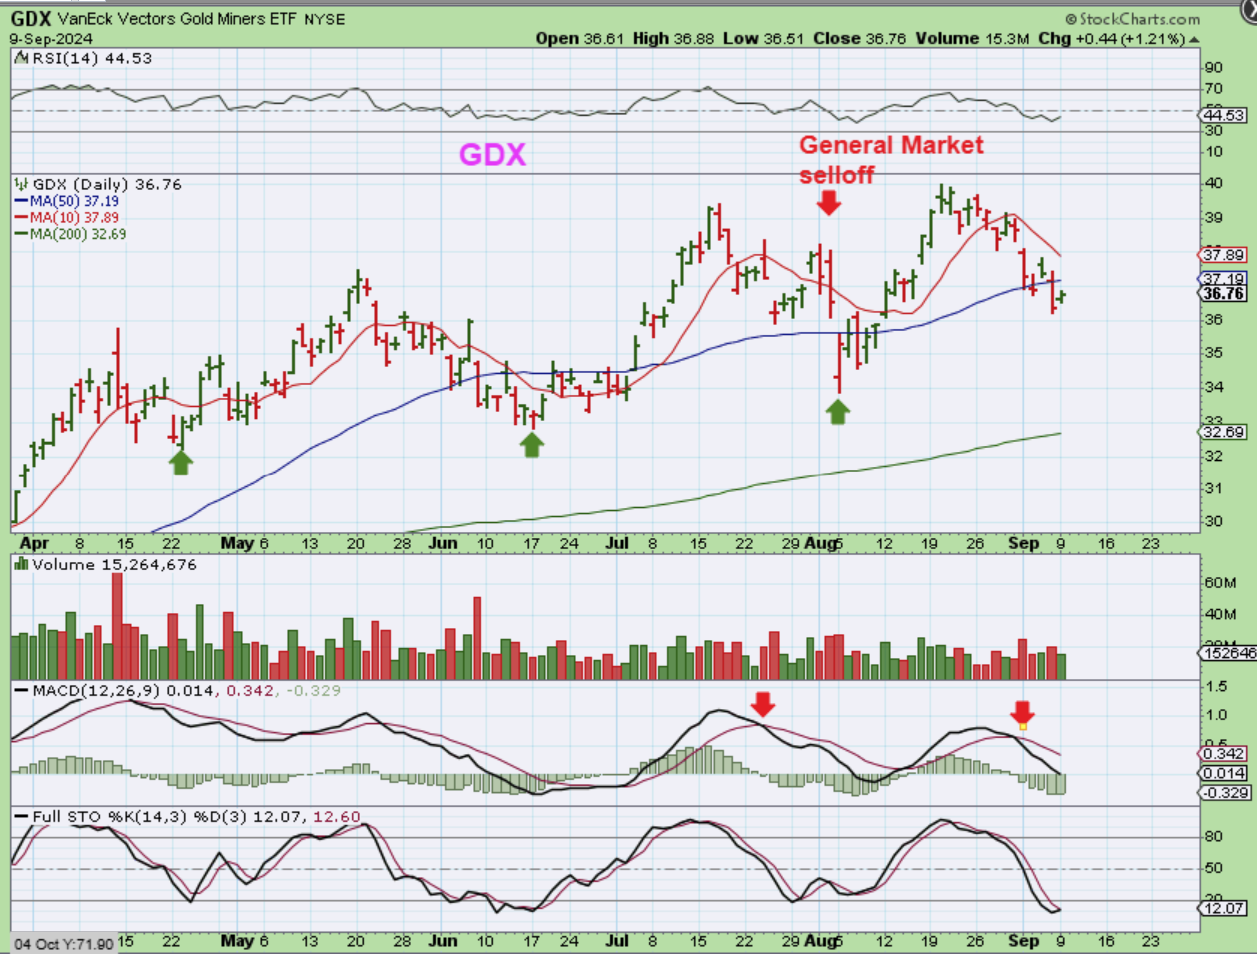
GDX seems to be a little affected by the General Markets weakness, so hopefully we see that change sooner than later. That MACD is a sign of weakness for sure. If the Markets bounce out of a half cycle low,
.
I’ll discuss Bitcoin below, enjoy your Tuesday trading.
.
~ALEX
.
BITCOIN FROM SATURDAY:
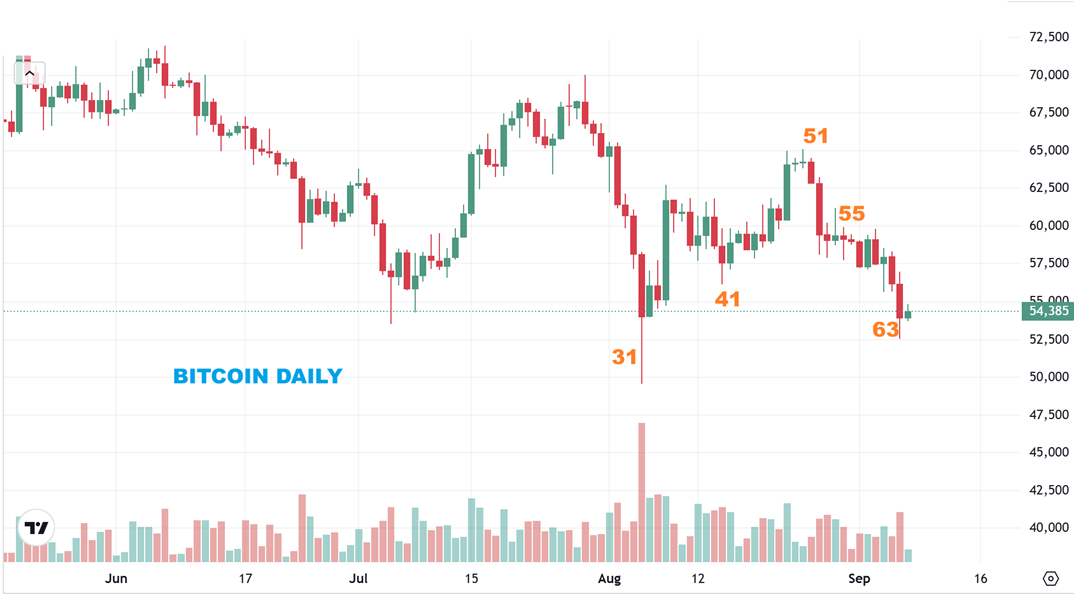
BITCOIN dropped again and is now on day 63 with a reversal and a green candle on Saturday so far. We are due for a low and again, the ETFs should help out if and when Bitcoin moves higher.
.
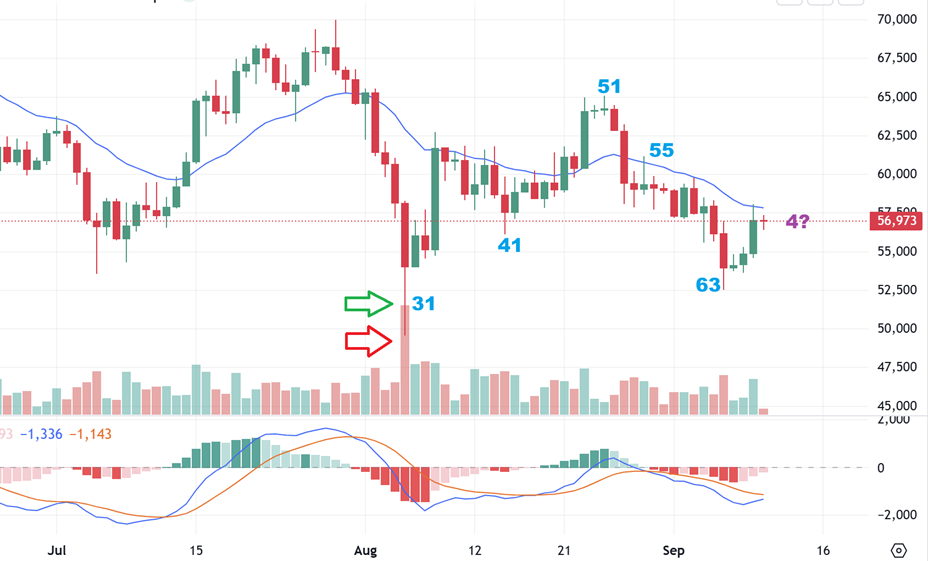
BITCOIN started to slowly move higher after that day 63 reversal candle, but it has yet to take over the 20 ema. This could be day 4 and a break above that 20 ema should be a bullish sign. Crypto stocks actually looked pretty good yesterday, but they are coming up out of THE lows, so even the ones that put in over 10% gains didn’t look all that great. I will show you that below, and then we’ll look at the Weekly Chart of Bitcoin.
.
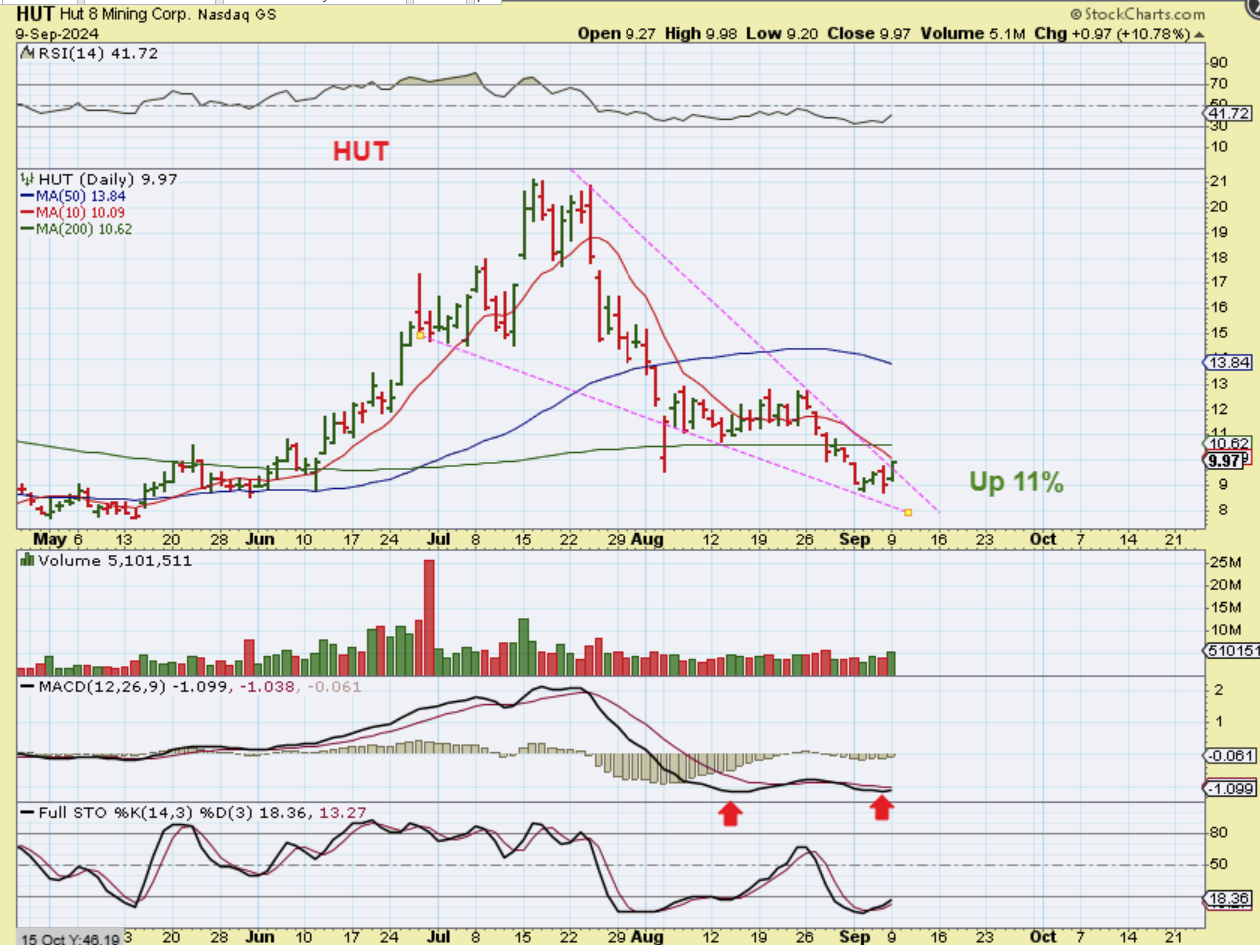
HUT, IREN, BTBT, MARA, CLSK, CIFR, etc were all up over 9%, but the move really didn’t look like very much, because they have fallen so far from the highs. They are oversold and have divergence, but they are also at the lows and under support which now could act as resistance, but these had very strong runs in May and Hut, for example, almost tripled. They are worth watching.
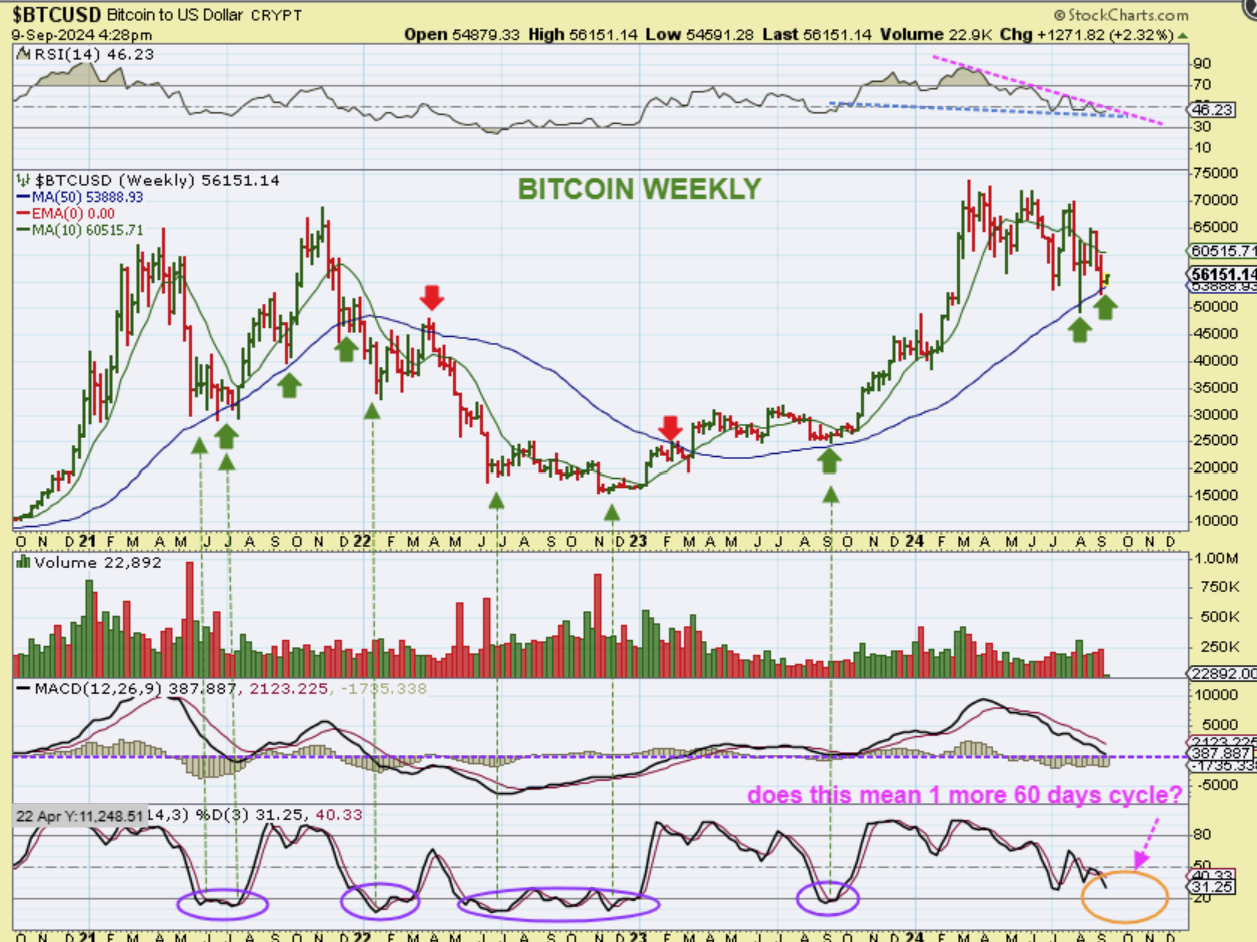
The weekly chart looks great, except for one thing. Let’s discuss that…
.
BITCOIN WEEKLY: I love that Bitcoin just reversed right off of a common weekly support, the 50 week ma, however….the Stochastics didn’t reach the lower level like it usually does. Does it need to? Maybe not, but it does bother me to see this. We have the next 30 days to see if this plays out with strength or weakness for clues to where we are in the stream of time. IF OR WHEN THIS breaks out from this long consolidation, the next run should be VERY STRONG. So where is it now?
1. Ready to run up & break out from this consolidation to new highs? Or
2. Ready to run up with just one more daily cycle to the highs, and then a drop back down to the lows for an ICL and final low (with Stochastics oversold).