Thursday September 19th – Hang On! Post Fed Rollercoaster
The WHIP-SAW moves after the 2 p.m. FOMC Decision were just about as big as they get. It was expected that he would cut .25% until just this week, when .50% started to become mentioned. We got a .50 cut, and the rally that immediately followed looked very real, but within a half of an hour, Prices dropped right back to the lows. You just cannot trust these knee jerk reactions on a Fed day, so now let’s take a look at the charts and see how things finished up. Also remember that the Fed Day move can be a head fake, and the directional move can kick in a day or 2 later…
.
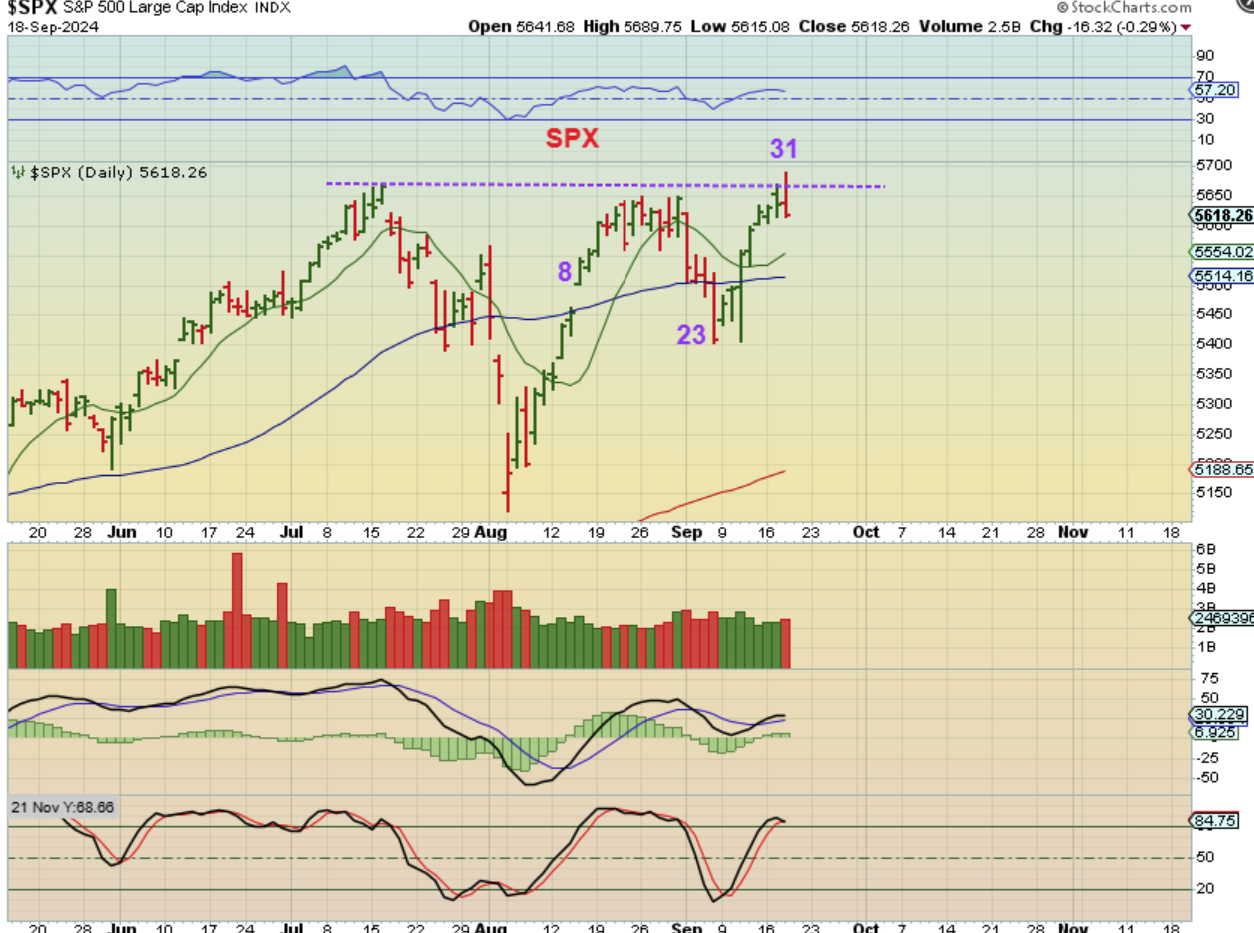
SPX – with a day 31 peak, this is a bullish set up, but it Popped and Dropped on the Fed decision yesterday. So the SPX looks bullish, but what about The SOXX?
.
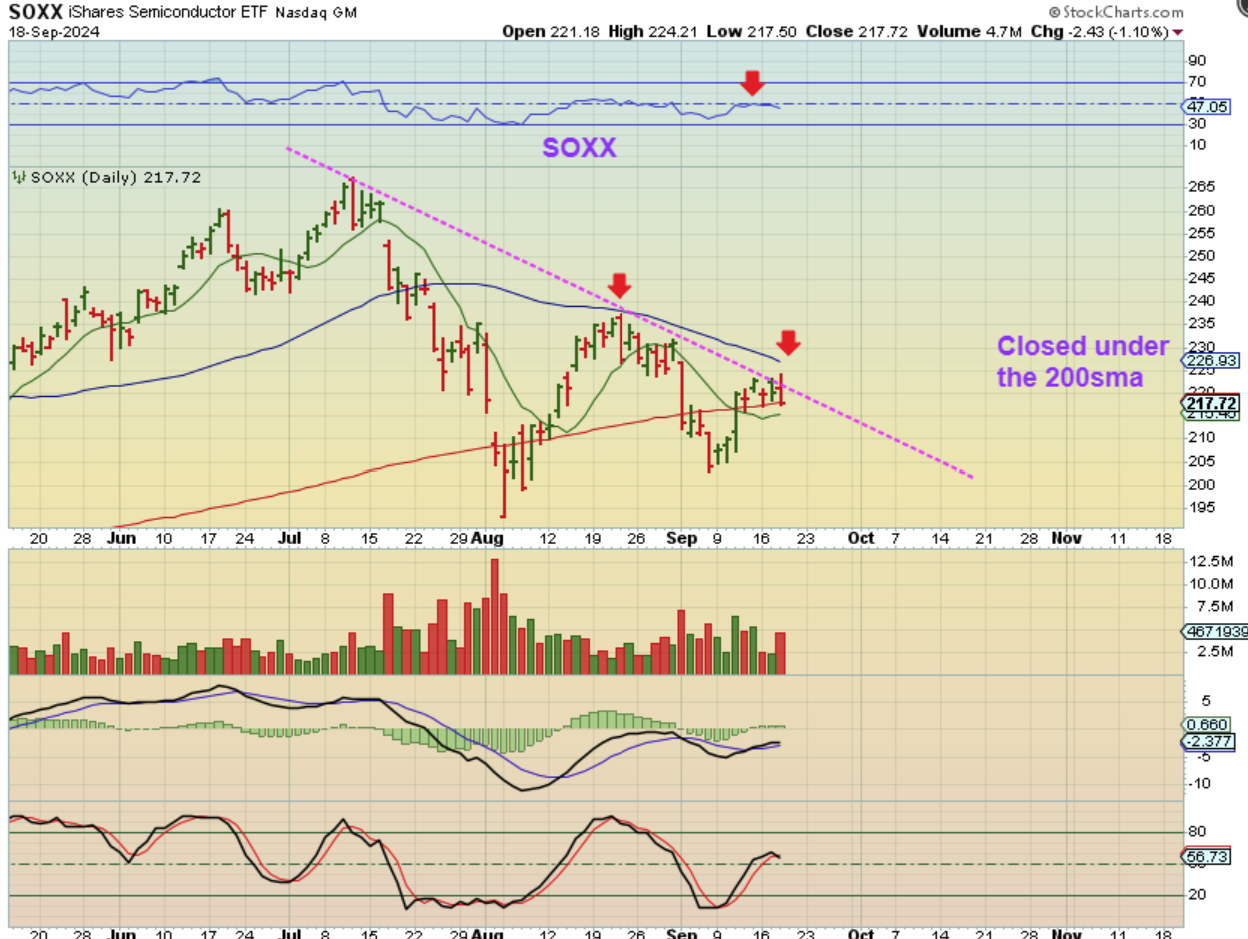
THE SOXX also Popped and Dropped, but it never got back above the 50sma and actually closed slightly below the 200sma. This chart would be viewed as bearish, so until the SPX or SOXX shows us the follow through one way or the other, this market still stands on the edge of bullish and bearish.
.
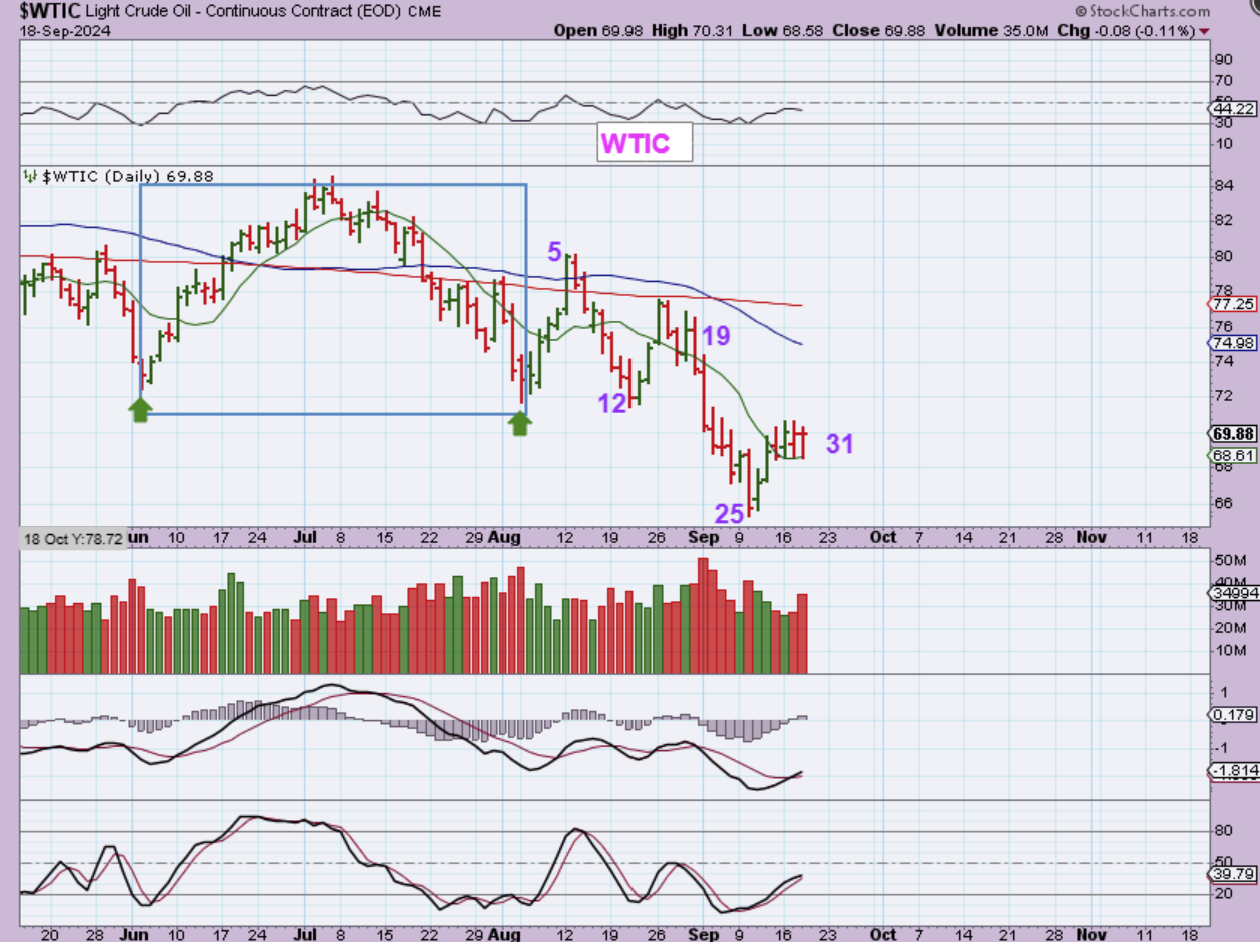
WTIC – Oil is on day 31 and should have more time (a couple of weeks) to bounce around and then move lower. I am expecting Oil to move lower in time, because of the cycle timing. Oil peaked on DAY 5!
.
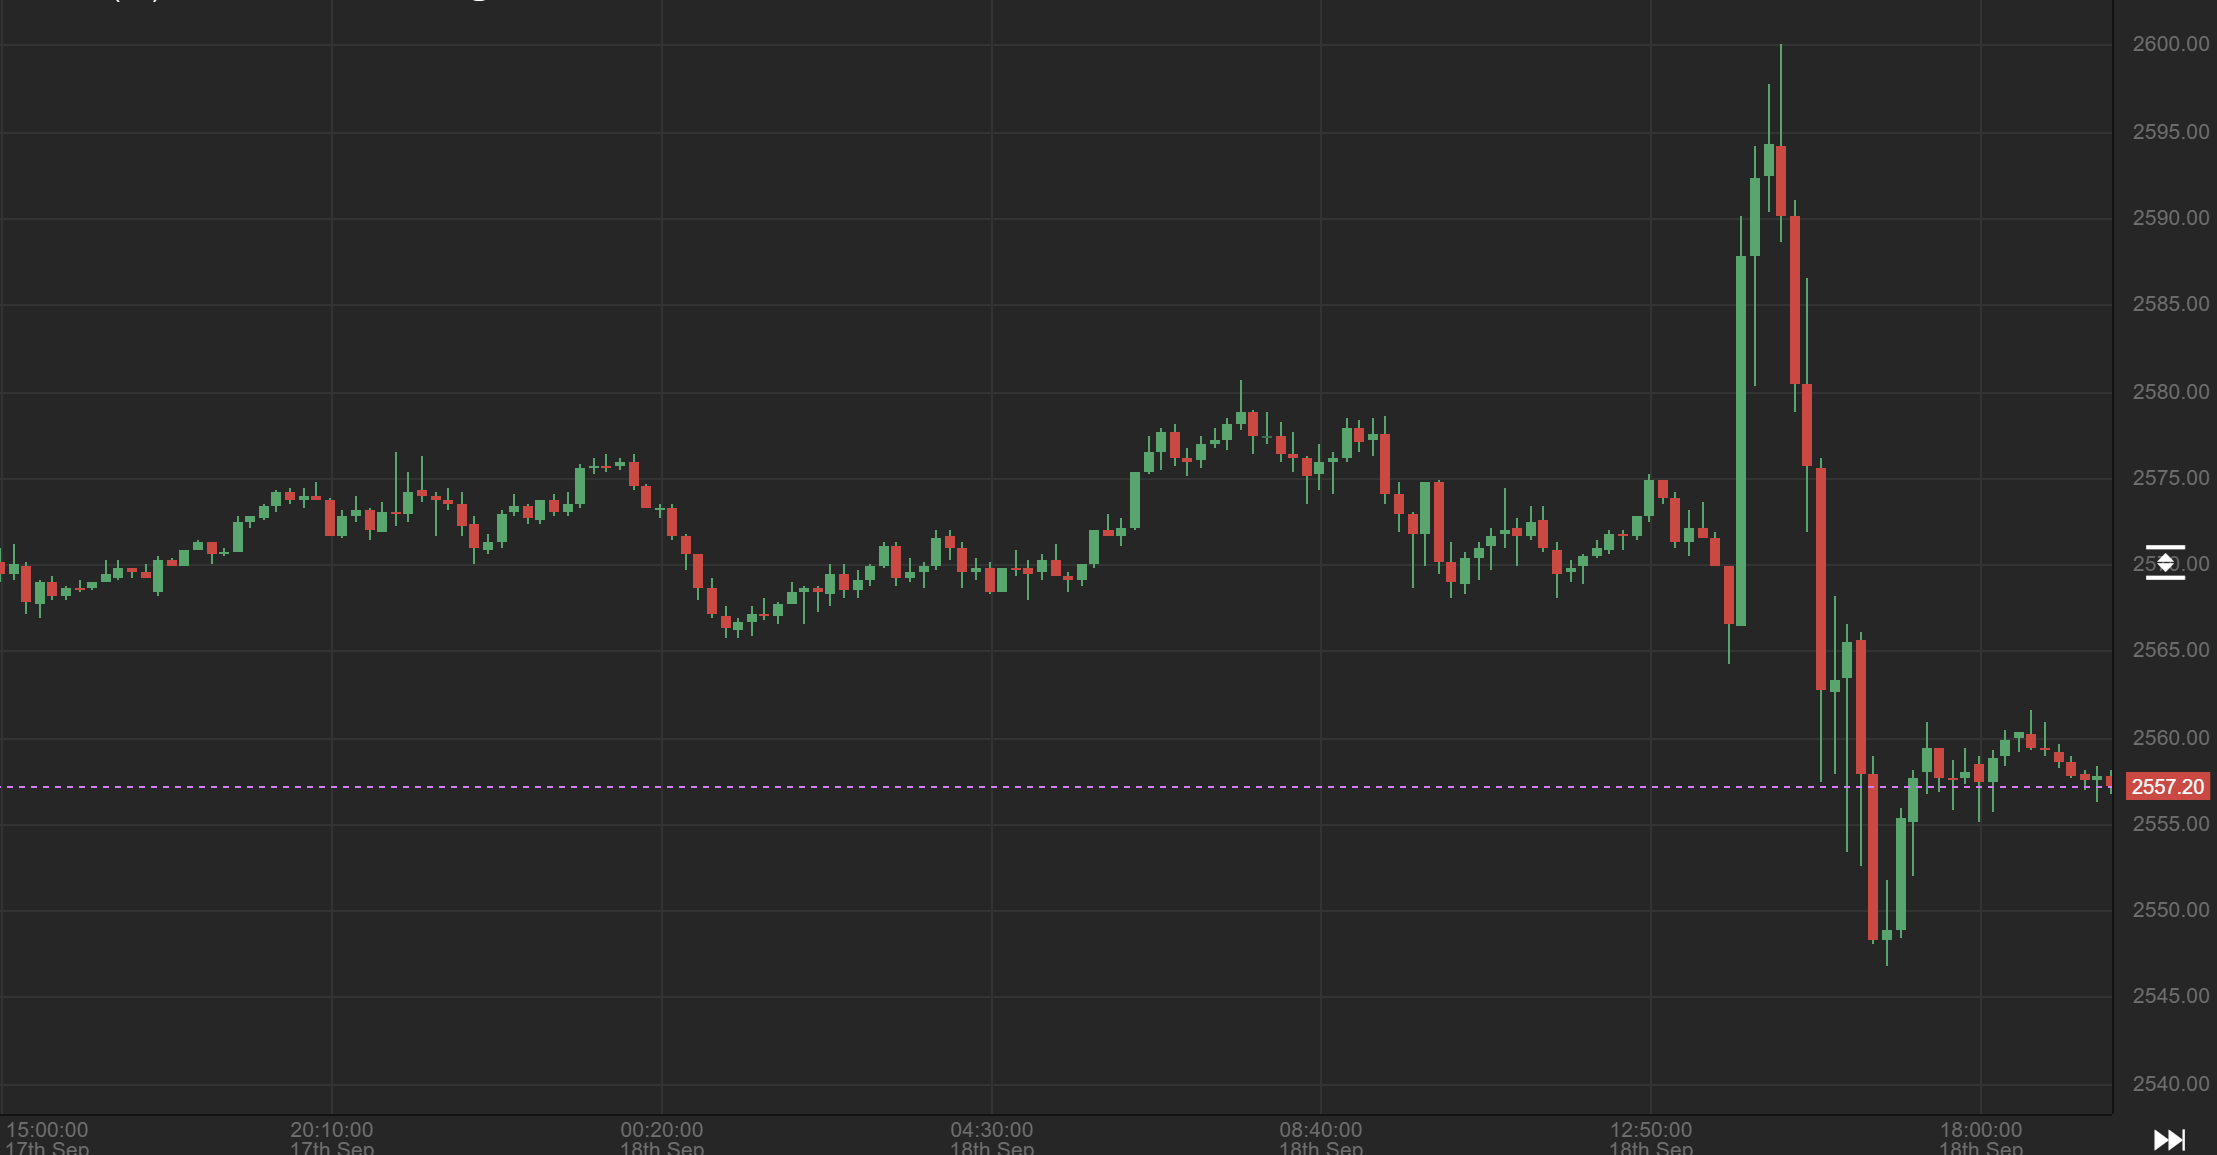
GOLD intraday: You can see that Gold certainly rallied sharply after that Fed Rate Cut. This is a 10 minute chart, so that first Huge candle higher was 2-2:10 p.m. Gold continued higher for 30 more minutes, topped out, and basically crashed back down, even lower than it had traded all day. It then put in a bounce into the close, SO…
.
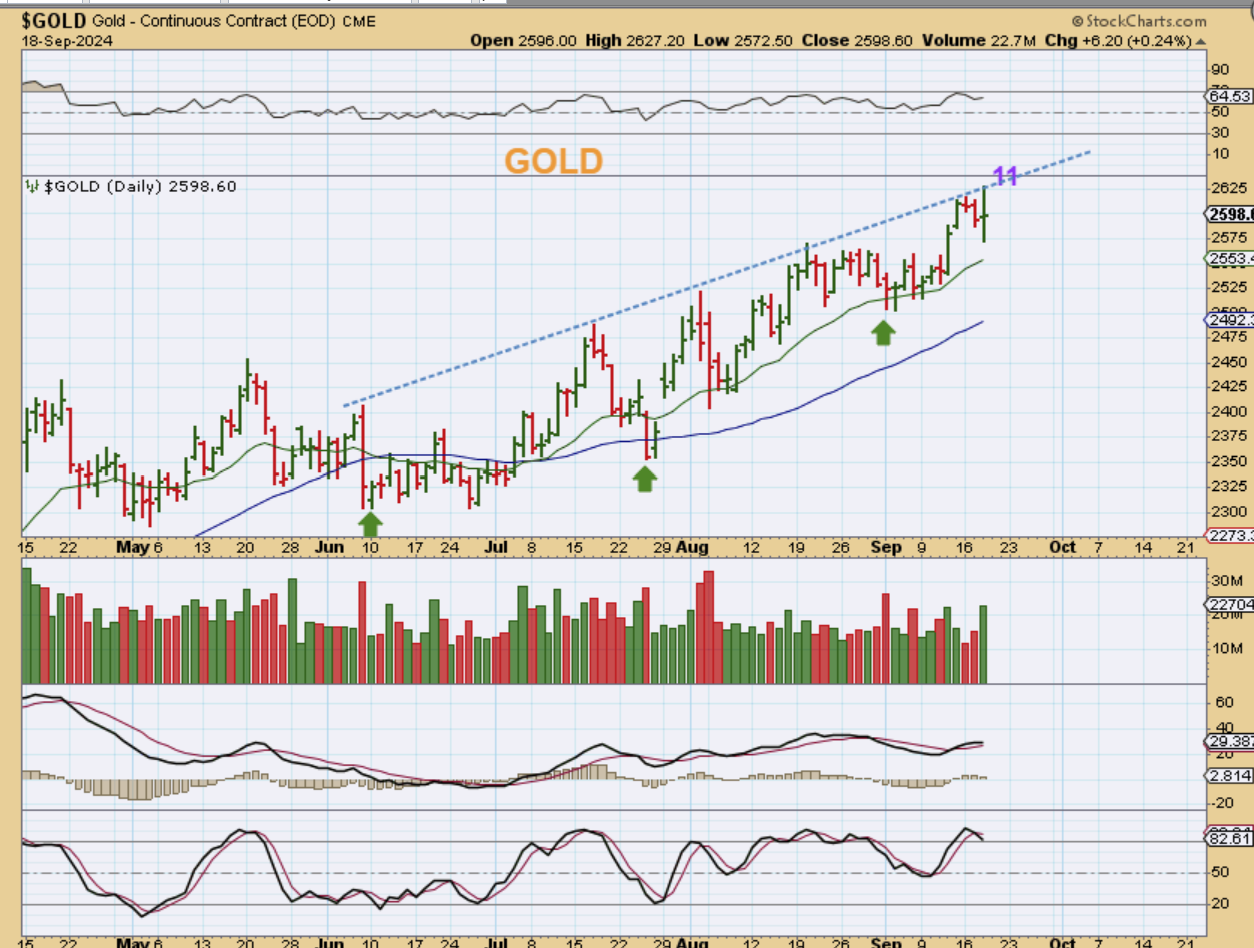
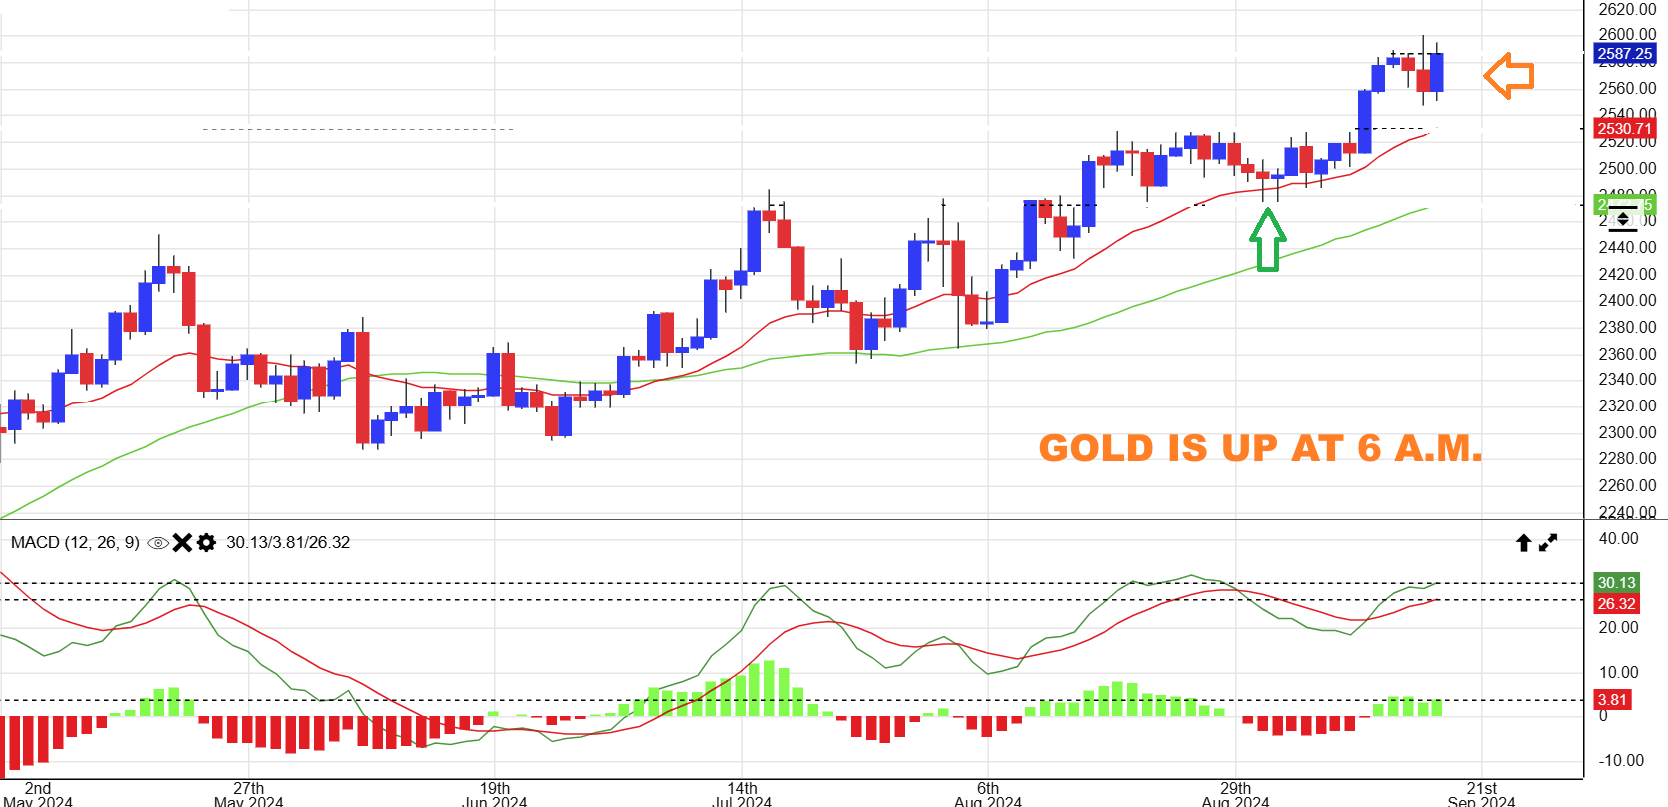
GOLD rallied but it also dropped into the last hour of trading, and that gave Gold a day 11 peak so far. This is not bearish, but to avoid becoming L.T., we need to see it dip and bounce off of that green 20 ema again, or just rally from here. Note: The rate cut was Bullish for Gold and the big picture for Gold is saying that we are in a major bull run and the Fed indicated that we could see more rate cuts in 2024 & 2025. Why this popped and dropped I have no idea?
.
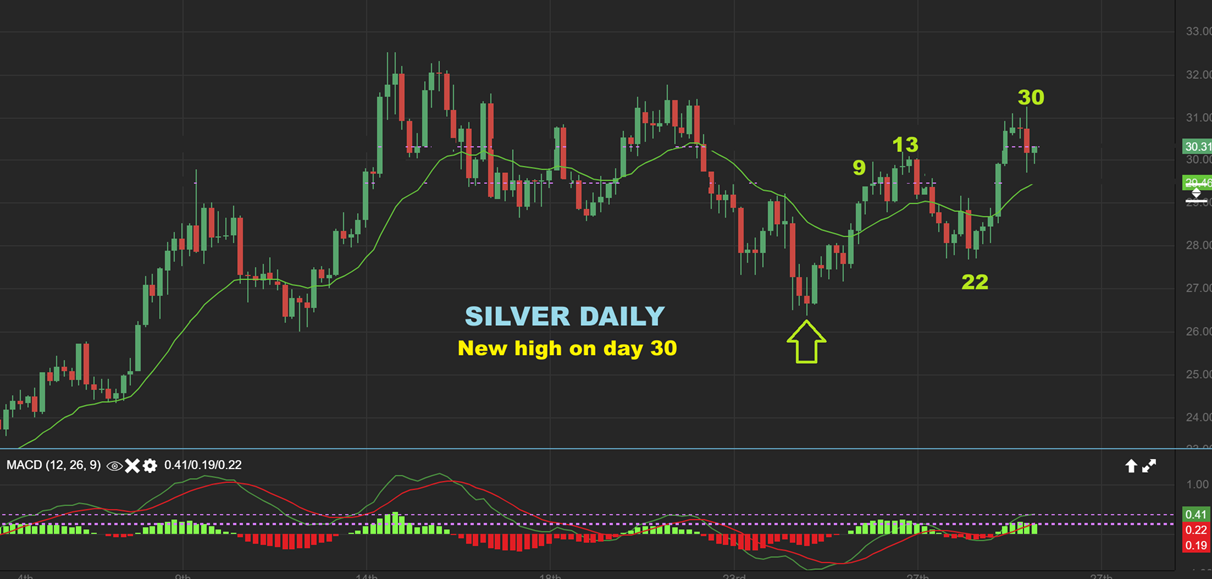
SILVER peaked on day 30 with the rally Pop & Drop Wednesday. Silver can dip lower and put in a mild dcl, or yesterday I showed you another idea…
.
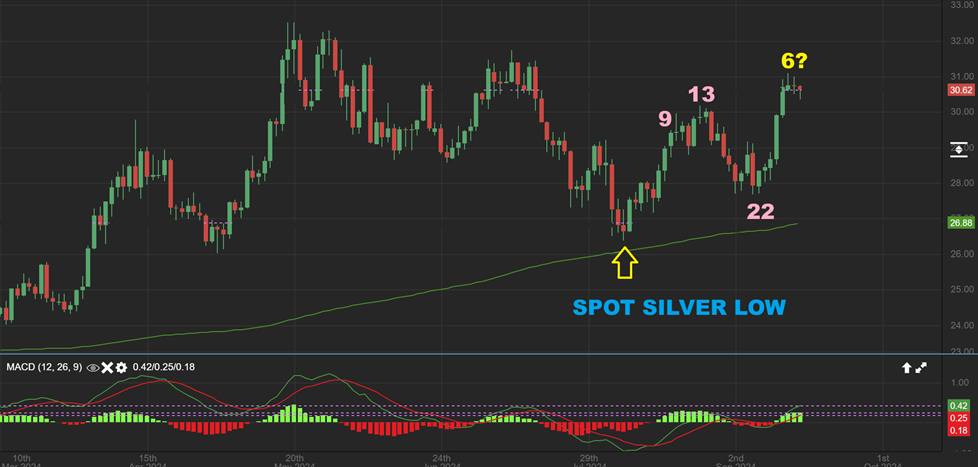
Yesterday I showed you another idea, and that was a day 22 dcl? I said…
.
SILVER – WHAT IF Silver does rally strongly from here, is it even possible? If we got a 50 basis point cut, I would say that day 22 could be an early dcl and then we’d be on day 7 here, and that matches Golds day 10 more closely.
.
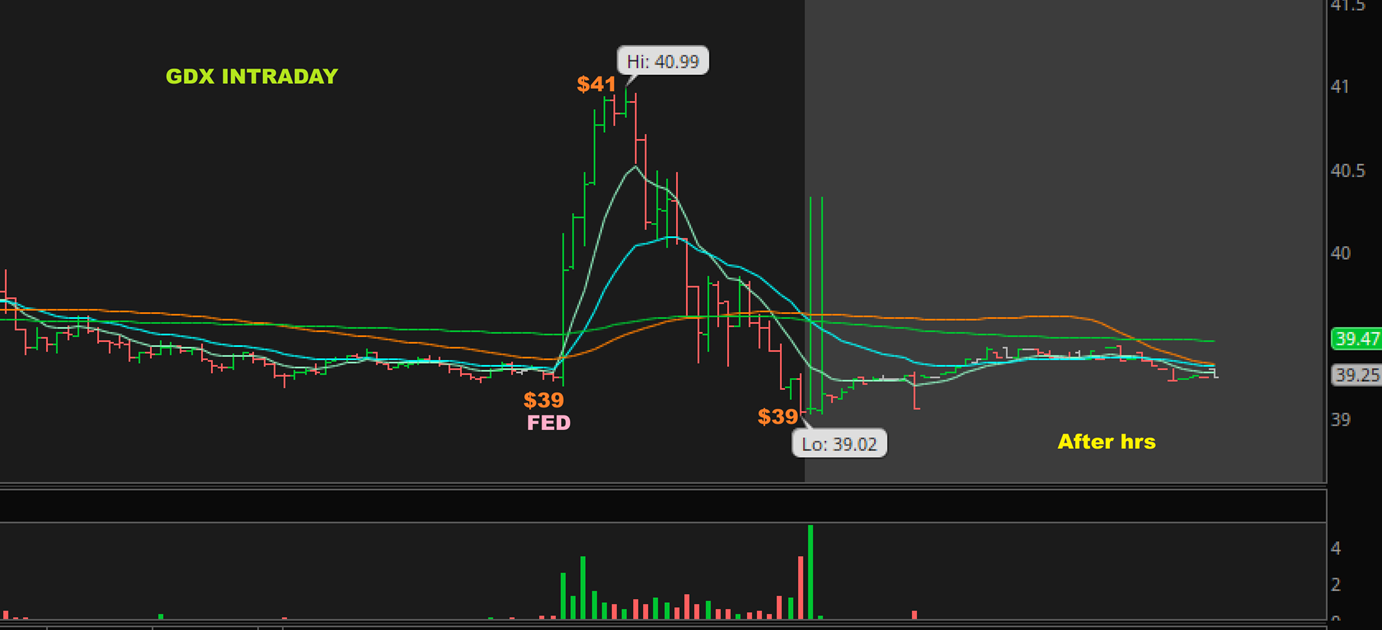
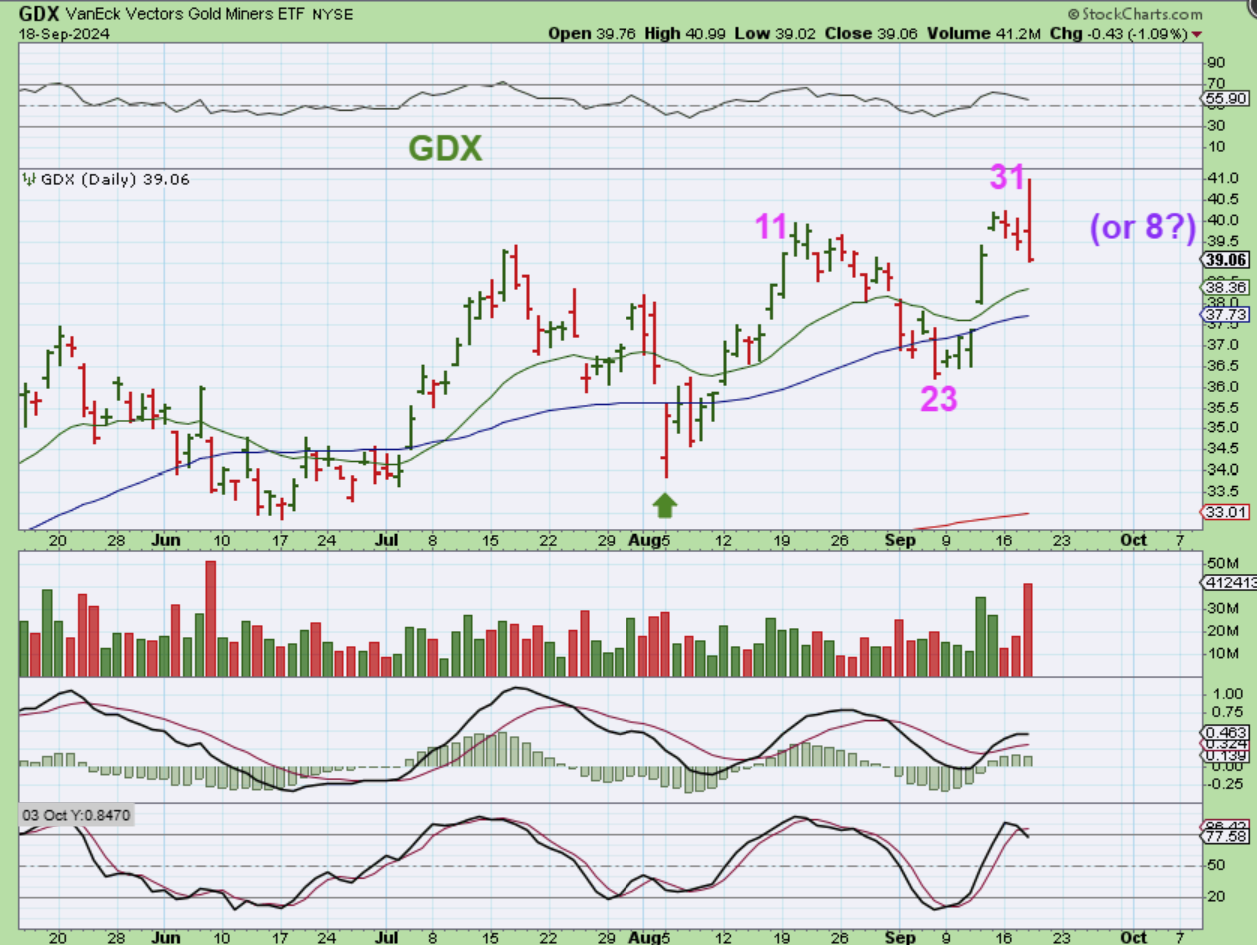
GDX rallied sharply and sold off too. That was a big $2 rally and drop.
.
So GDX is either a day 31 Pop and drop and we head for a dcl, OR a day 23 dcl may be in place if GDX rallies post Fed.
.
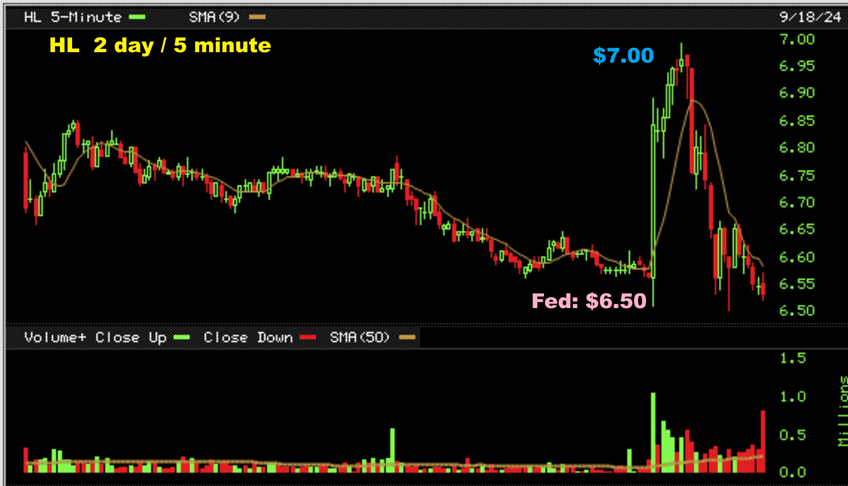
Many or all of the Miners Popped and dropped too.
.
HL – To leap from $6.50 to $6.90 in 5 minutes, and then continue to $7.00 in 30 minutes is very convincing, but then it sold off giving it all back.
.
This is how I ended yesterdays report:
.
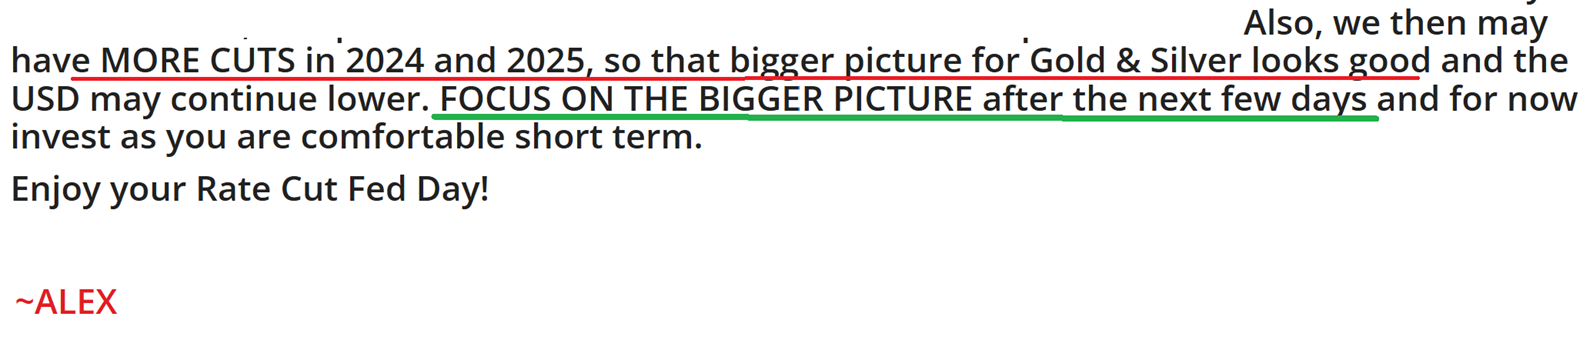
All I can say is that the Pop and Drop is really puzzling, since a .50% rate cut should be quite bullish here. I know that we often get a fake move the day of the Fed, and then a real move may follow a day or 2 later, so we’ll see what happens Thursday and Friday. When I think of Gold with somewhat of a surprise .50 basis cut, I would have expected Gold to Pop and run. I know that .25 was already figured in, but a .50 now and the Fed then alluded to another possible .50 in 2024 and maybe 4 more cuts in 2025? That should be very bullish for Gold. THAT should, in my opinion, roll the USD over and cause that long bull Run in Gold that I pointed out in the Weekend report. We’ll just have to wait and see how this week ends, but as of right now, the Big Picture Bull for Gold is still in tact. Also, if Gold drifts a little higher on Thursday or Friday, the Weekly charts also still look very Bullish to me.
.
ENJOY YOUR THURSDAY TRADING!
.
~ALEX
.
P.S. This report was written on Wednesday evening, and now at 6 a.m. Gold & Silver are higher post Fed.
.
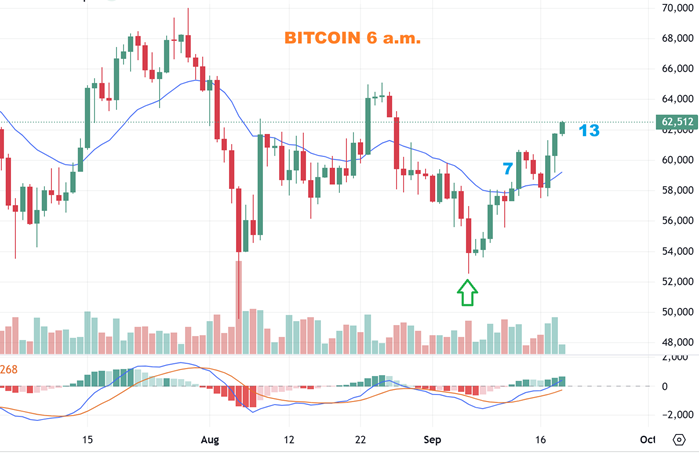
BITCOIN LIVE 6 A.M. Bitcoin popped and dropped too, but it doesn’t show up on the chart, because it is up now, on the 13th day out of the lows. This chart was taken at 6 a.m. on Thursday – Post Fed