Thursday September 12th – More Volatility
DATA – If you were not in front of your Computer yesterday when the markets opened, you probably wouldn’t believe what happened.
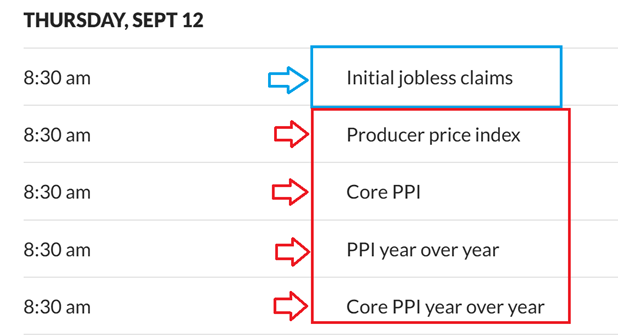
1. The markets gapped open on the Inflation news (Inflation dropped, good for rate cuts).
2. Then the markets sold off and looked like a lack of buying couldn’t support the markets. They sold off quickly and sharply as the selling picked up and then suddenly…
3. A massive rally and reversal that looked very bullish. We also have inflation data Thursday, but it is mixed with Jobless Claims, so more volatility may be what we see. Lets go to the charts…
.
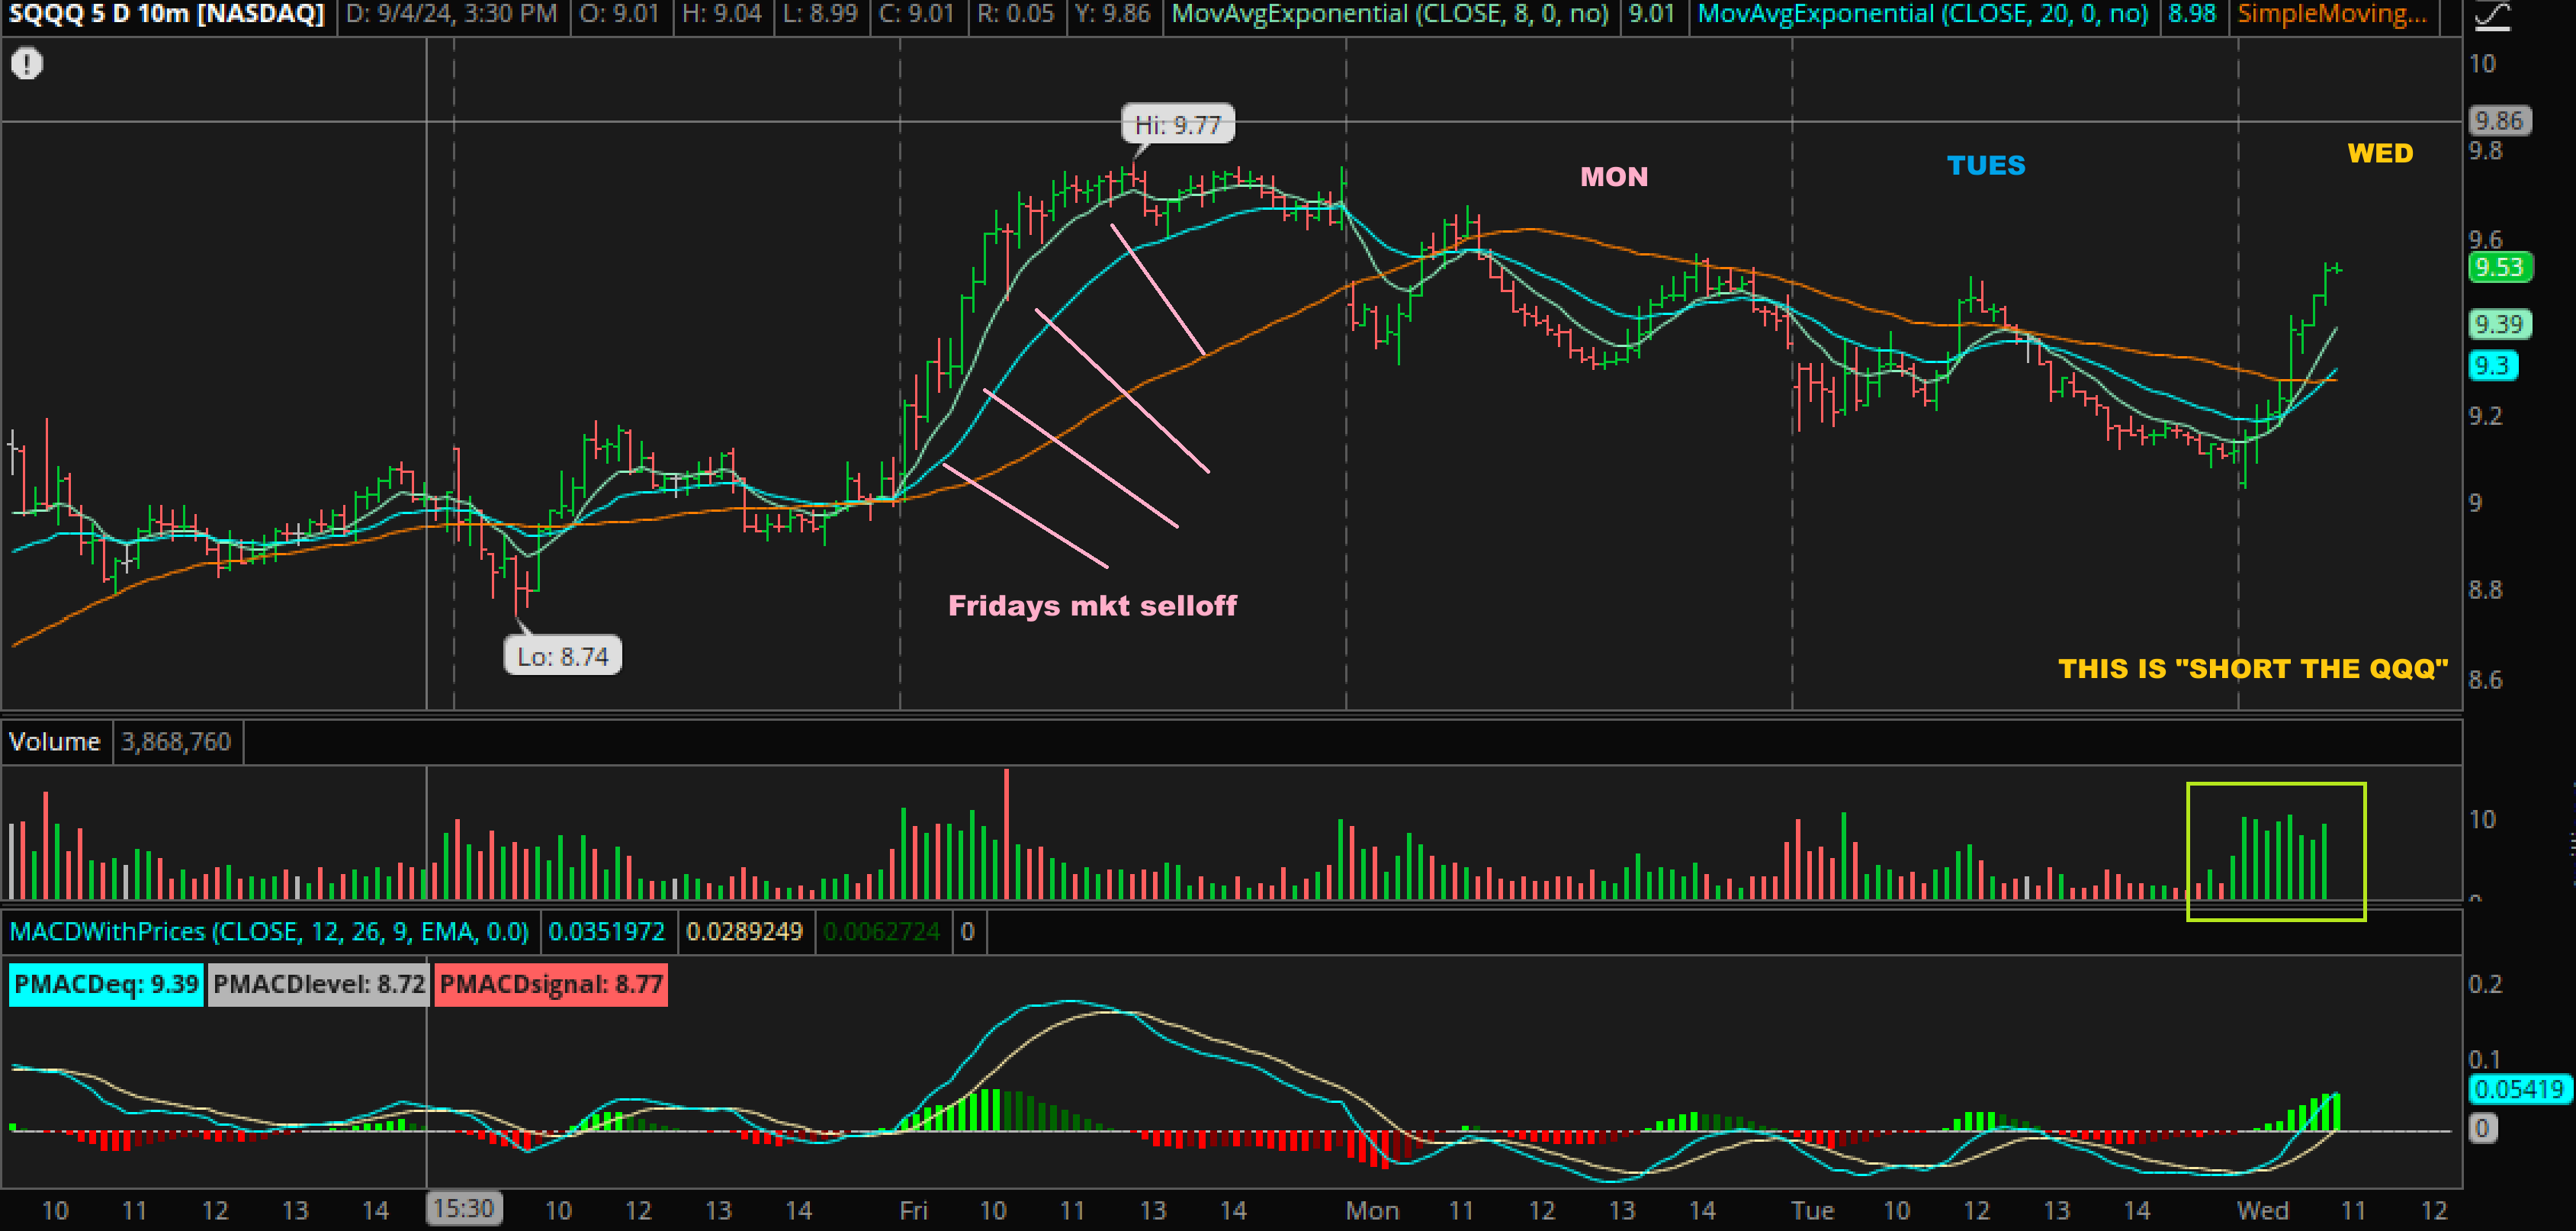
The markets sold off sharply in the morning, and I grabbed this chart after 1 hour of trading. This looked VERY BEARISH and it definitely looked like the sell off was going to continue.
.
This was the SQQQ (short the markets) Intraday chart and I had grabbed SOXS at about 1/2 of this move near the red line. As a 5 minute chart, this is showing you that every 5 minutes we saw selling in the QQQ and buying in the SQQQ. Last Friday the selling lasted all day so I was short thinking that we were going to see that, and suddenly it just turned around FAST. I sold my SOXS and flipped to long Crypto stocks and 2 Silver stocks.
.
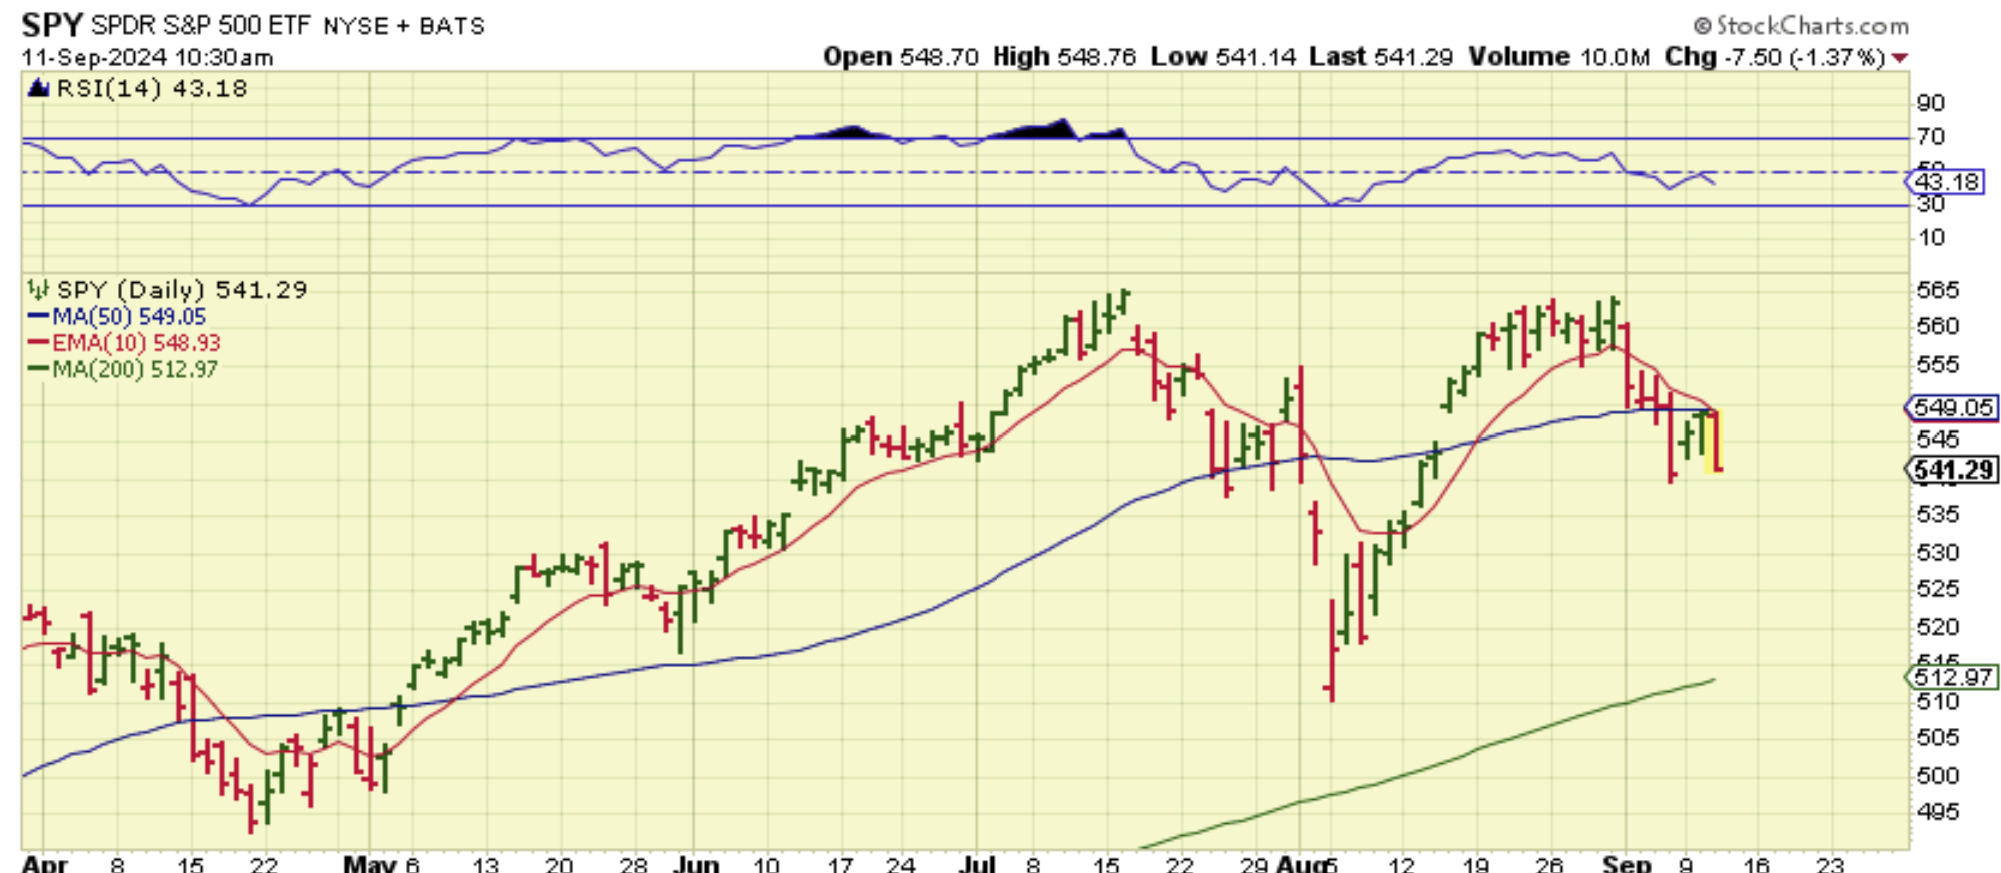
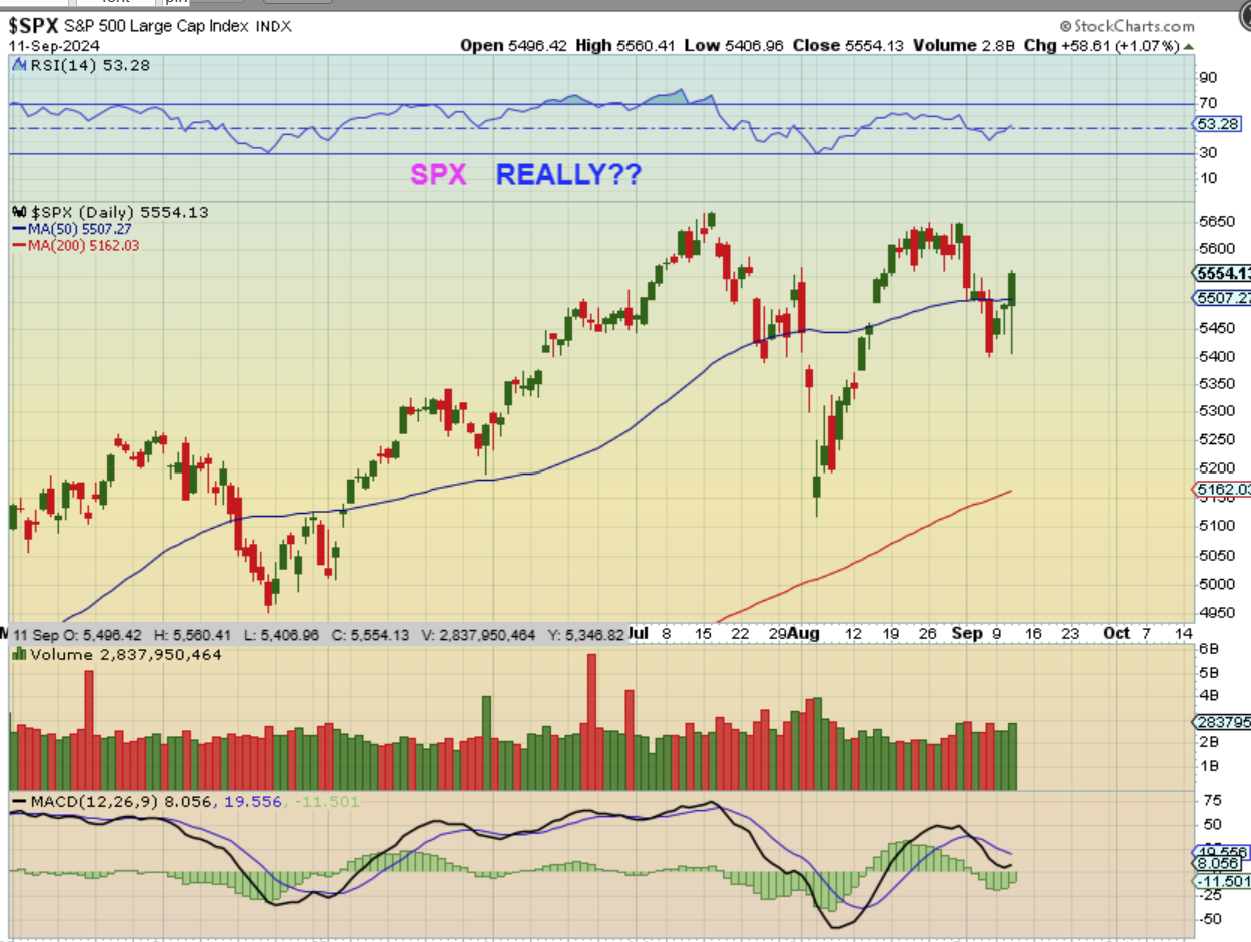
SPX – The sell off was deep and ugly, but Suddenly a strong non-stop rally kicked in and the markets ran higher all day long. Now when we see this candle, it looks amazingly strong, but can it last? This set up doesn’t make sense using cycle counts, but it could be that ‘half cycle low’ that I mentioned in the last 2 reports.
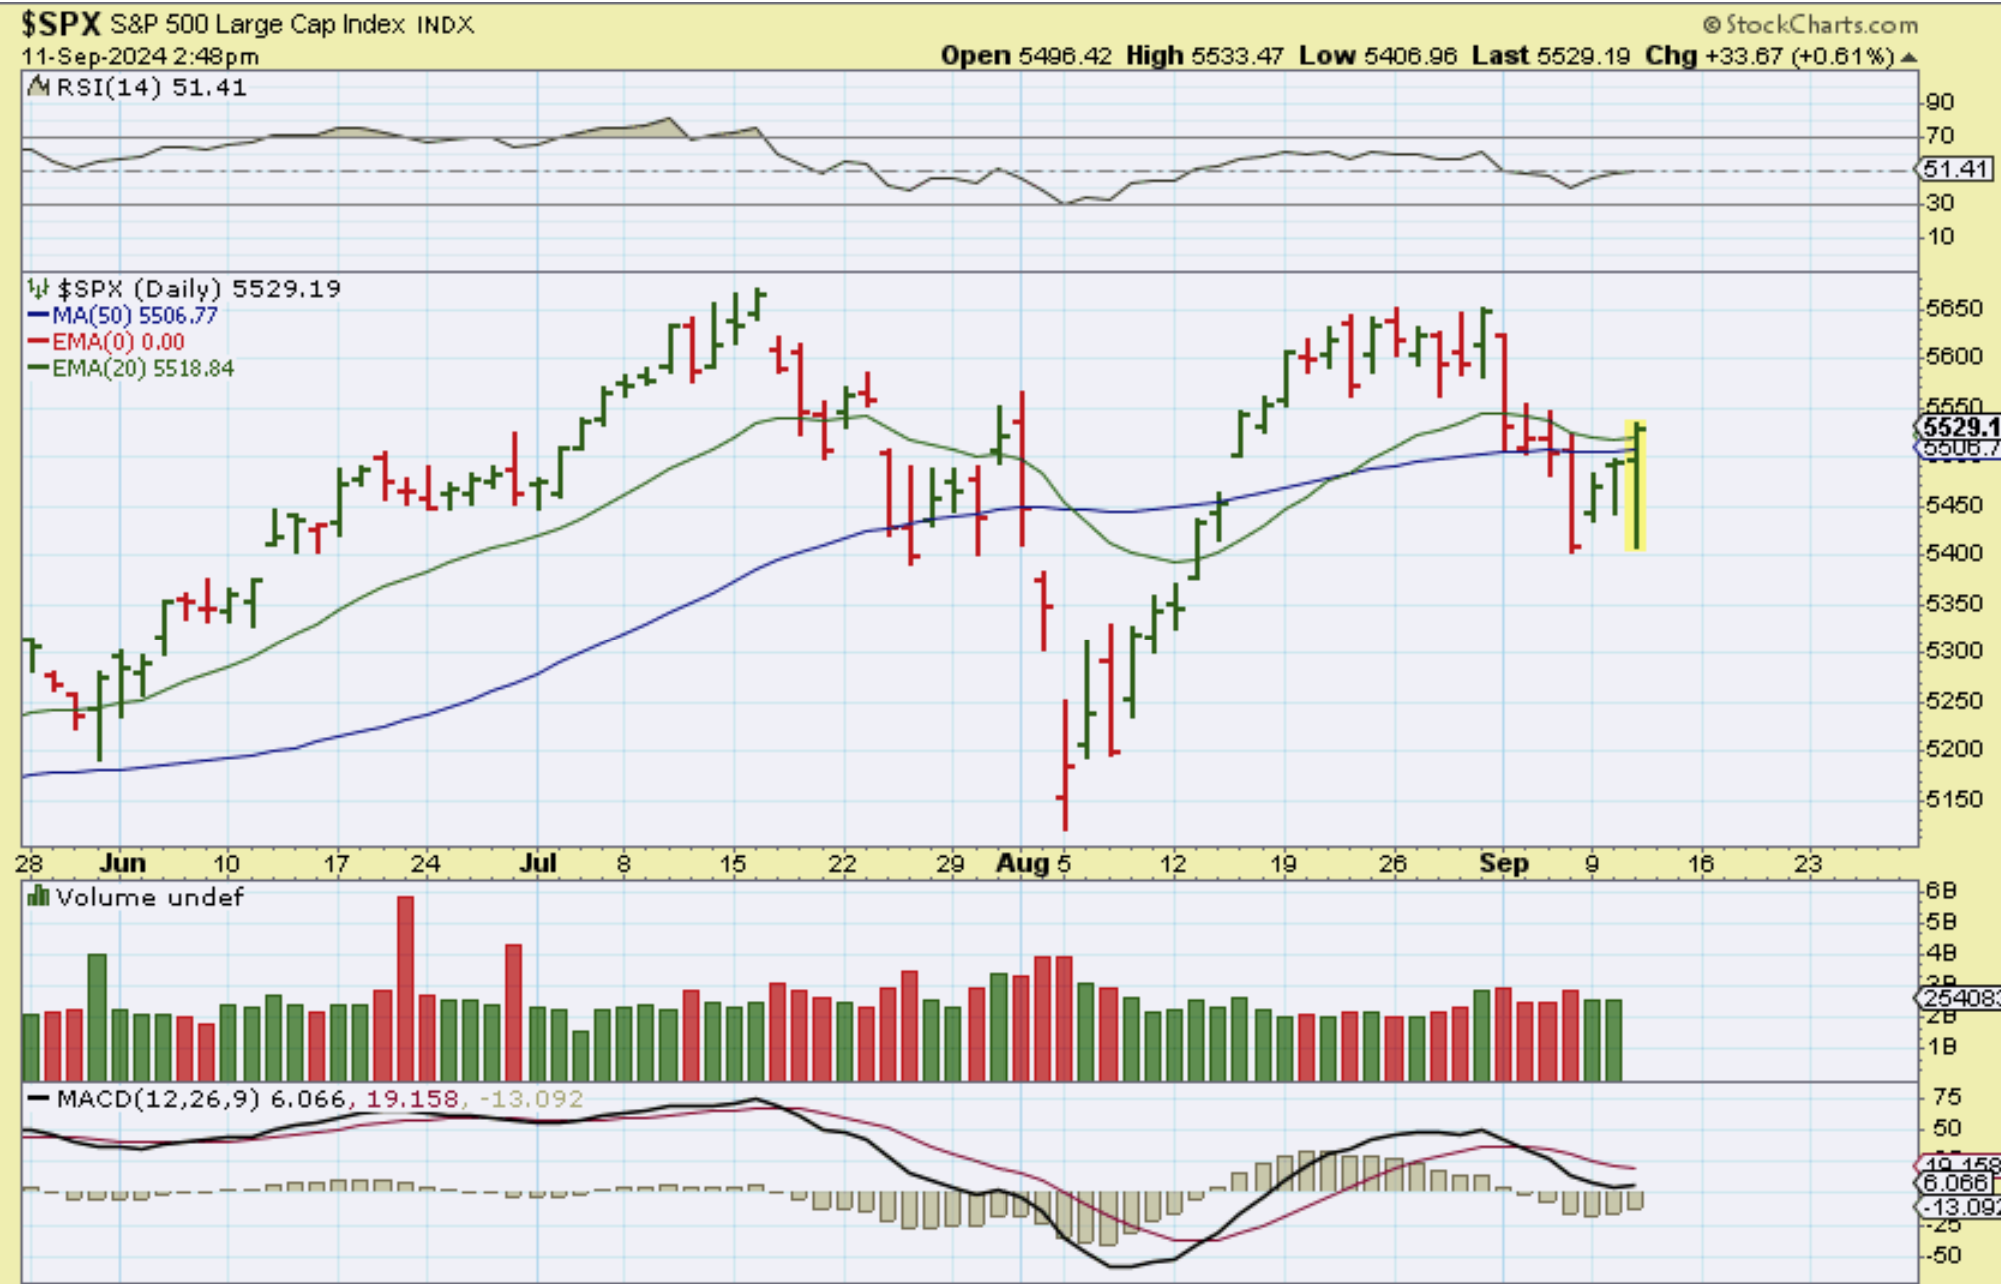
SPX – Again, just looking at this chart with that strong reversal, it looks bullish.
.
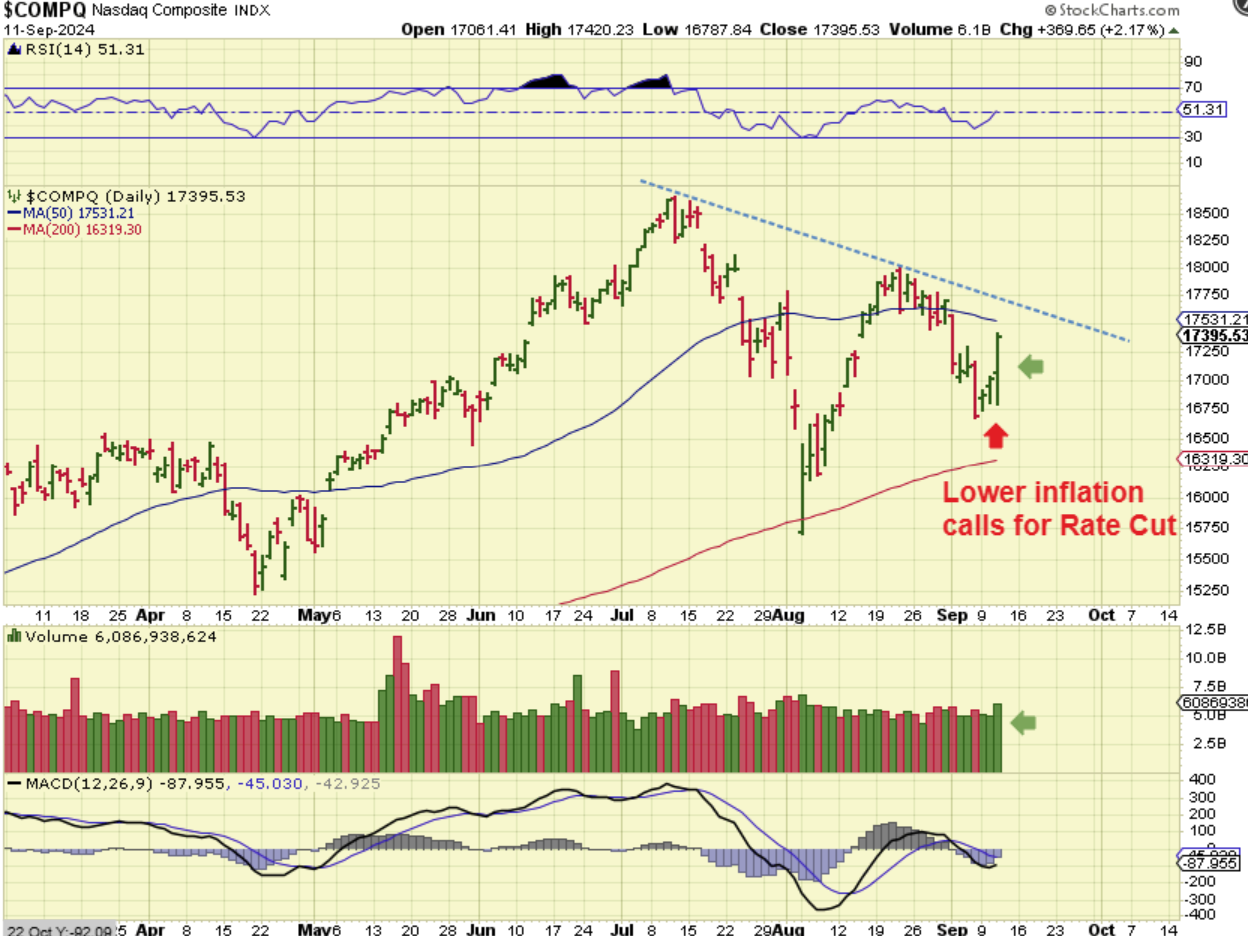
THE NASDAQ has the same bullish reversal, at this point. This FAST sharp reversal looks much like the one we saw in early August, right? It just seems too early for a dcl, but you could buy with a stop if the jobless claims report doesn’t cause it to break down pre-market. IT seems that the markets are trading choppy, based solely on the Fed Rate Cut. Yesterdays data has some thinking he will cut .50 and not just .25.
.
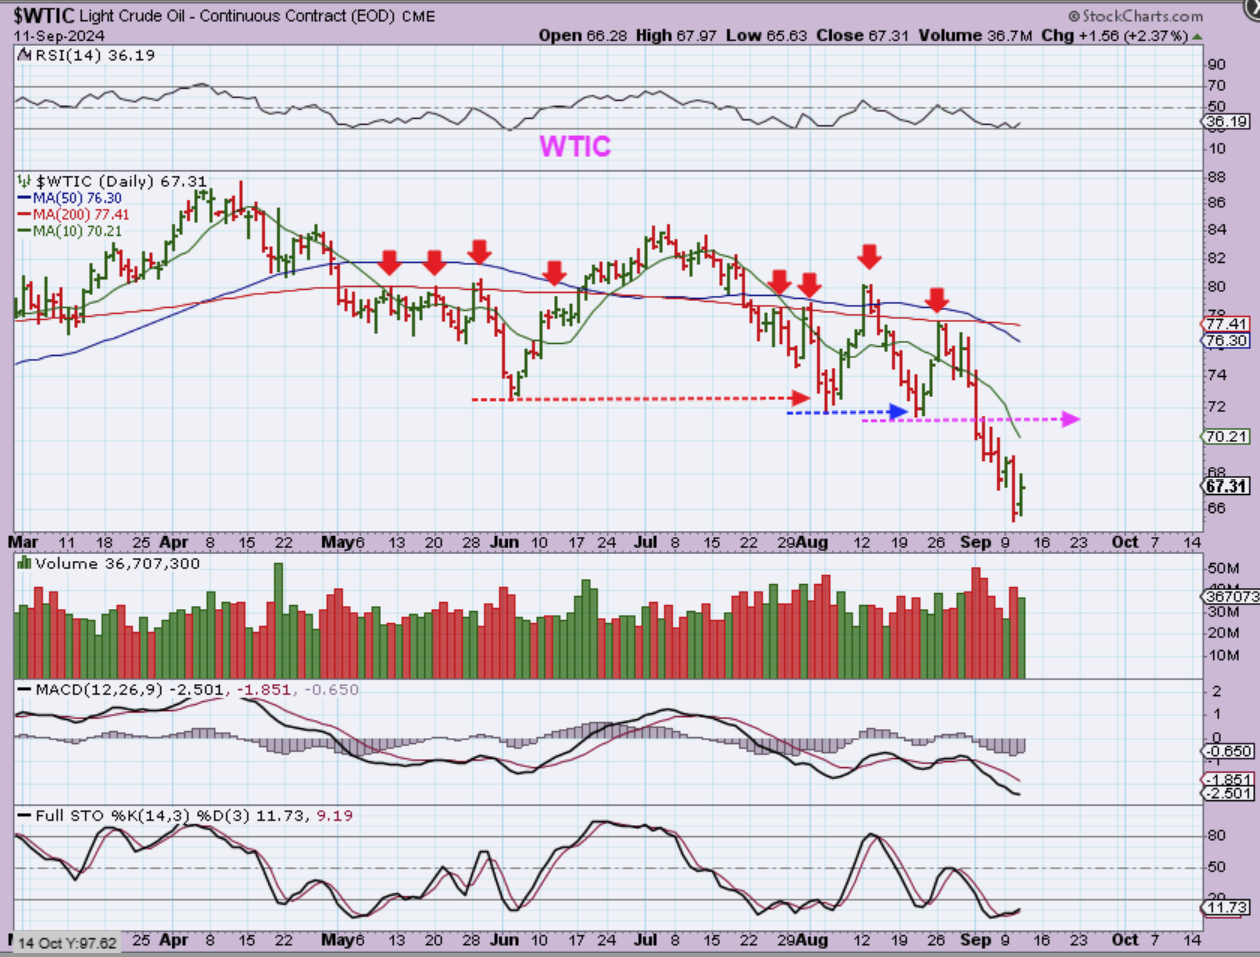
WTIC – Oil may bounce, but it is not quite due for a dcl, so I expect more downside.
.
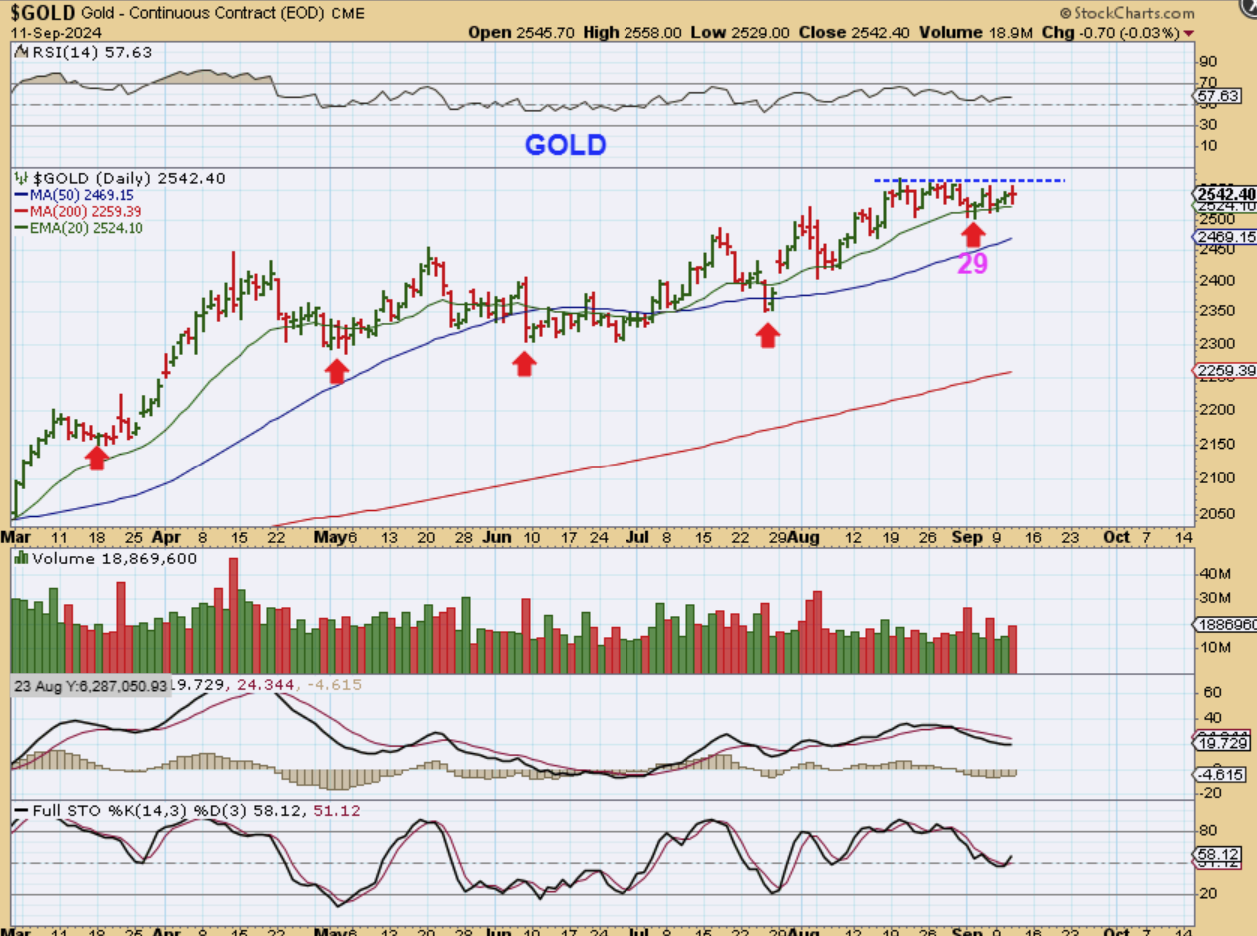
GOLD did not react to the Inflation Data very much, but some Miners did turn bullish and ran higher.
.
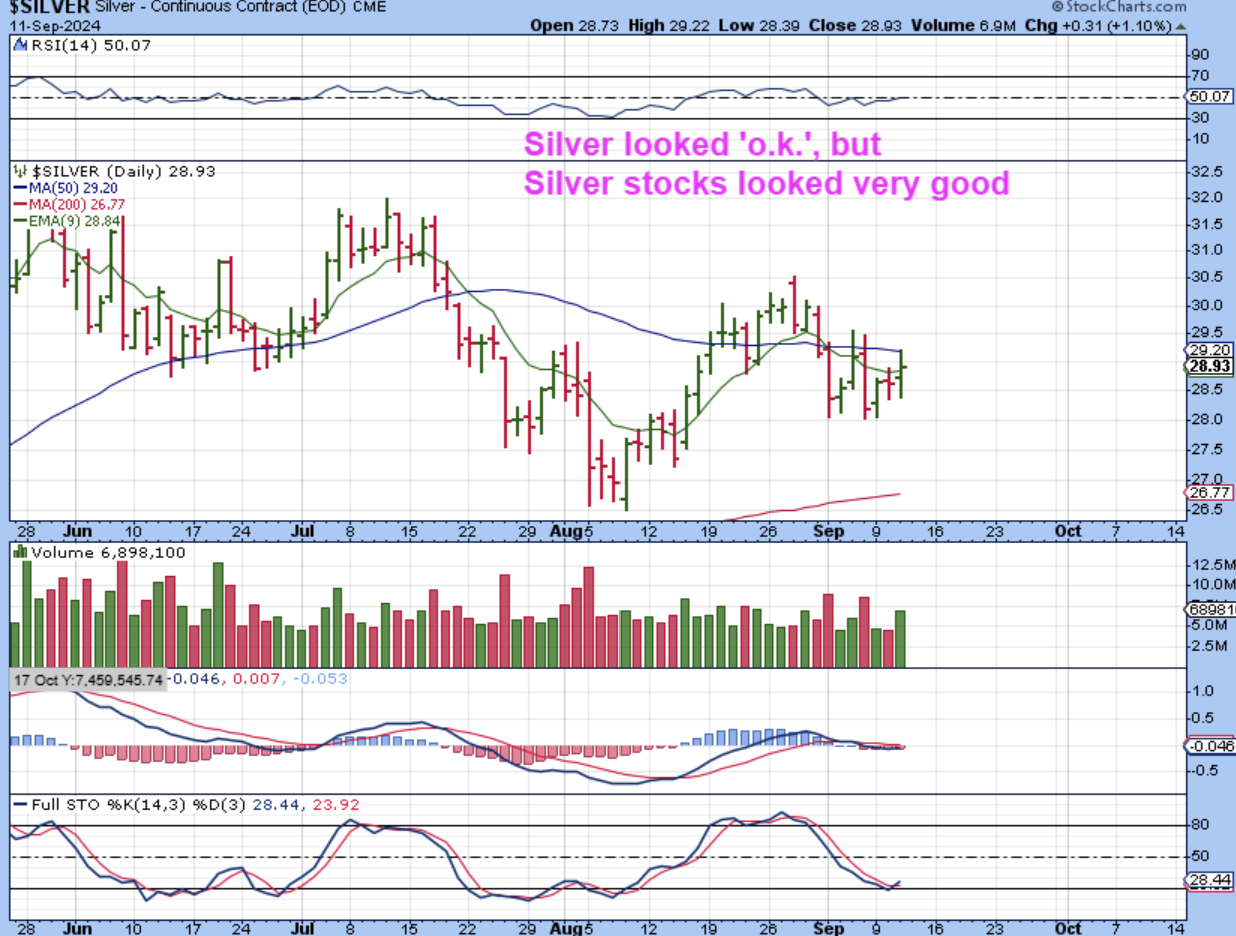
SILVER popped and stopped at the 50sma, but several Silver Stocks looked rather nice actually. For example…
.
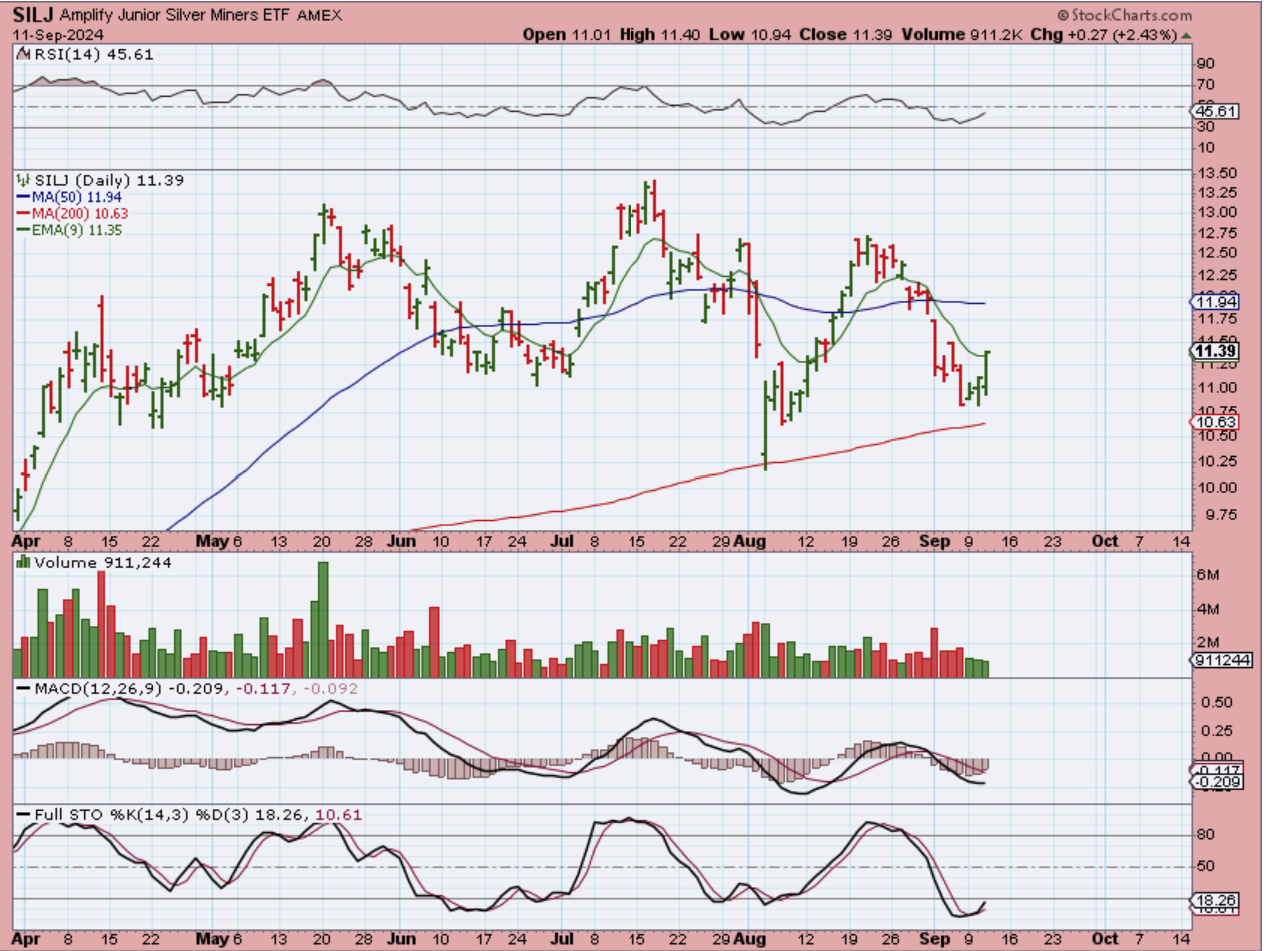
Take a look at the SILJ ETF for example. That was a nice move compared to Silvers move. SILJ is oversold too.
.
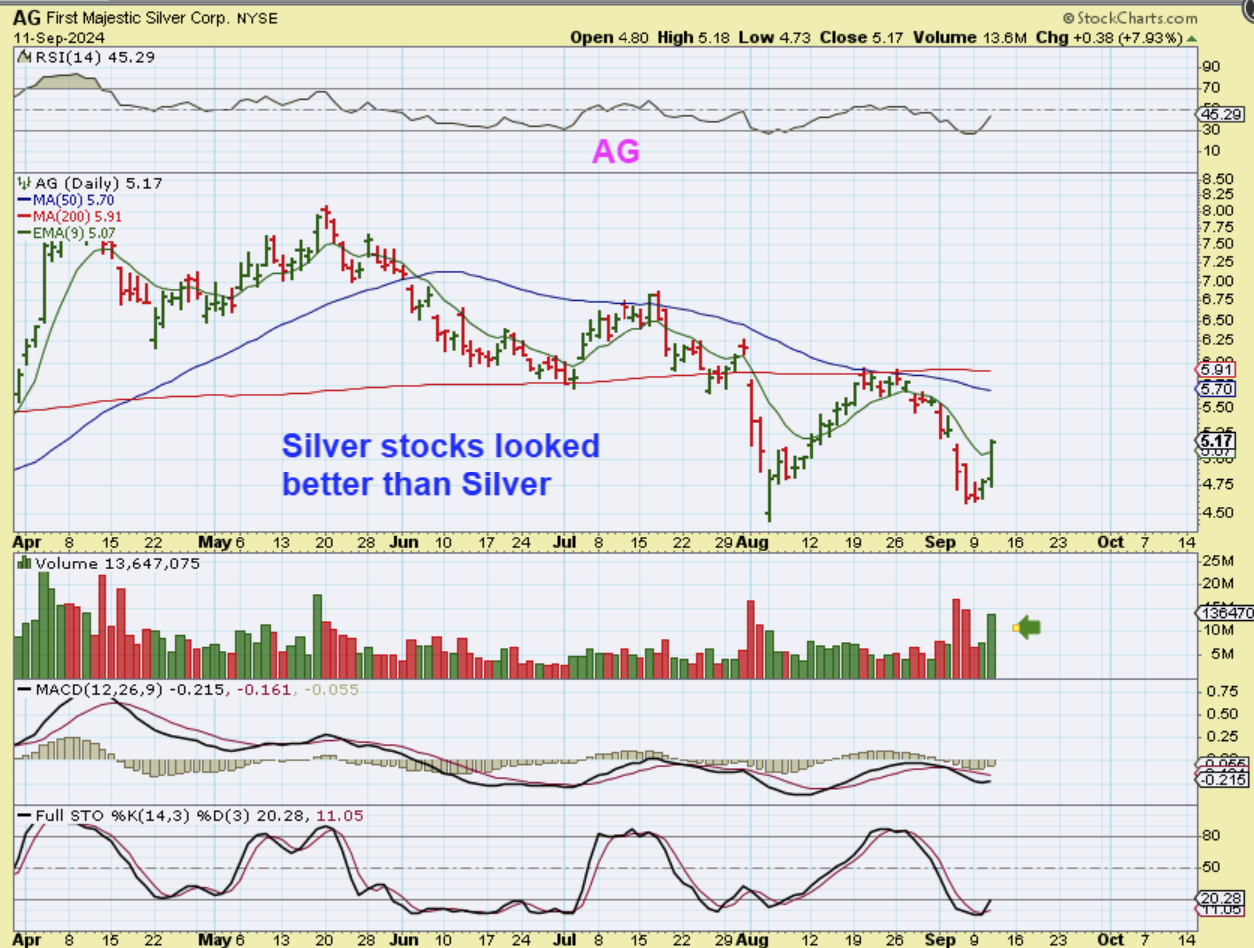
AG was oversold and it popped up almost 8% with the rate cut hopes. GATO ran higher too (AG bought GATO).
.
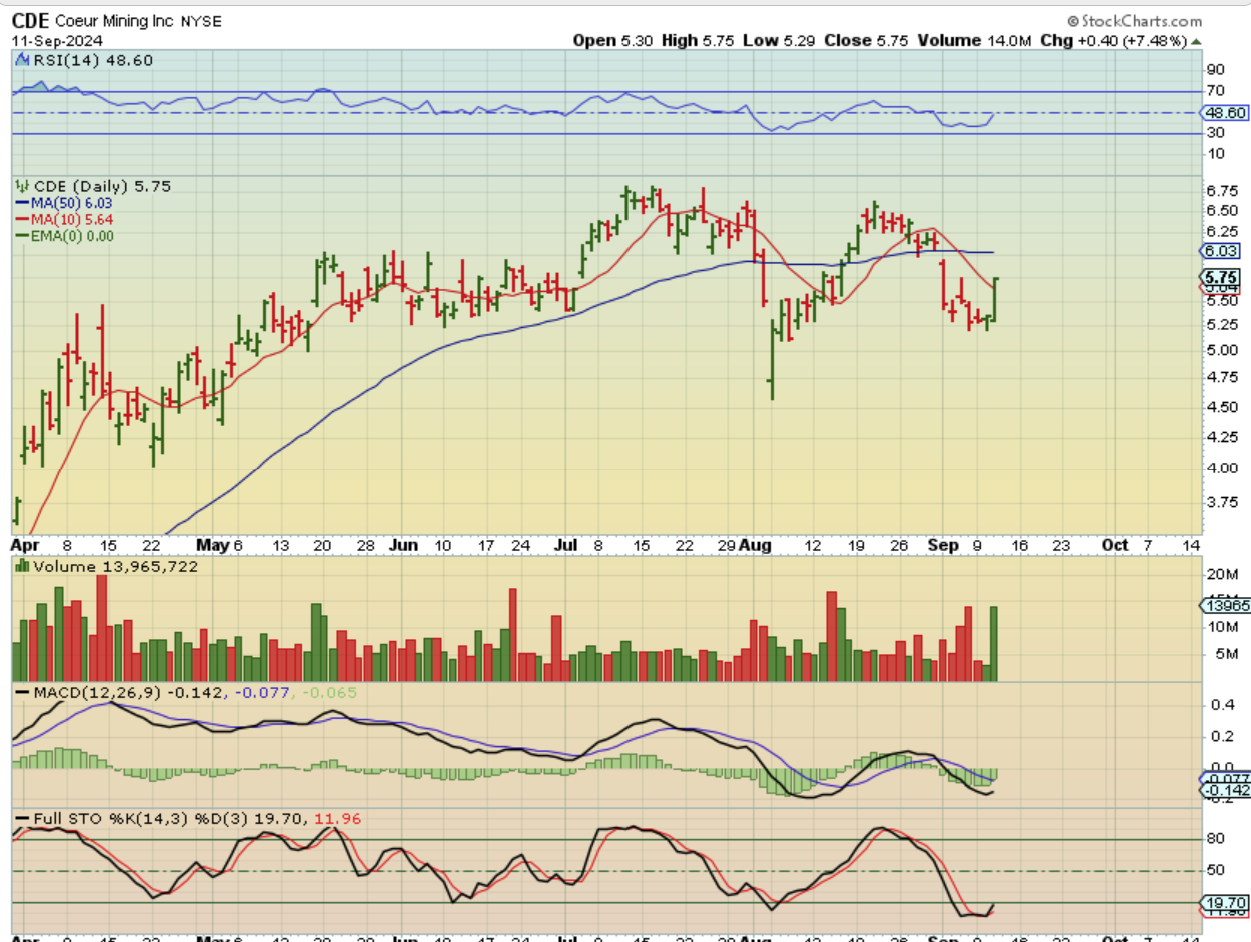
CDE is oversold and also popped about 7.5%, so the silver stocks started to react nicely, even though the metals themselves only moved up a little bit. Maybe Miners are going to lead this sector higher?
.
When it comes to the Miners, I said in Wednesdays report:
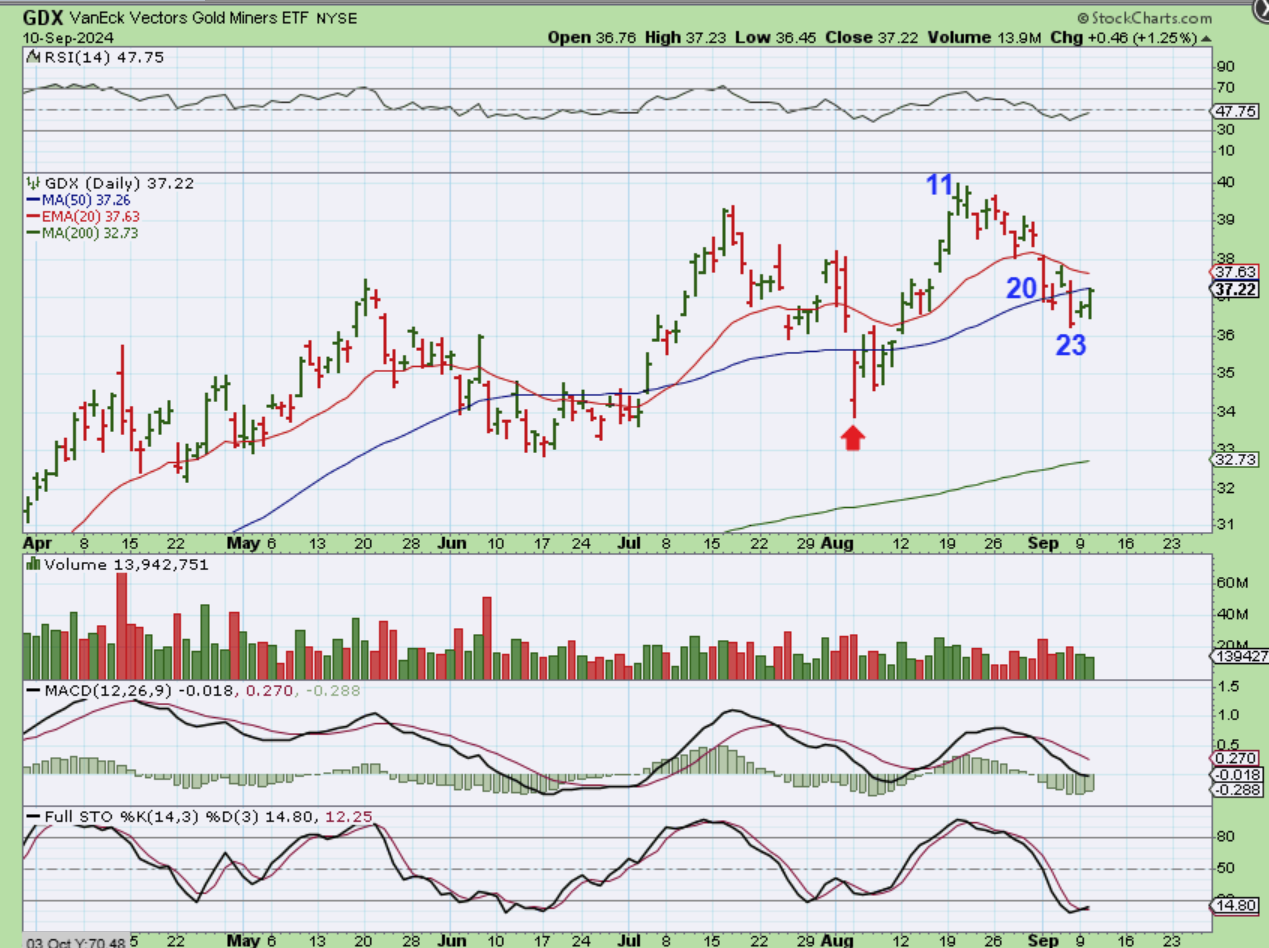
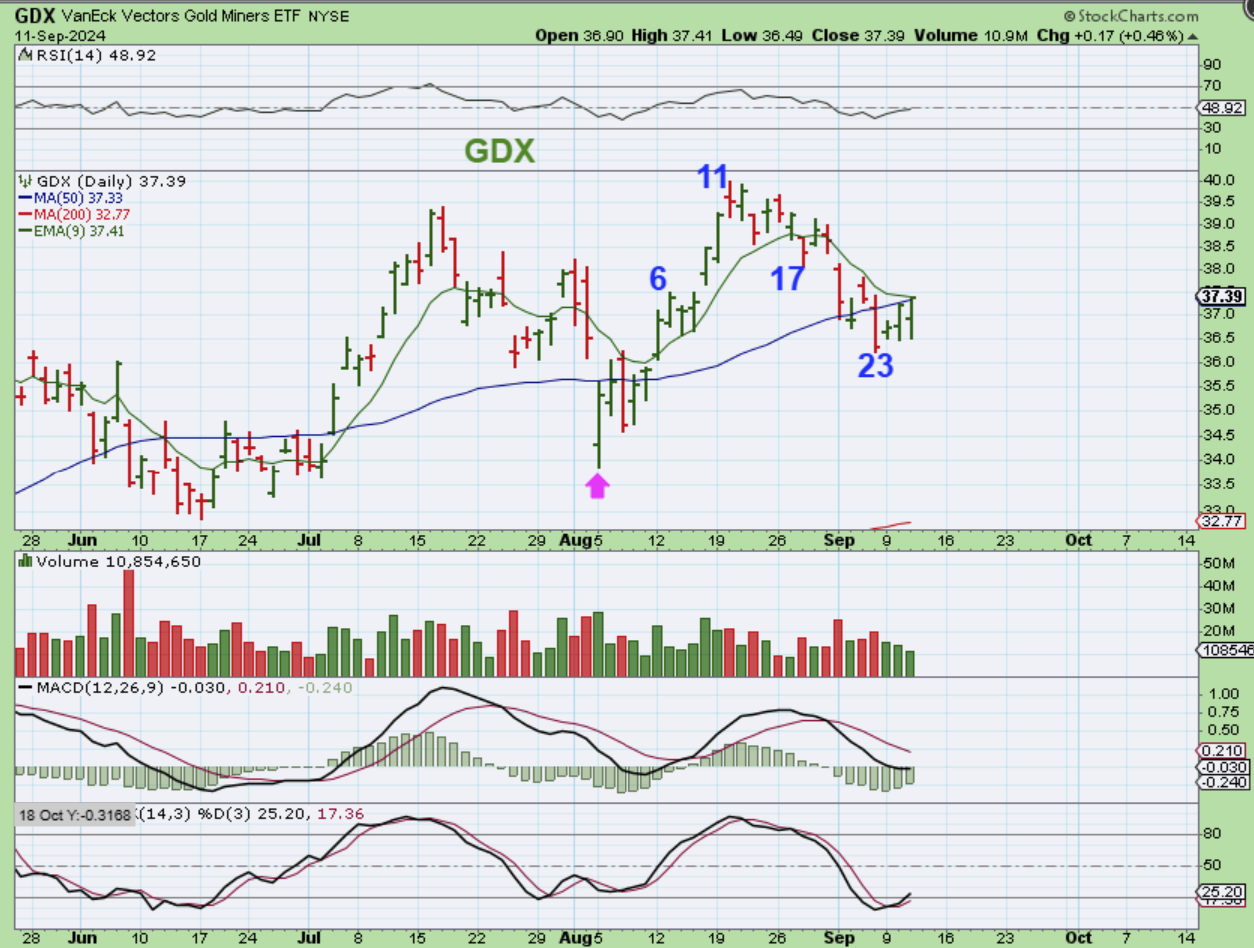
THE GDX seemed to follow the General Markets again and is now pushing on the 50sma. Notice a dat 23 low, tht seems too early for a dcl…
.
GDX dropped with the markets and then also rallied higher. This looked pretty nice by the close, but it closed at resistance, so we’ll see if it can push through tomorrow. A day 23 low seems early for a dcl, but it can rally higher and put in a dcl above the 50sma as a back test too.
.
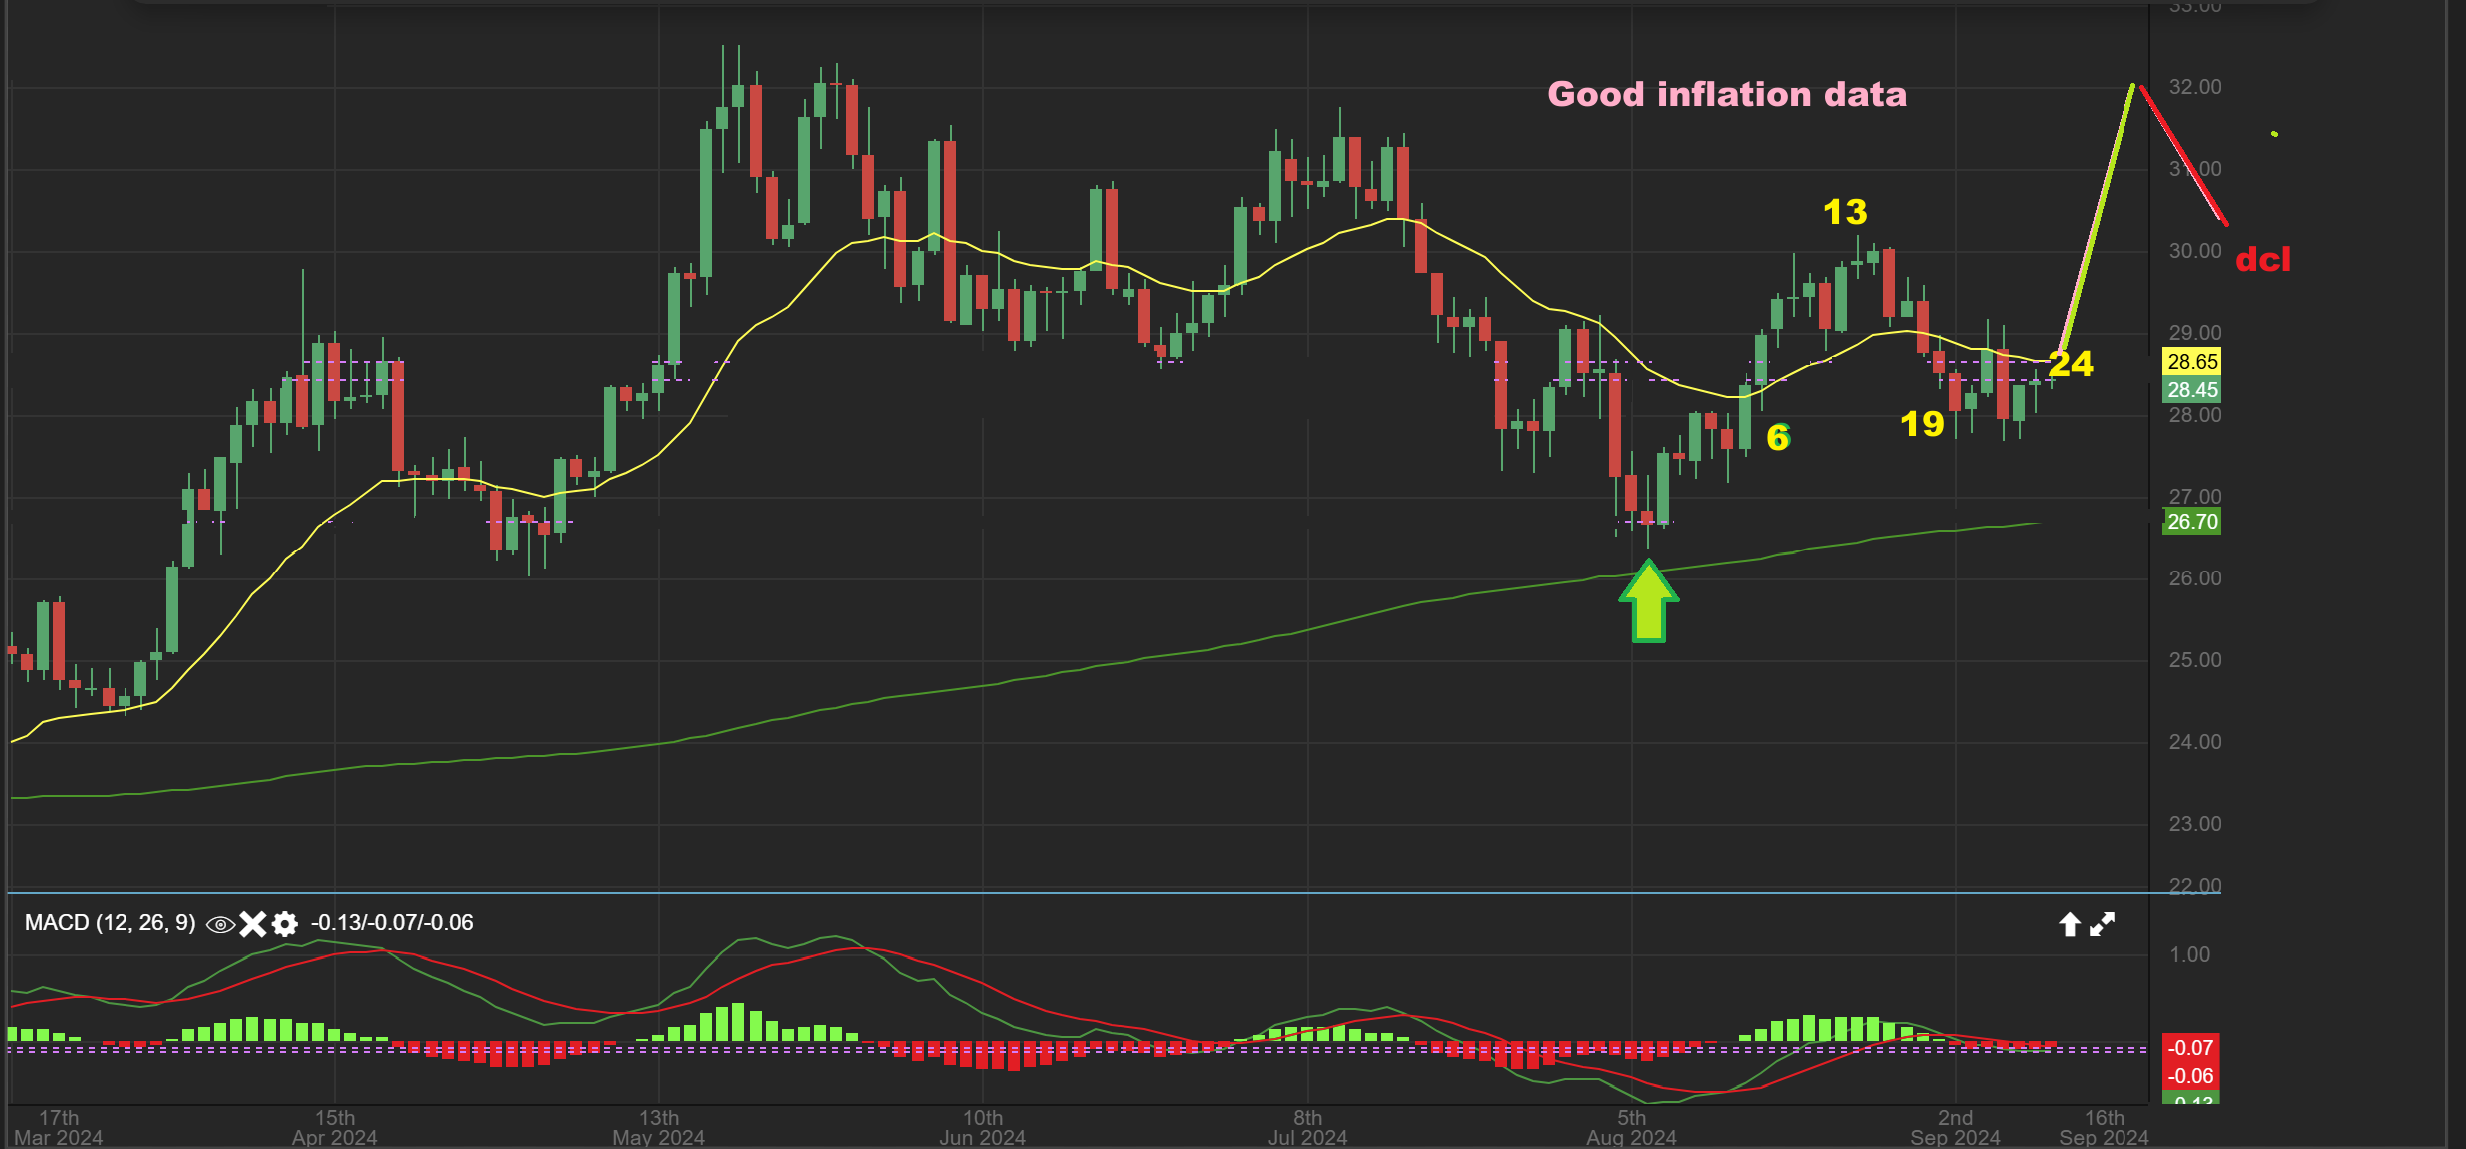
It seems like a lot of the Market price action is being triggered by the hopes of an interest rate cut by the Fed. I have been expecting the selling to resume, but yesterdays data seems to have caused some to feel that we will now see a .50 cut instead of a .25. All I can say is that if we see .25, that may be when the selling returns and this is a half cycle low, as mentioned in the past few reports. This reversal can also cause Miners to run higher, and that was pointed out with this Silver chart a couple of days ago. I said:
SILVER – If the inflation data is viewed as bullish, Silver could still run higher and then drop into a dcl. It is on day 24
.
So, let’s see what todays data does to the markets with Jobless Claims AND PPI. Unfortunately, we feel like we need to Buckle up, because it has been a VERY choppy ride lately. I am in front of the screen and use intraday charts, so it makes it easier to re-set if needed, but jumping in and out can be costly for those unable to use intraday charts, so what now? Under these conditions, One would wait for the dcl, or maybe you did wait and you are long at the last dcl or half cycle low in place and using a stop. That works too. This volatility WILL PASS, but most likely it will be after the Fed Mtg next week. We may get a dcl in the General Markets and in Gold and Silver, with the current timing. Right now the data is encouraging volatility as people guess and discus what size rate cut we will see with every new number. I hope that you can enjoy your Thursday trading, I will cover crypto below.
..
~ALEX
.
FROM YESTERDAYS REPORT:
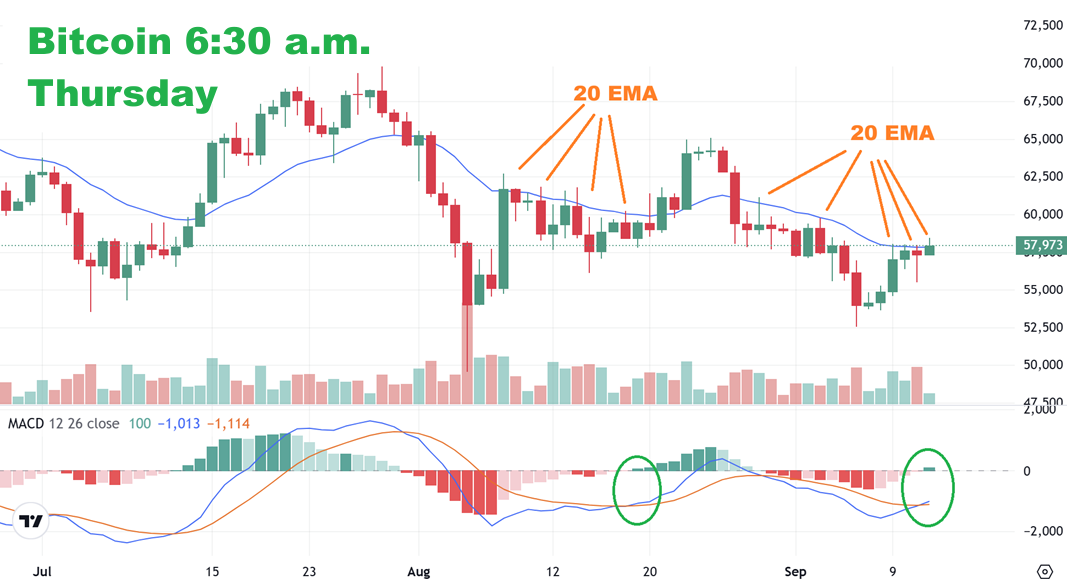
BITCOIN stopped right at that 20 ema on day 5, and now we wait for a breakout. You can see how long it took to be able to close above that 20 ema after the last low was in place. I’m hoping for a quicker break this time, and maybe the Markets moving with the inflation data and anticipation of that rate cut can push it through today.
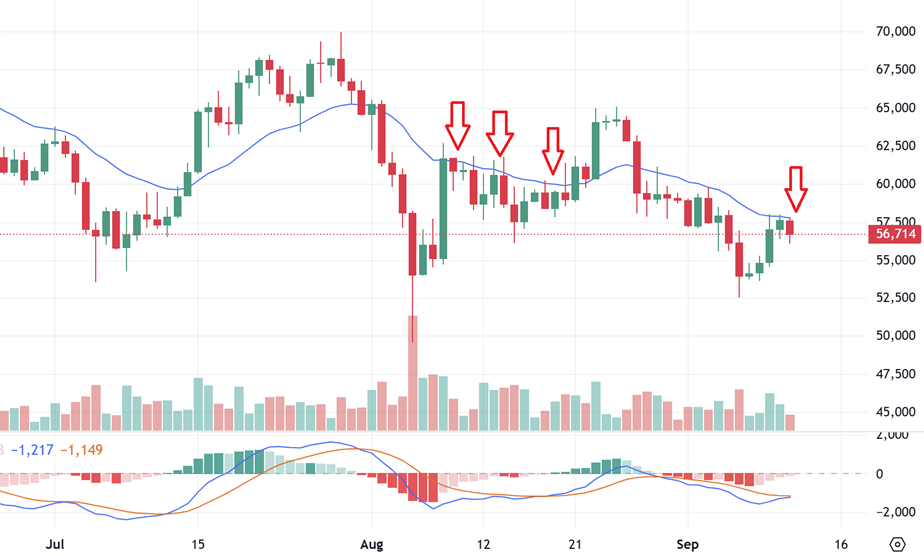
.
BITCOIN is still trying to break and hold above that 20 ema this morning. This should be day 6 with the rare chance that that slam down capitulation low near day 31 re-started the count as an ICL and in that case we’d be on day 30+. Either way, this still has plenty of time left before another low comes due, and it should run higher.