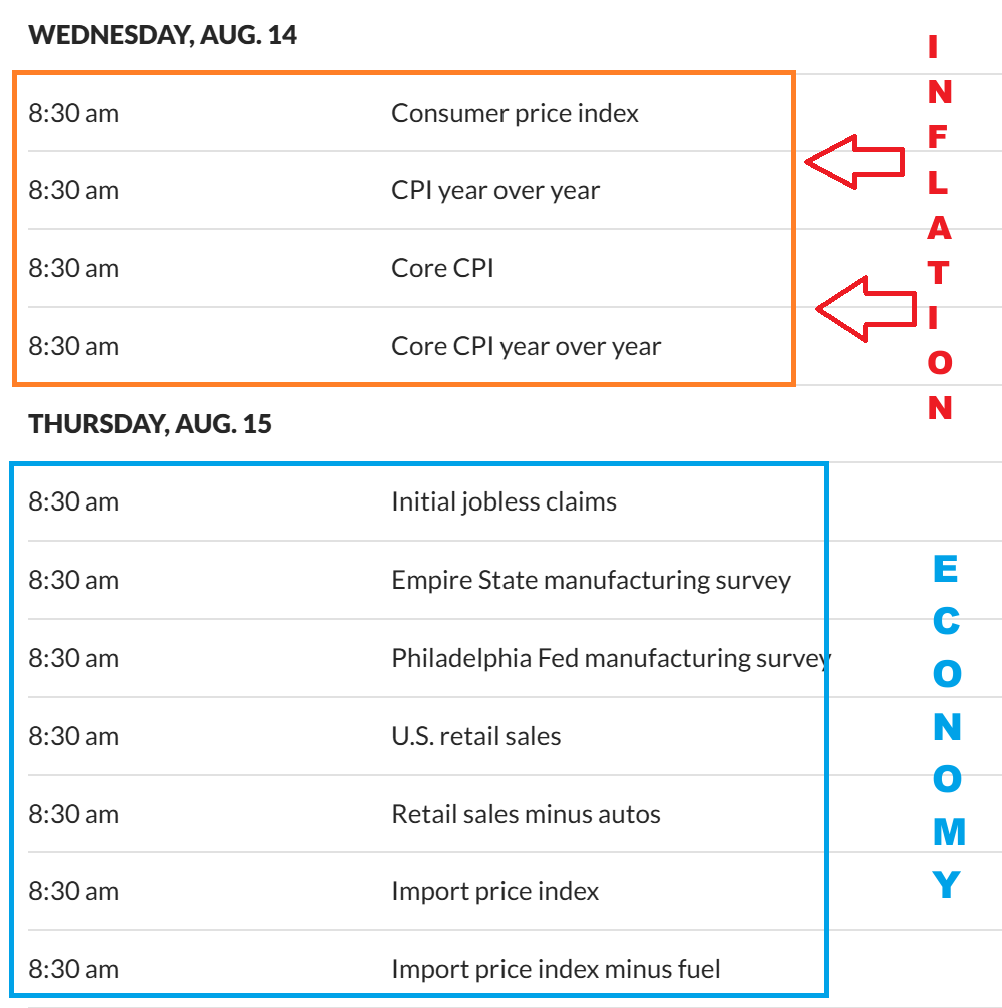
Wednesday August 14th
DATA: The PPI Numbers came in milder than expected, meaning that inflation is dropping and a rate cut is needed to slow things down. That was bullish for the markets and Gold. Today is the CPI Numbers and low numbers there could continue the party out of the lows, high numbers could cause some selling. That said, Thursday will also be a hurdle. Remember that we rallied after the Fed Mtg Wednesday into the close, and the charts looked great–and then sold off Thursday and Friday with economic concerns. Let’s go to the charts and discuss the set up…
.
NASDAQ – This now looks like day 6 out of a dcl. I know this move looks strong, since it can be partially short covering, but do we have an early ICL? No, I do NOT think so, even with this rally and I’ll show you why later in this report. A move from an ICL in late APRIL to now just seems much too short for any normal Intermediate Cycle to have put in another ICL. So if that is true, this will need to roll over again to eventually seek out the next ICL. Right now, it has been a strong bounce off of the 200sma.
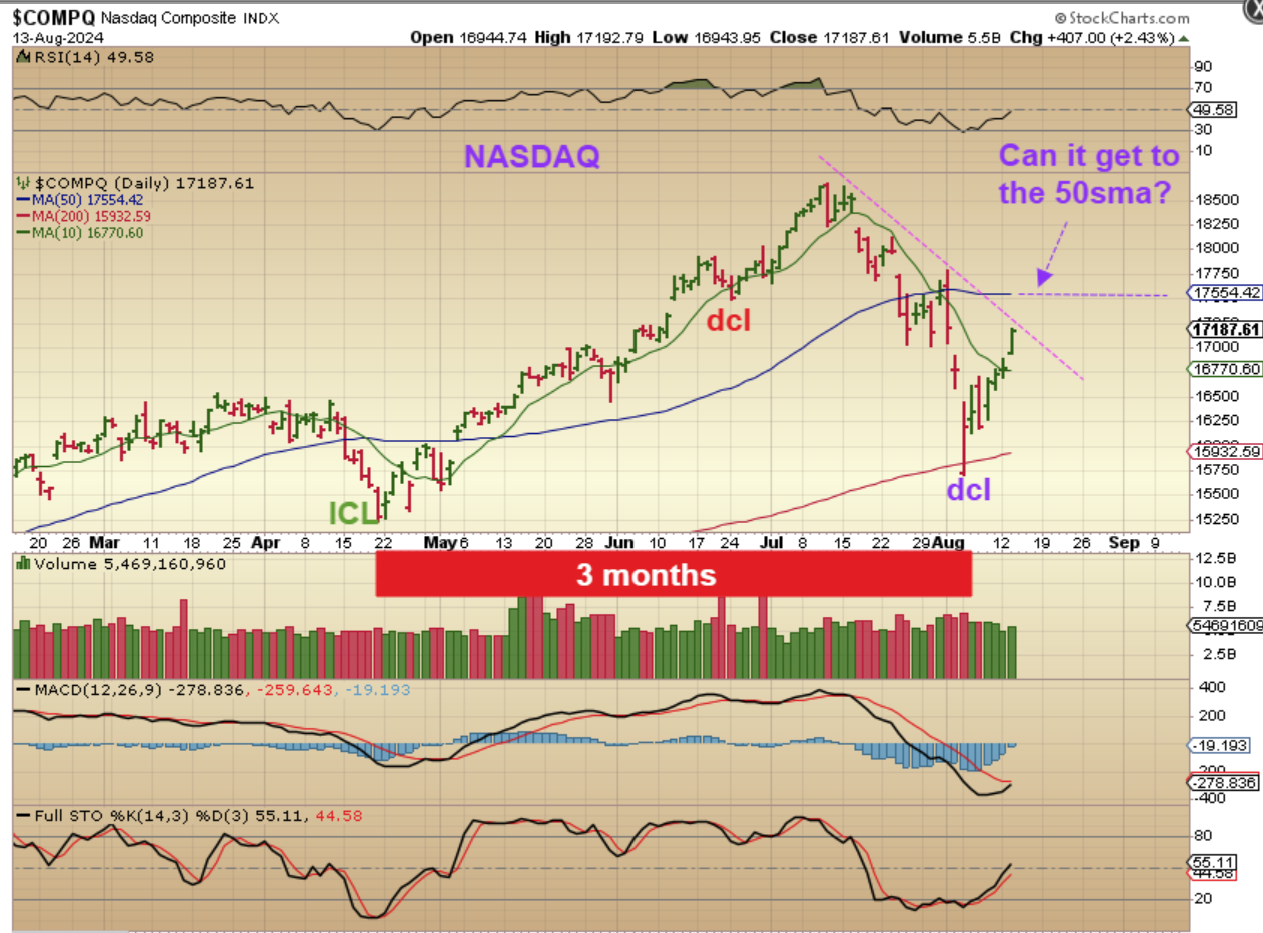
.
If this was somehow an A-B-C Down into an ICL, this would absolutely be the shortest Intermediate Cycle that I have even seen. I have gone long with some day trades using SOXL, but I don’t hold them overnight because I do expect the selling to resume, and when it started on that Thursday after the Fed, it gave us 3 very sharp down days.
.
THE SPX already reached the 50sma on day 6. Again, I see an A-B-C formation in the sell off, but it is hard to believe that we had that sharp of a drop and then it is all done. I have to expect more selling, maybe with the Jobs report showing weakness in the economy. Next let me show you something important.
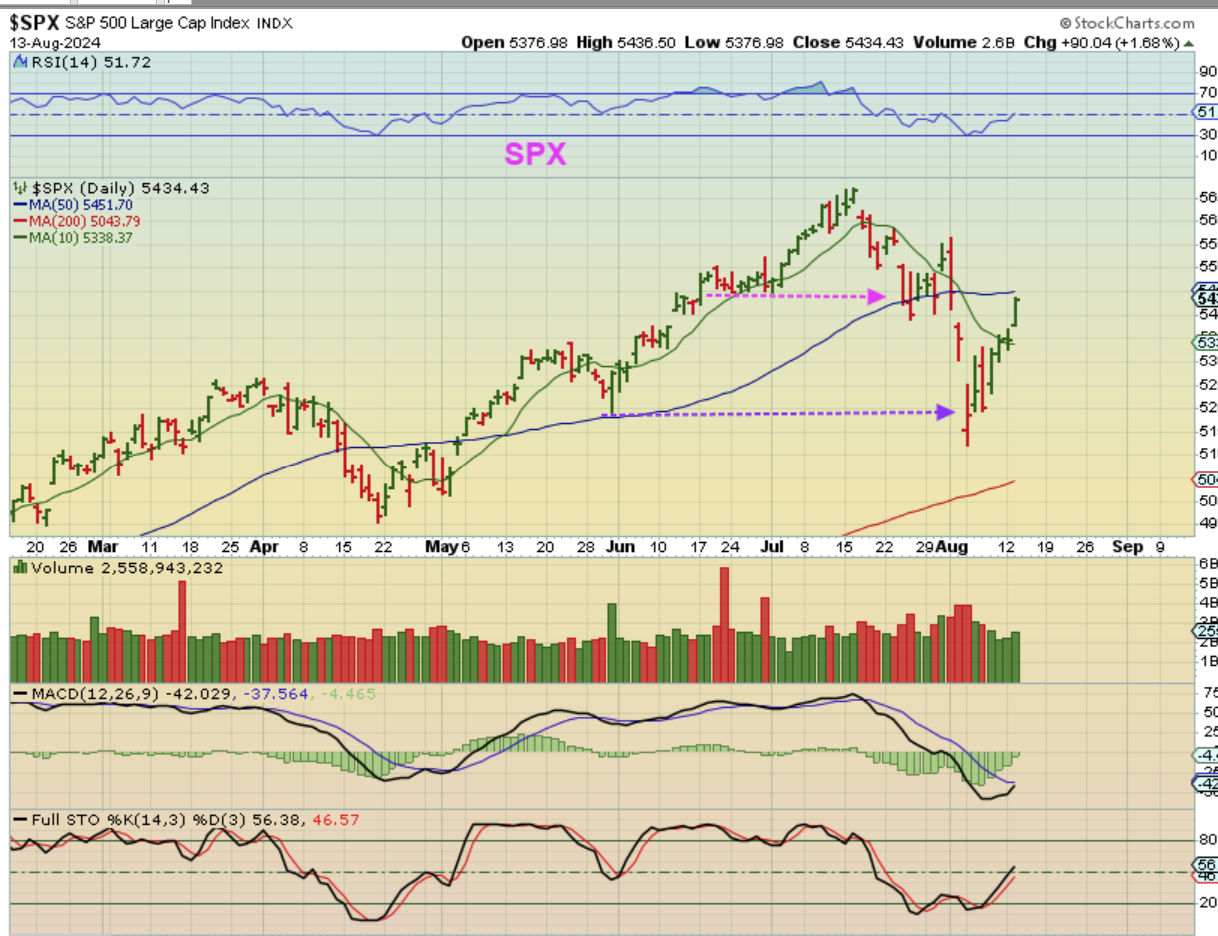
.
IMPORTANT CHART:
.
NASDAQ 2021-2022 – This chart is important, because in it I found a few steep sell offs that bounced back convincingly just like we are seeing now–but then sold off again. Let’s focus on 2 of those time periods.
1. The a-b-c drop was sharp. The rally out of ‘c’ was decent for about 12 days, but then it rolled over.
2. Look where I wrote ‘strong bounce‘. That rally was 11 days straight up, just like we are seeing now. After that tag of the 200sma area though, it sold off for 2 months.
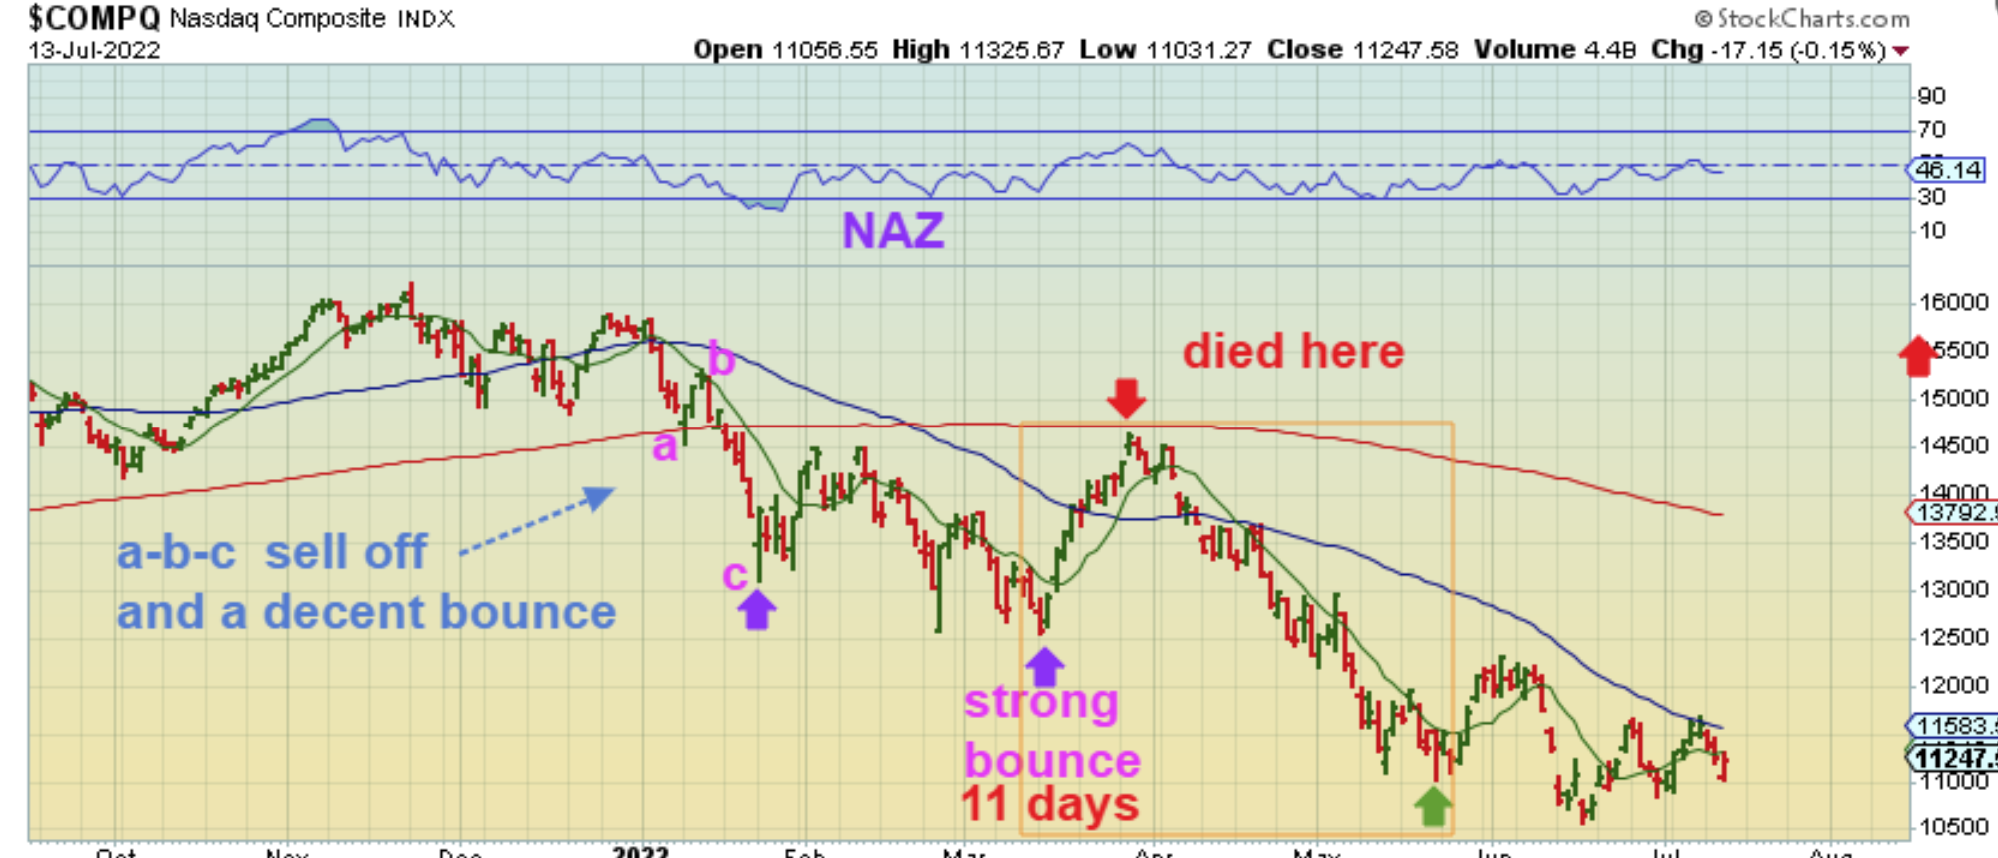
.
So right now we are having a pretty convincing rally, and in the past they’ve lasted as long as 12 days, but the selling did return. Recently we had the Fed Mtg and a rally that followed on that Wednesday. The charts looked very bullish, and then suddenly Thursday, Friday, and Monday gave us very sharp drops in crash-mode. Daily cycles failed and we are only about 3 months ahead of the last ICL, so I have to expect at least 1 or 2 more daily cycles lower. I expect that the current rally that are seeing now will become Left translated. I have played a long trade here and there using SOXL, but I have not been holding it overnight and I expect the selling to return, so if you are long, USE STOPS.
.
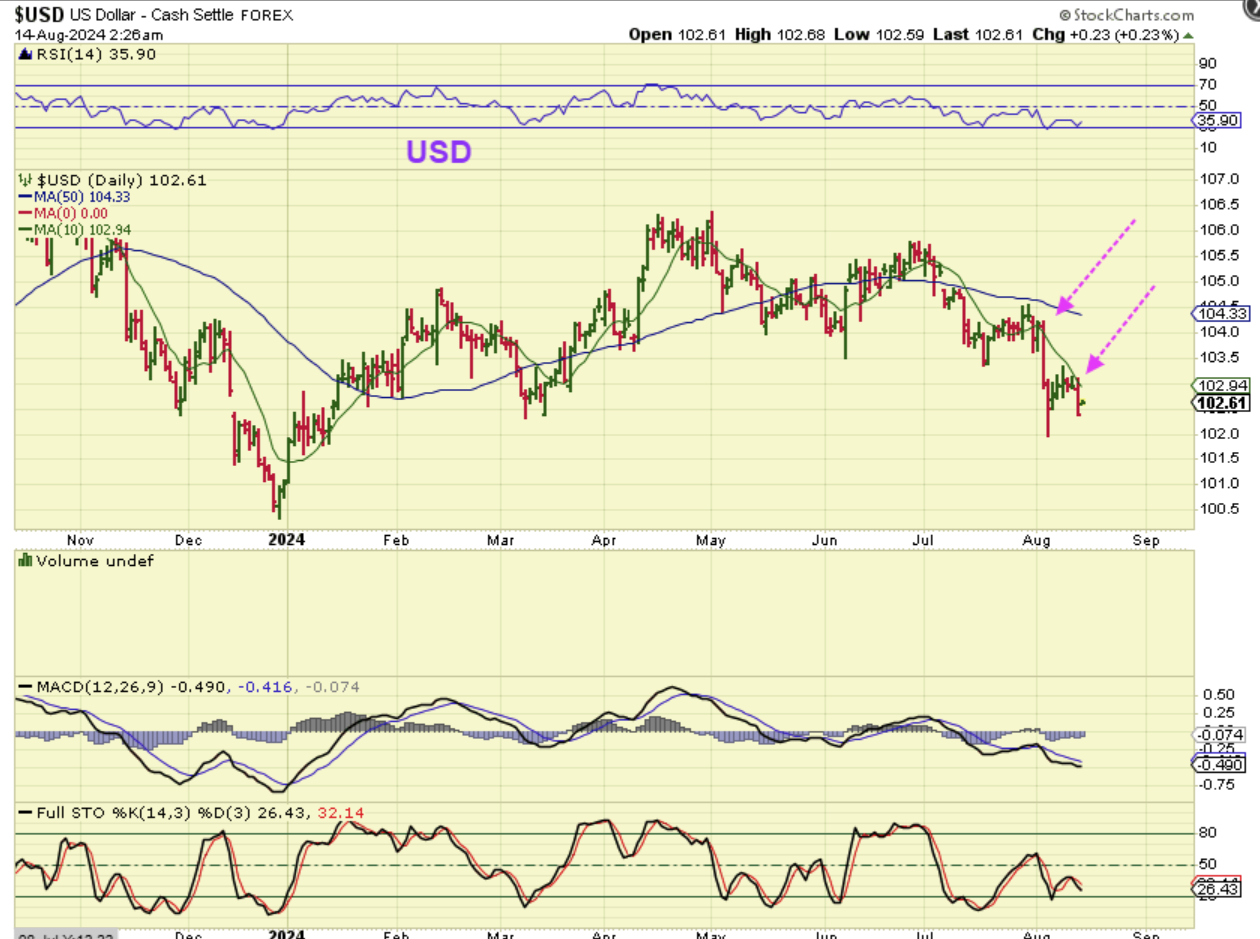
THE USD dropped straight down with that PPI Data and the likelihood of a rate cut. I have been expecting the weakness in the USD, but I did think that it would push Gold higher too.
.
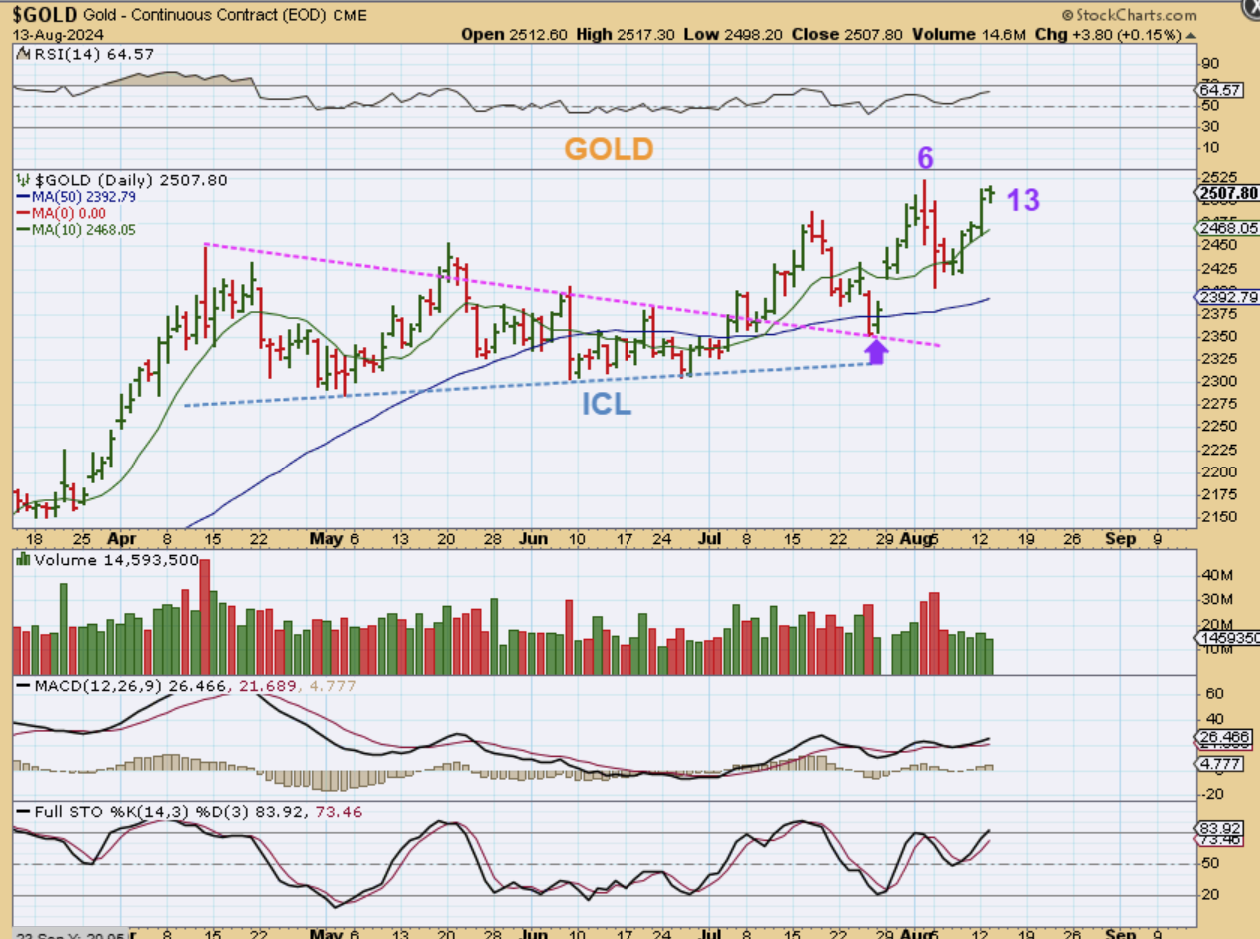
GOLD had a nice move on Monday, but Tuesday was actually a little muted and that was where I was hoping for a new high above day 6 to lead us to a right translated daily cycle. We still have plenty of time for that though and we are close.
.
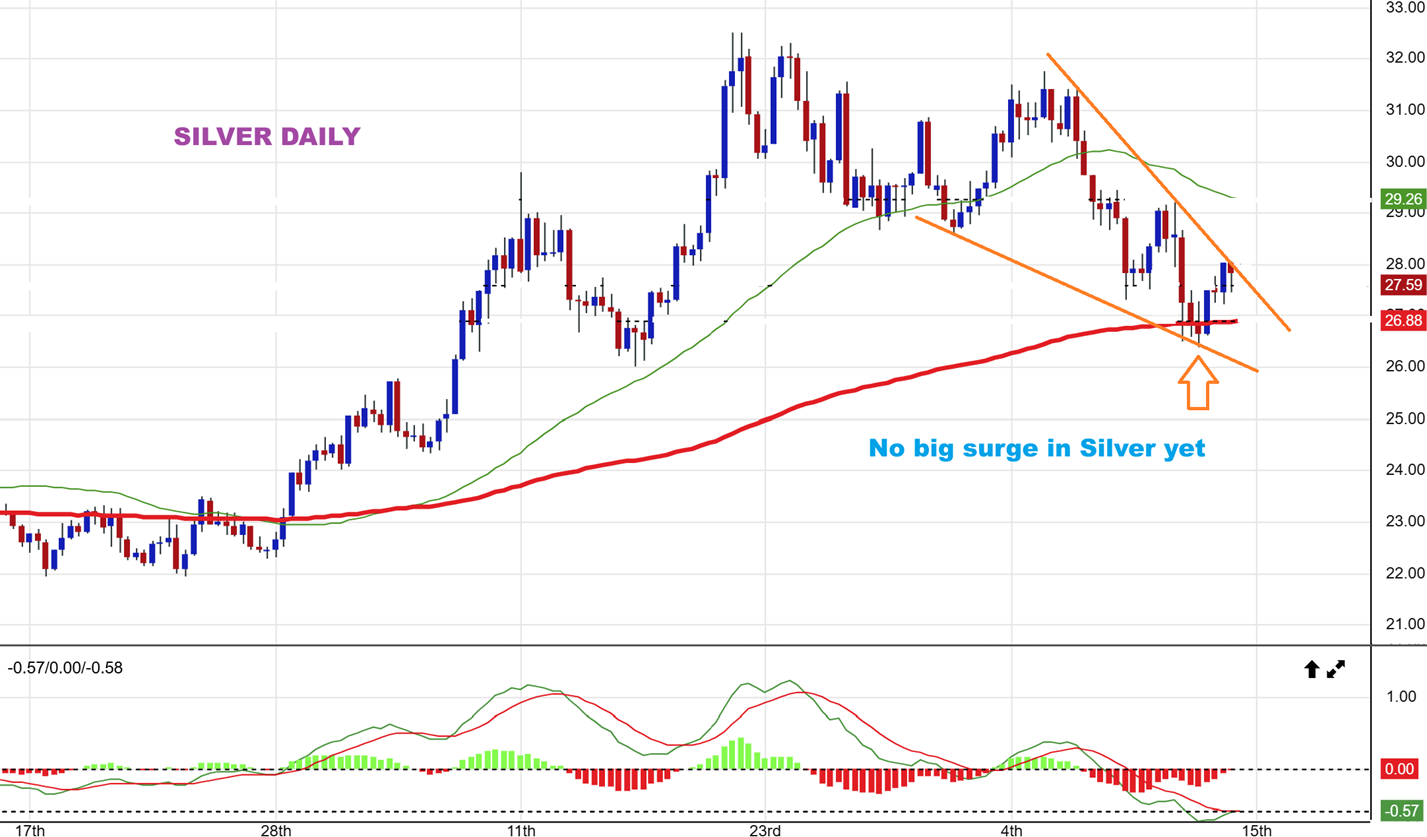
SILVER has not put in one of those large days when price surges higher, but it may do that once it breaks above the downtrend line. This is only day 4 so maybe the CPI Numbers will push the metals higher.
.
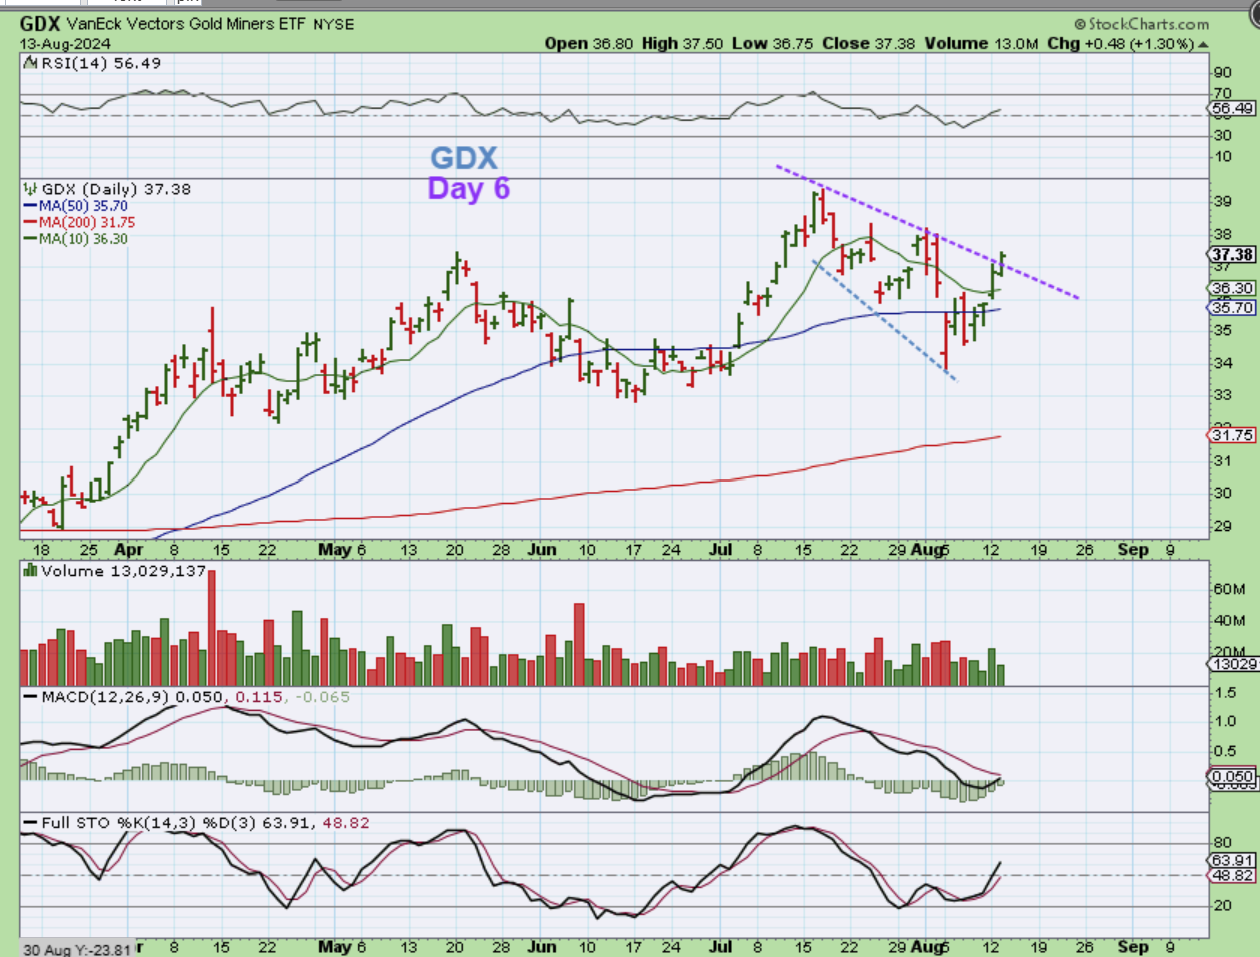
GDX is on day 6 and it is moving nicely out of the lows. I am expecting new highs here too, but you can see that the GDX did get caught in that 2 day sell off. That may be simply because it was weak and due for a dcl.
.
Today is the release of the CPI Numbers, and thankfully that is done at 8:30 a.m., and it gives us a chance to look at the futures and see what the initial reaction is. Enjoy your Wednesday trading!
.
~ALEX
.
YESTERDAYS REPORT STATED THAT WE HAD A POSSIBLE BULL FLAG FORMING:
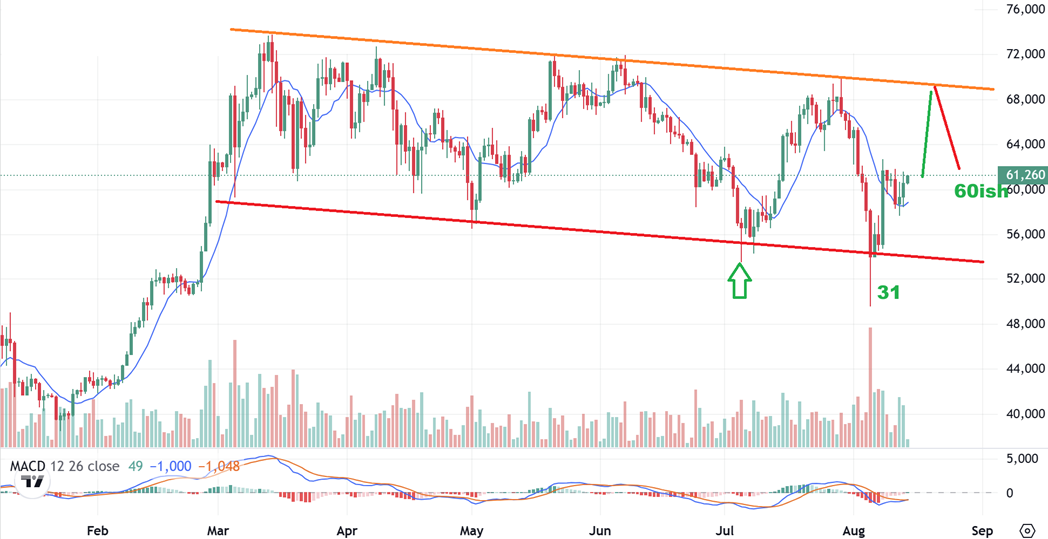
BITCOINs strength going forward is somewhat questionable, because it broke below the ICL. So far we saw a nice surge and a 5 day pause, but it can surge again and make a run toward that $70,000 area.
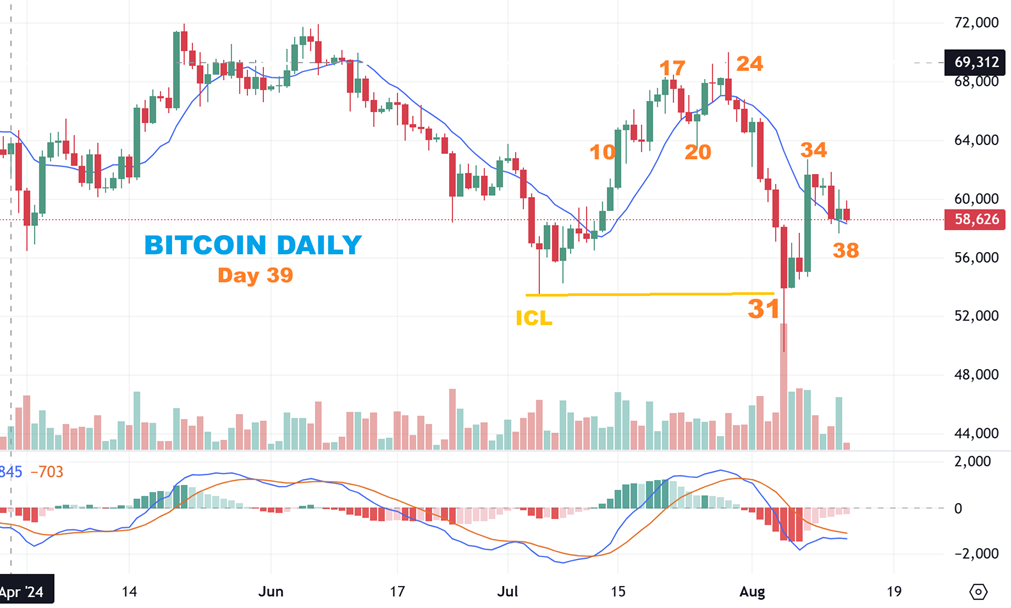
BITCOIN – We are now on day 40 and bitcoin moved higher out of that day 38 low yesterday and overnight.
.
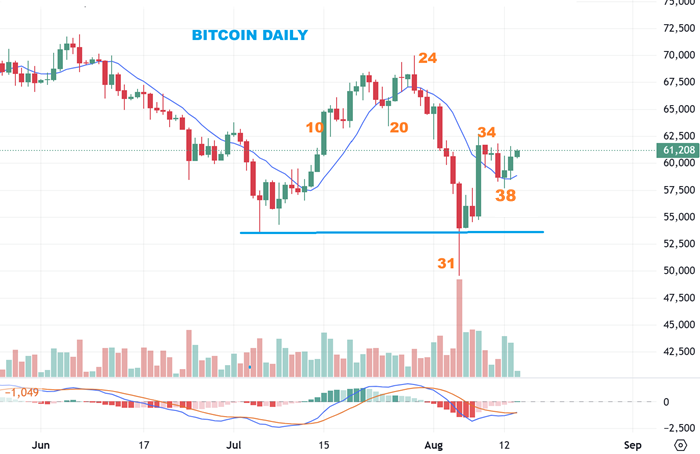
BITCOIN – What I would like to see is a higher low on the next rally and pullback into day 60ish. Then we might be able to finally break out and run from this long consolidation. Maybe then, the Miners would join in on the move higher.