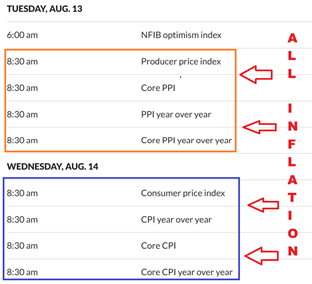
Tuesday August 13th – Inflation Numbers
Here comes the DATA. Today and tomorrow will see inflation and economic data, so it will move the markets one way or the other, and as you would expect…the set-up is currently RIGHT AT THE TIPPING POINT. 🙂
.
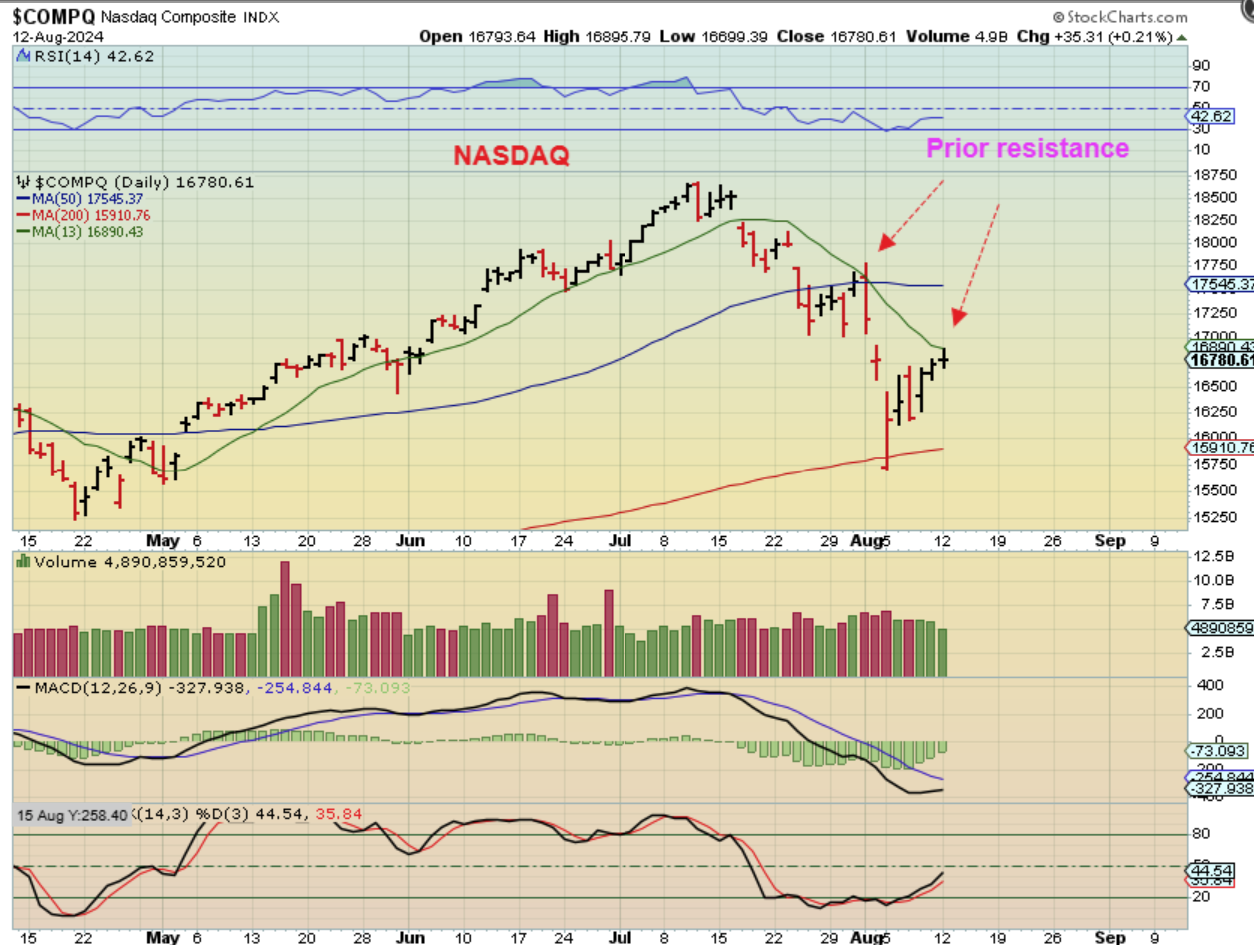
THE NASDAQ is right at resistance, so the data will either push it higher and through resistance, or it will send it down lower as rejected.
.
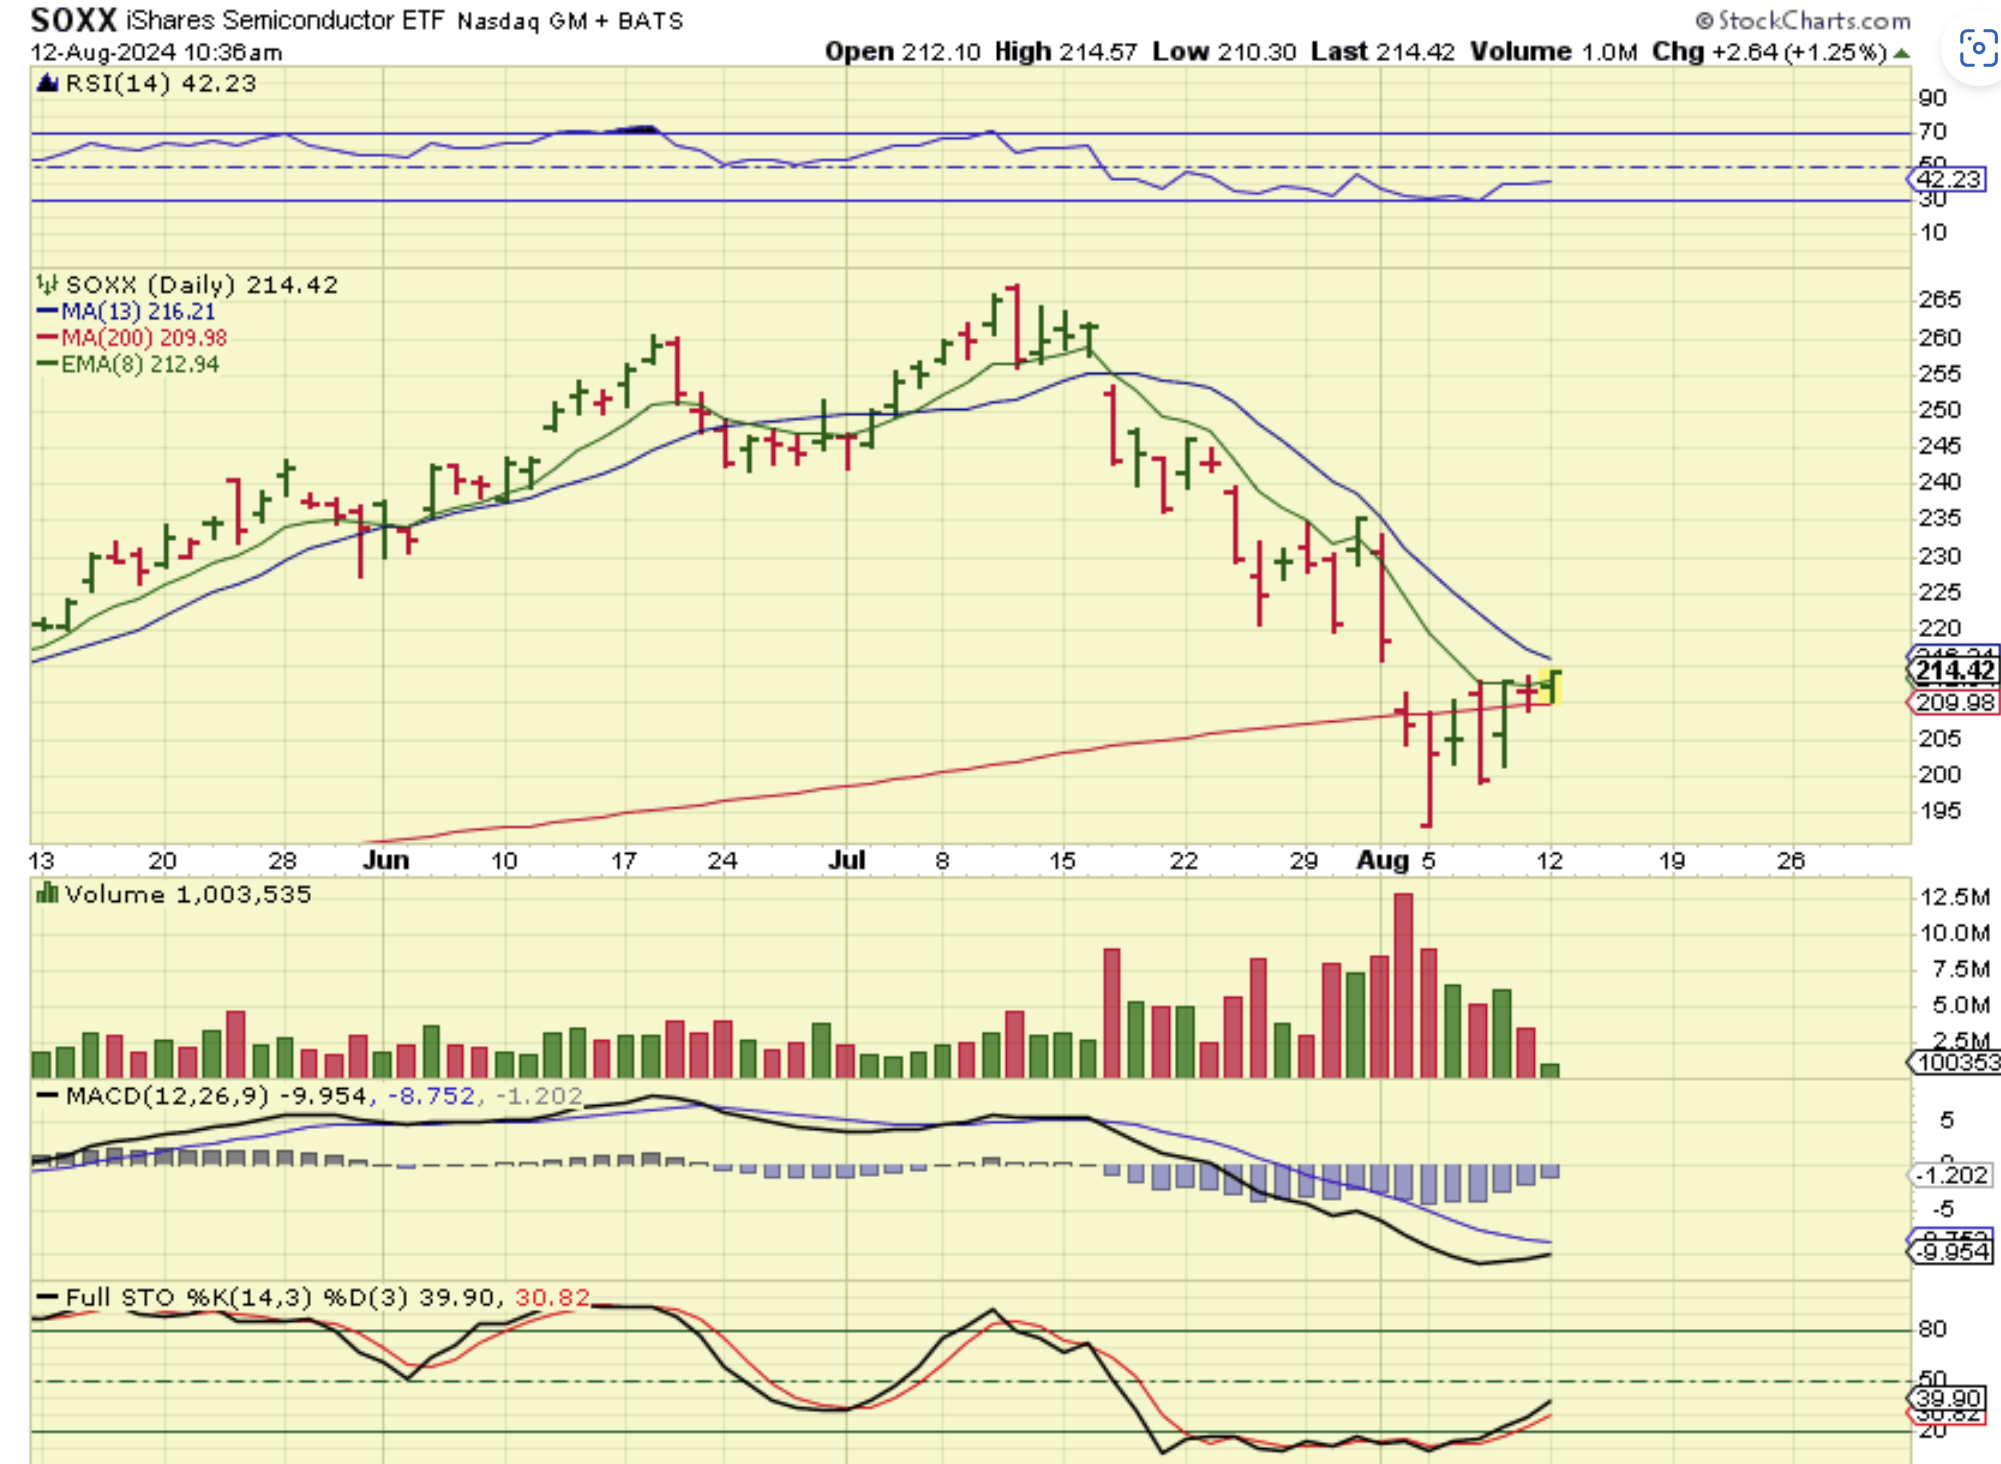
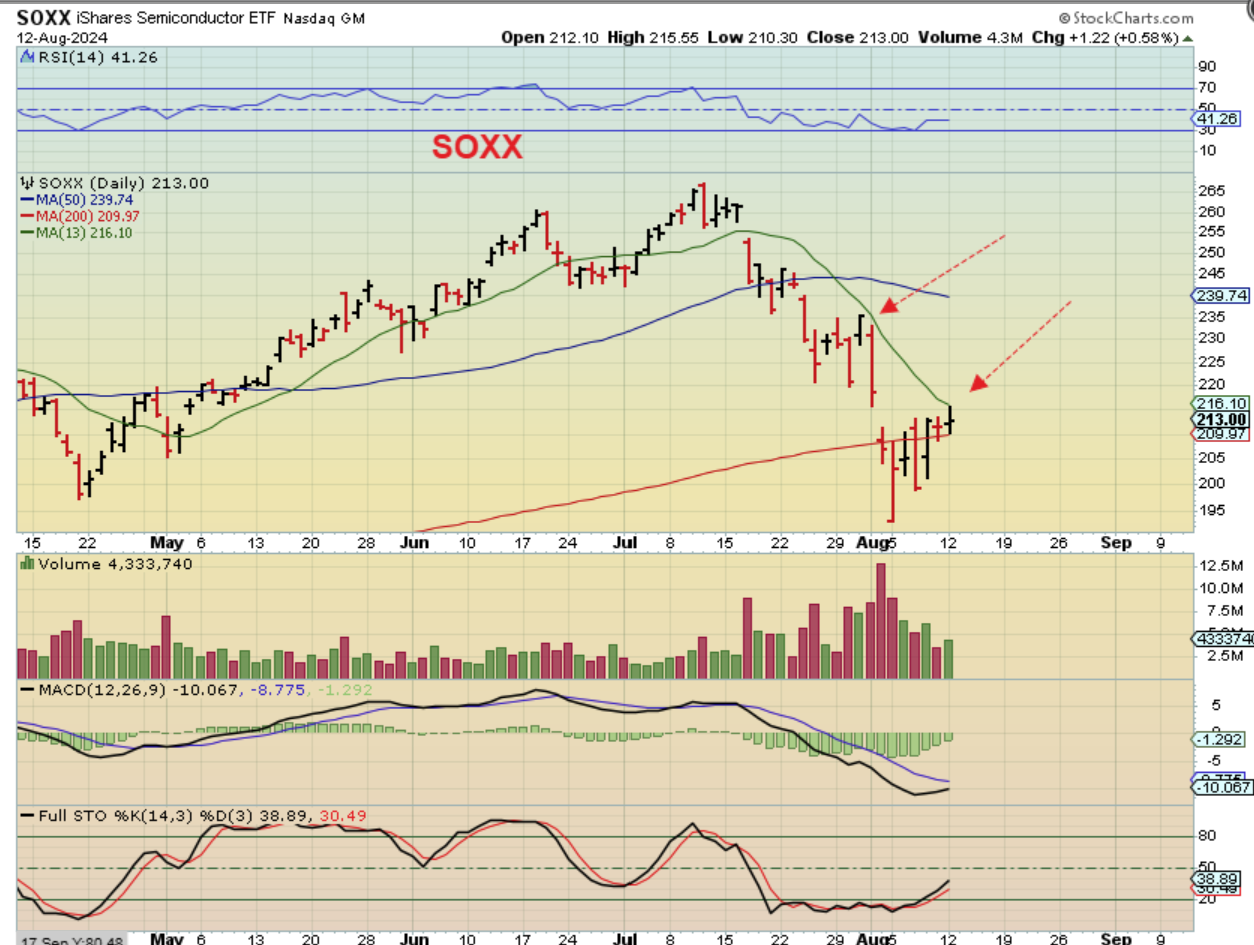
As you can see from this chart captured in the first hour of trading, THE SOXX and the other sectors did start off heading higher, but a little selling stopped them right at resistance, so…
.
THE SOXX pulled back and is also right at the 50-50 point. Do we have a dcl and it will push higher(?), or will resistance & inflation numbers cause another sharp sell off? I do think that we have more downside as mentioned, because it is really too soon to have an ICL from the late April lows to mid-August. For me, it’s really just a matter of ‘when’ the selling resumes.
.
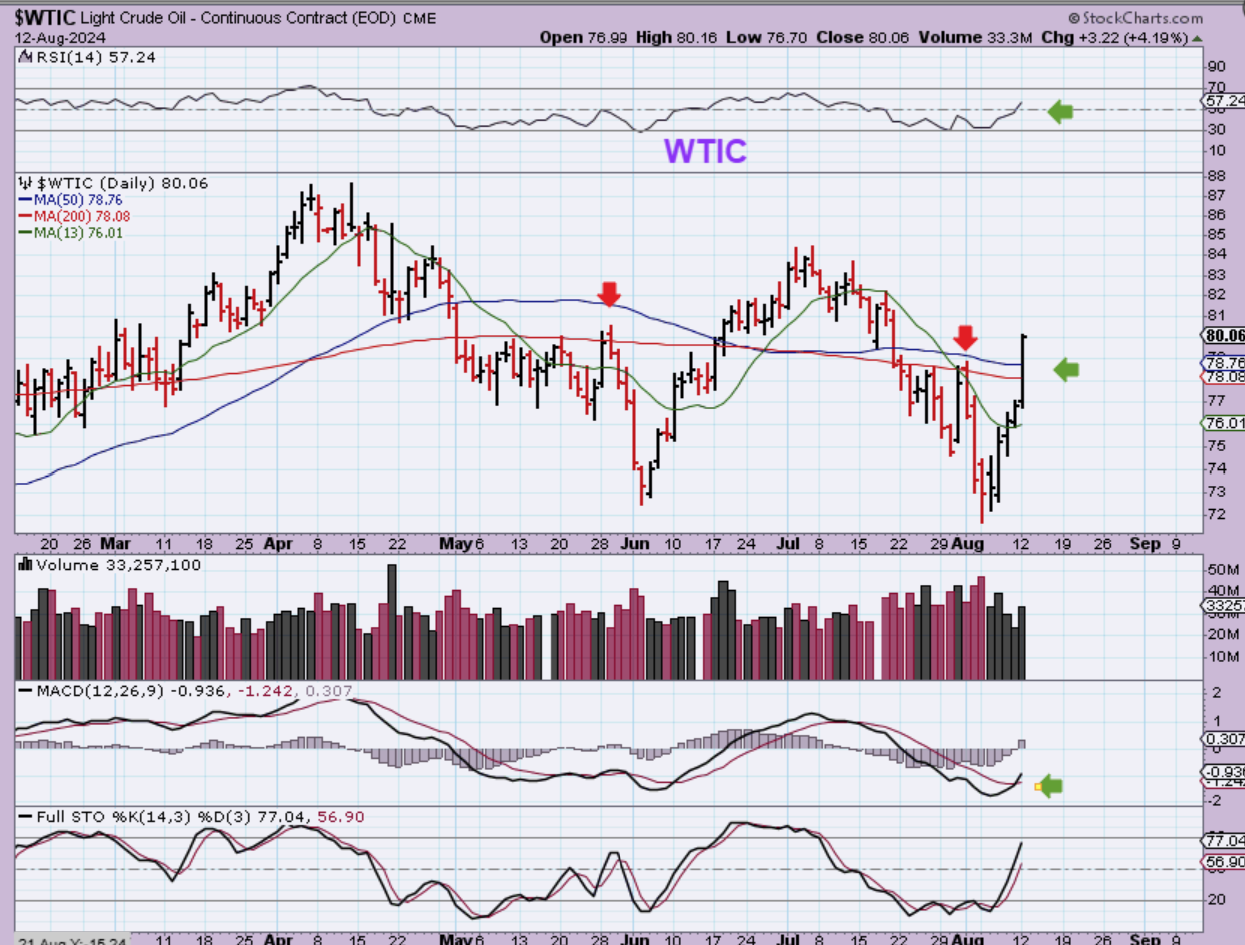
WTIC – OIL is no longer hindered by the resistance area. Monday gave us a 4% gainer and it sliced right through the 50 & 200sma. We did expect higher prices over time, because the ICL was in place, but we had a small undercut, and then a recovery. Also from the weekend report…
.
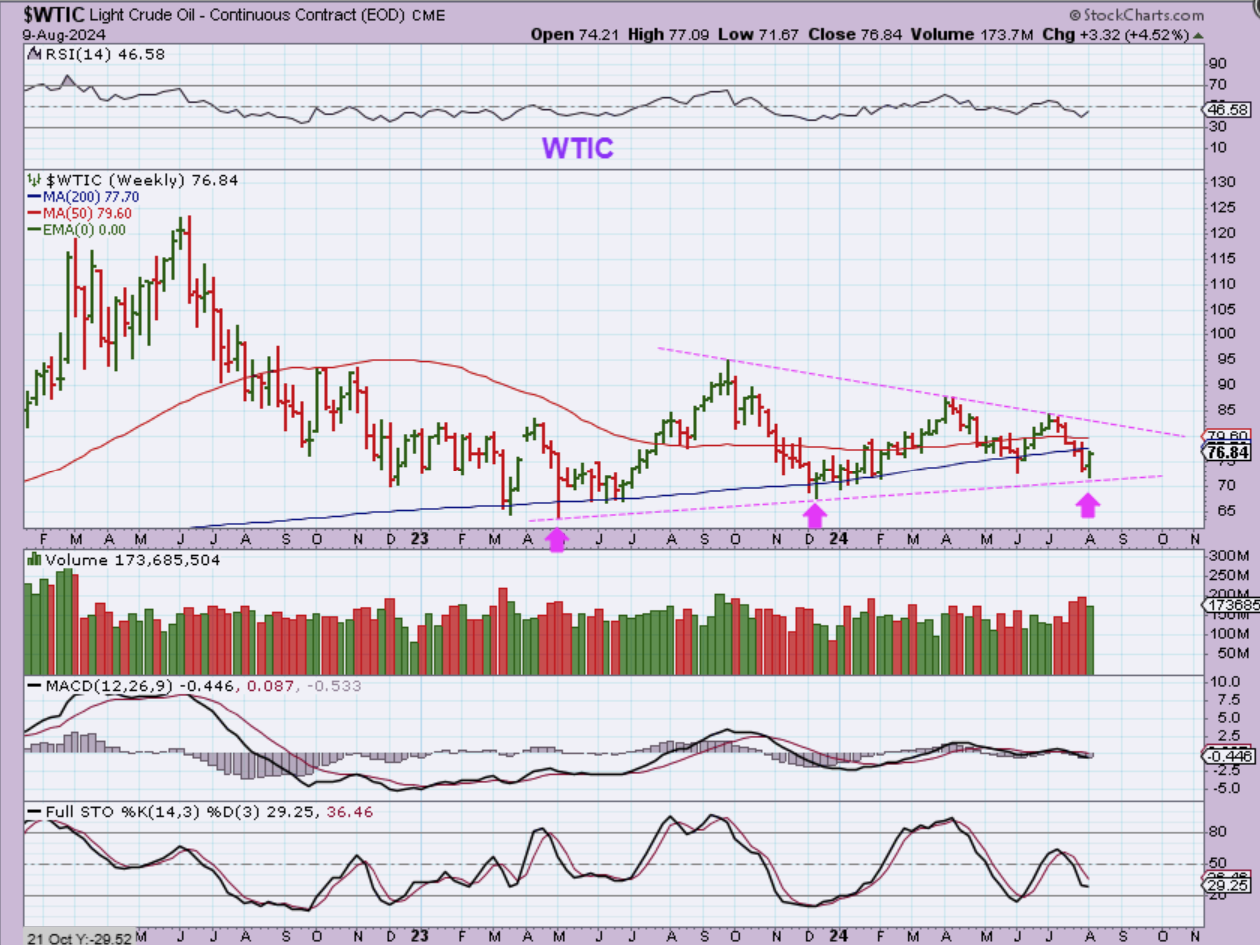
FROM THE WEEKEND REPORT, Oil actually sold off lower than expected, by undercutting what should have been the ICL, but this could be a shakeout that simply tagged that uptrend line and put in a weekly reversal. Also this is a LONG consolidation forming a triangle and when that breaks out, Oil prices really may begin to rise.
.
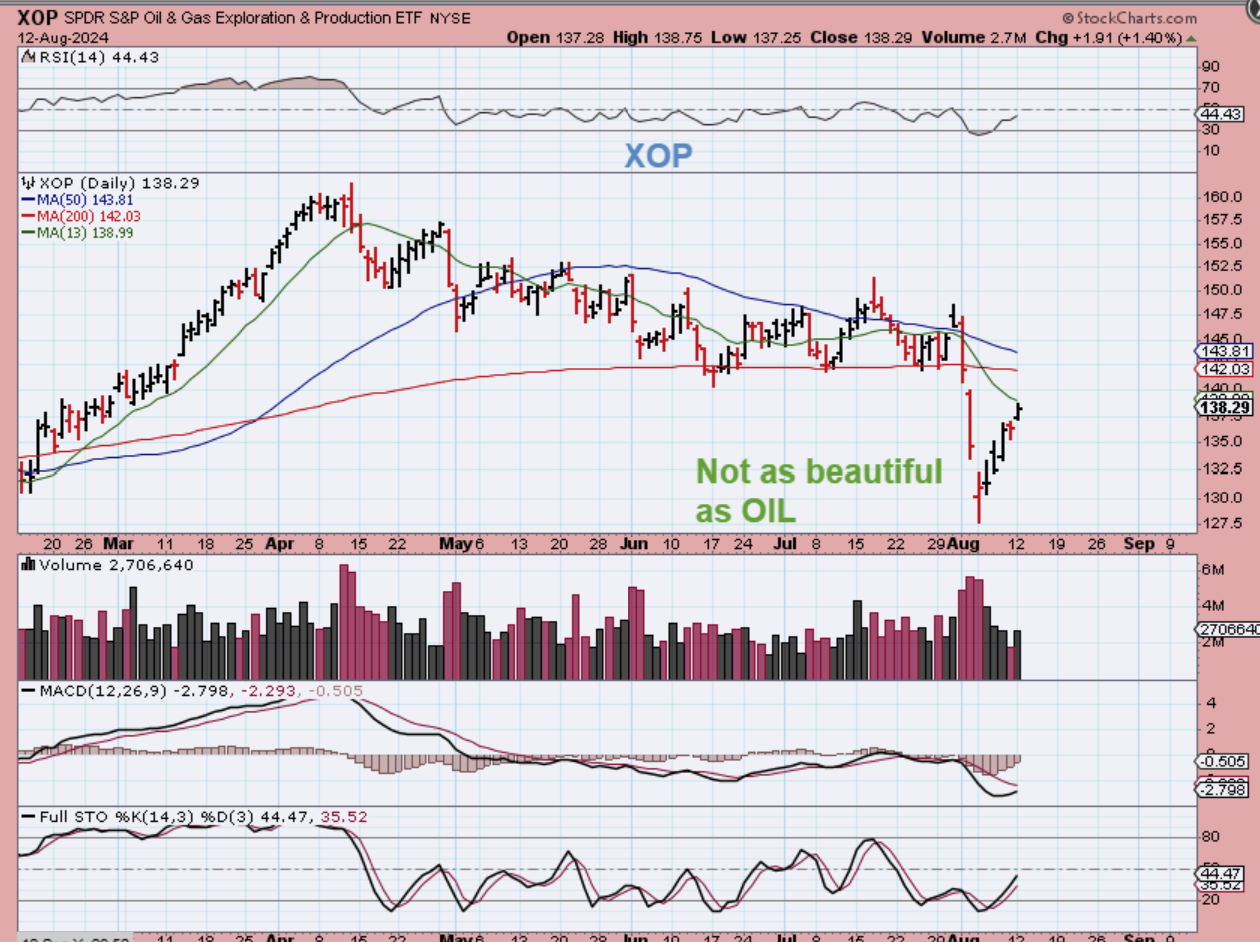
The XOP did not have nearly as impressive of a day as Oil had, but it was green on the day. Oil stocks did follow the market sell off over a week ago.
.
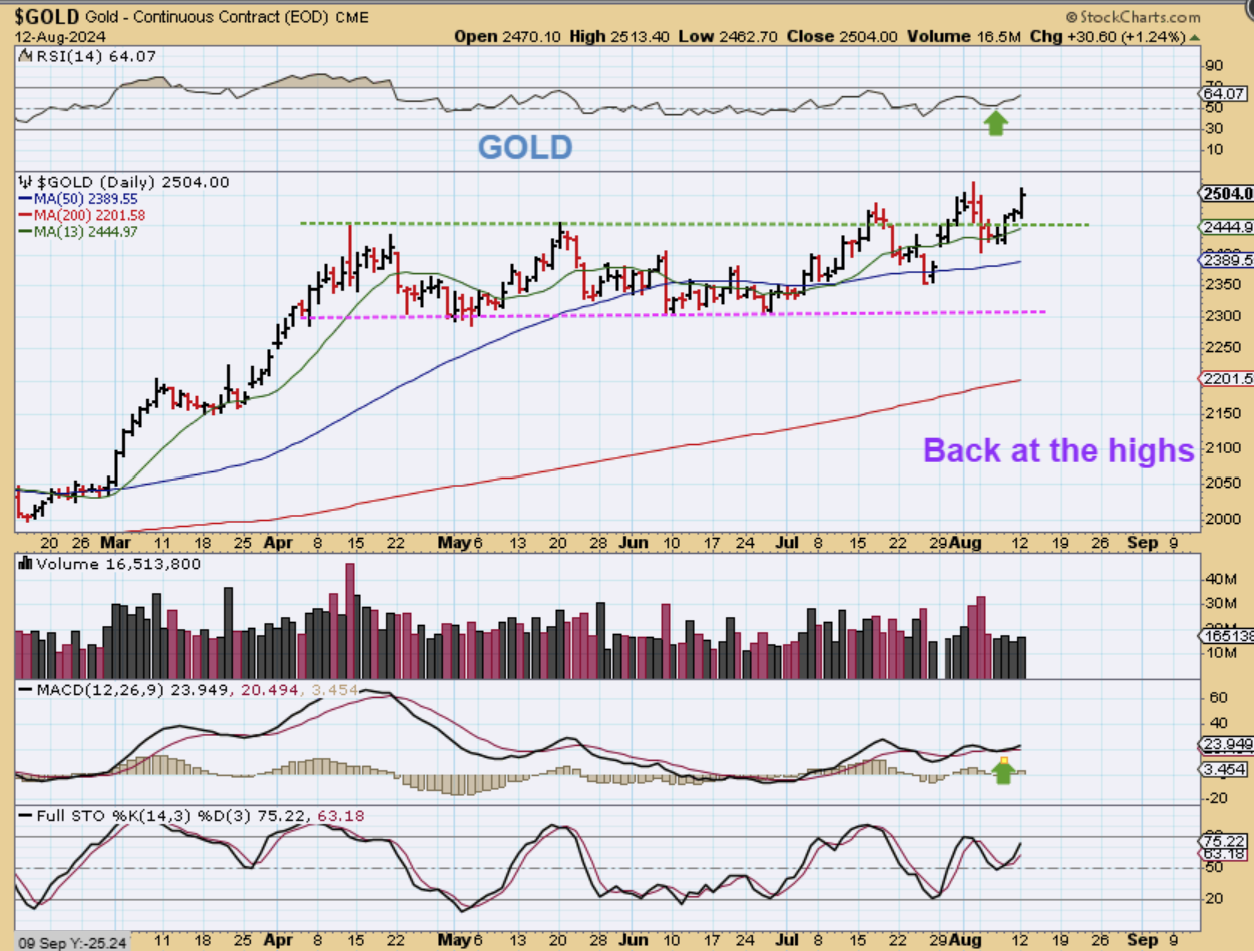
GOLD was up $30 and is almost right back at the all-time highs, as we approach the release of the inflation data by means of Tuesdays PPI numbers and Wednesday CPI Numbers. This should be only day 12 for Gold, in the second daily cycle.
.
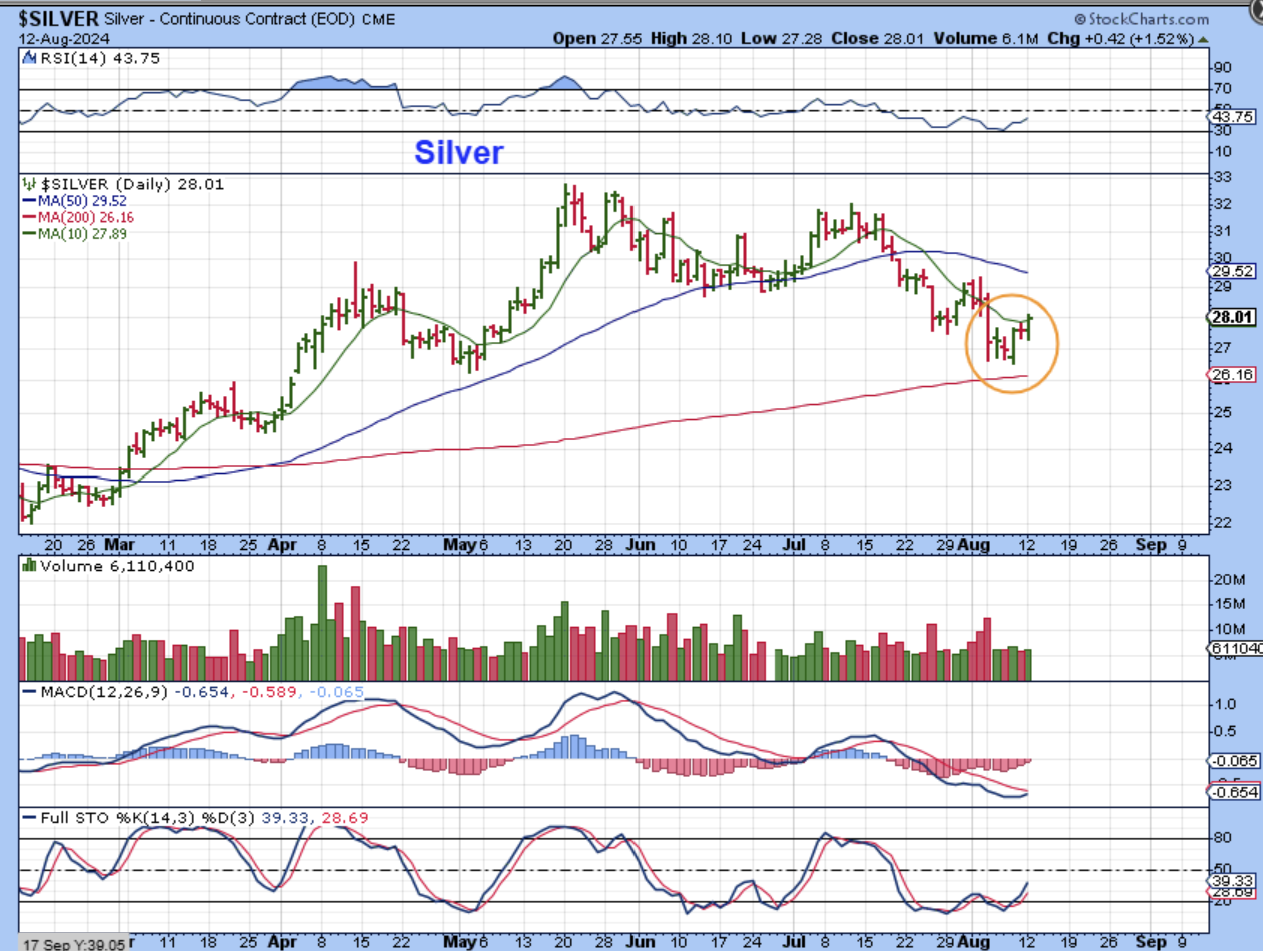
SILVER should be moving up & out of a dcl / ICL, and this would be day 2 as it closed above the 10sma, but it was day 3 if you used spot Silver. Also, most of the Silver stocks look to be 4 or 5 days out of their lows.
.
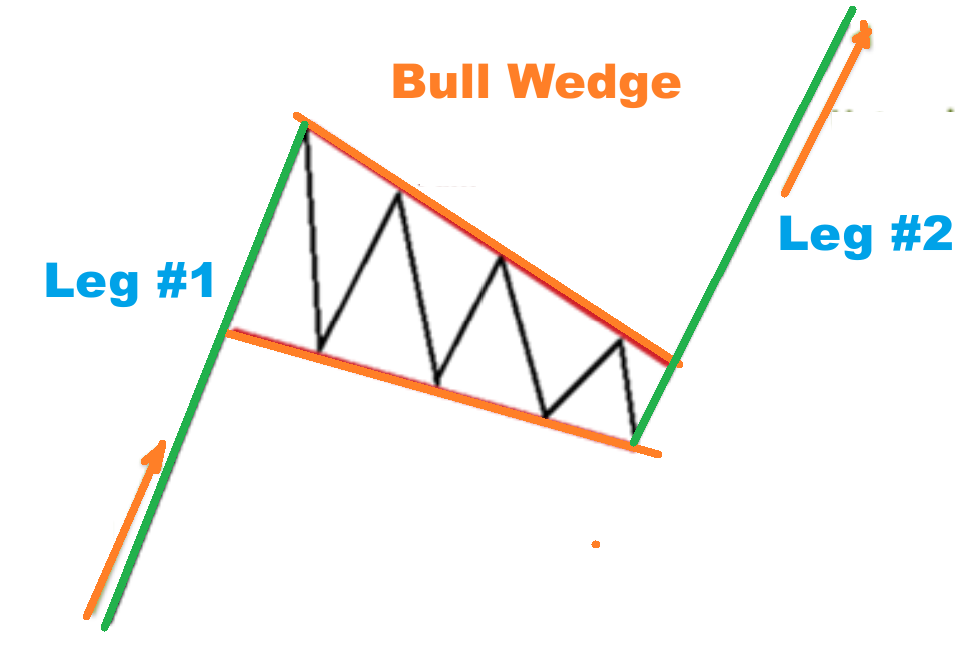
Before we get to the GDX ETF, I wanted to show you a bullish falling wedge pattern.
Often the 2nd leg will be equal to or greater to the first legs distance.
.
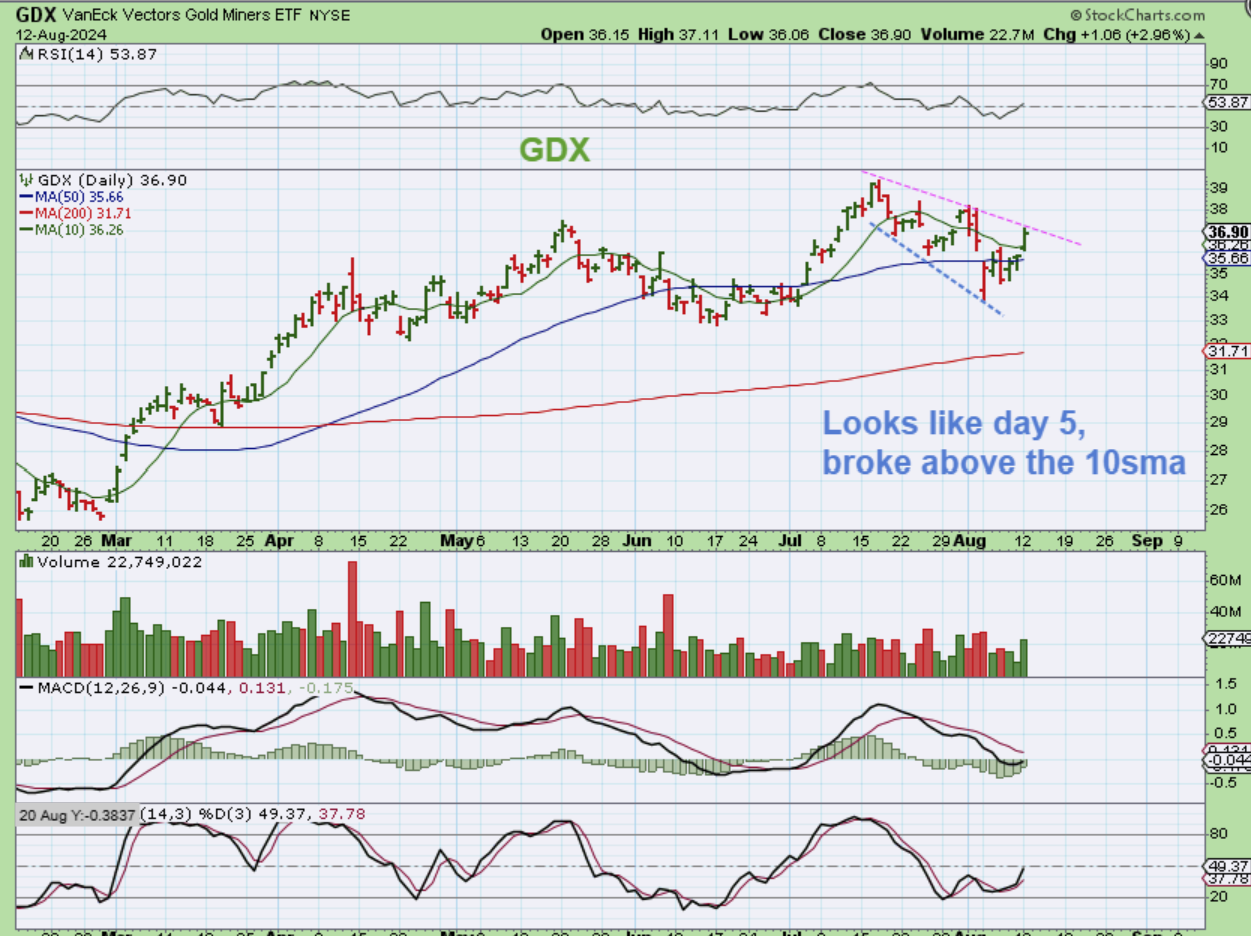
And The GDX ETF has formed somewhat of a bullish wedge, except that it is broadening like a bullhorn. The GDX seems to be on day 5 and is oversold. This gives plenty of time for some upside movement, so hopefully the inflation numbers provide the catalyst for a push higher and not choppy indecision.
.
Now we’ll just look a few Miners and ask ourselves: Bullish or Bearish?
.
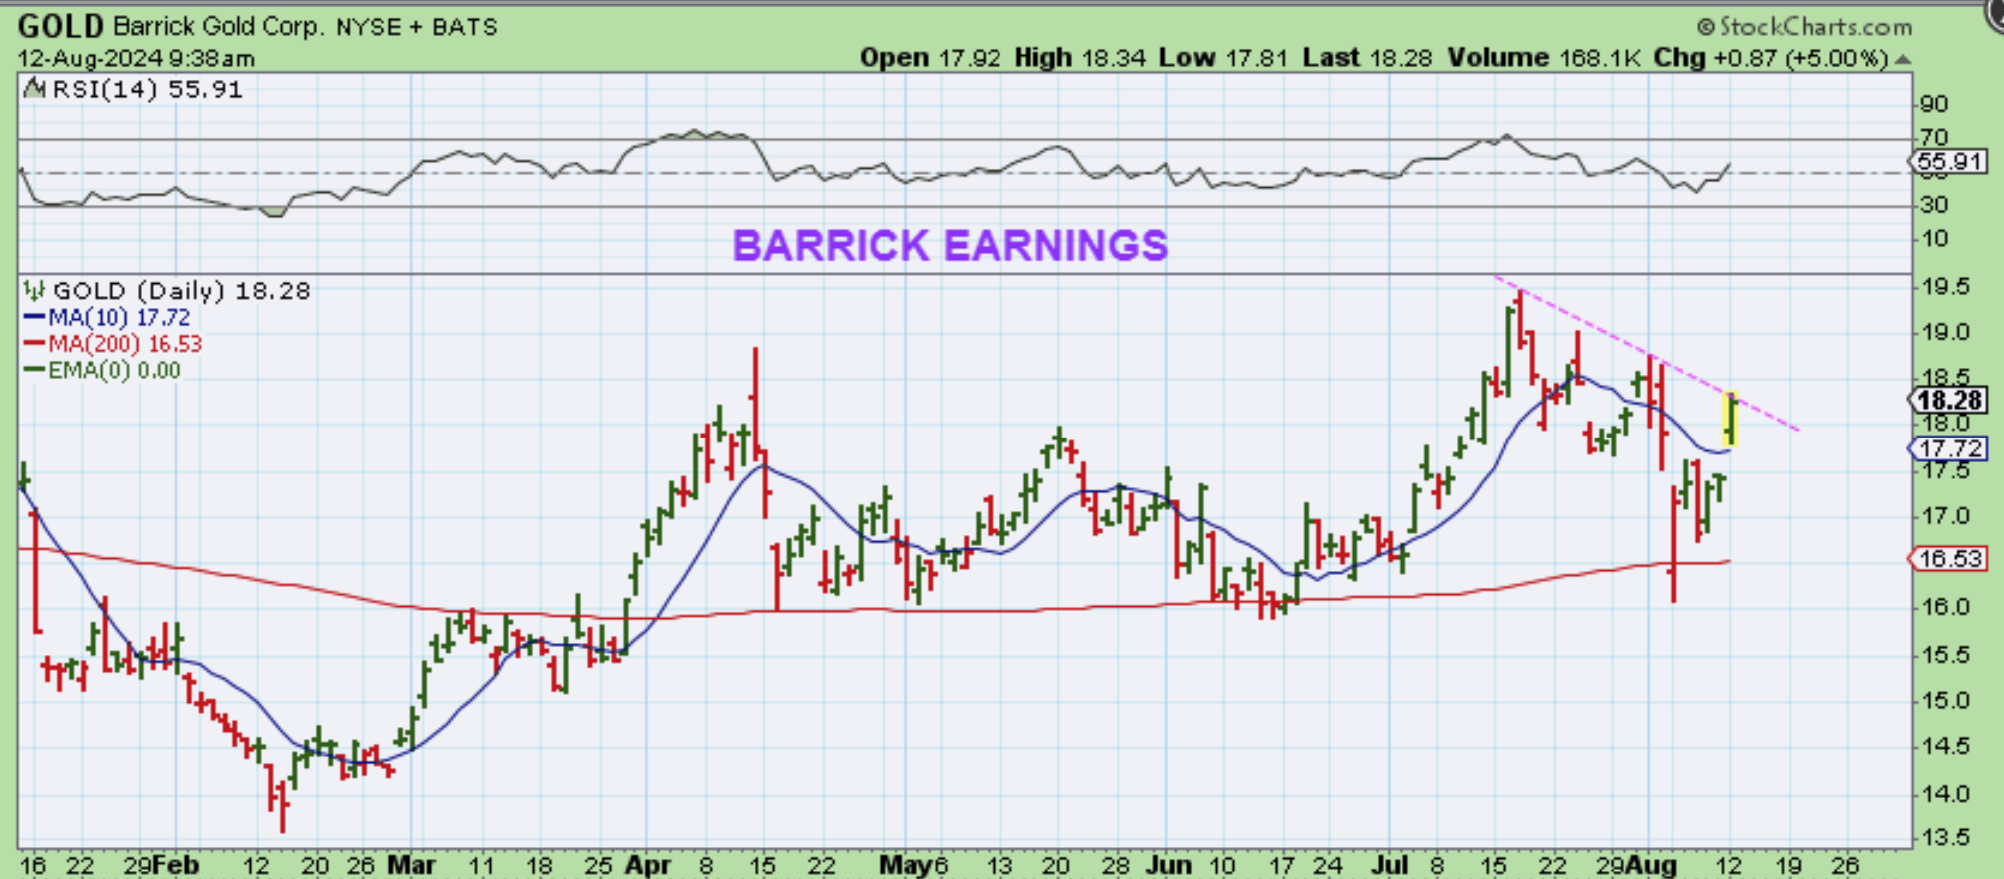
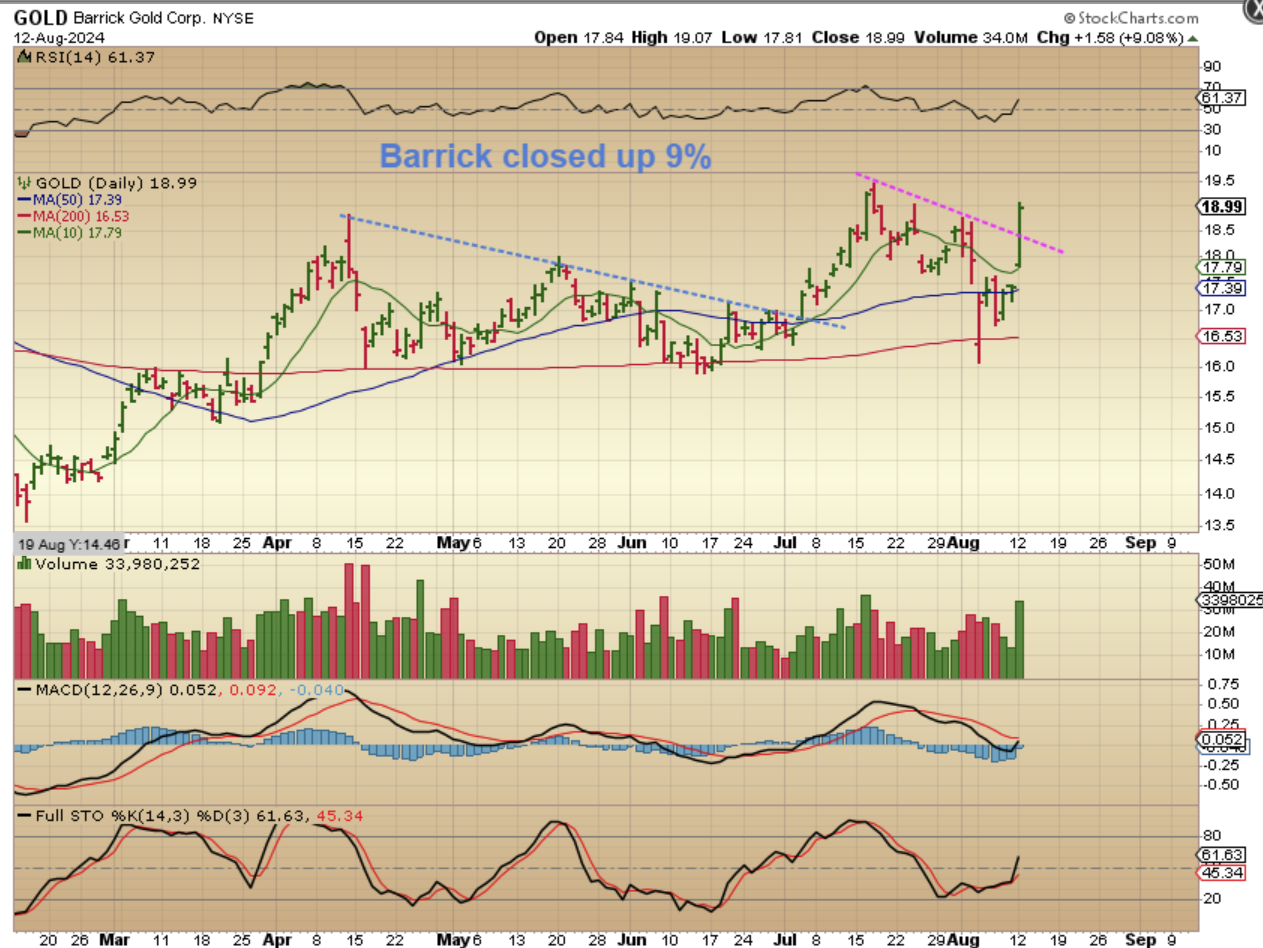
BARRICK released their earnings, and it gapped open and pushed higher by 5% quickly, so I grabbed this chart at 9:39 am. It actually…
.
It actually closed up 9%, so it broke this downtrend line and that is BULLISH.
.
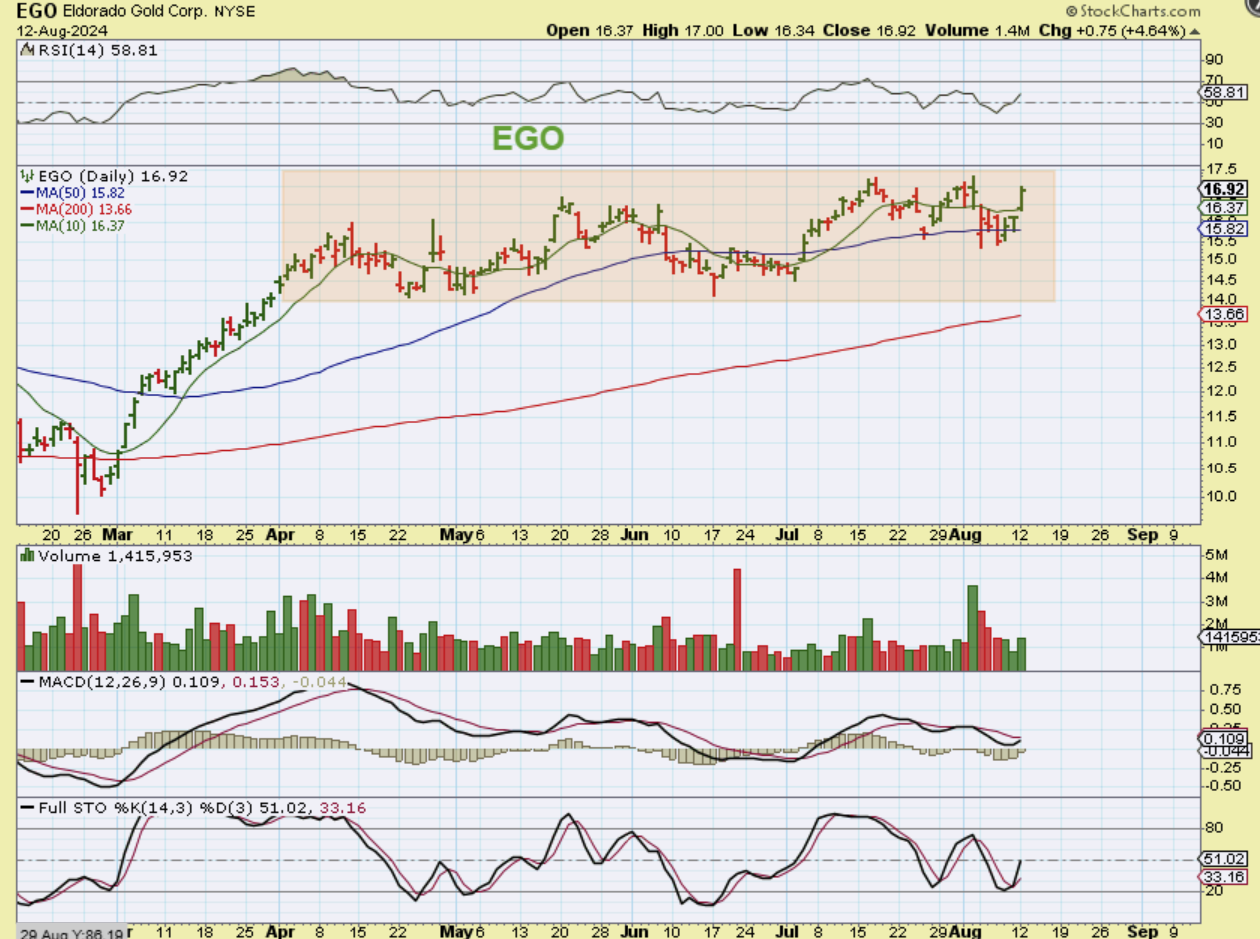
EGO is in a very long 4 month consolidation, but it has started to hang out in the upper half of that rectangle box consolidation, now back above the 50sma. That is also Bullish. EGO is near 2024 highs.
.
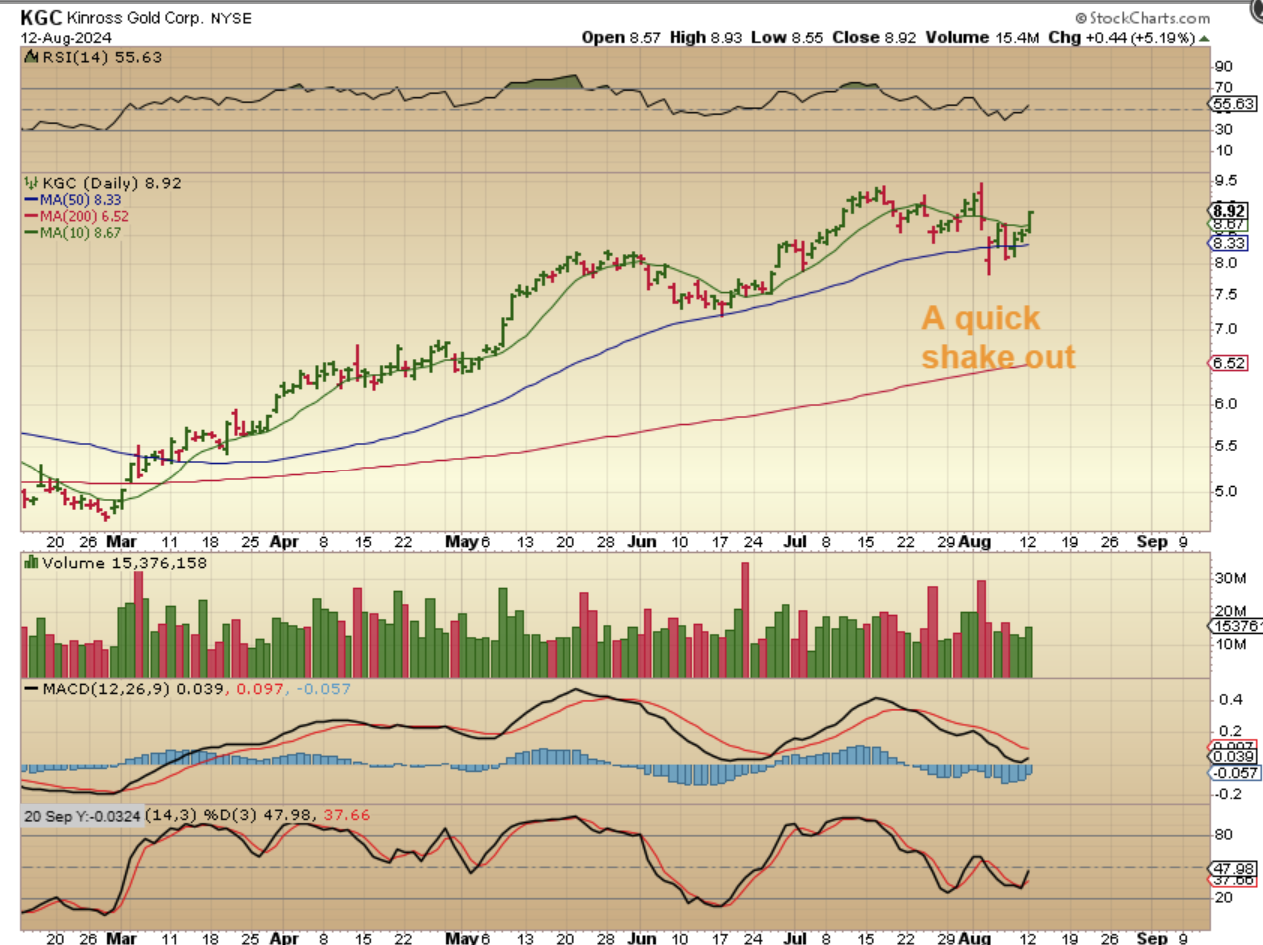
KGC recovered the 50sma and is now heading back to the 2024 highs too. It lost the 50sma for a very short period of time, and now looks to be breaking out higher. That is bullish too.
.
I really feel that after seeing that sudden post-Fed sell off, the data numbers scheduled for this week could start that next leg down. We are only about 3 months into this intermediate cycle, so I have to expect more downside. If we do currently have a dcl in place, we would only be on day 5. That means that we MIGHT be able to continue to see prices rise to the 50sma and it could be just enough to fool everyone into thinking that the rate cuts will save the day. Today is PPI, and THAT is the inflation number that the Fed goes by, so we’ll just have to see how the futures react in pre-market trading and then on through the day. Enjoy your Tuesday trading!
.
~ALEX
.
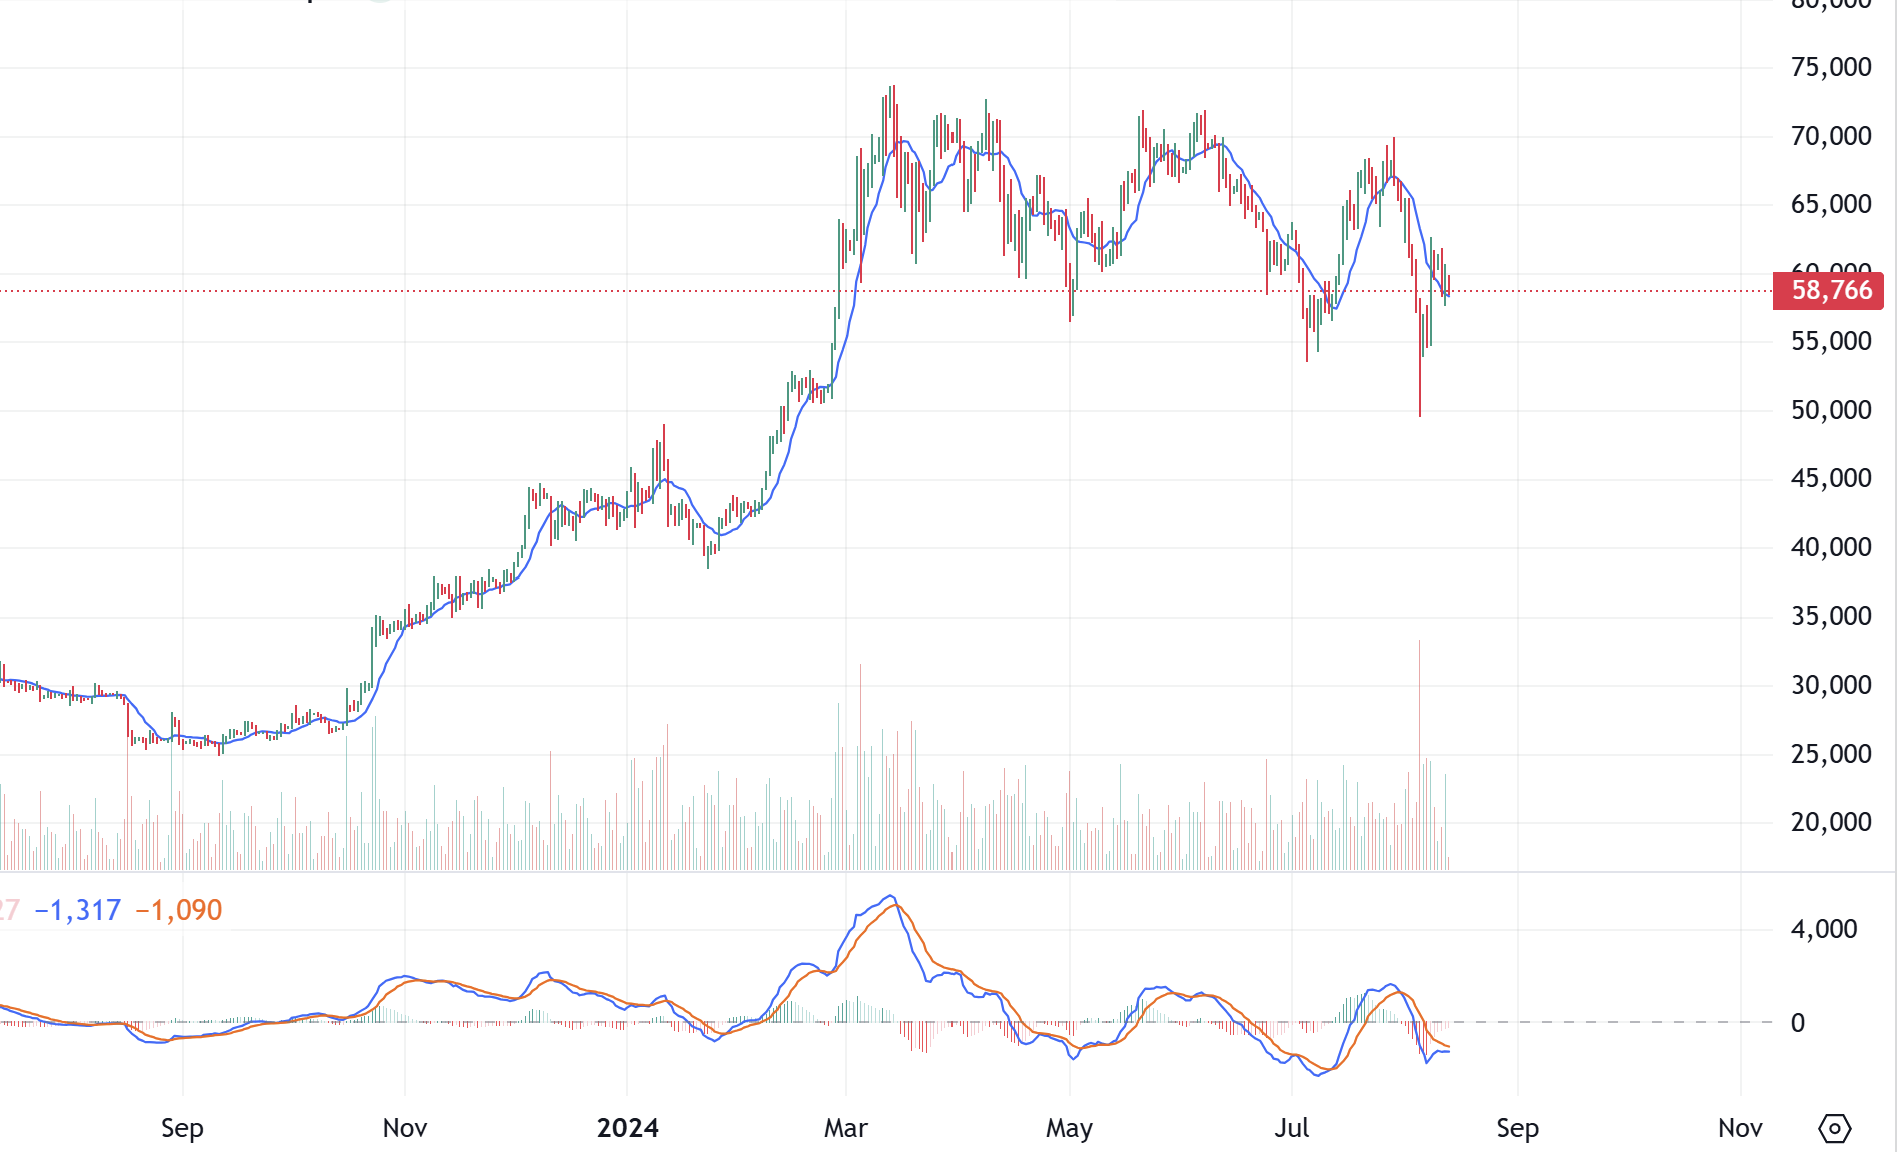
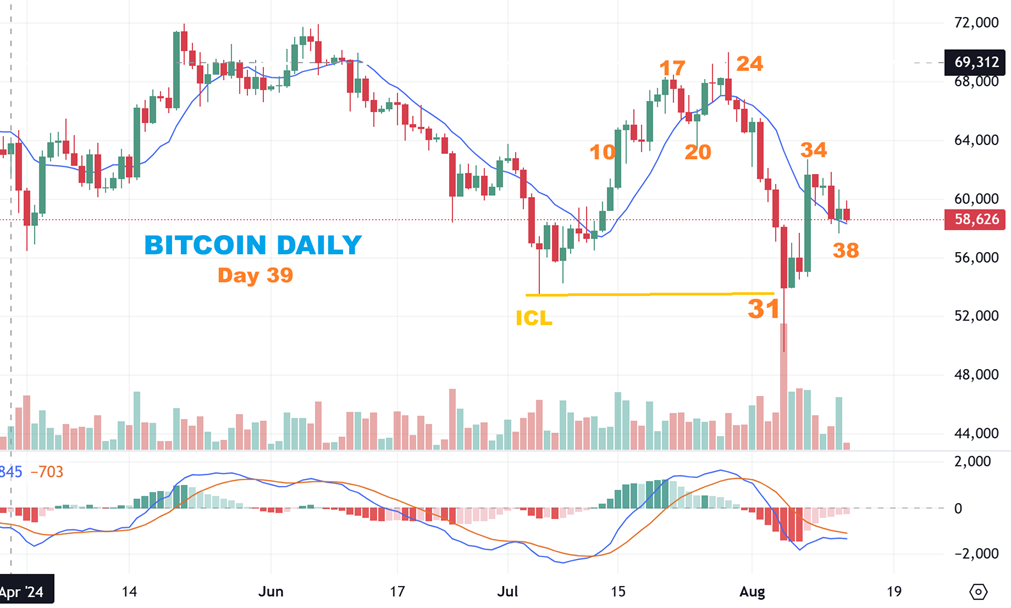
Bitcoin bounced from the day 31 reversal, as evident in this chart from Fridays report. We saw an exhaustion type sell off into day 31 and that gave us the reversal candle that we were looking for around that time period. Day 34 surged. How have things progressed??
.
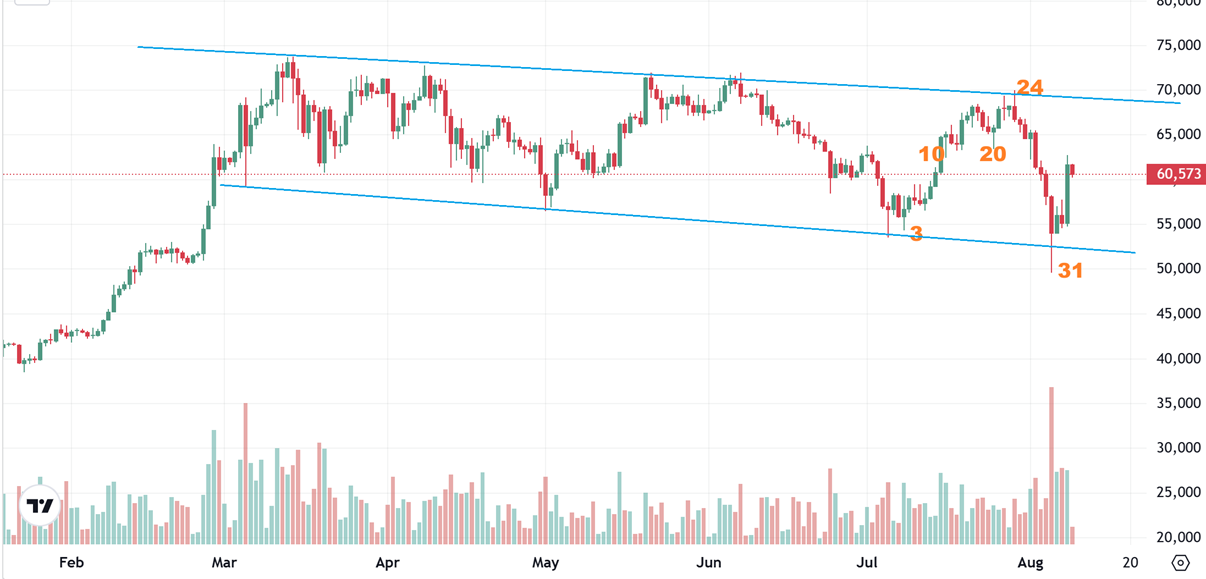
A possible Bull Flag:
BITCOINs strength going forward is somewhat questionable, because it broke below the ICL. So far we saw a nice surge and a 5 day pause, but it can surge again and make a run toward that $70,000 area. Right now the bigger picture for Bitcoin is that it has entered a large, choppy, sideways consolidation in 2024…
Right now the bigger picture for Bitcoin is that it has entered a large, choppy, even somewhat sloppy sideways consolidation in 2024. This is the year that saw ETFs approved and everyone seemed to think that now the big boys would easily pile in and push this above $100,000. I do think that it will still be able to go there over time, but the markets do not always match what people think is the next logical move. That’s why we shouldn’t assume that a rate cut with ‘save the General Markets’ from a larger correction. The old saying, “Buy the Rumor, Sell the News!’ is still valid today. 🙂