Thursday August 8th – Melting Down?
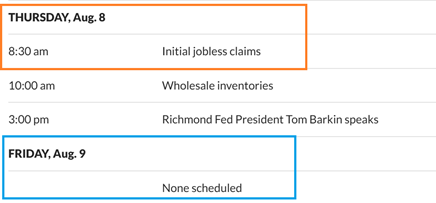
DATA – Todays Data usually moves markets and in the recent past it used to cause a rally, but last week we saw a Post-Fed sell off on Thursday. That sell off started pre-market. That said, we had a sell off starting yesterday. That means that this Jobless Claims report could extend yesterdays selling – or – it might cause a bounce. Let’s go to the charts for more info…
.
THIS PART IS FOR THOSE ABLE TO TAKE A SHORT-TERM TRADE, MAYBE A ‘DAY TRADE’.
YESTERDAY I SAID: (And take note of the red line)…
.
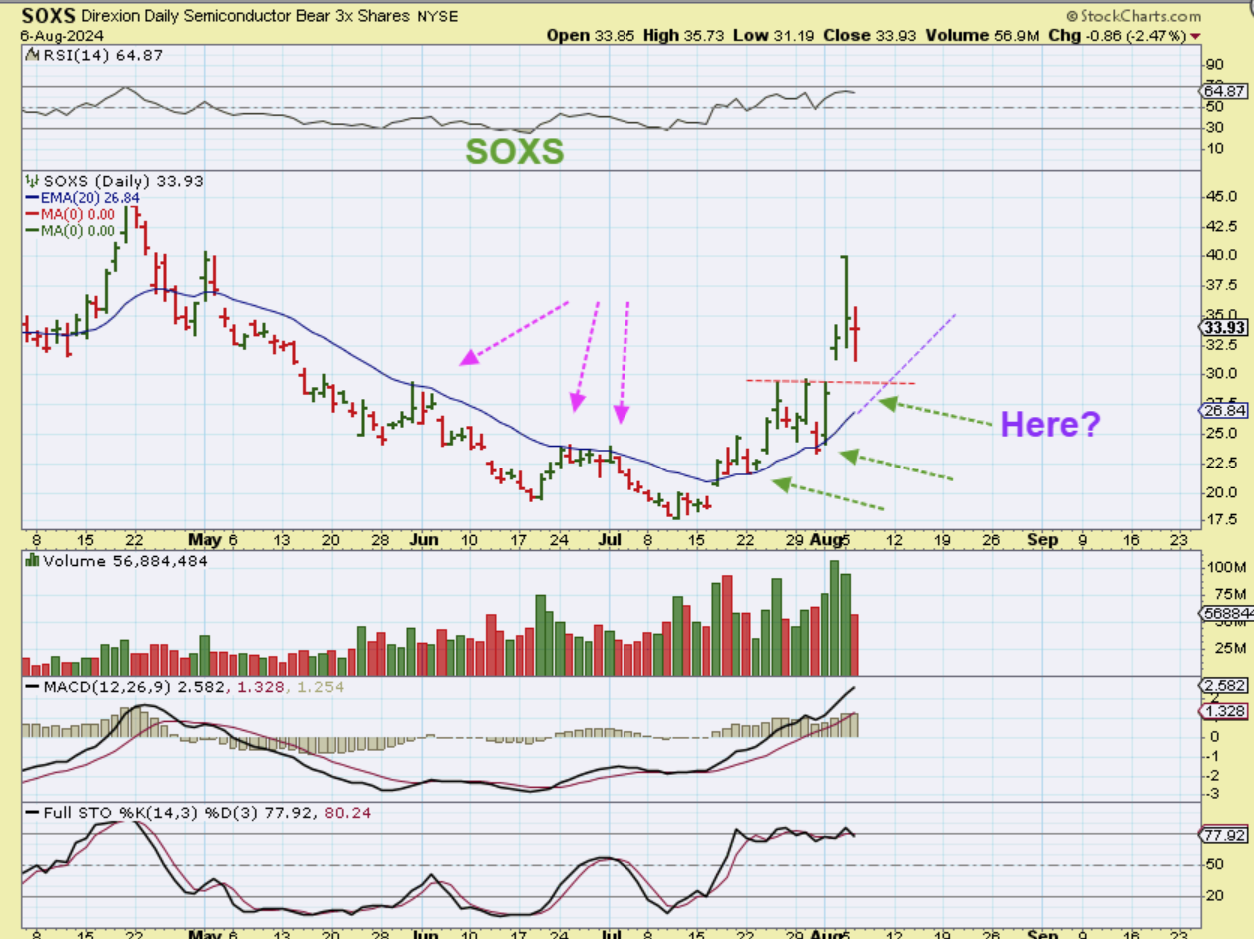
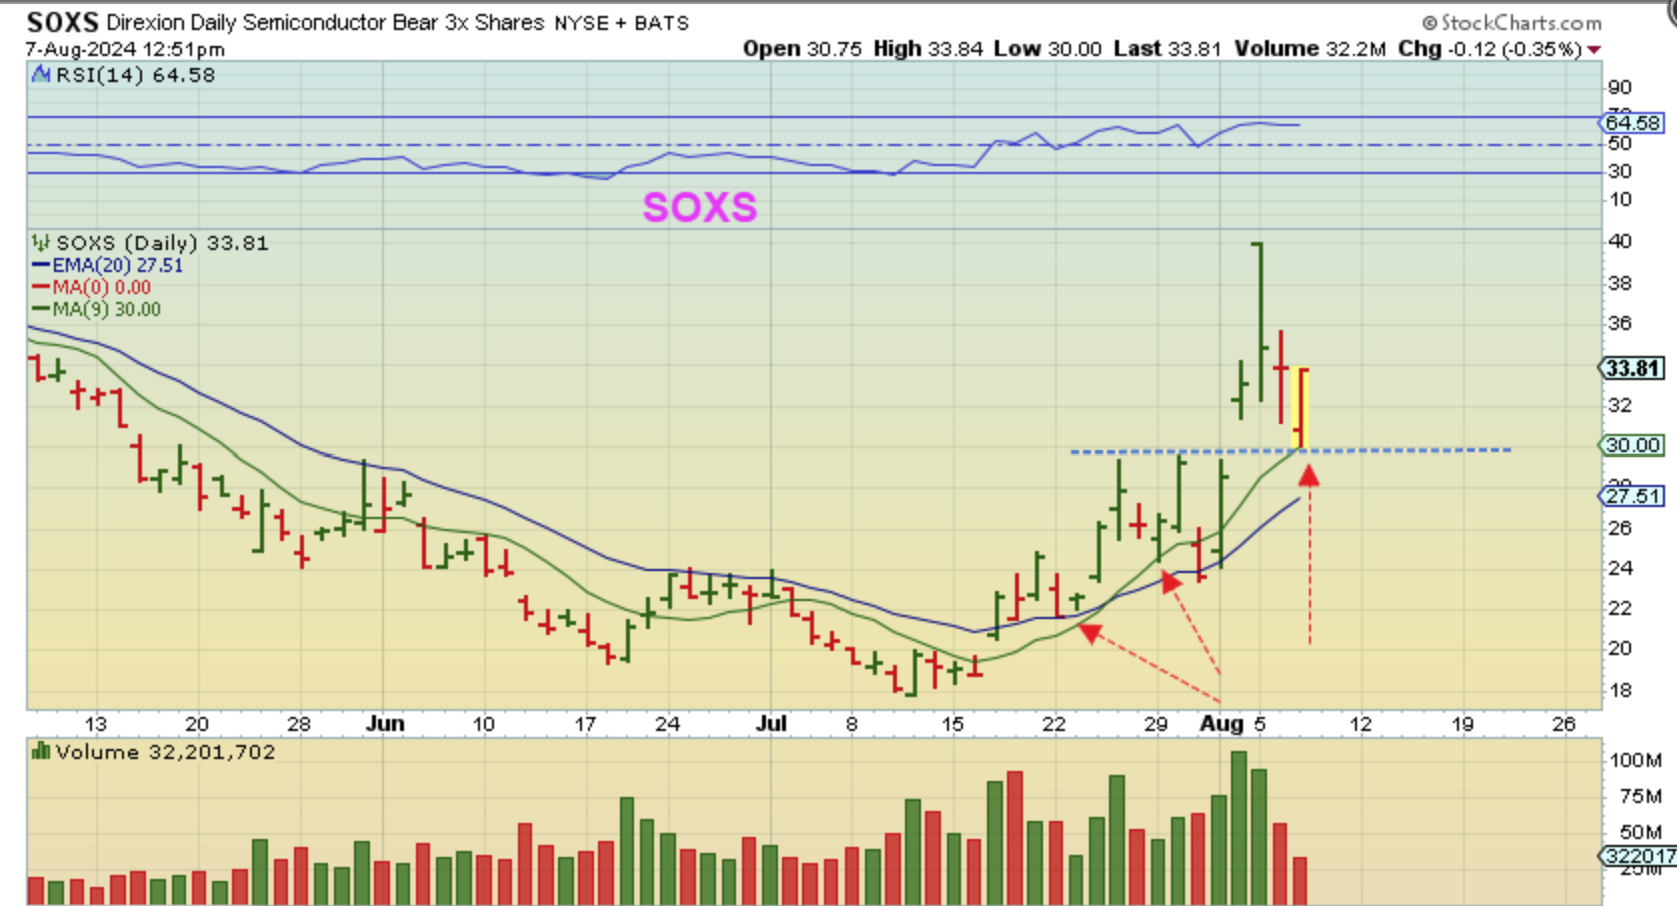
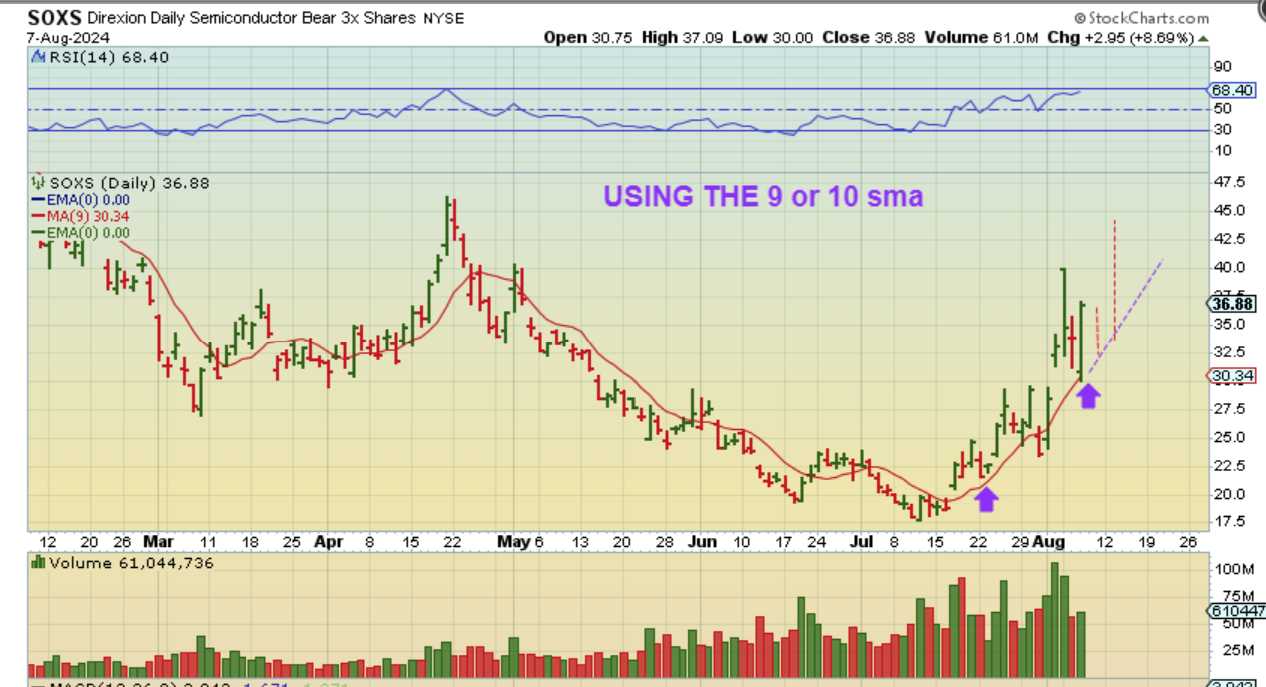
SOXS DAILY: What I am hoping for is a drop to the 20ema as a gap fill and then some kind of a reversal. This would require a move higher on Wednesday. That line is around $30, look for a reversal.
.
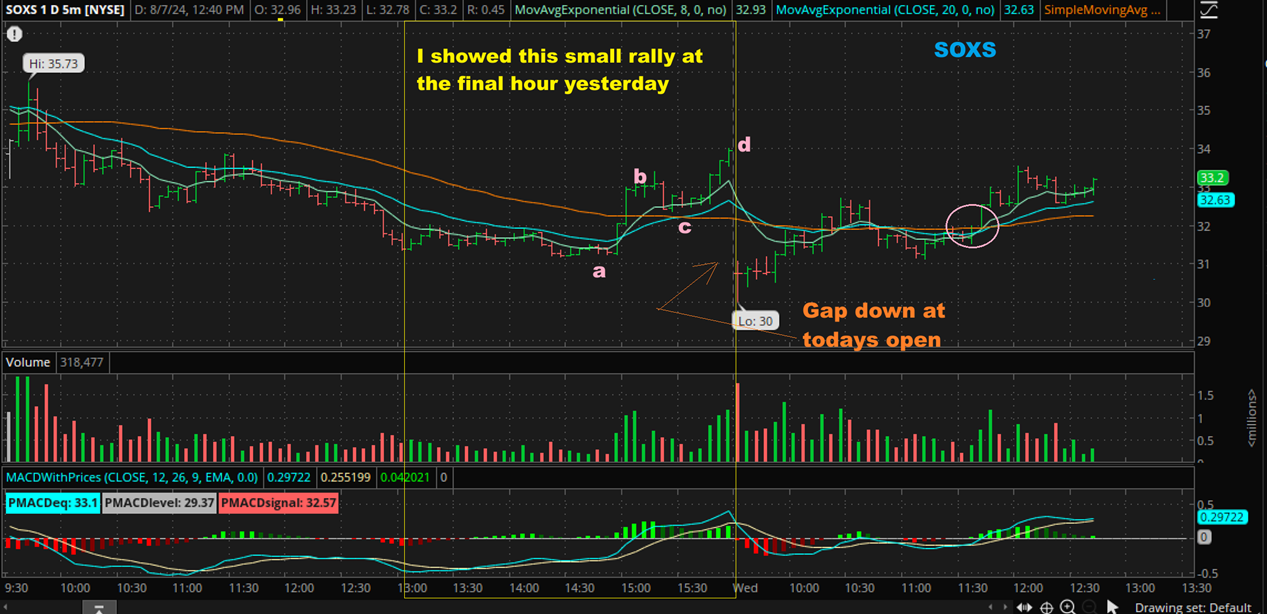
SOXS – I posted this in the comments, because the SOXX did drop to above $30 and reversed. This intraday chart started to make a higher high and look at that MACD. It turned Bullish, so around noon I bought the pink circle with a stop at the red 50 sma (10 minute chart). This was a buy with a stop even at $32 or $33, so…
.
THIS WAS THE SHORT TAKING PLACE. A REVERSAL AT THE 9 or 10 SMA.
Now we go to the SOXS daily chart at 12:51 p.m. and the SOXS reversed at the green 9sma and as now at $33.80. It was still red for the day, but it had moved up nicely and SQQQ & TECS was doing the same.
.
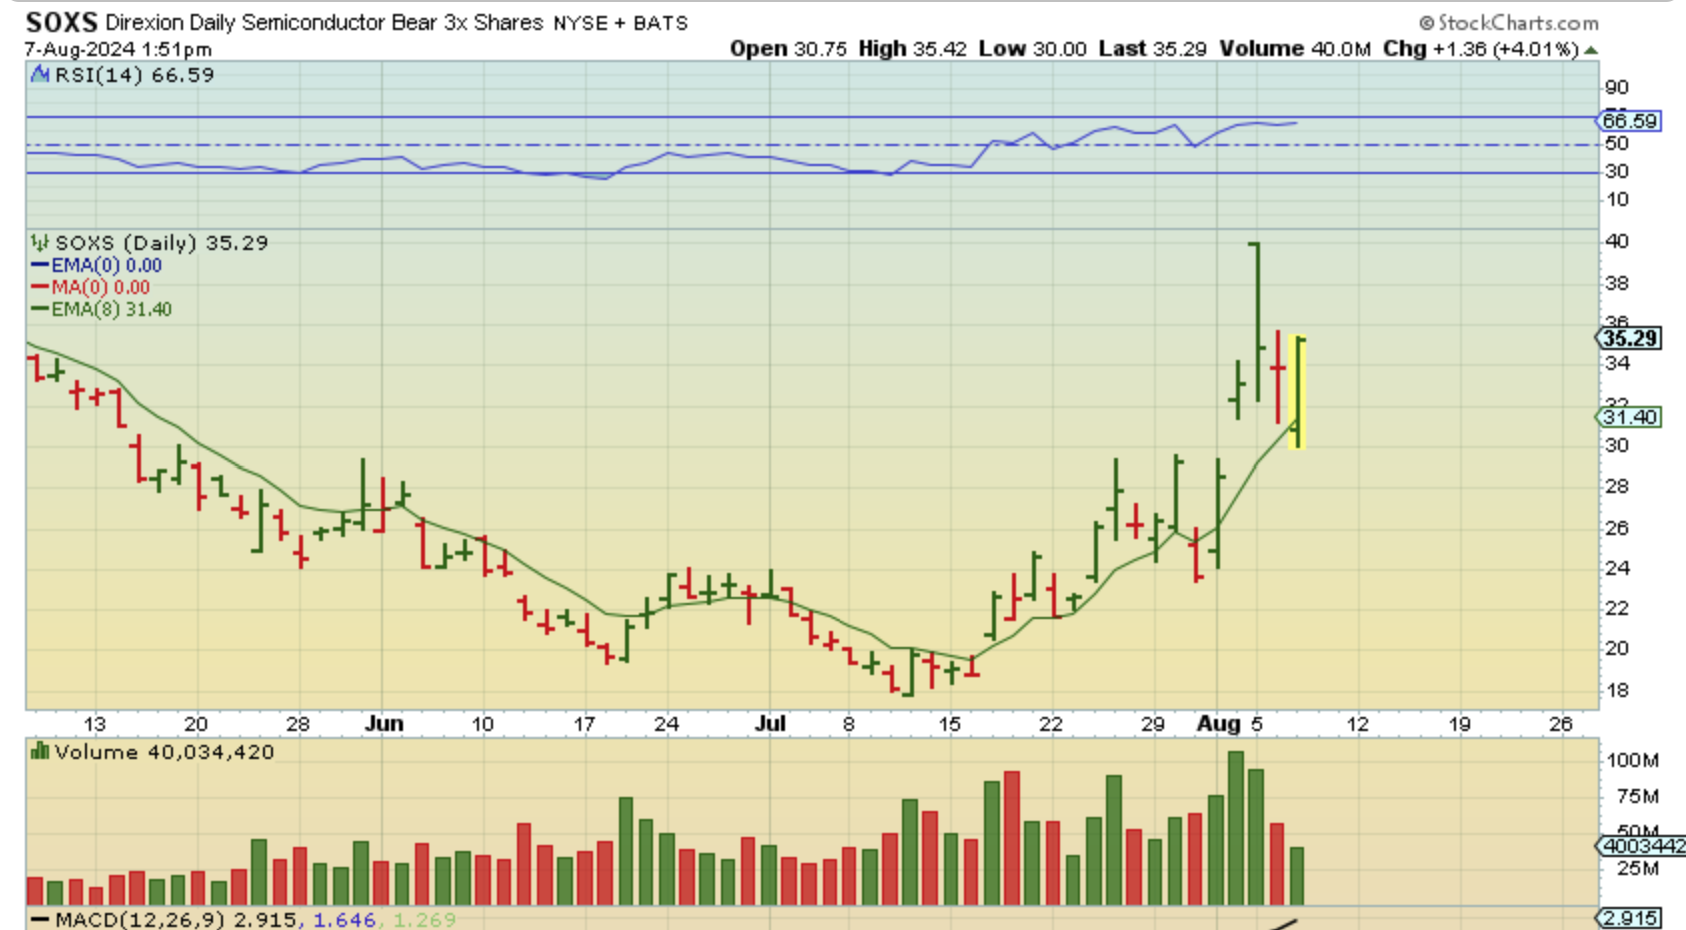
THE SOXS WENT GREEN by almost 2 p.m., so I posted the continuing progress, and I didn’t see anything intraday that was indicating that this run was weakening (until after hrs when a double top formed).
.
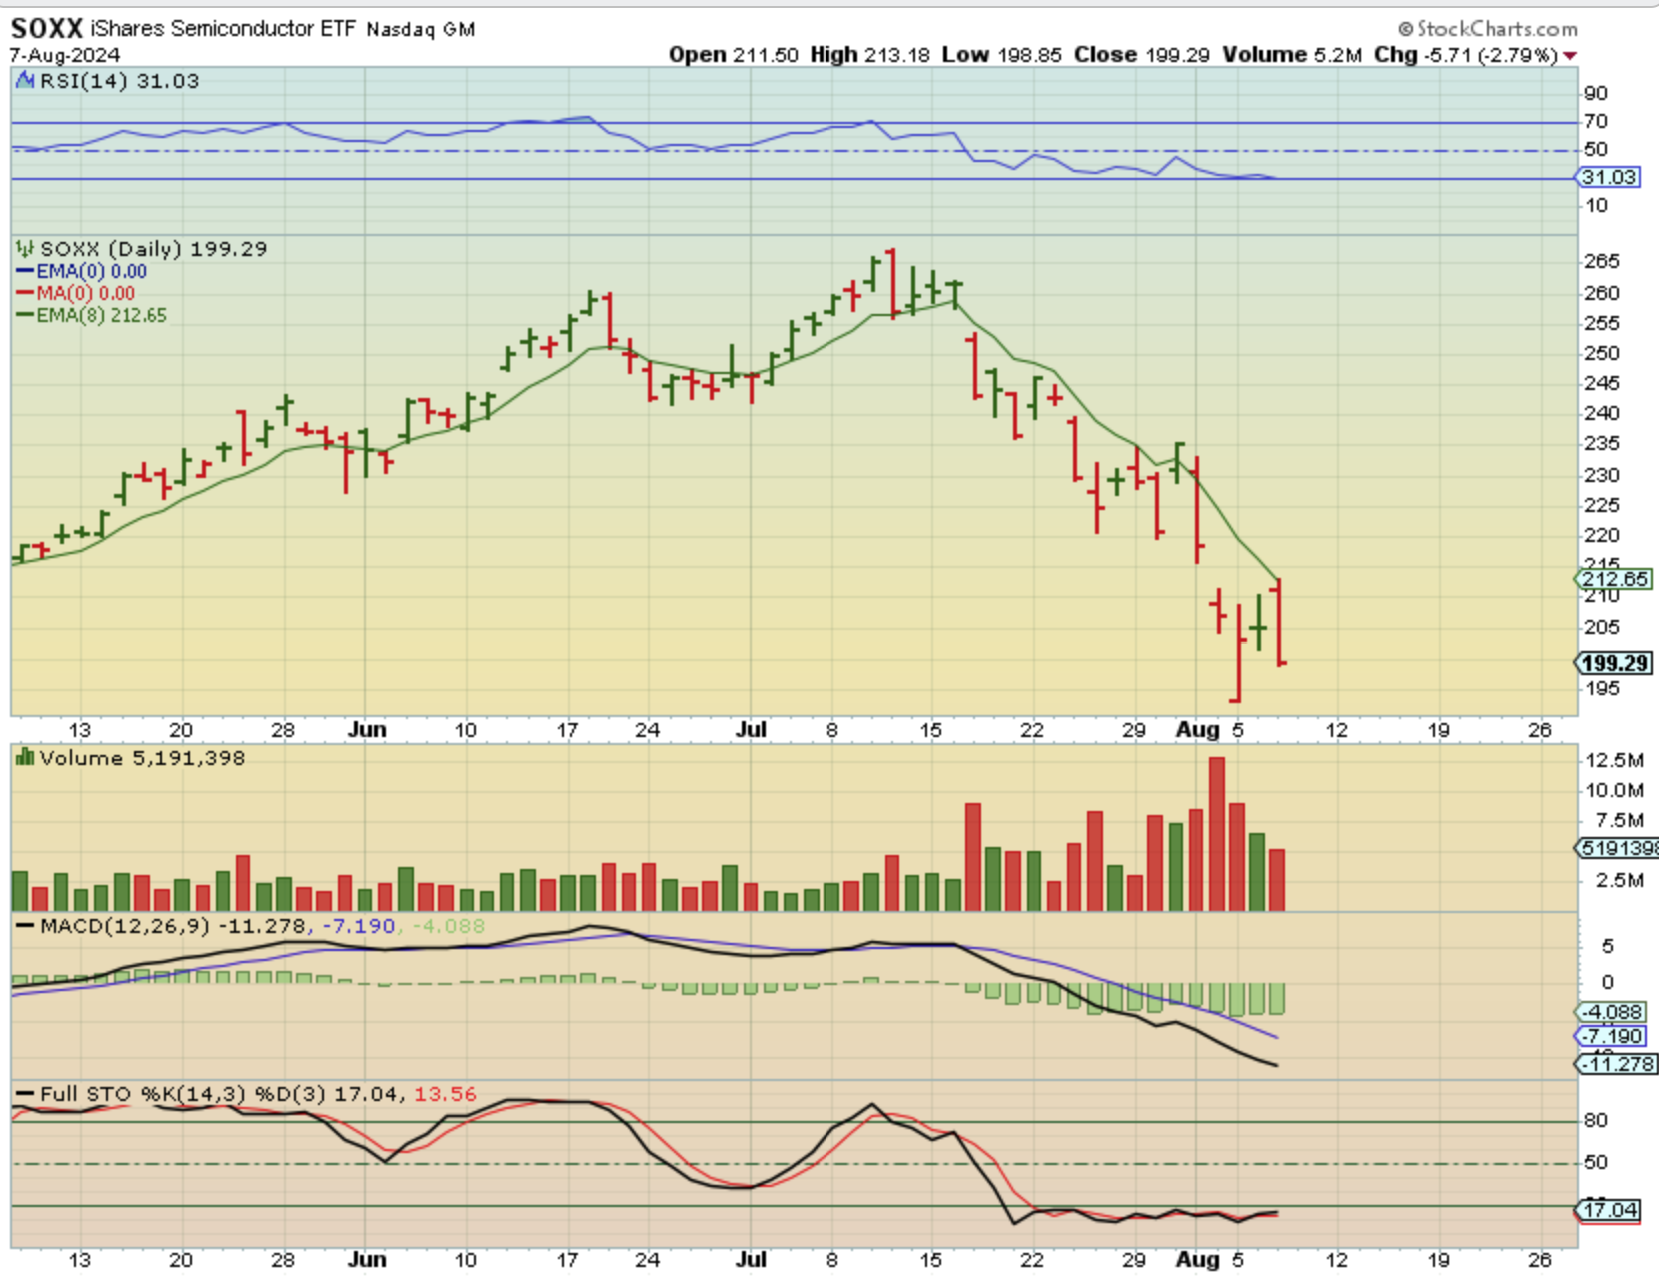
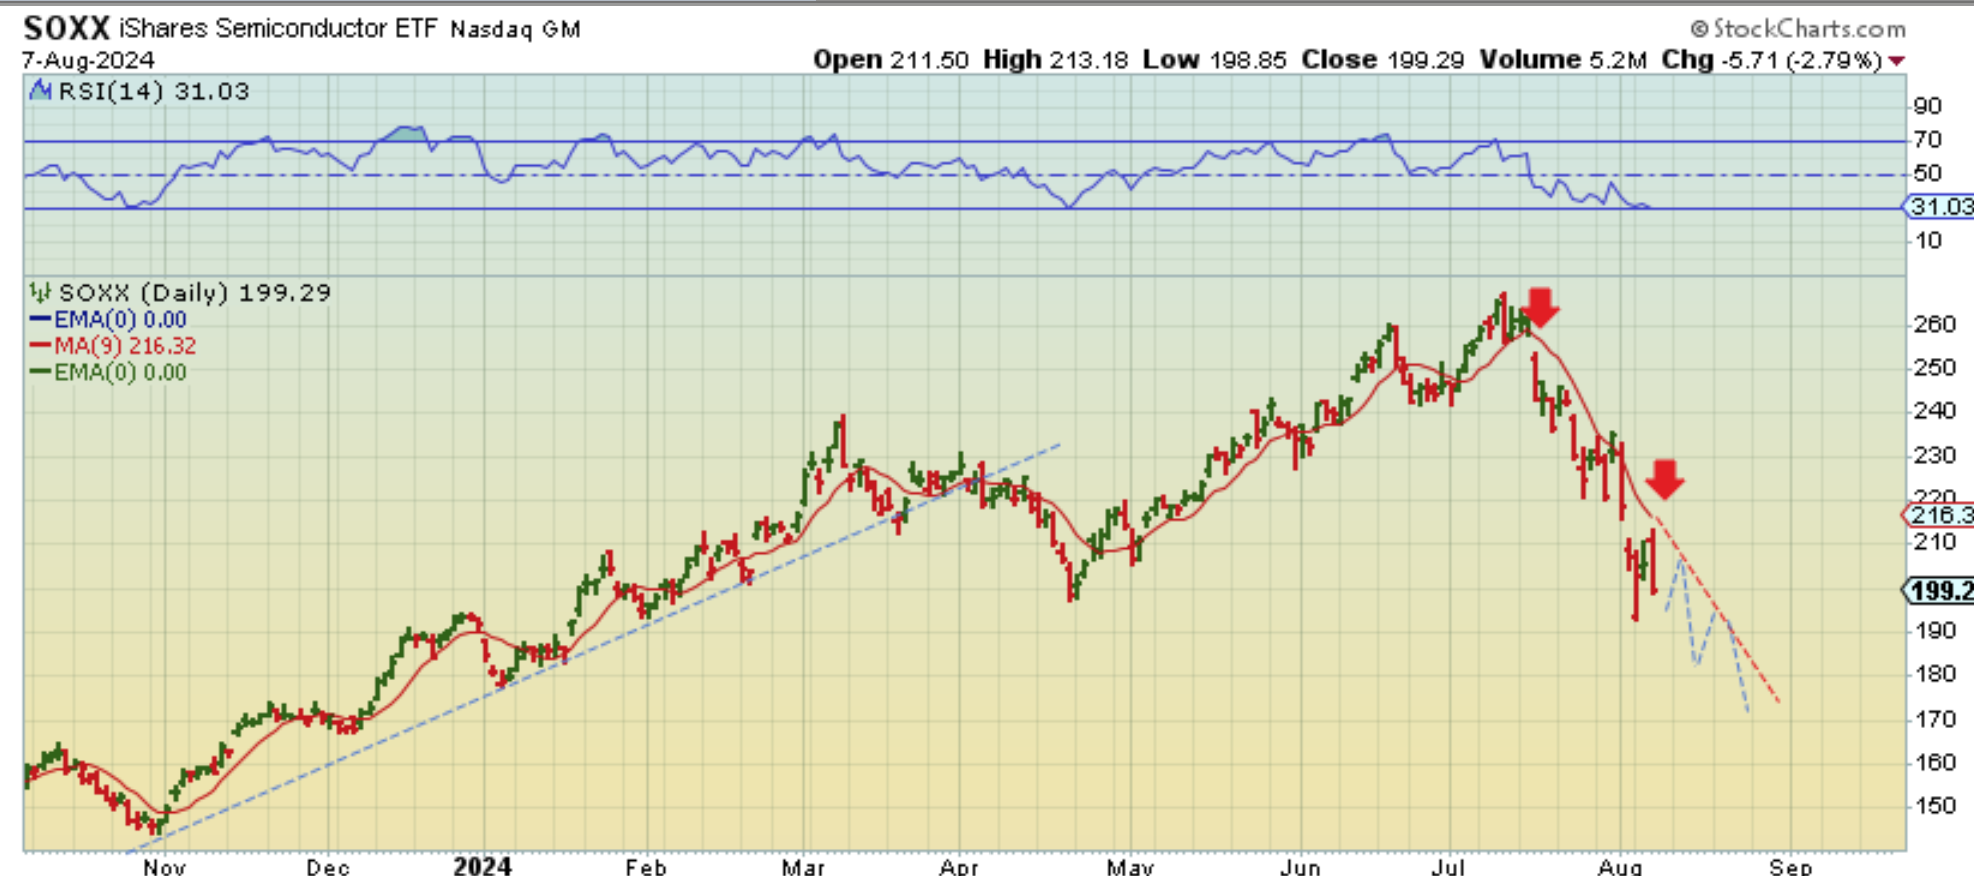
Switching to The SOXX, it also tagged that 8 ema (or 10sma area) and dropped. That was exactly what I was looking for. A bounce long in the SOXX and QQQ for 2-3 days and then a reversal lower. This is where I said that I would try to short it. So that was a good 1 day short, even if you entered SOXS at $32 or $33, since it ran to $37. Now what?
.
Now what? Well, The jobless claims report MIGHT cause a rally or a sell off, so I closed all of my TECS and most of my positions in SOXS and SQQQ. Next I’ll show you 2 ideas, since I do not think that the downside is even close to being finished yet, due to cycle timing.
,
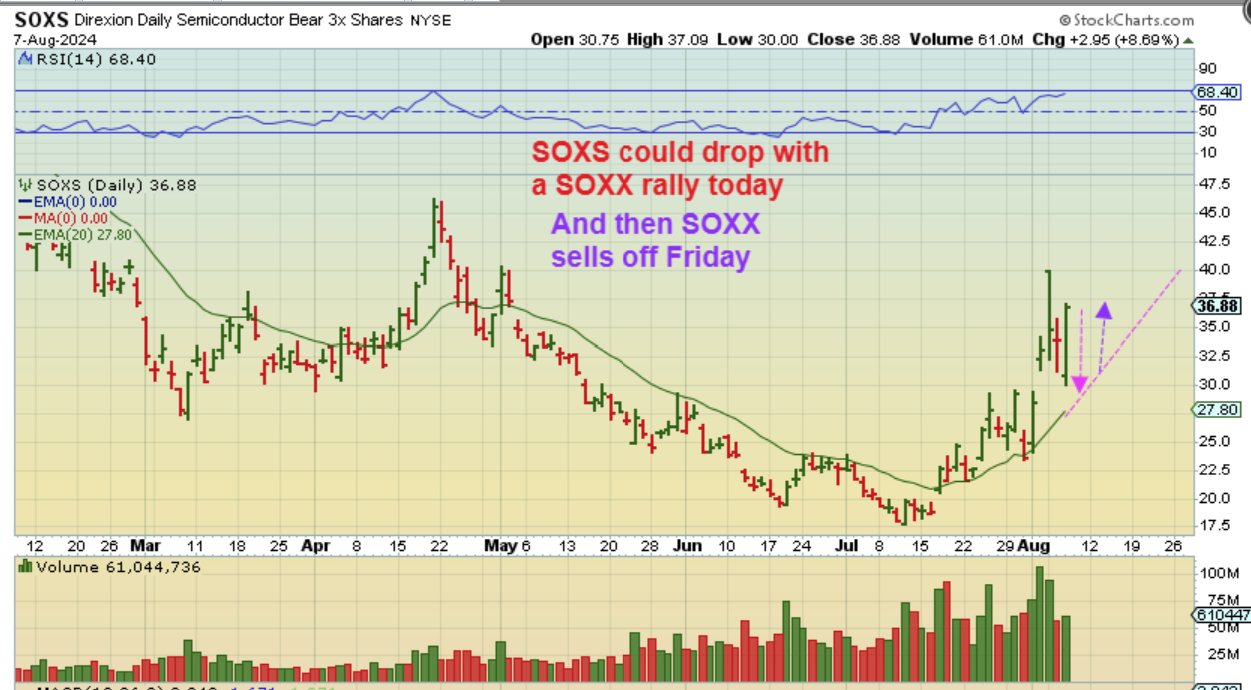
SOXS – Using the 10sma or 20 ema I noticed that price already used both, so THIS chart shows the 20ema. That 20 ema allows the SOXS to drop again today (or the General Markets SOXX & QQQ to rally after the jobless claims). This looks like the markets could rally today and then sell off tomorrow. So the opposite is that the SOXX would drop today to the 20 ema, and then rally tomorrow.
.
OR
.
SOXS – Using the 9 or 10sma. This is what I used yesterday and price has also bounced at the 10sma, as the SOXX is rejected at the 10sma. So with the 10sma hugging a little closer to price, SOXS would only drop to $32.50ish, if it drops at all. Now lets look at the LONG Charts only.
.
Now lets look at the LONG Charts only.
.
So I don’t really know that the markets will sell off THIS Sharply, unless we hit crash mode again. This is like the 2008 or 2020 covid crash, but this is an idea of where to go short IF YOU SEE A REVERSAL at the 9sma. The Bull run was strong, so now the sell off is the bulls heading for the exits all at once.
.
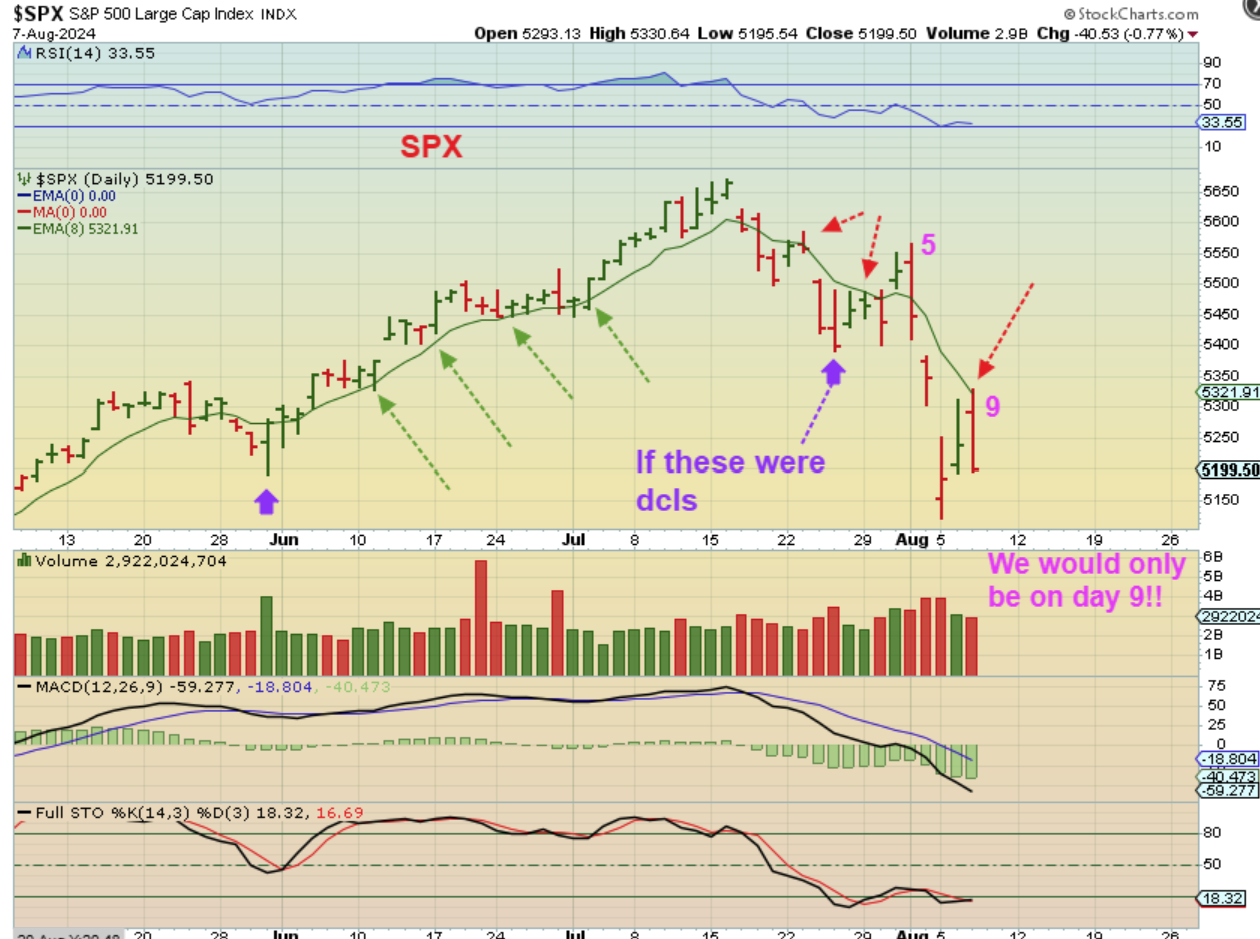
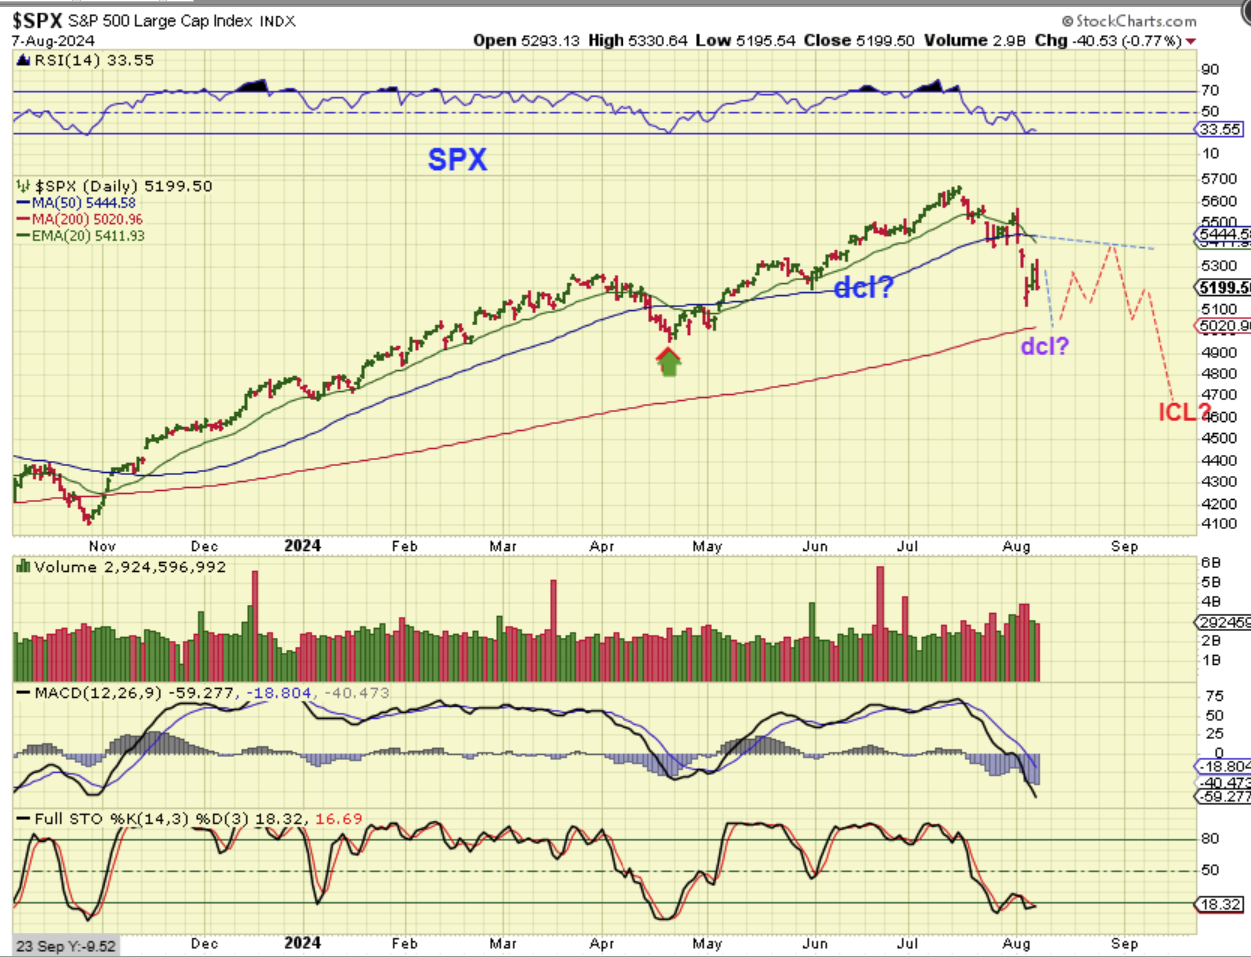
Switching to THE SPX and also using the 8 ema (or 9 or 10sma) and the selling picked up there again. LET ME SHOW YOU THE SET UP USING CYCLES.
.
SPX #1: We know where I said the dcls were using the SOXX, but what if the dcl was in late May like other cycle guys were saying (purple arrows)? Then we would have had a dcl 9 days ago. Whoa! If we are only on day 9 in this drop, we’d have over 20+ days left to the downside in the 3rd daily cycle. This would cause a huge crash, i.m.h.o.
.
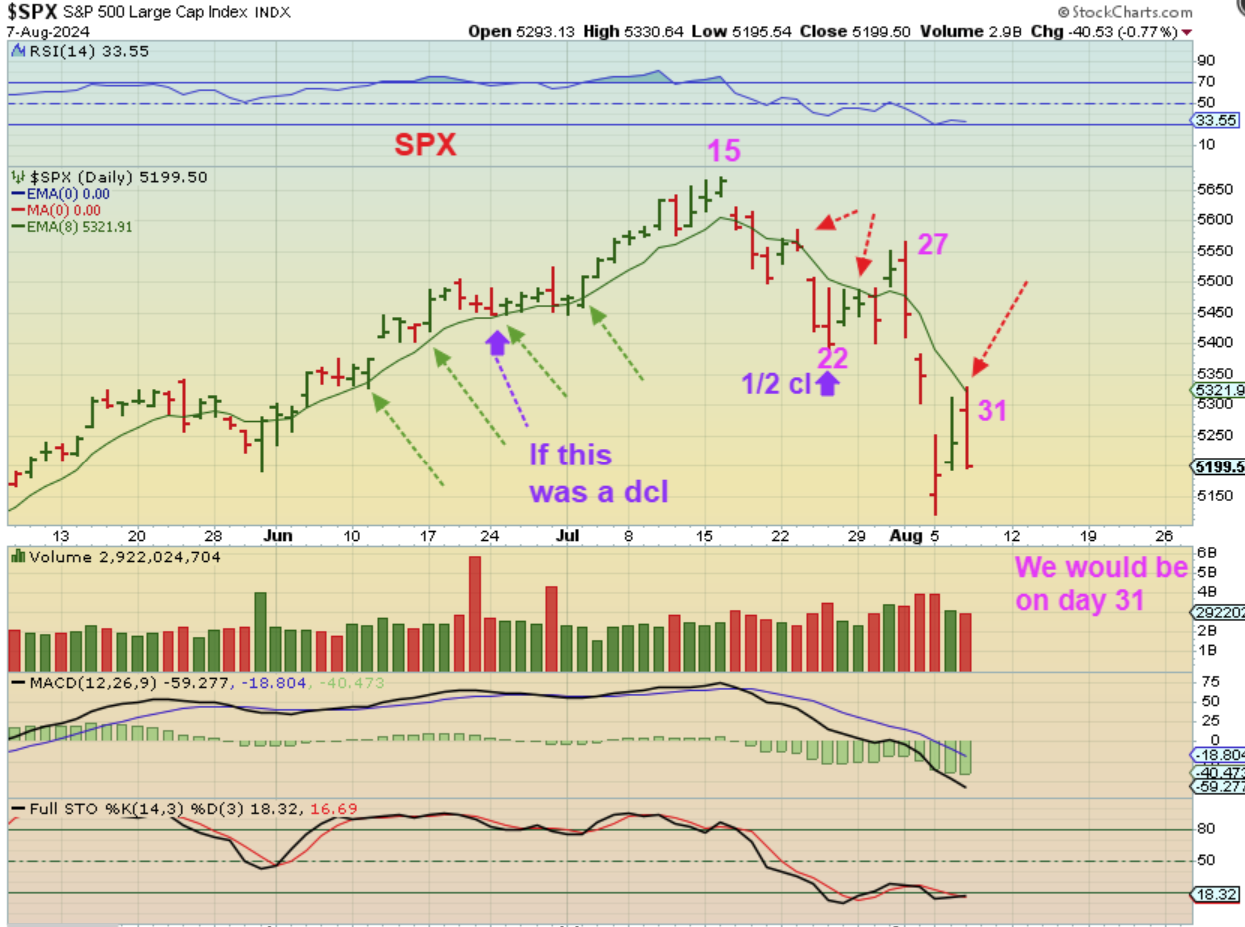
SPX #2 – I said that I thought the SOXX gave us a dcl around June 24. THAT would put us on day 31 and a dcl would be ready to form much sooner. Daily cycles can run over 40 days long, but in a crash, they can finish up quicker due to exhaustion. EITHER WAY–MORE DOWNSIDE IS COMING.
.
SPX #3 – And the big picture is obvious, even though the exact path isn’t. Good news here and there may cause bounces and dcls along the way, but overall, I still expect this sell off to continue lower. We have failed dcls.
.
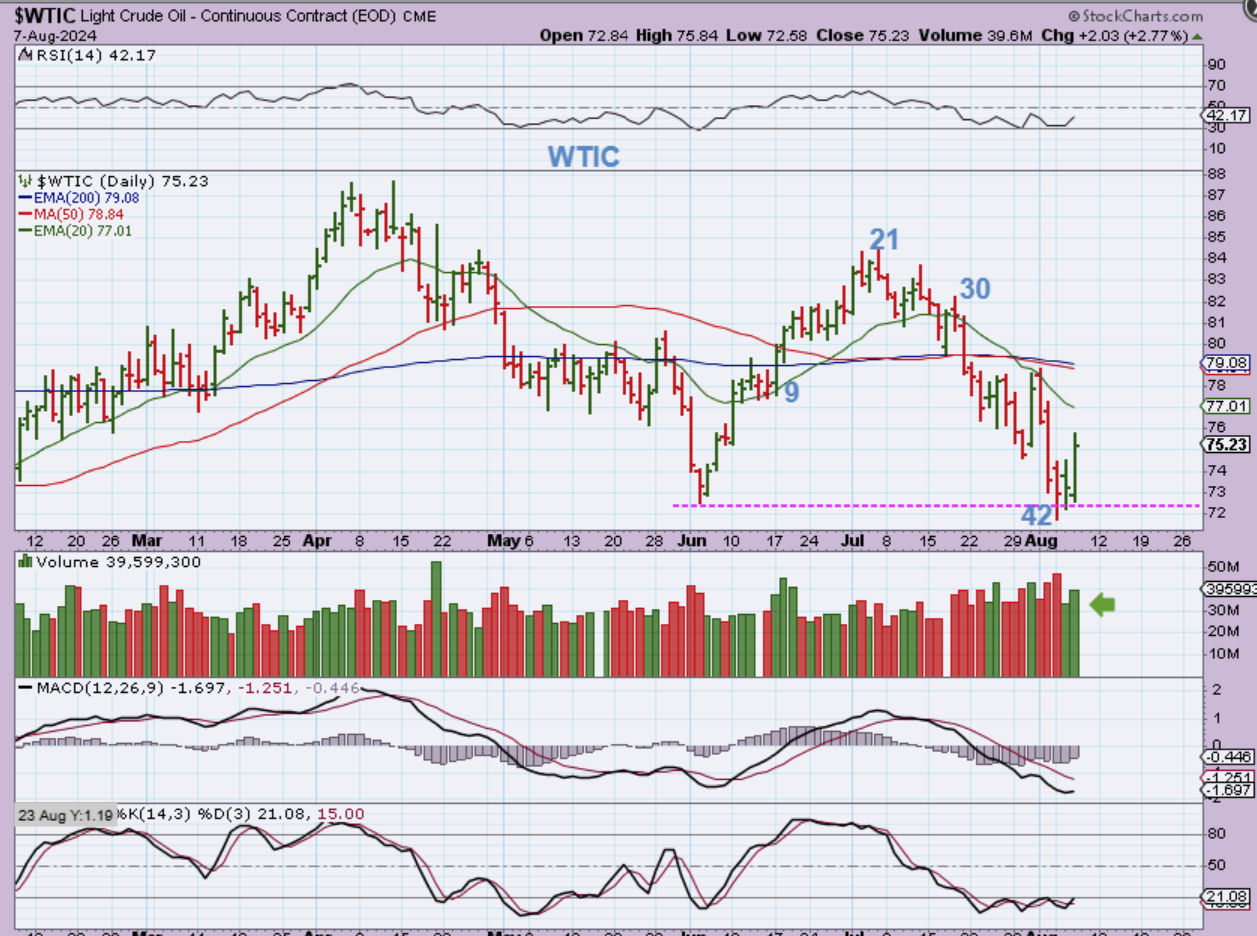
WTIC – Guess what did NOT get caught up in the sell off yesterday? Oil. It may have just given us a shakeout dcl at day 42.
.
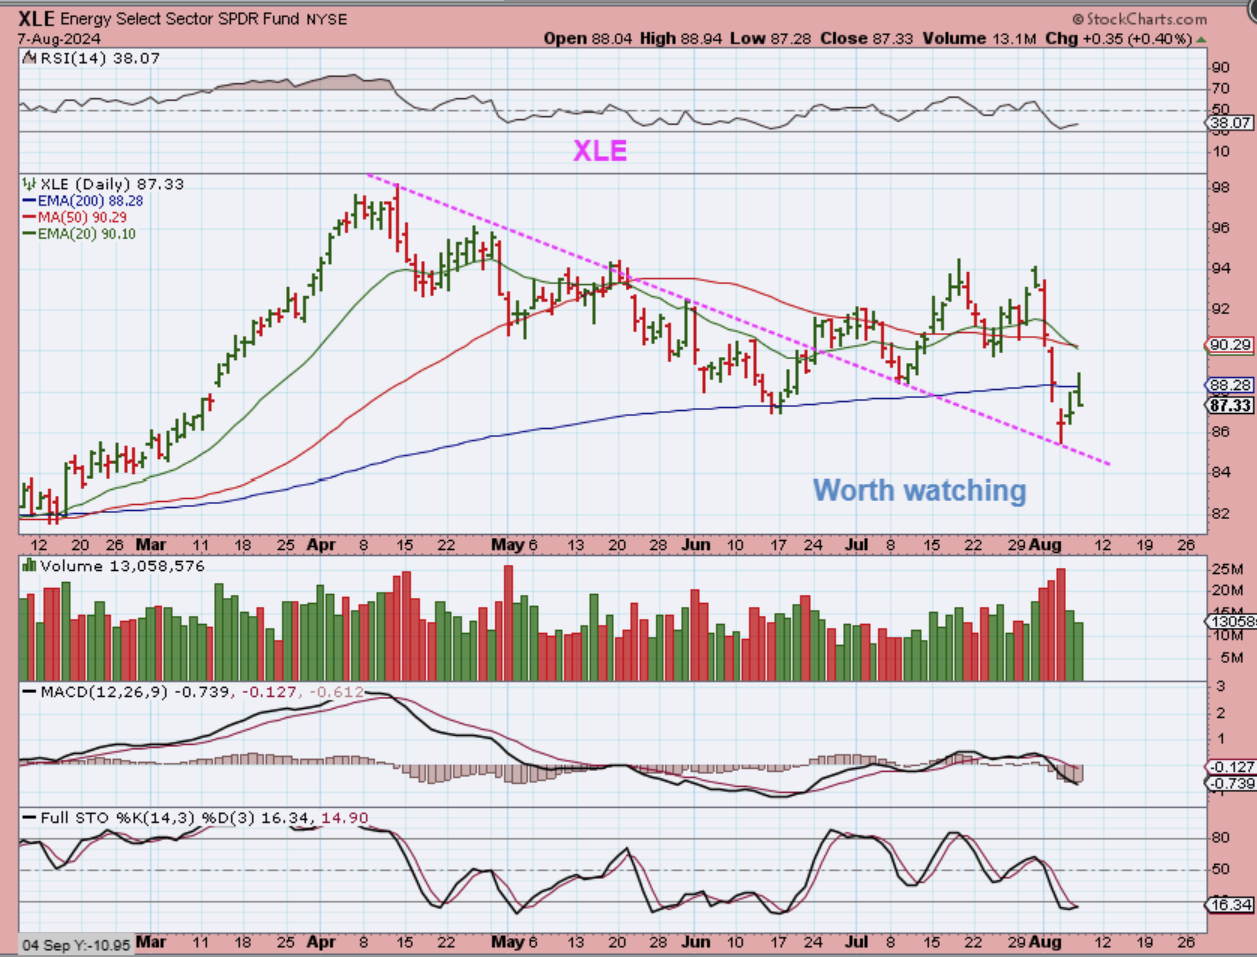
THE XLE & XOP were green, but they did start to sell down lower when the General Markets sold off, so this is promising, but I remain cautious.
.
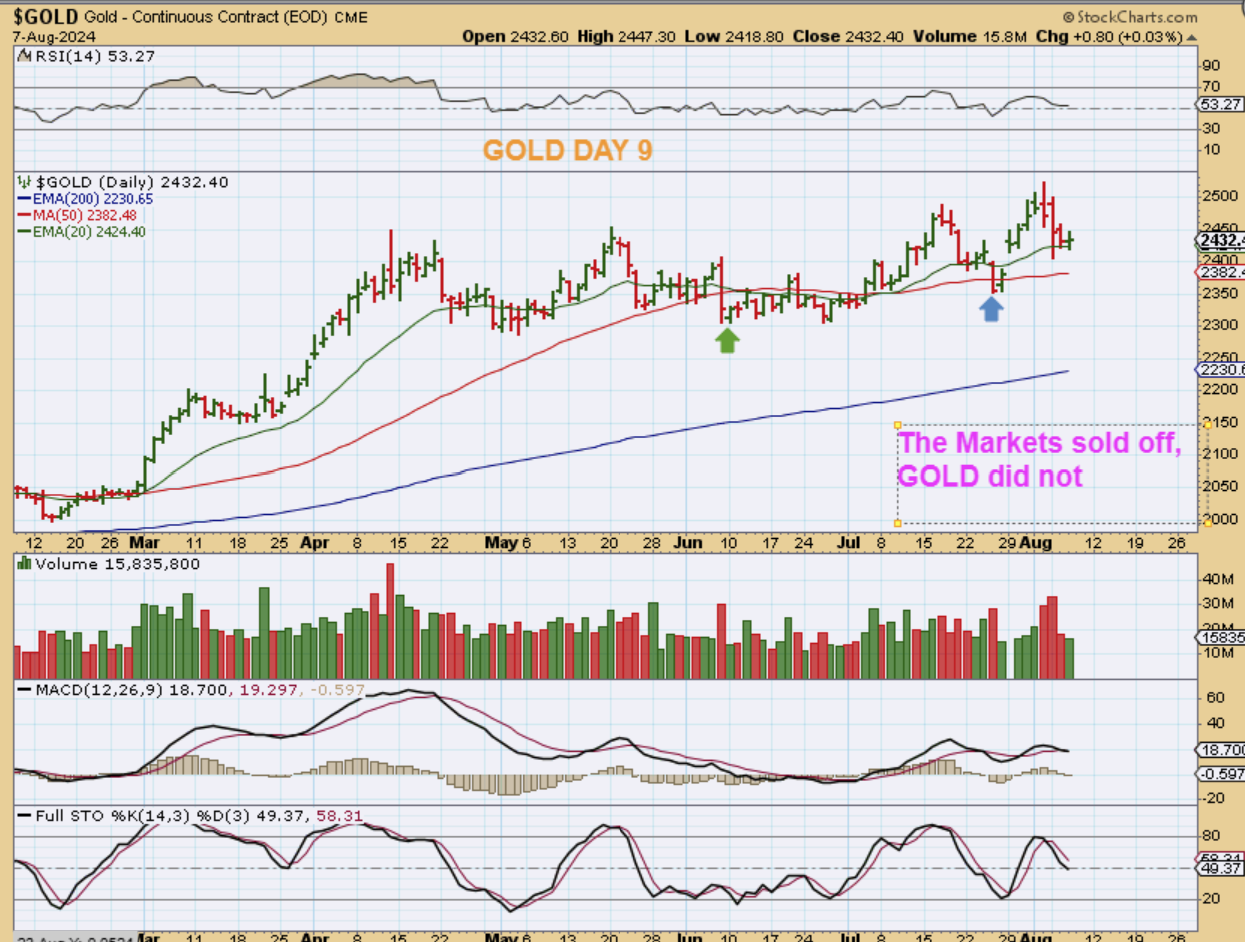
As the General Markets sold off, GOLD was holding up nicely, and that is encouraging. It could churn sideways and build up steam to break to new highs, but so far it is a continuing consolidation.
.
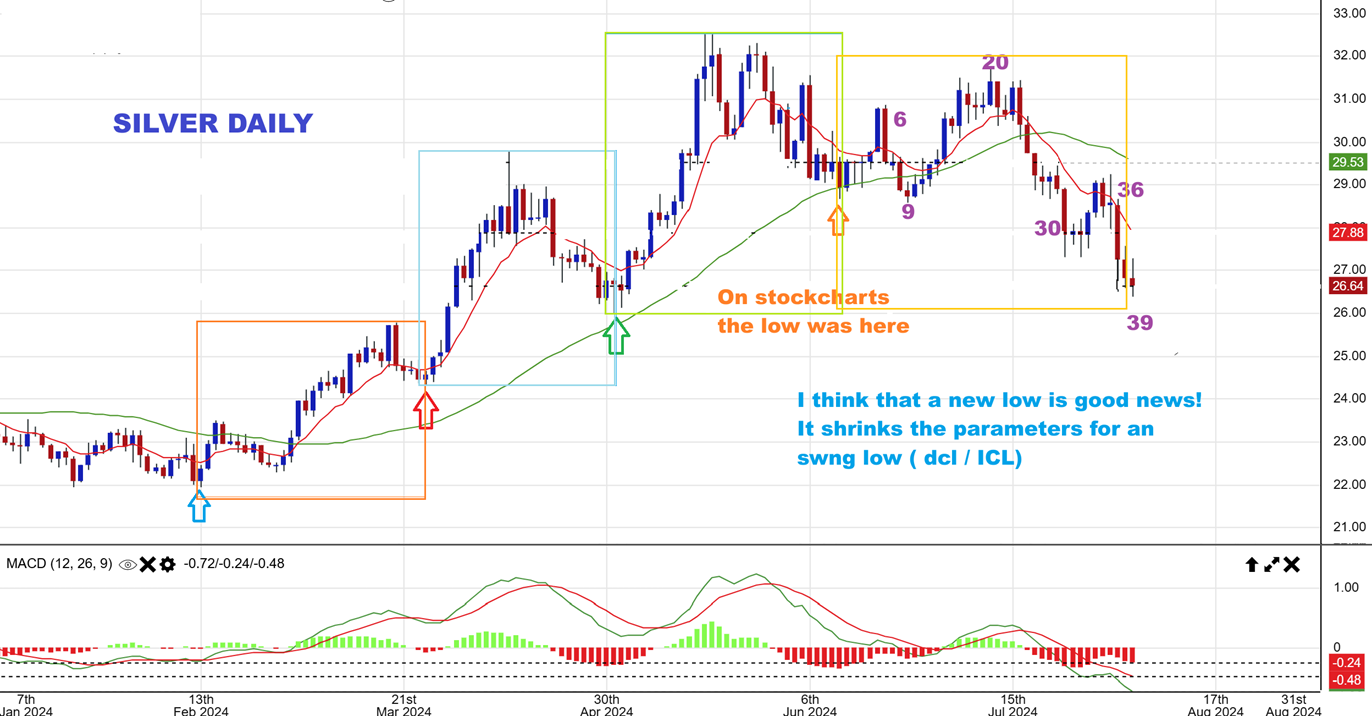
SILVER is due for a dcl (or ICL), so making a slight new low is actually a good thing. The larger selling candles are gone and this lowers the parameters for a swing low to form here at day 39. I”M INTERESTED IN KEEPING AN EYE ON SILVER & SILVER MINERS AT DAY 39.
.
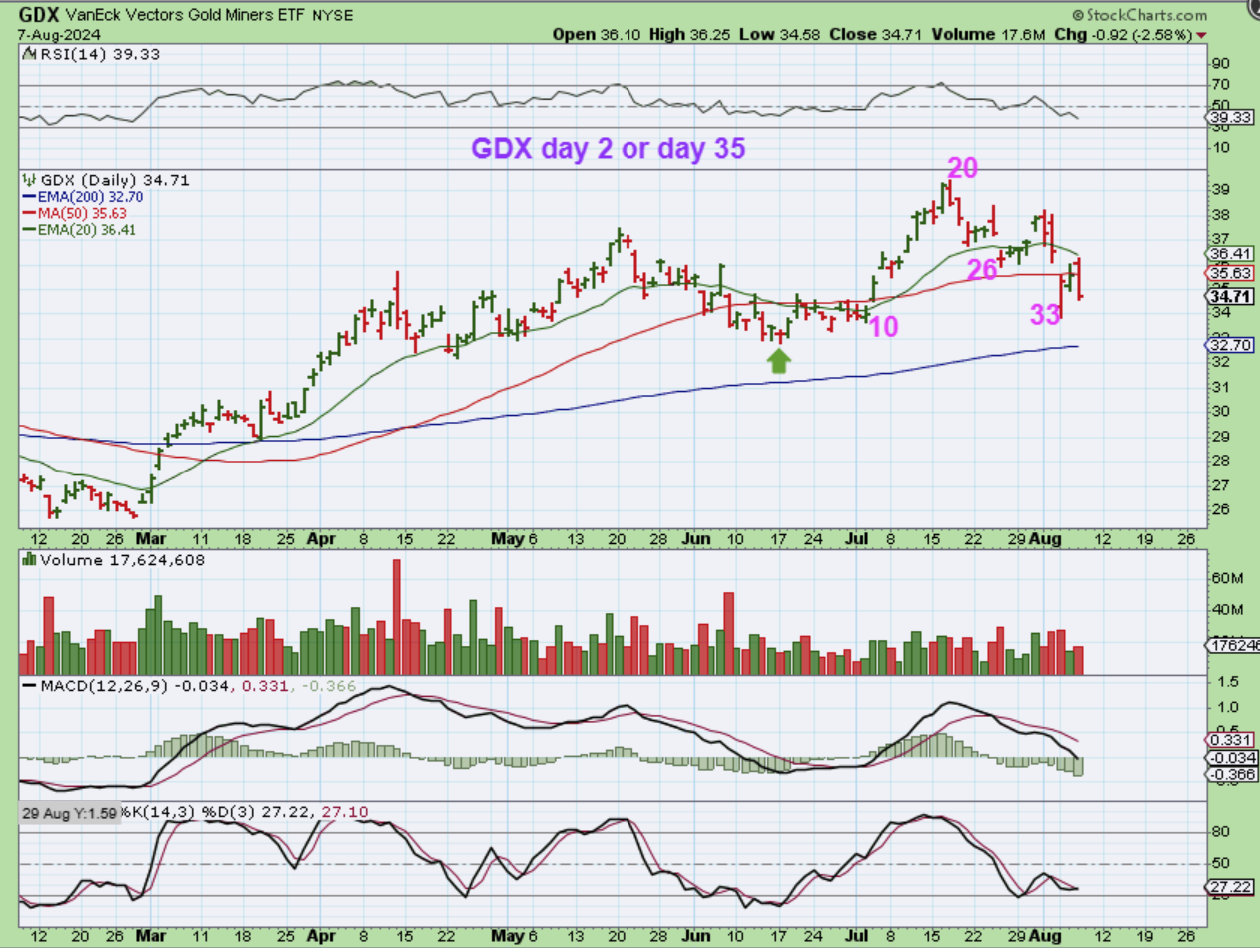
GDX sold off with the markets, and was also rejected at the 20ema, so I’m wondering: Is GDX at day 35? Or is this day 2? Time will tell.
.
So after gapping open higher to the 9sma, the General Markets started to slide and by midday the selling seemed persistent. Today is the Jobless Claims report and that can cause more selling if the number shows that the economy is weakening. If you are trading, USE STOPS, the volatility & markets direction seems to be on a day to day basis. I do like that Gold is holding up in the 2nd daily cycle and that Silver may be ready to find a low. They still look good to me. MINERS could even start to react more to the Metals over time, so let’s look for that. I’ll cover Bitcoin below, Cryto stocks tanked with the selling. Enjoy your Thursday trading.
.
~ALEX
.
RECENTLY:
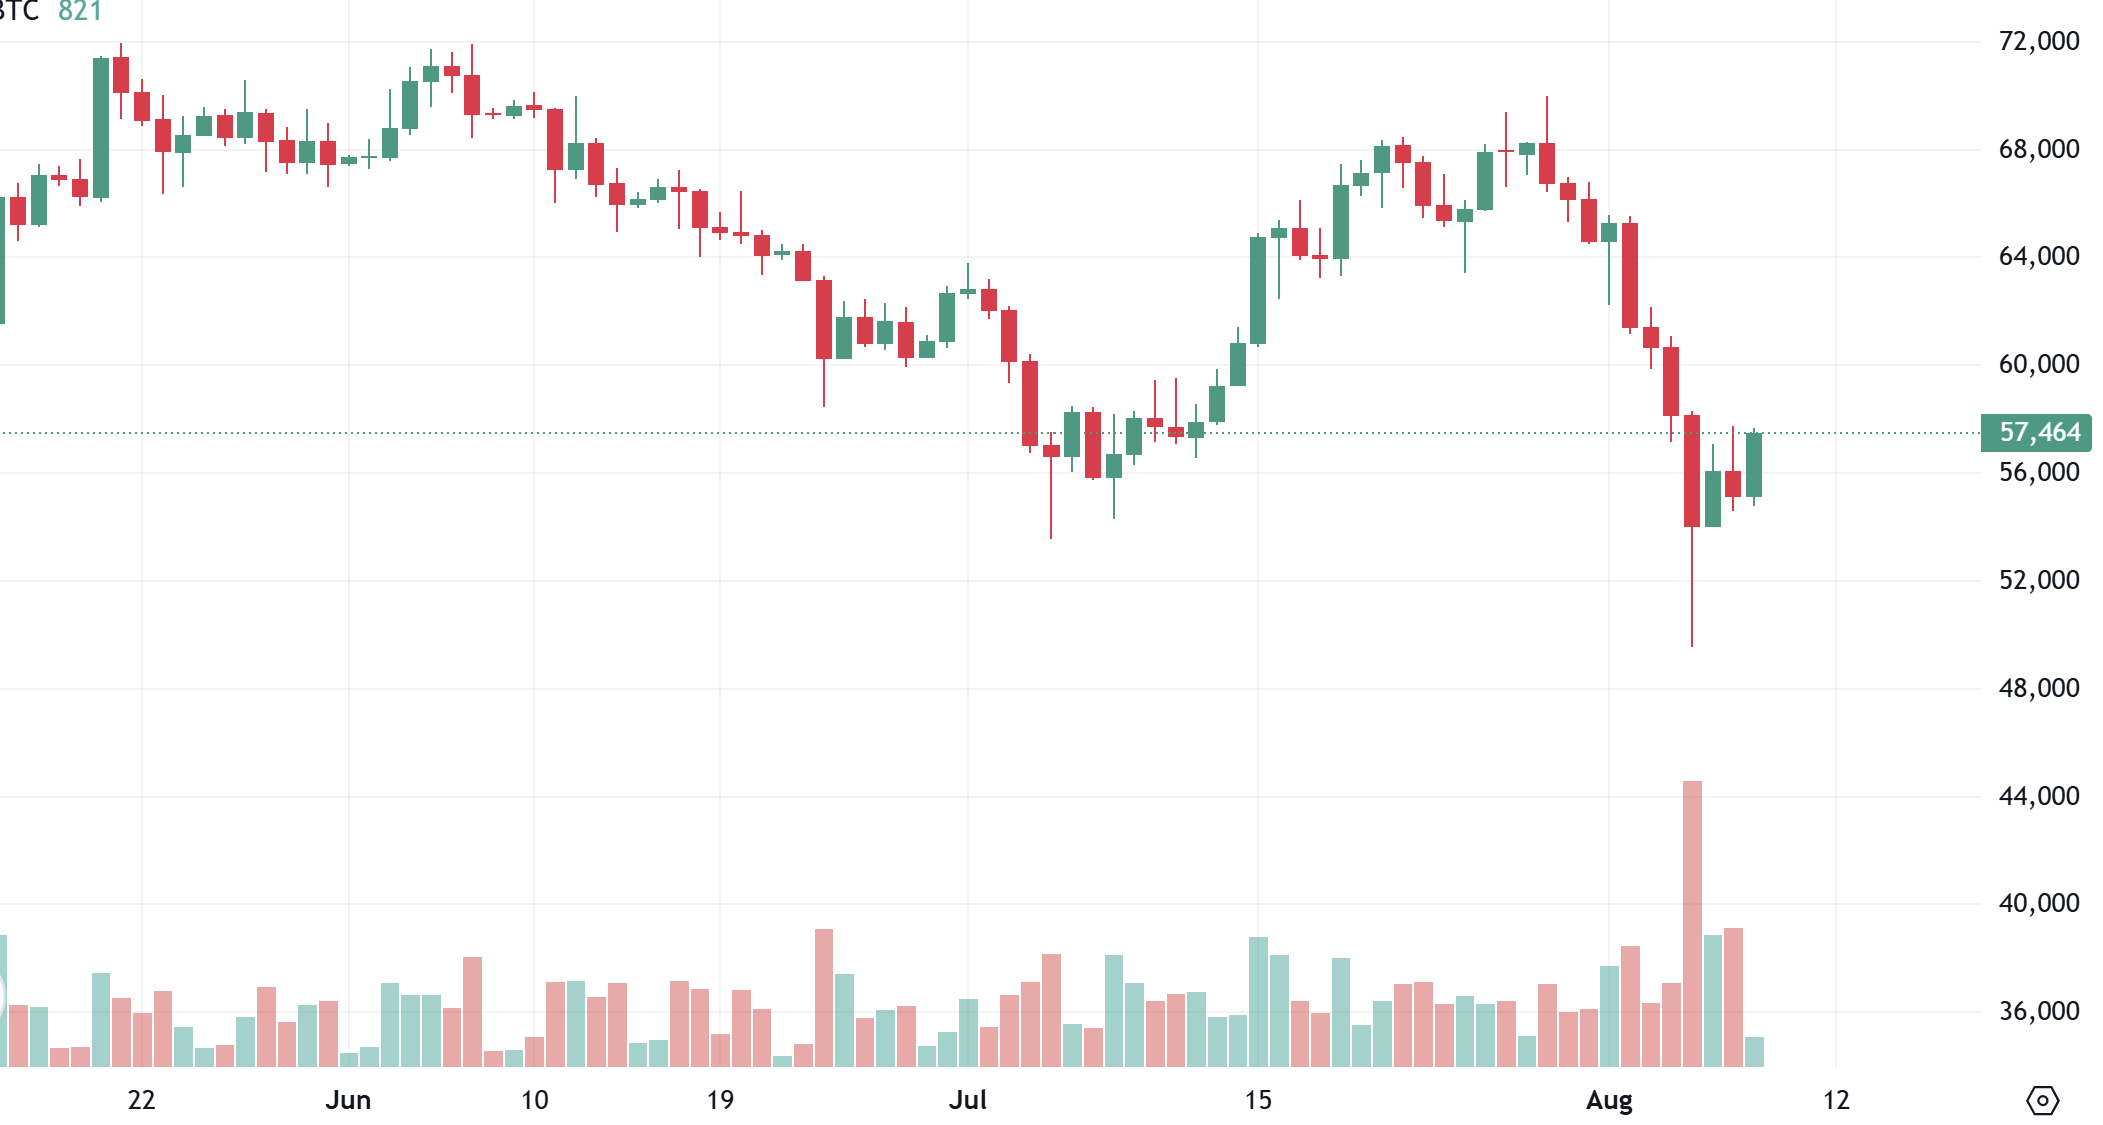
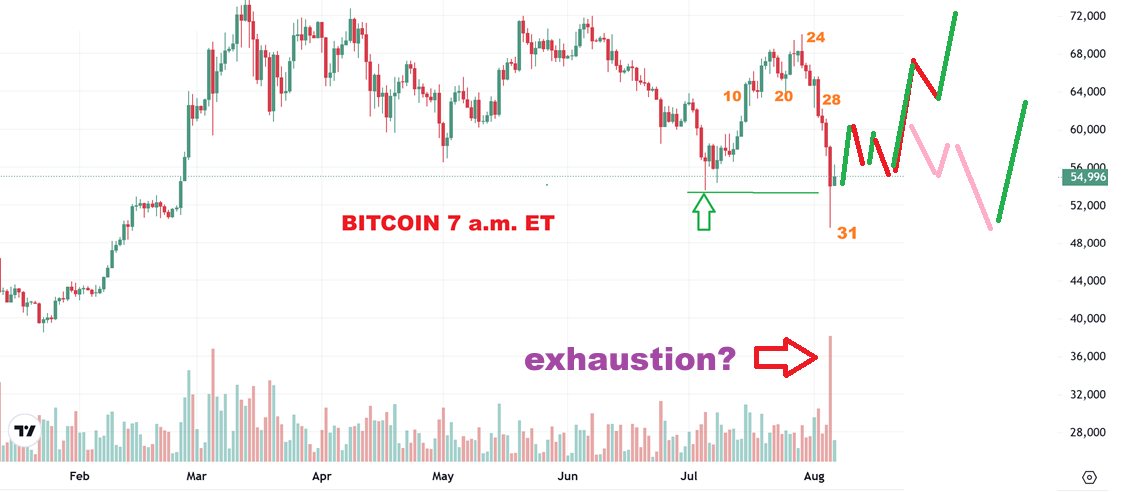
Bitcoin broke the lows and at this point it should indicate that day 60 will make even a new lower low later.
That said, I will just mention that if we just saw a ‘shakeout’, with capitulation / exhaustion volume, there is always a chance that we get an Anomaly or an extremely rare overshoot crash that recovers. I DON’T LIKE TO SPREAD FALSE HOPE, AND I DON’T LIKE TO BREAK THE RULES, but that volume and reversal candle does look like a shakeout.
.
So I am watching Crypto stocks for clues too. I still have to expect another low like the pink path, but I just wanted to point out a very small possibility that we get an anomaly recovery.
.
BITCOIN DAILY 6 a.m. Wednesday: I said that We were seeing the move out of the lows now, and remember that the General Markets also saw futures higher and the markets gapped open higher (BUT THEN SOLD OFF).
.
BITCOIN 1 hr chart – I SAID THAT I SAW A BEARISH RISING WEDGE, expect a break lower.
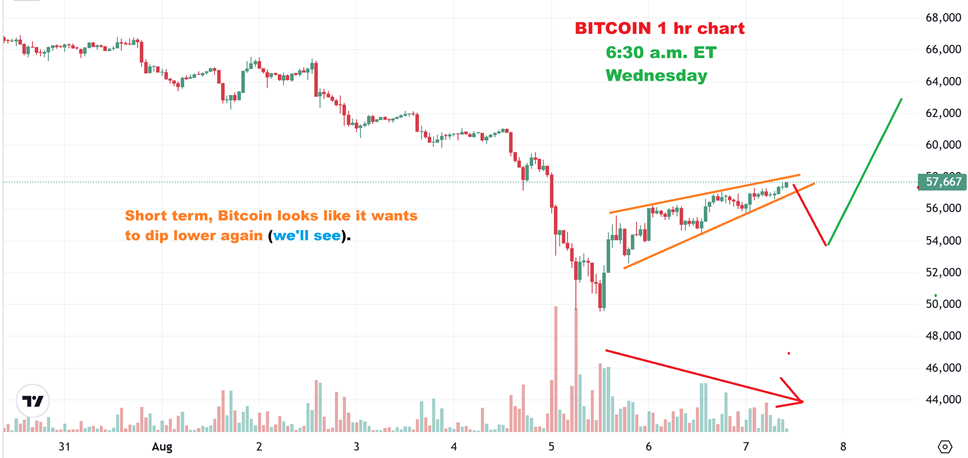
BITCOIN 1 hr chart – Bitcoin actually did start to sell off when the General Markets started to dip lower too. We now know that the General Markets sold off all day long, so did BITCOIN sell off all day too? It was at $56,000 when I grabbed this in the morning.
.
.
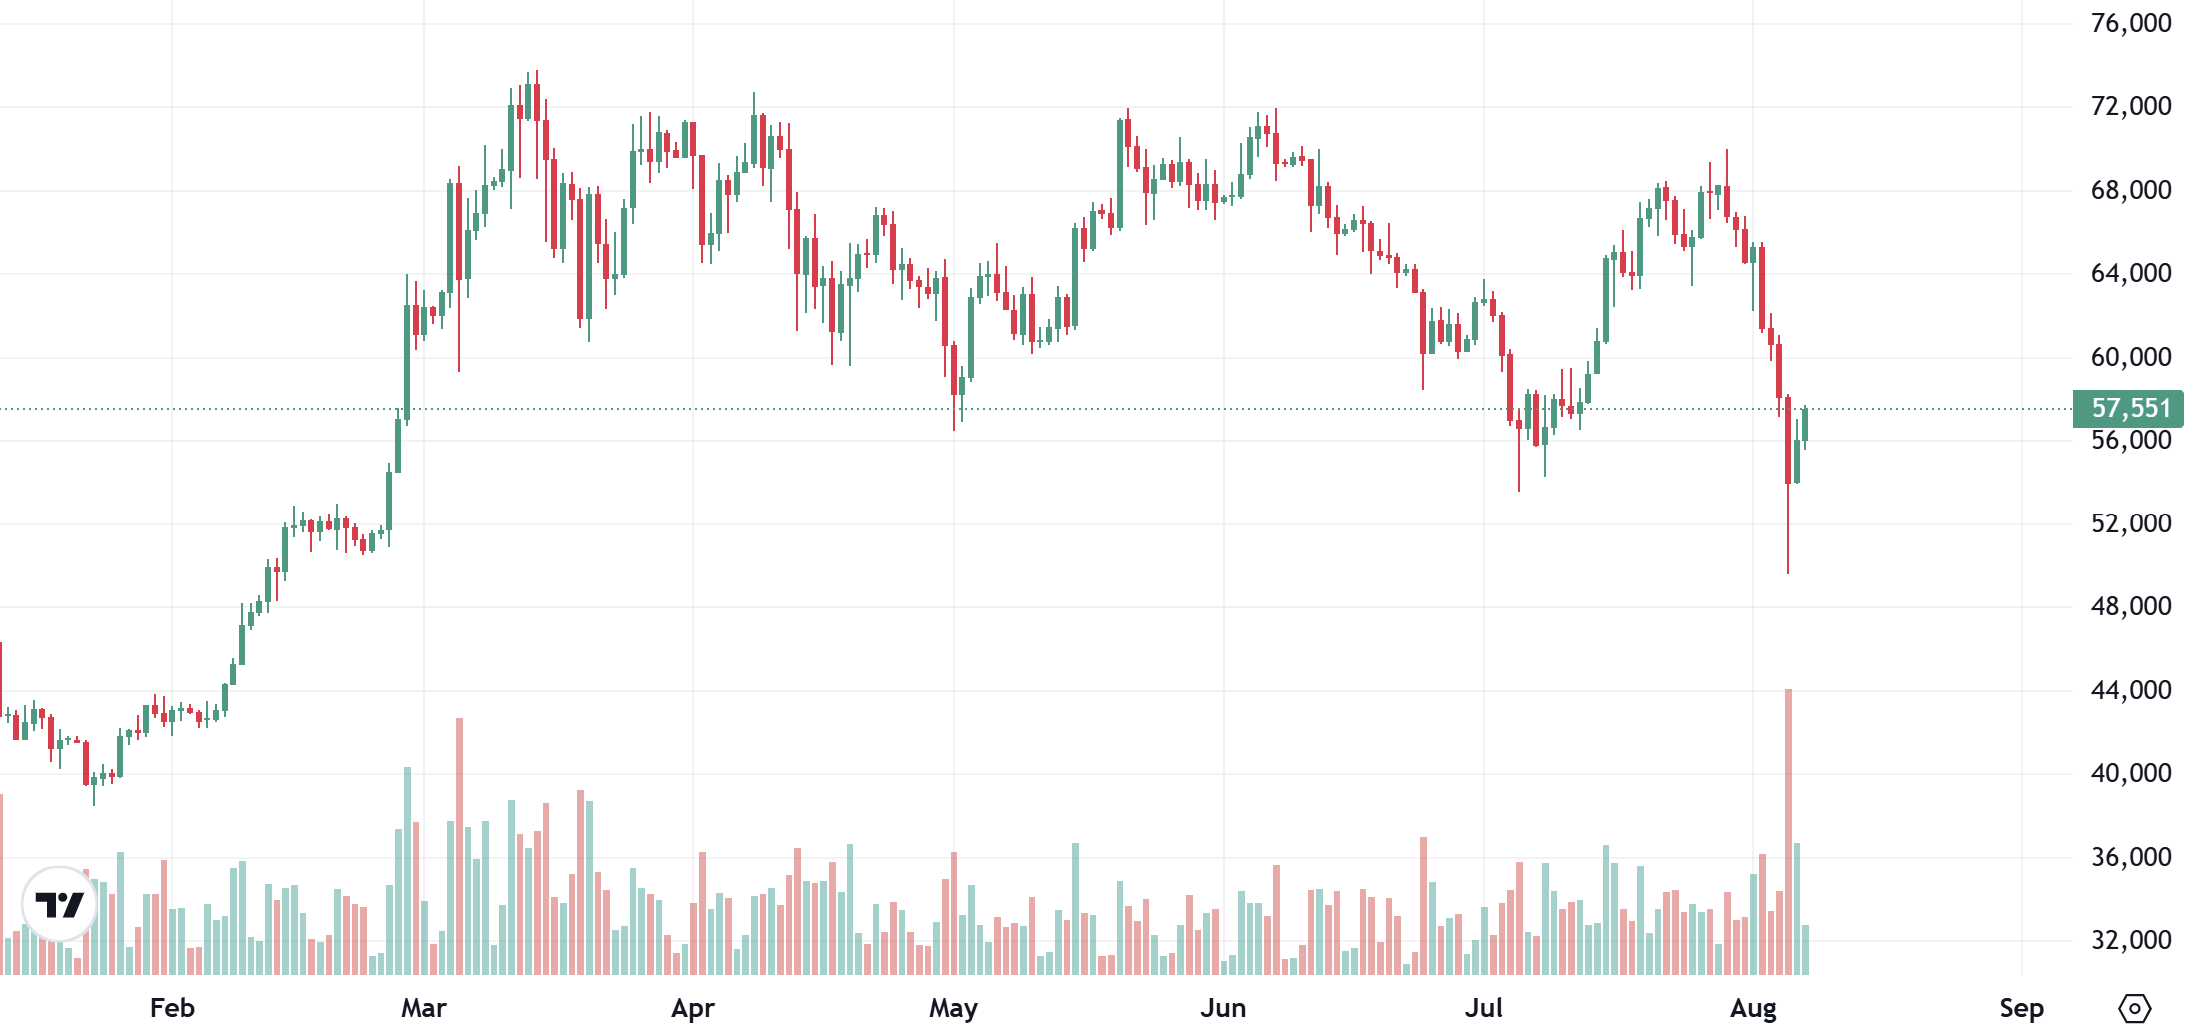
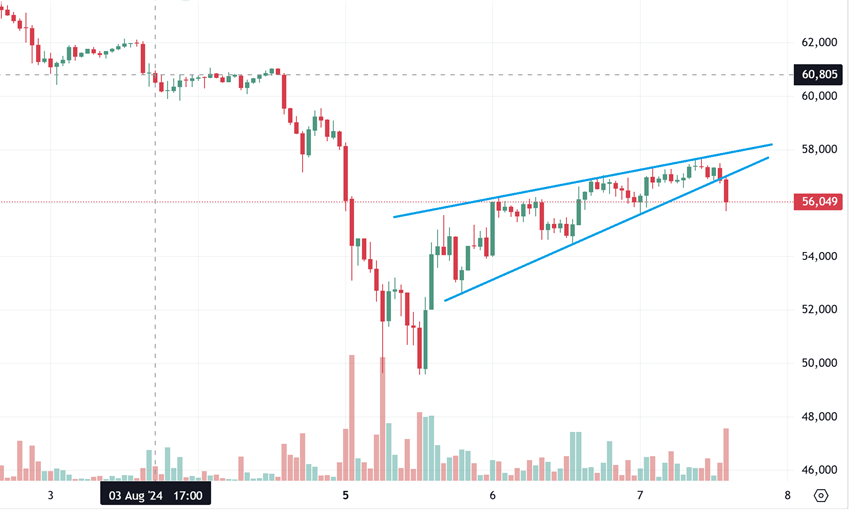
BITCOIN did sell off to $54,600 yesterday, but then started to run higher overnight. Bitcoins lows (30 day) should be in place, so it MIGHT start to resist the General Markets sell off. Crypto Miners are worth watching in this setting, but yesterday they sold off all day long.