Friday August 16th – These Markets are …
There is minimal Data today, but obviously from what we’ve seen this week, these markets are Data Proof as they come out of the slam down lows. Let’s just go to the charts…
.
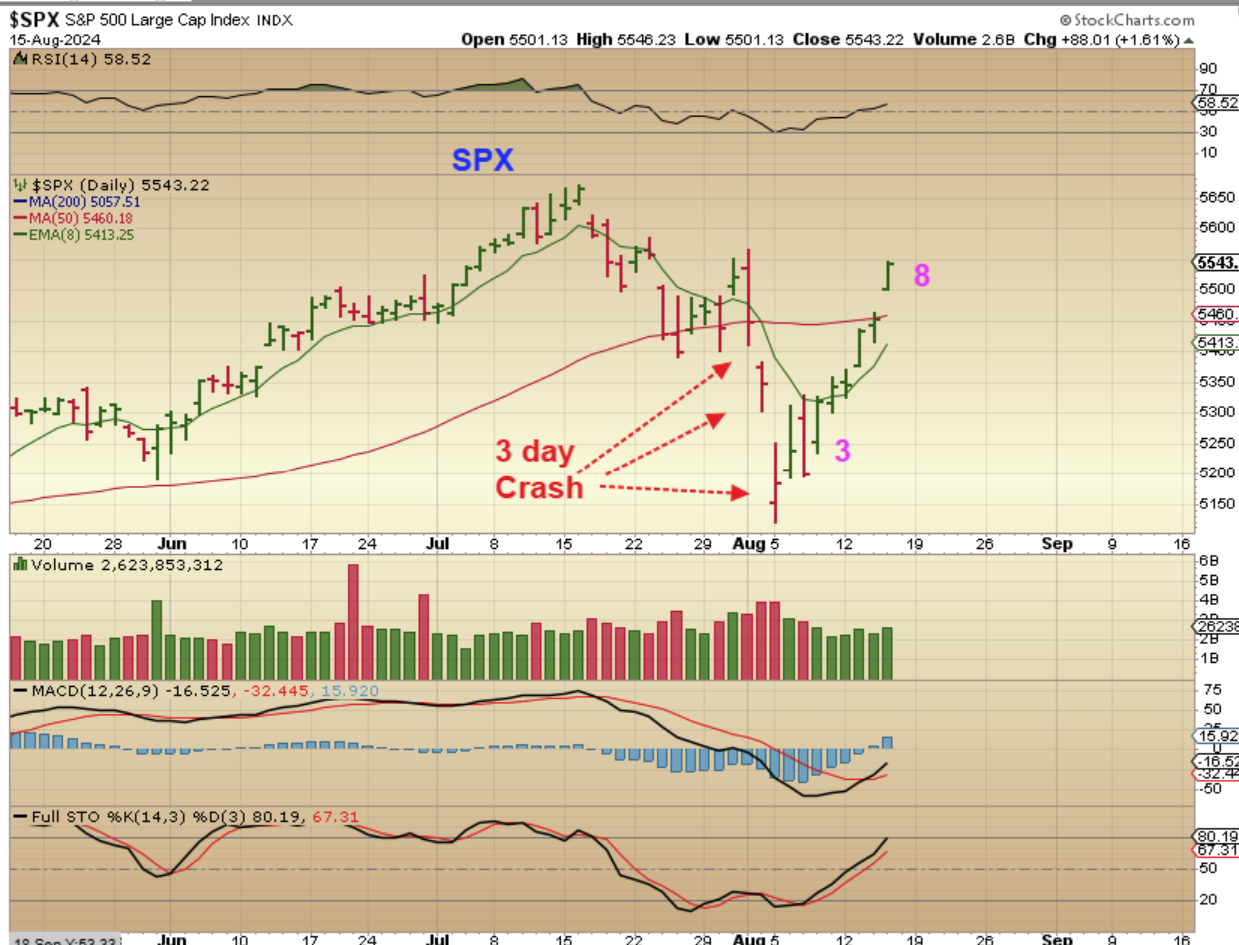
Let’s discuss The SPX:
1. We had a severe 3-day post-Fed crash that erased months of gains and broke prior lows causing failed daily cycles.
2. The first couple of days out of the lows were very volatile and so we saw LARGE swings up and down.
3. Now however, only a few days later, the markets have moved swiftly higher. The SPX gapped up and over the 50sma, and that is impressive…
.
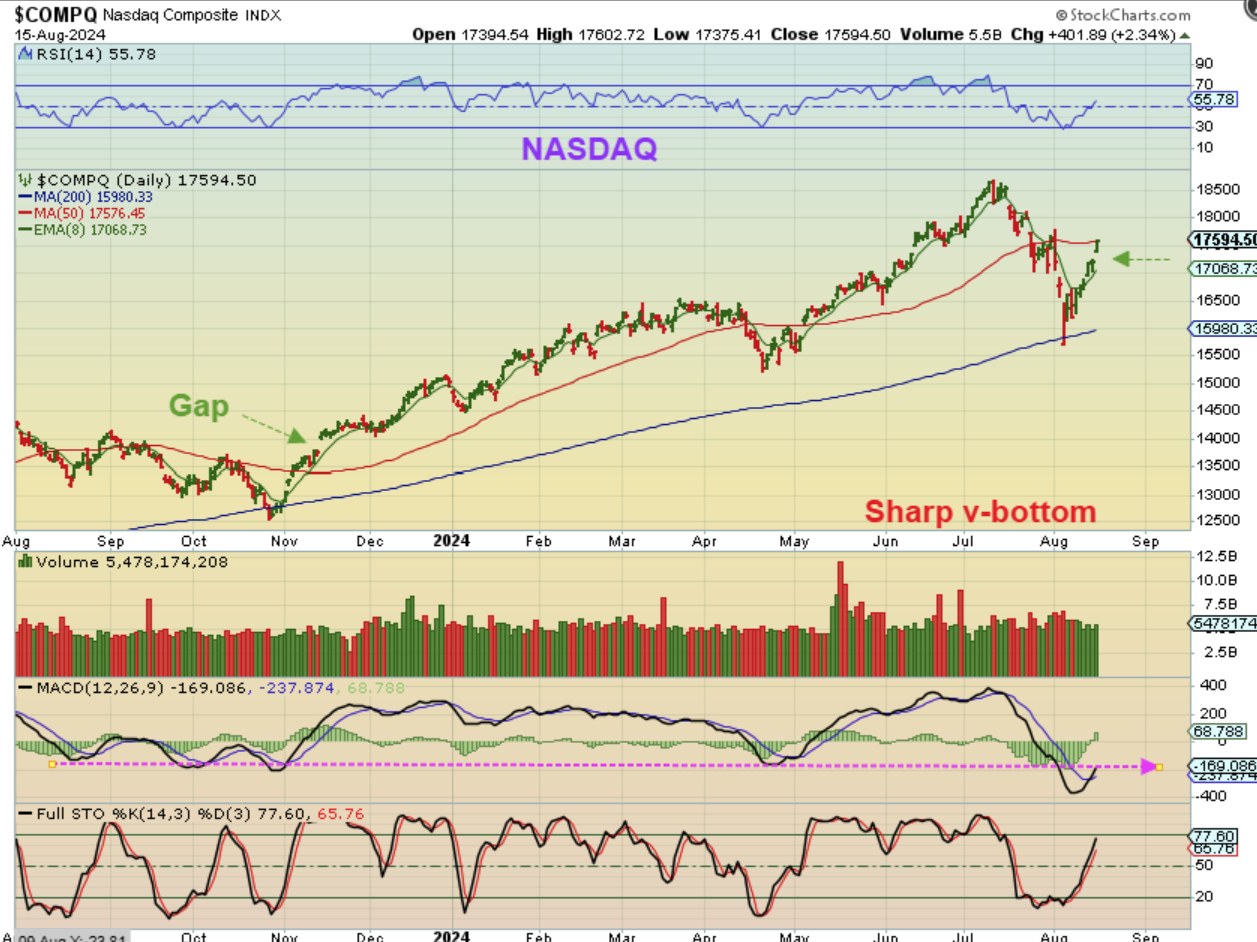
A BIGGER PICTURE LOOK:
.
THE NASDAQ gapped up and ran to the 50sma, which in the past has acted like resistance, but this market is on a tear, so we’ll see if it stalls or not. In 2023 when the markets gapped up, they chopped a little higher and then went sideways for a couple of weeks, as seen here. Also…
.
Also take a look at that MACD. We just went from the highest MACD peak since 2022, to the deepest MACD low since 2022, all in one swift swoop. Has this happened in Bear market sell offs in the past?
.
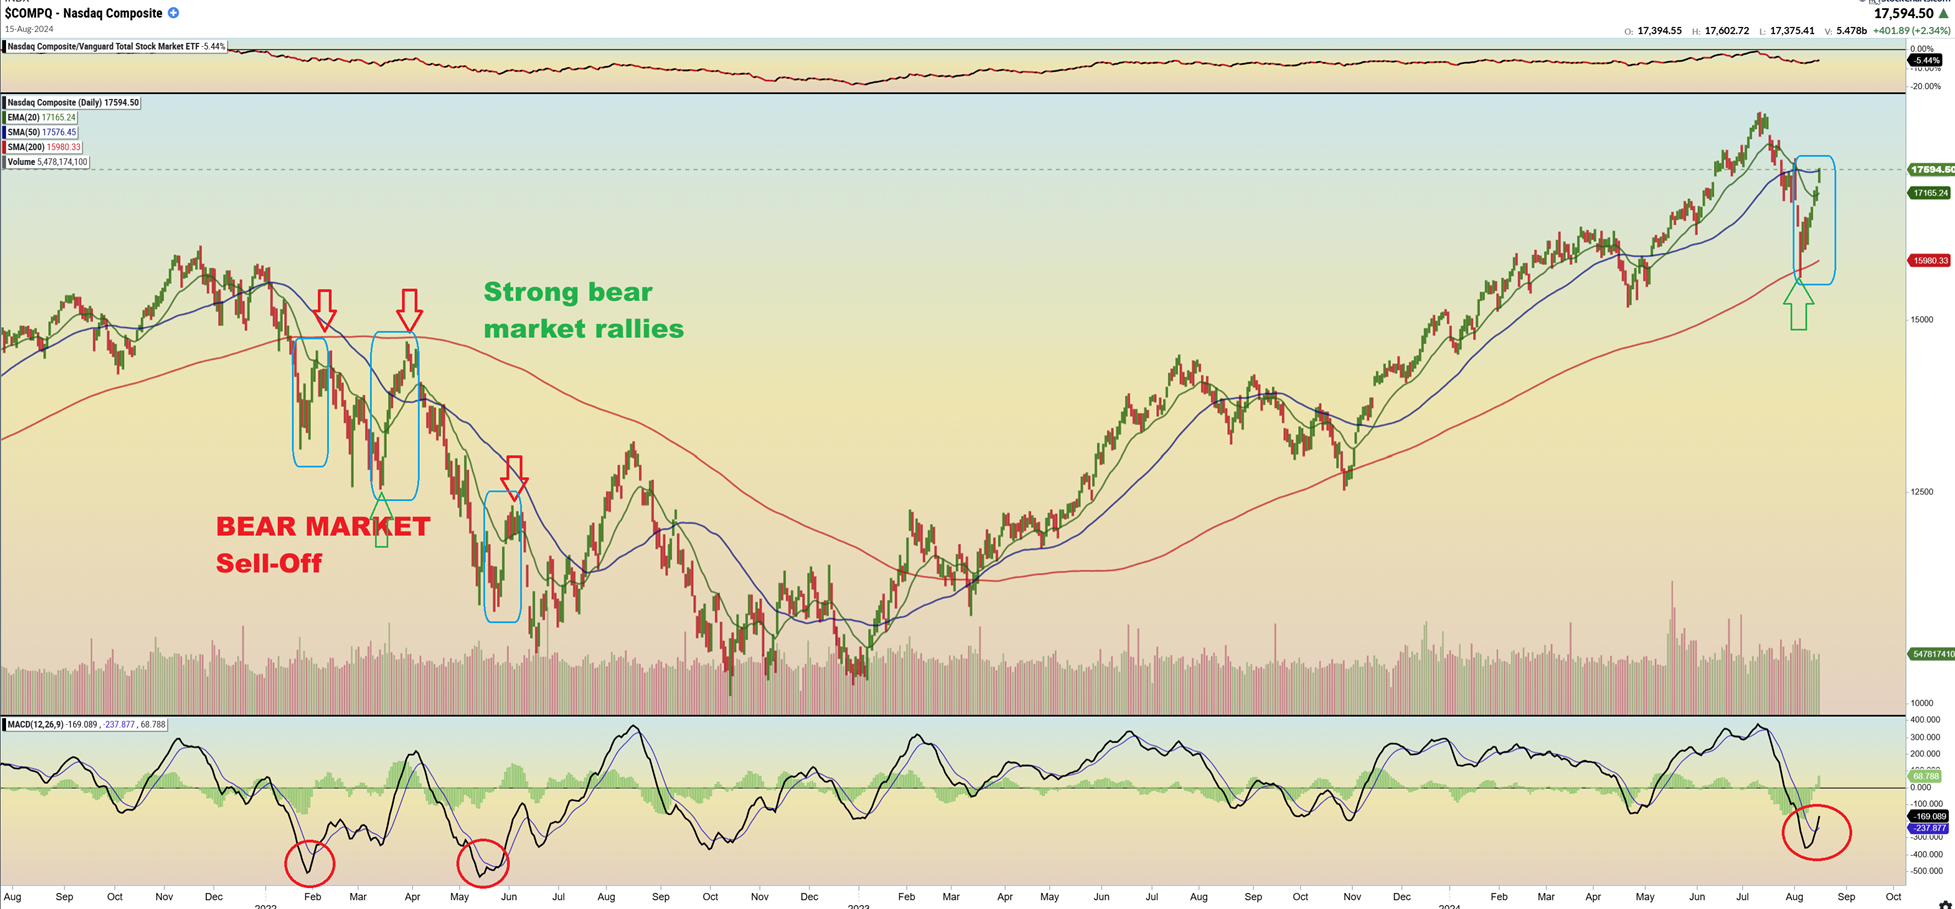
Has this happened in Bear market sell offs in the past? It has. I know that this current rally is only 8 days old and it looks like a v-bottom that will run to new highs and keep going, especially with rate cuts coming, and maybe it could? Could we have a 3 month ICL to ICL? Maybe, but I still doubt it. Take a look at
1. The rallies in the blue boxes. Those were strong, but they were bear market rallies/bounces.
2. I specifically compare the rally now to the rally above the ‘K’ on the word Market. Straight up day after day for 12 days, and yet it rolled over and dropped for months to new lows. So all I’m saying is: “If you are long, raise stops”.
.
SOXX – The SOXX has reached the 50sma in the past and stalled (Magenta arrows). We are almost there. The MACD is also at crash lows here. Look at that MACS. IF…
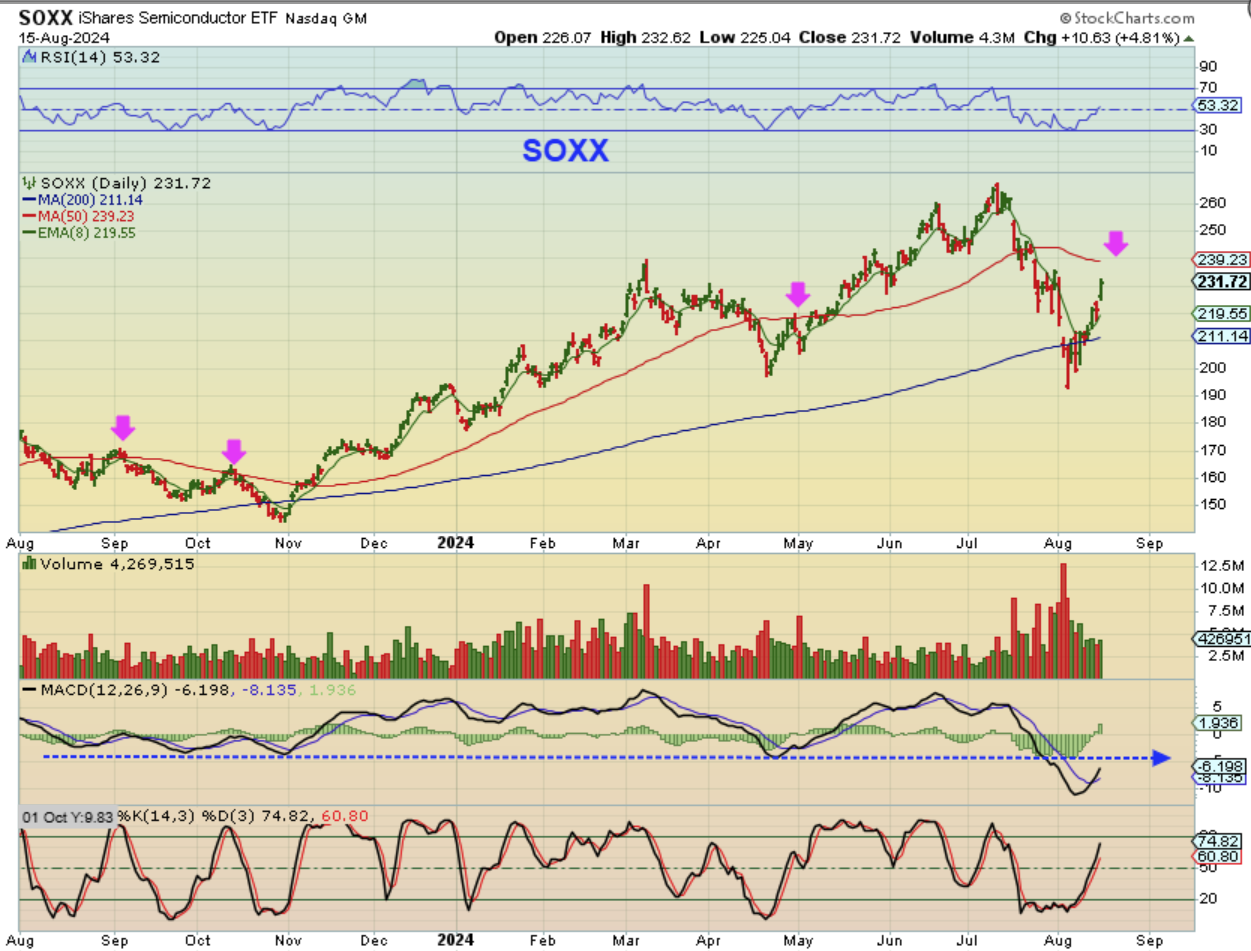
.
1. IF we are in a bear mkt bounce, price should roll to new lows soon, and you can see that on the left of the chart (no higher lows bounce, the last lows are just broken by the selling).
2. If this is a bull run out of an ICL, you’d get a pullback that reverses as a higher low, and that is the next buy. See the blue lines at the right of the chart.
.
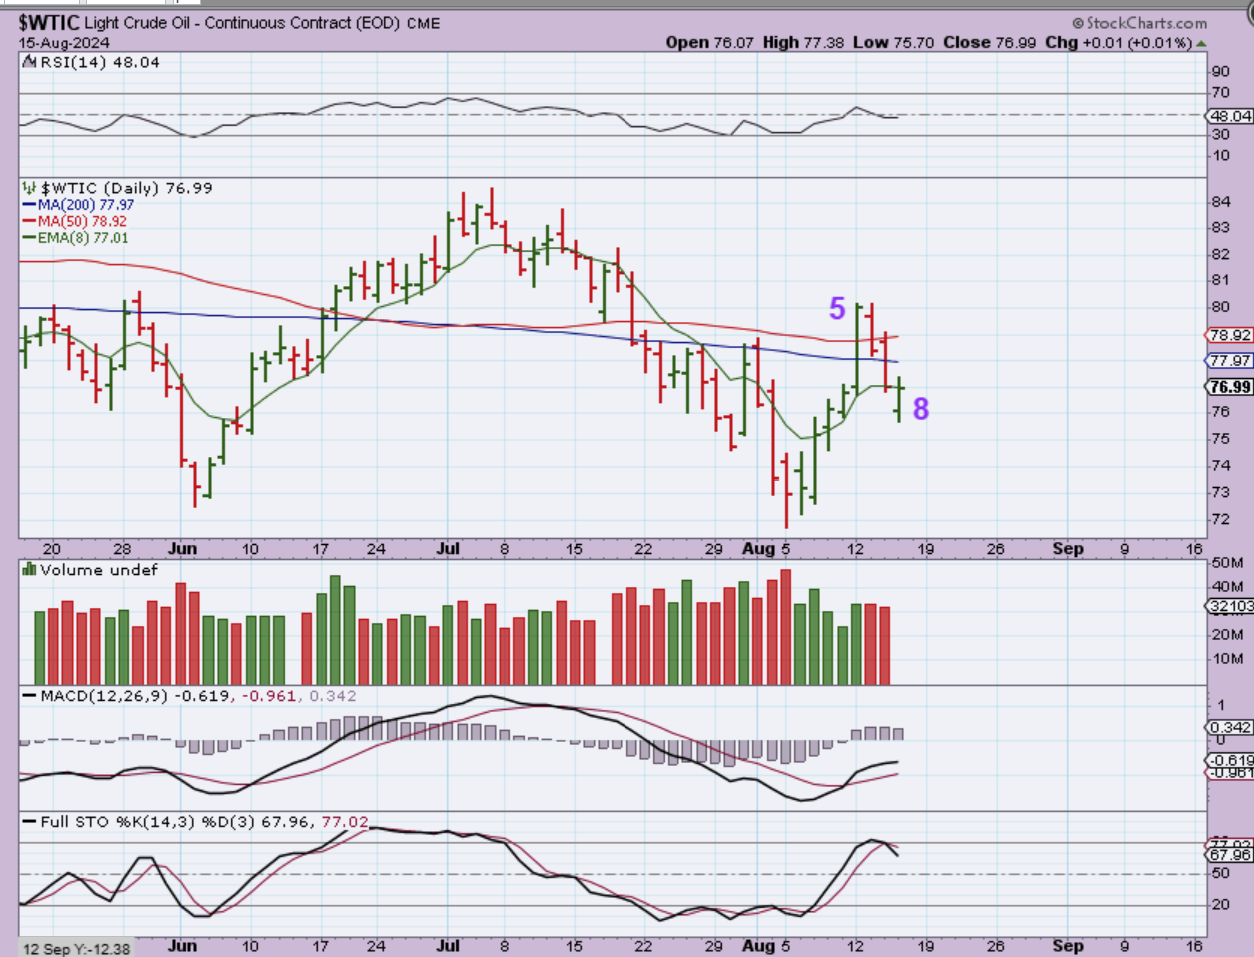
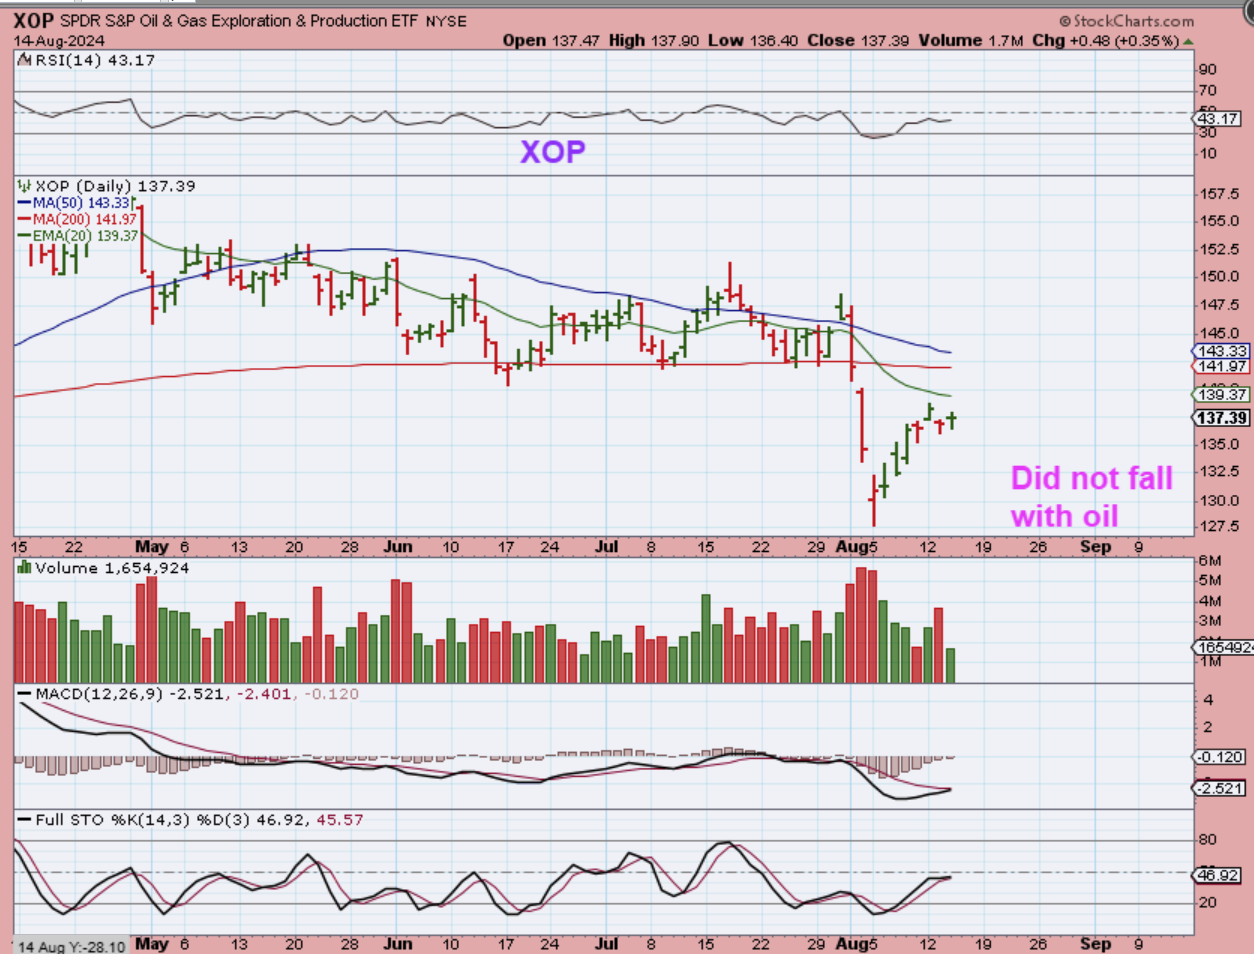
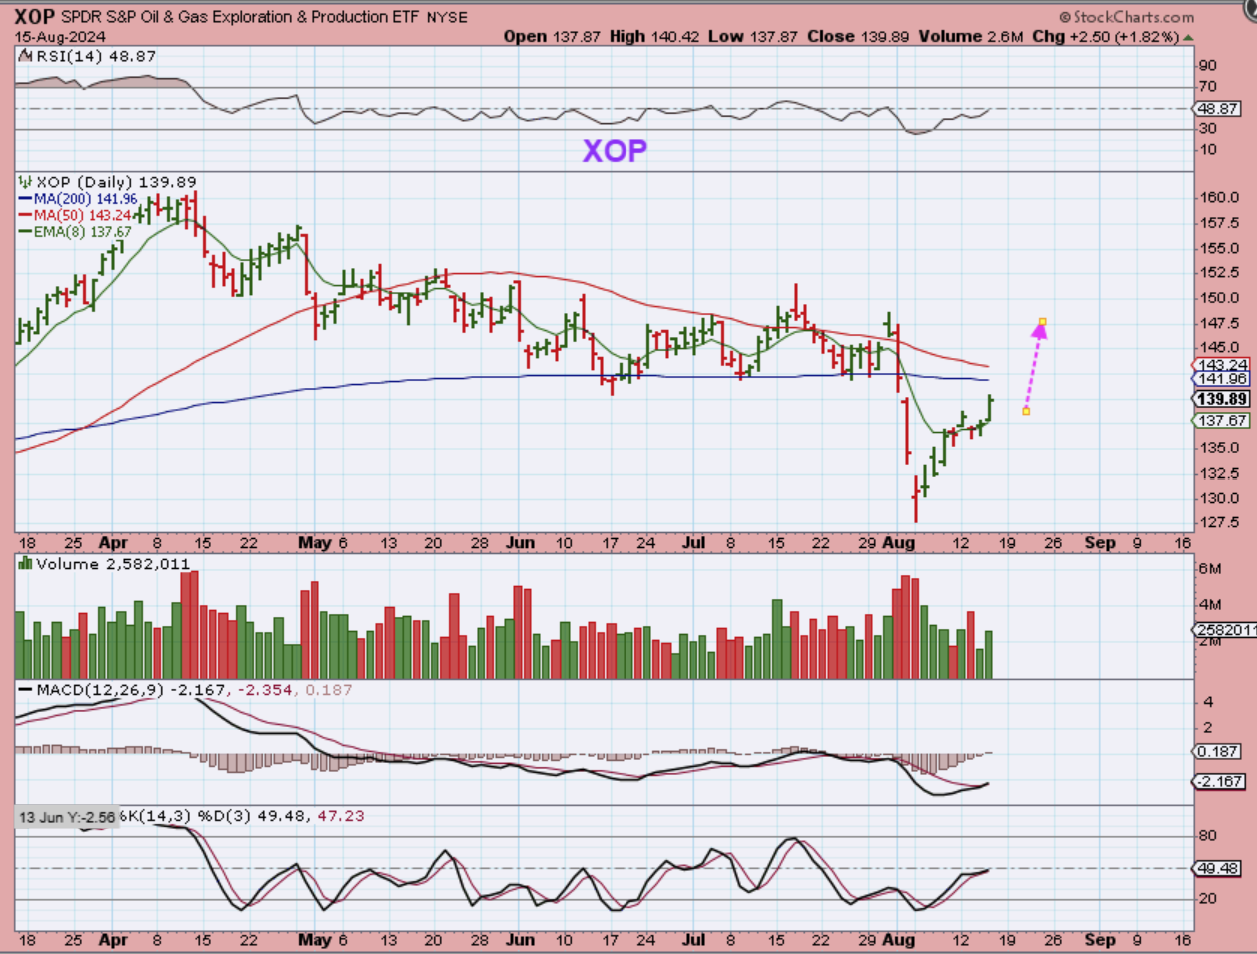
WTIC – Oil is on day 8 and it is still acting correctly, even though it did unexpectedly break that 50 & 200sma. Yesterday I mentioned that the XOP & XLE did NOT drop with Oil, so Oils drop was probably a false break down. How were Oil stocks today?
.
THIS IS WHAT I SAID YESTERDAY:
XOP – The Oil stocks were actually green today, despite Oils sell off. So far, it’s pausing to probably try to build energy to push through the overhead resistance.
.
XOP – Oil stocks popped as Oil reversed, and this set up still looks good. The pause does seem to be building energy for a break through resistance.
.
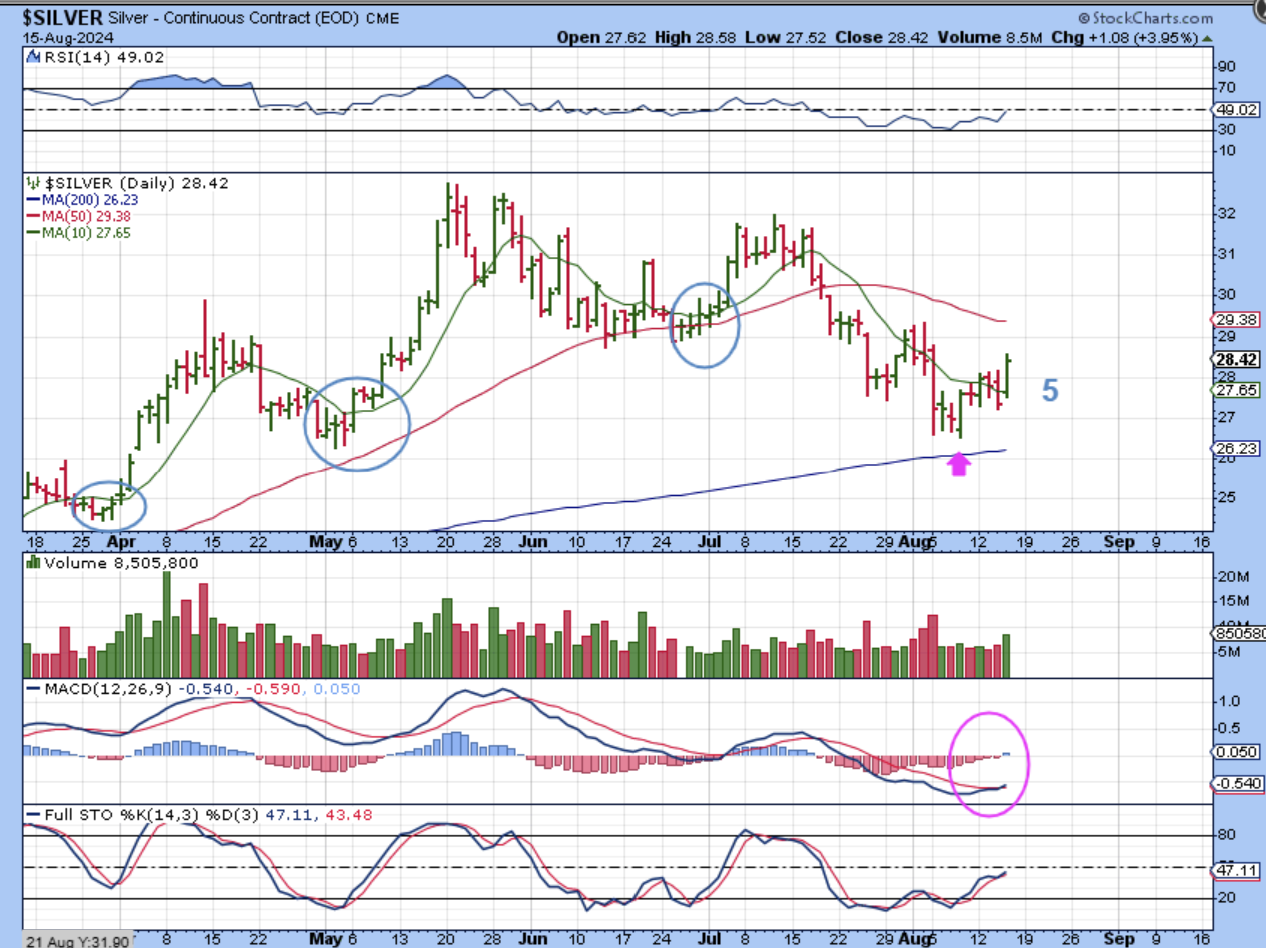
GOLD dropped to the 10sma again, and then bounced again, so that’s 2 days in a row. This looks like it could be forming a double bottomed cup & now a small handle.
.
SILVER, on the other hand, pushed higher with a bit more conviction than Gold Thursday. This is only day 5 and yesterday I mentioned that often Silver starts slow out of the lows, and then starts to run swiftly. Notice the smaller candles at the lows in the circles, and then it stretches out. Hopefully, that is where we are headed.
.
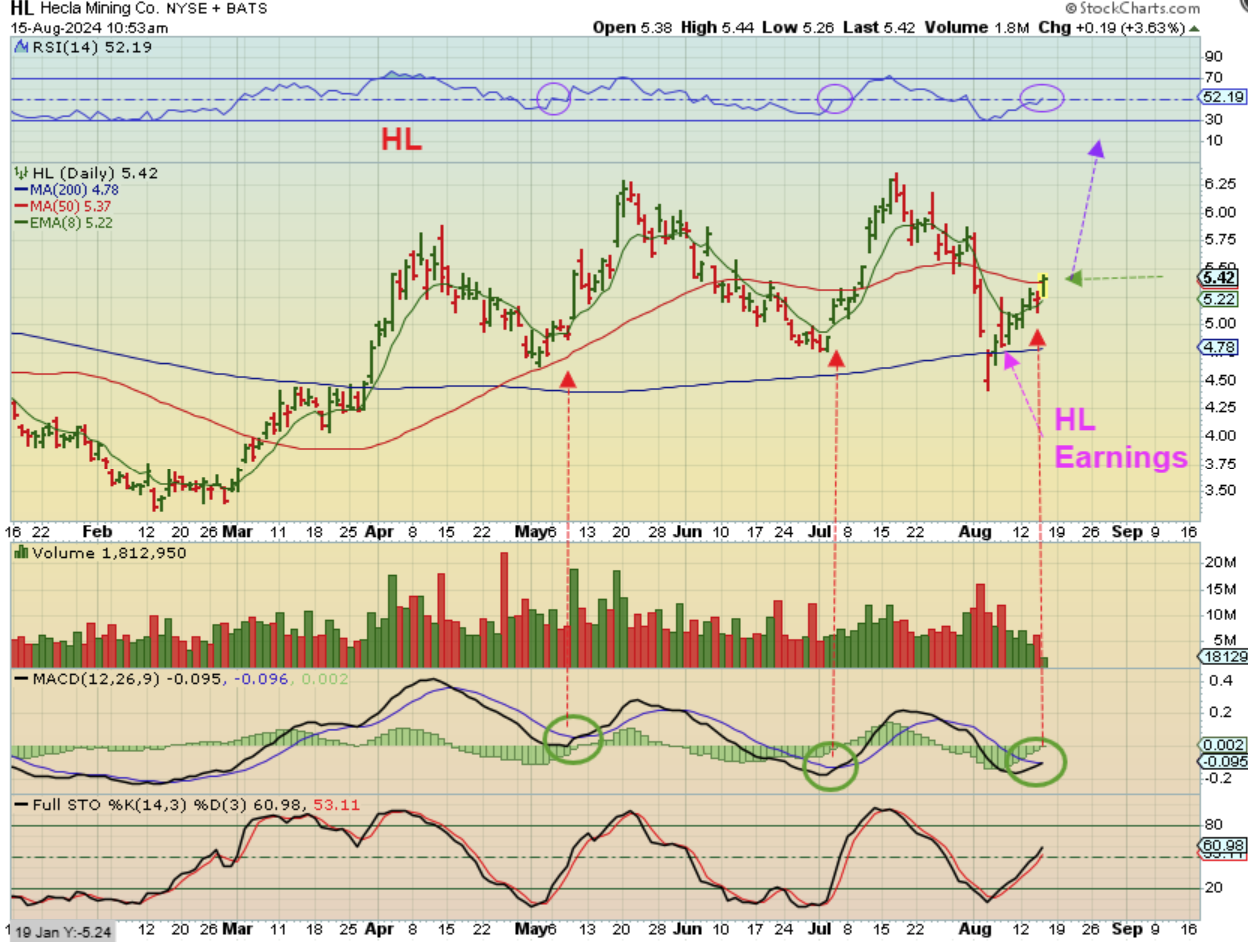
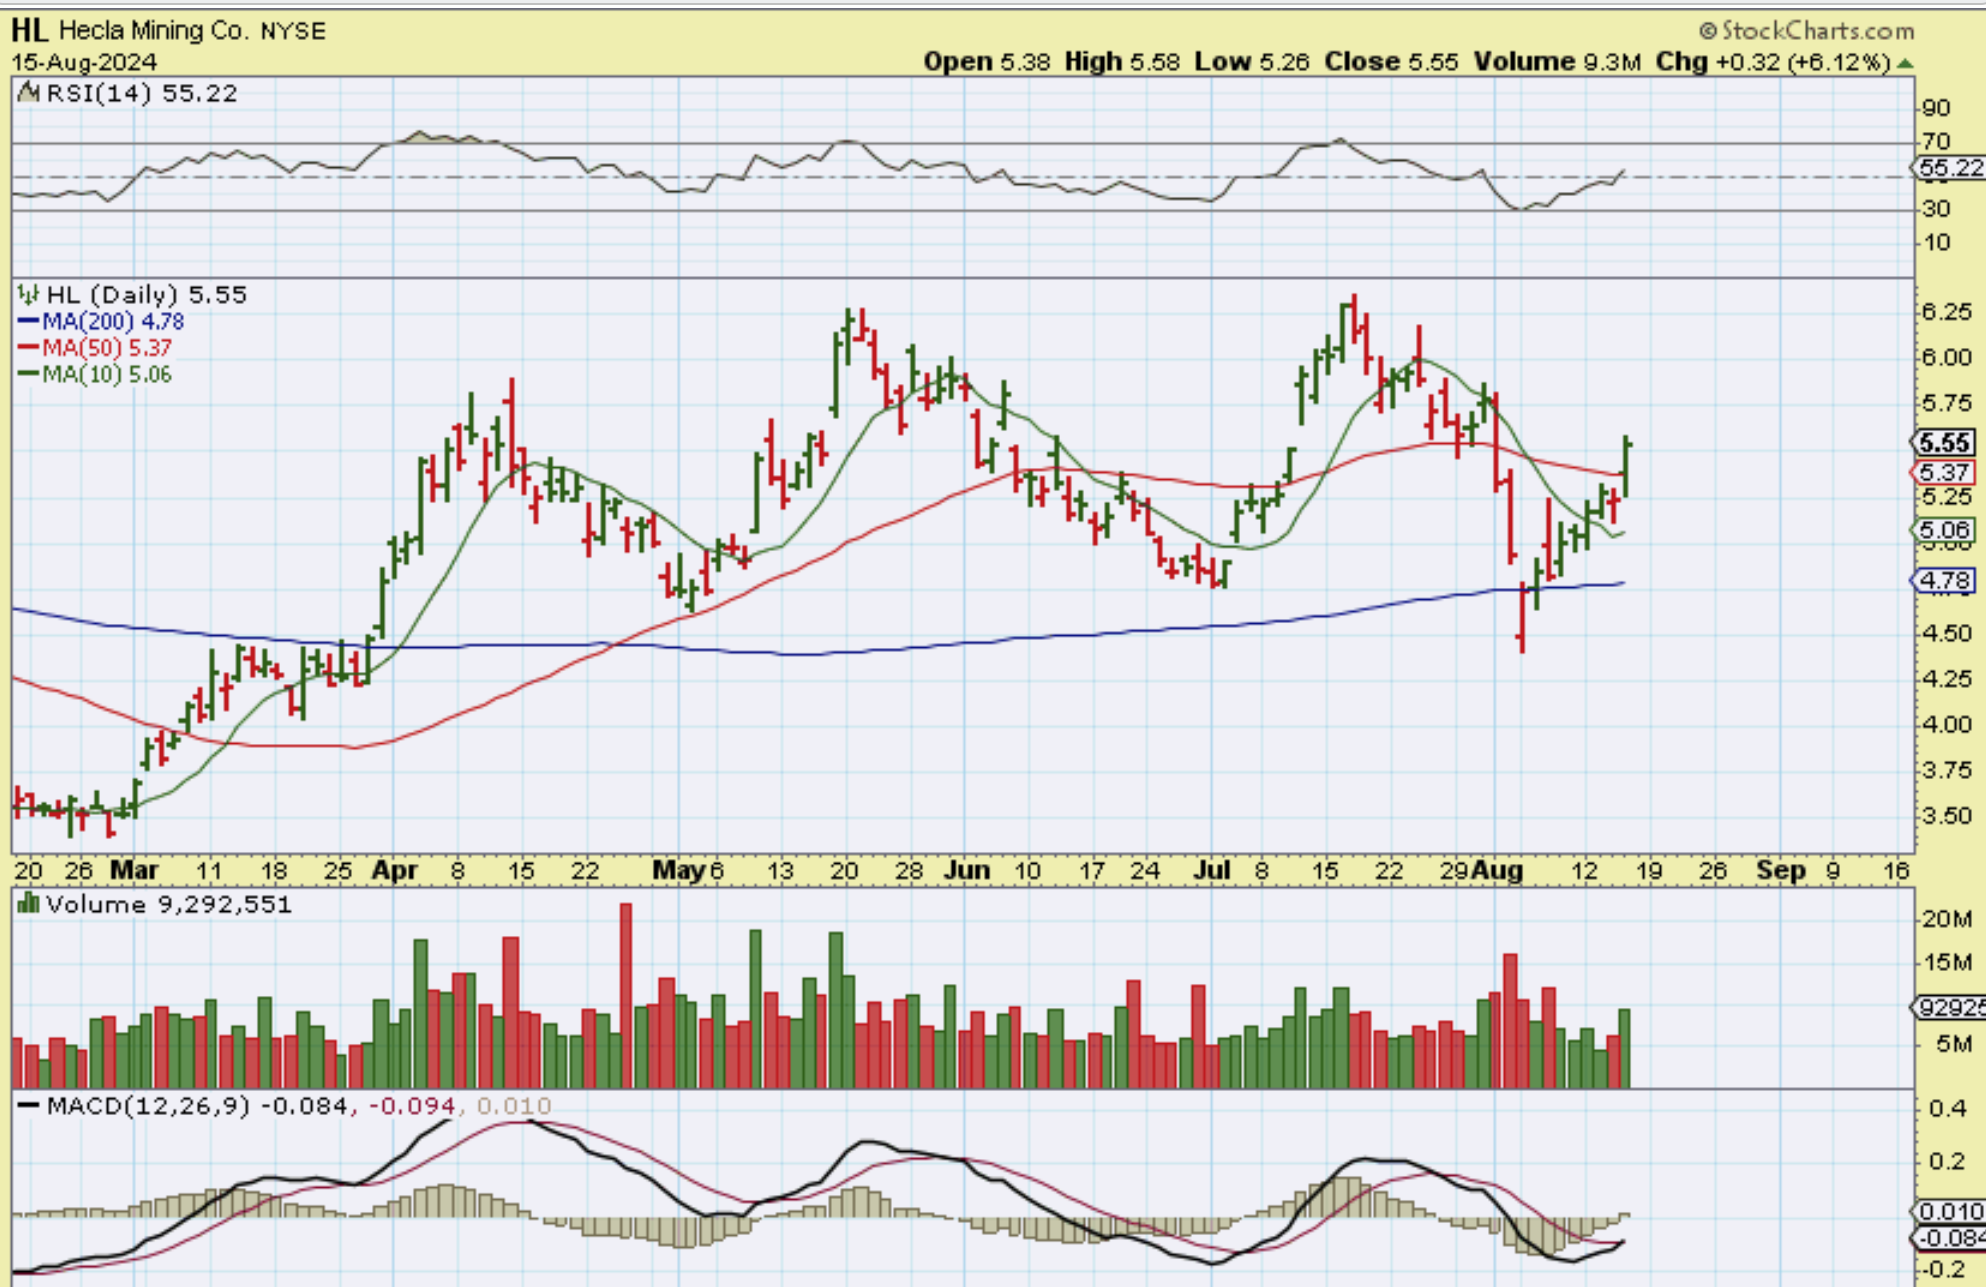
I posted this chart of HL after the first hr of trading to show that the setup is similar to past times when it started to run. Note the similarities on this chart. And…
.
HL …and then it closed up over 6%. I like the set ups in many silver stocks.
.
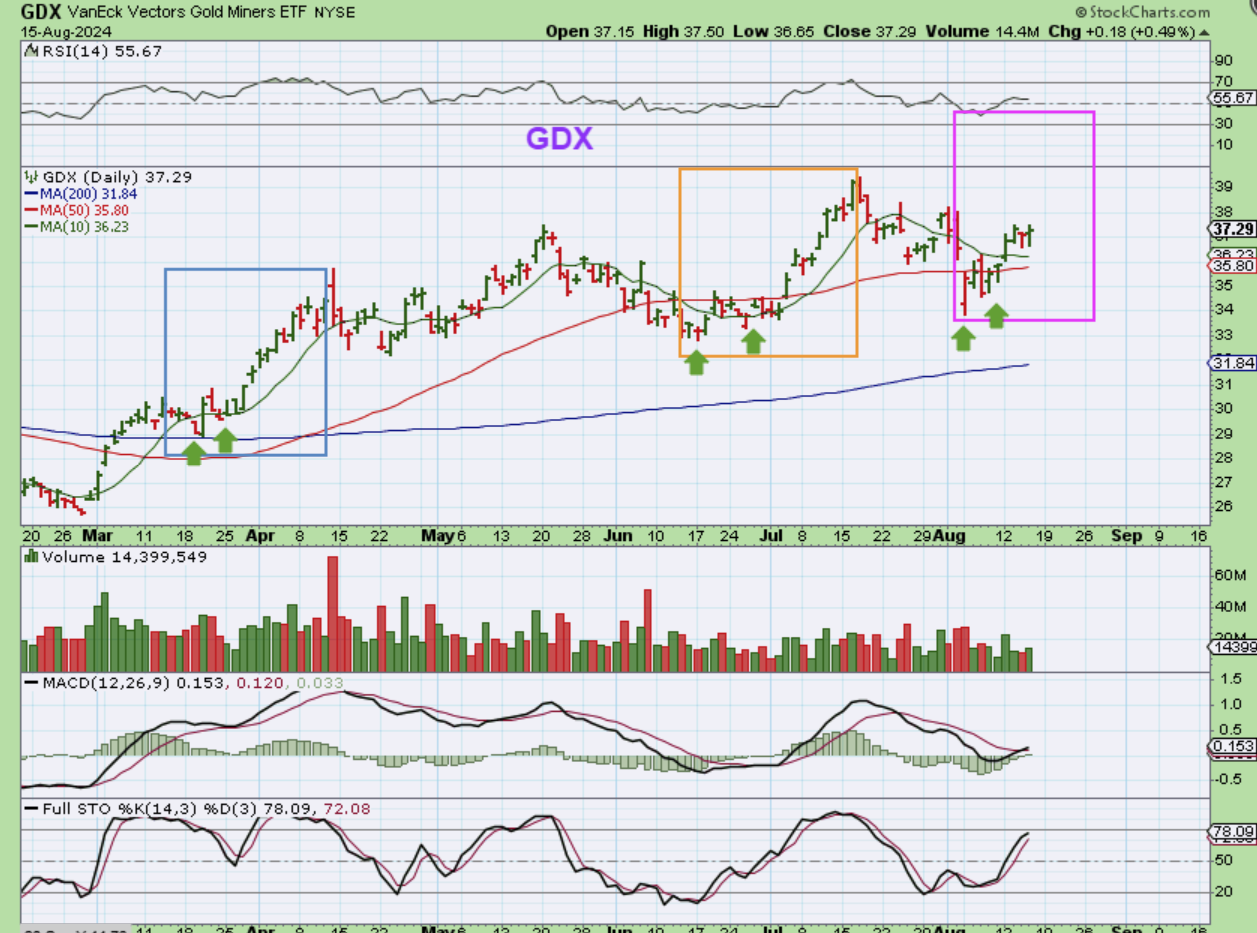
THE GDX is pushing higher out of the lows and is on day 8. The Miners also start slow at times and then gain momentum when buyers begin to recognize the run. See the boxes as examples of slow starts at the lows, then higher highs.
.
Things have been choppy with the Miners and Oil, and the General Markets were choppy at the lows before a short covering rally with buying sent it straight up. It is very hard to make money confidently in this environment, especially because this week was a DATA-Filled week that could have restarted that selling. I have been making much smaller sized day trades on the long side with SOXL, and also own a small basket of Miners for the ride, but it has been volatile intraday and the trading has been difficult to trust.
.
I have pointed out Miners that seem stronger than others ( EGO, KGC, HMY, OR, AEM, etc)—they are up near the highs. Other Gold Miners are trying to play catch up and Silver stocks do seem to be starting to run too. Nobody wanted to buy Silver stocks (Understandably!), because they crashed when the markets crashed. The good news is they’re coming out of the lows now. The risk is–if these general markets sell off again, will Silver stocks sell off again? Take a look at the difference between Gold Stocks and Silver at the time of that crash, but remember that Silver was due for an ICL then.
.
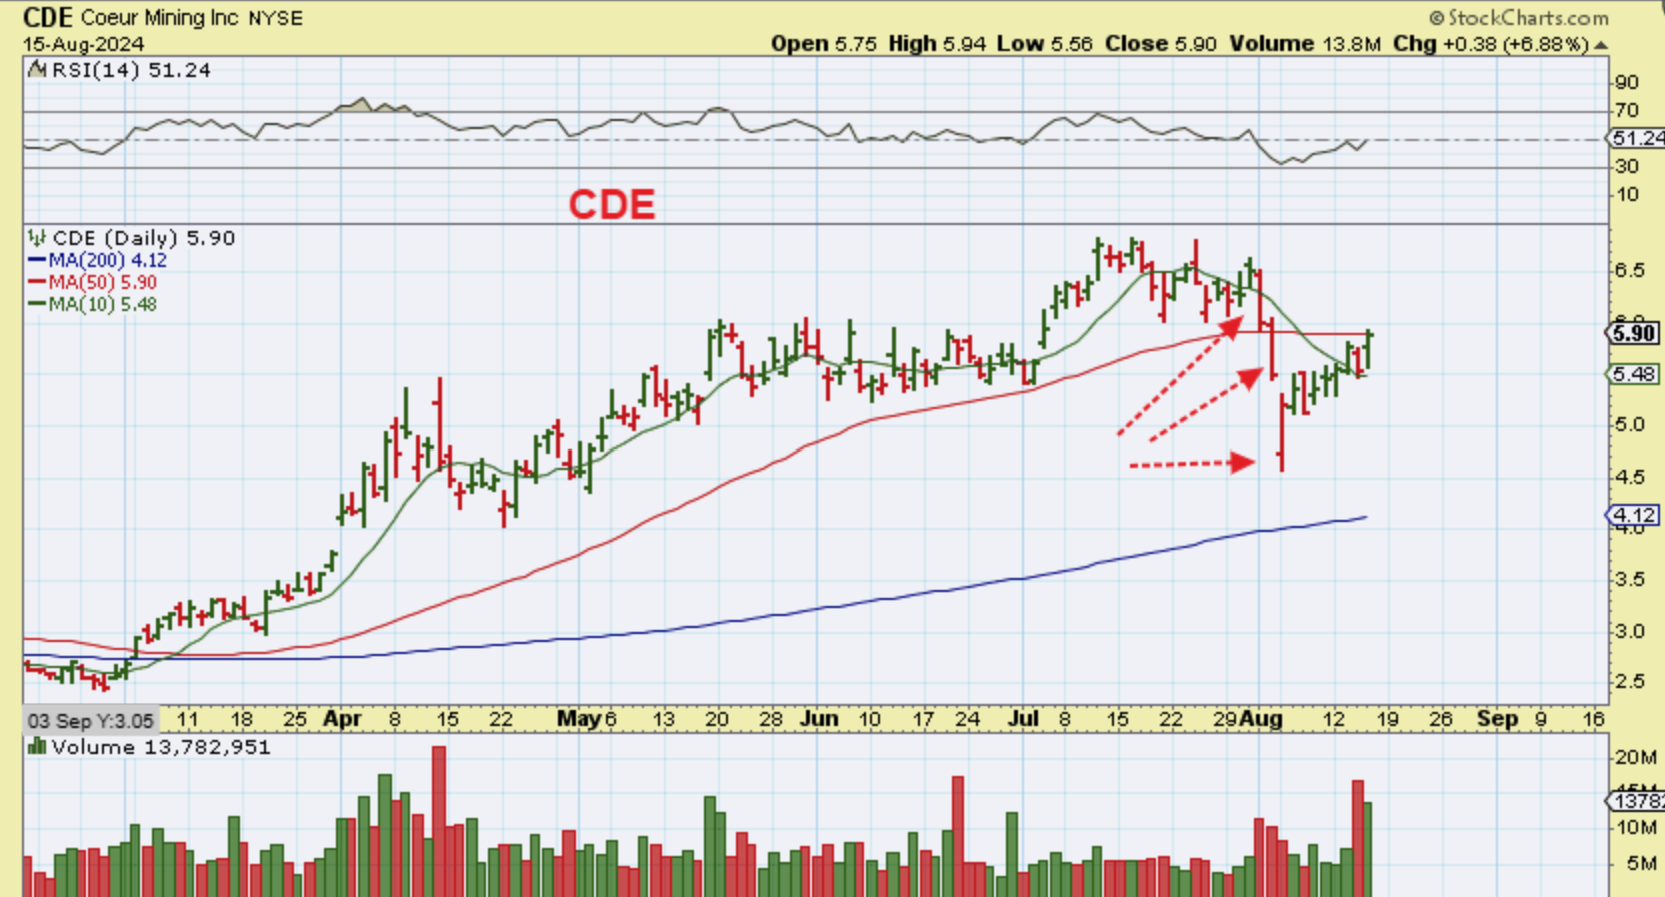
This was CDE and each Silver stock has that 3 day selloff. You can see it in the HL stock above too. I know that this has made some very caution or unwilling to buy them. I do understand that, because I owned a couple then too. EXK robbed me on a gap down sell off crash. I re-bought HL and am using a stop. Next look at my favorite Gold stocks…
.
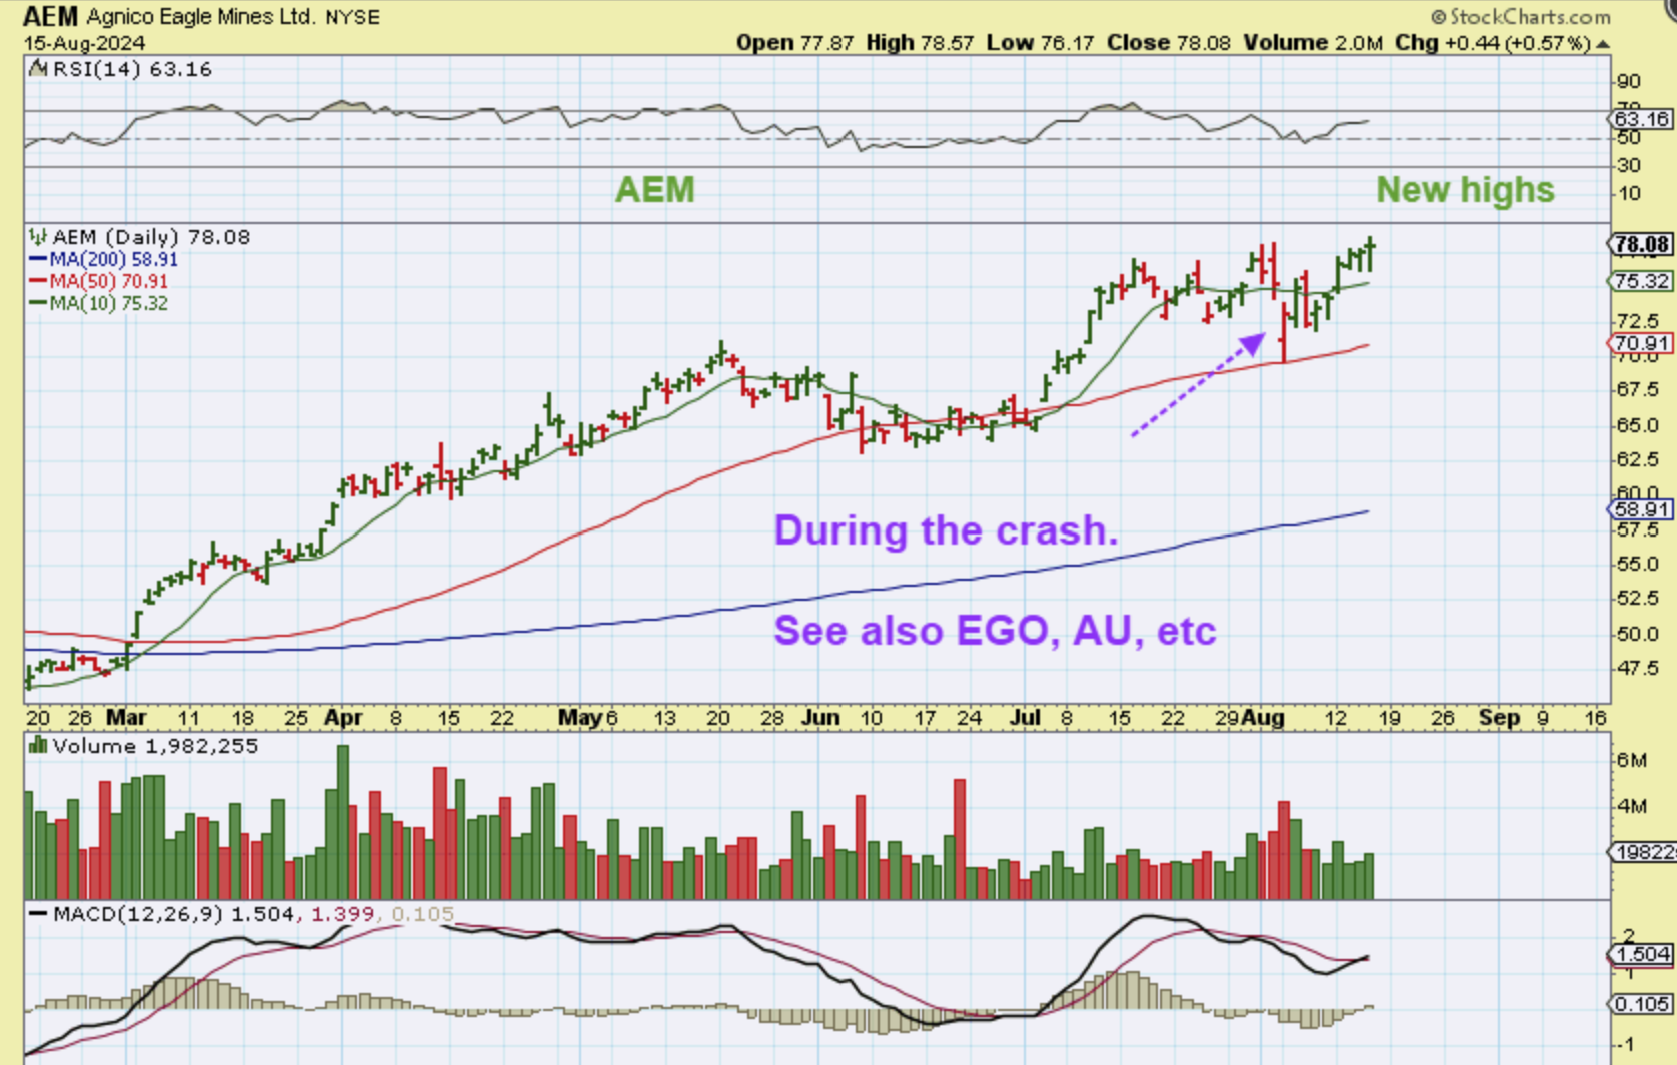
Now look at my favorite Gold stocks like AEM, AU, EGO, and so on, and they are close to the highs or making new highs. They didnt crash for 3 days. So the Gold stocks win, but Gold had an ICL in place. Silver stocks may play catch up if Silver has an ICL.
.
These markets seem bullet proof as they come out of the lows, but EVERY rally eventually will pull back. I will watch that pullback for clues, but since that large 3 day crash broke below the other daily cycle lows and even the ICL, I think the next sell off is going to be strong too. If not, it would mean that we put in an ICL only 3 months after the last one, and I don’t think that I have EVER seen that in the past. Never, so the odds are that we will surprise people and sell off after this rally. To be L.T., it will likely start by day 15 or earlier. Those past bear market rallies lasted to day 12. If we do get another sell off, I think that the Miners could resist that selling if Silver has an ICL in place. Some Gold stocks barley sold off with that last one, and others sold off a bit and then recovered. The next ‘safest’ trade long for the General Markets could be after we get a pullback, to see which areas have a higher low. Enjoy your Friday trading and your upcoming weekend!
.
~ALEX
.
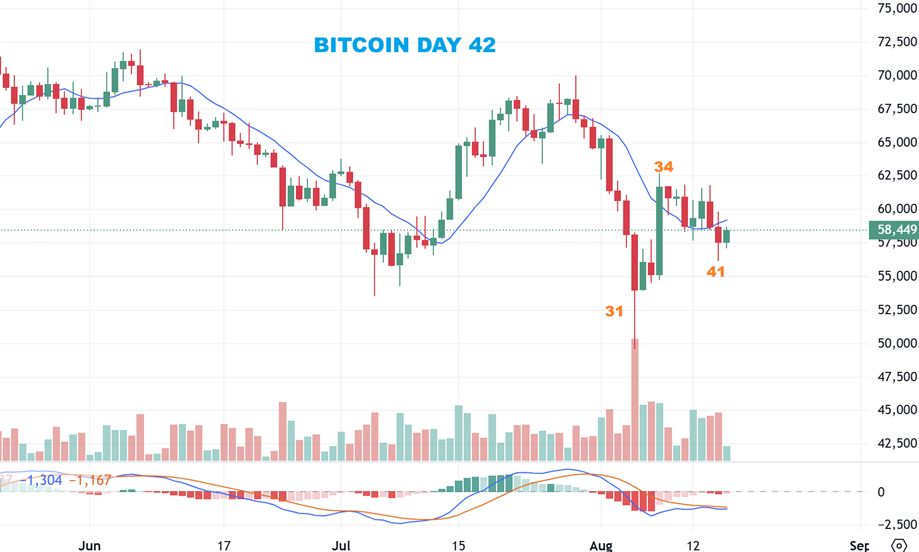
YESTERDAY WE NOTED THAT BITCOIN HAS BEEN CHOPPING SIDEWAYS AND LOST THE 10 SMA: I SAID…
.
BITCOIN dropped yesterday and has a tiny candle live this morning, that dropped below the 10sma. That is ok, Bitcoin does tend to be a little more volatile, but we are now starting day 41, and I’d like to see more upside soon.
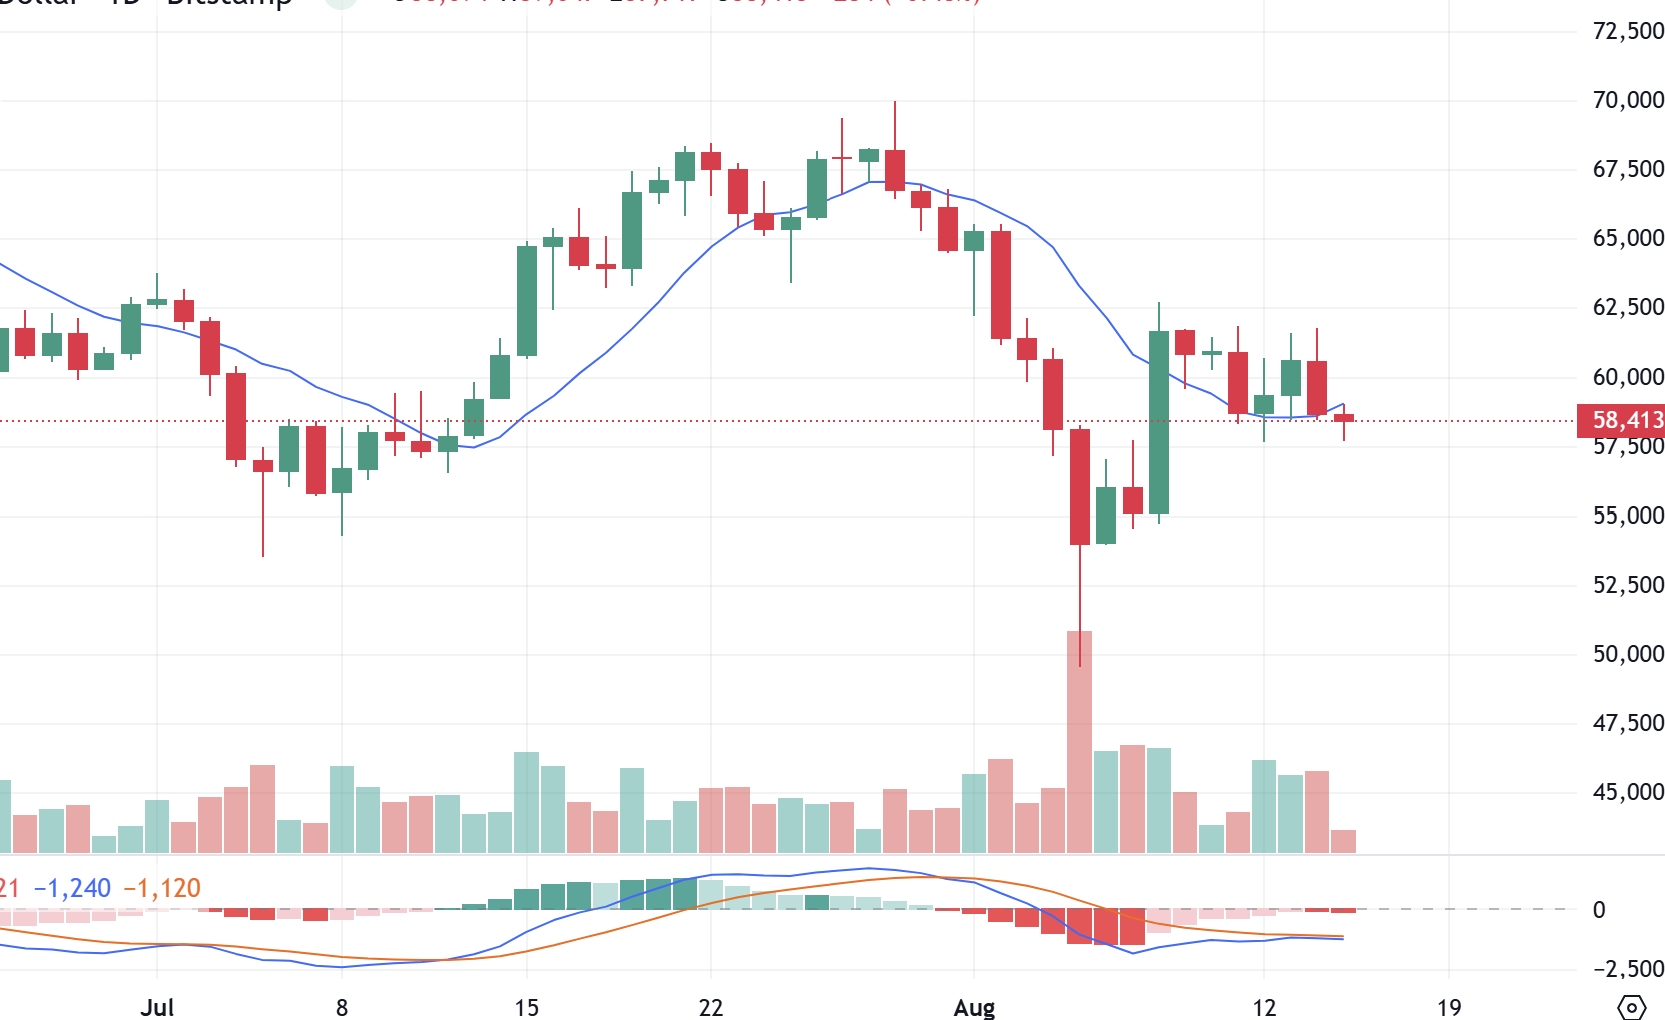
BITCOIN 6:30 a.m. ET: Bitcoin dropped lower on day 41 and then put in a reversal. We are now on day 42 today and slowly running out of time, but this could make a run higher and then drop into a higher day 60 dcl. THAT might lead to a good buy, but until this rallies there is also the risk of a new lower low on day 60(ish). Bitcoin got caught up in the General Market crash and broke to new lows, but it did NOT follow the General Market rally.