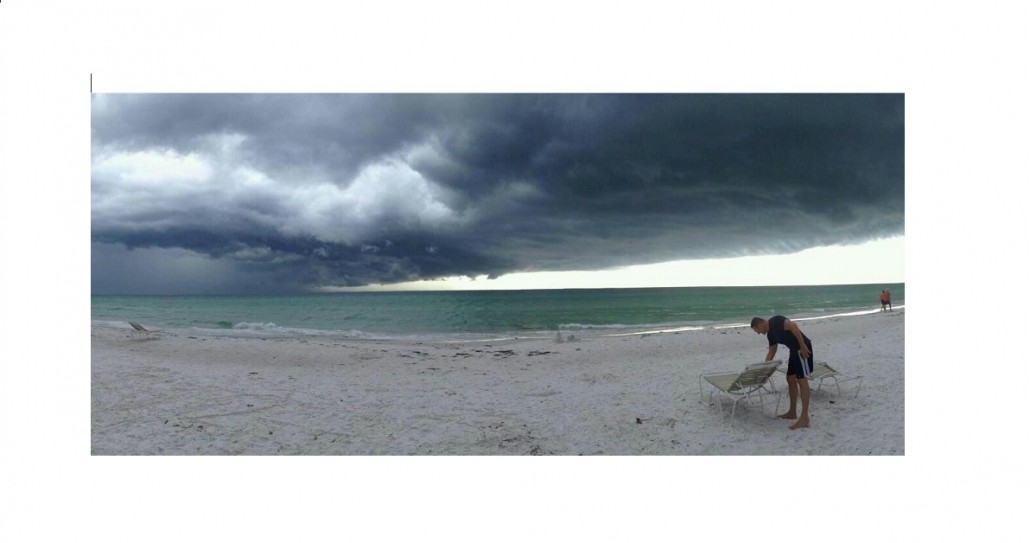
August 3 Weekend Review – And Then a Storm Rolled In
Please start here: I hope to be as clear as I possibly can when I discuss what I see in this report. Please read the whole report, since all things may be tied together, and try to resist skipping some sectors if that is your normal tendency.
.
I was expecting an eventual sell off in the General Markets, because the SOXX failed a while ago and it called for caution in the General Markes, HOWEVER, I expected several of the other sectors like Gold & Oil to still rally onward and upward. I saw very bullish charts in Precious Metals and Oil / Energy too, as of last week. Then, as I went through the charts this weekend it dawned on me that after the Fed Meeting Wednesday, things were still very bullishly aligned. You may be surprised to learn that it was really only as of Thursday and Friday Post-Fed that some storm clouds came in like a hurricane and washed away a lot of the hopes that I had entertained going forward. Well, at least for now things may be delayed. I think we may see more consolidation and chop, but we also may see a market crash with the General Markets, so I plan on discussing all things in this really important weekend report.
.
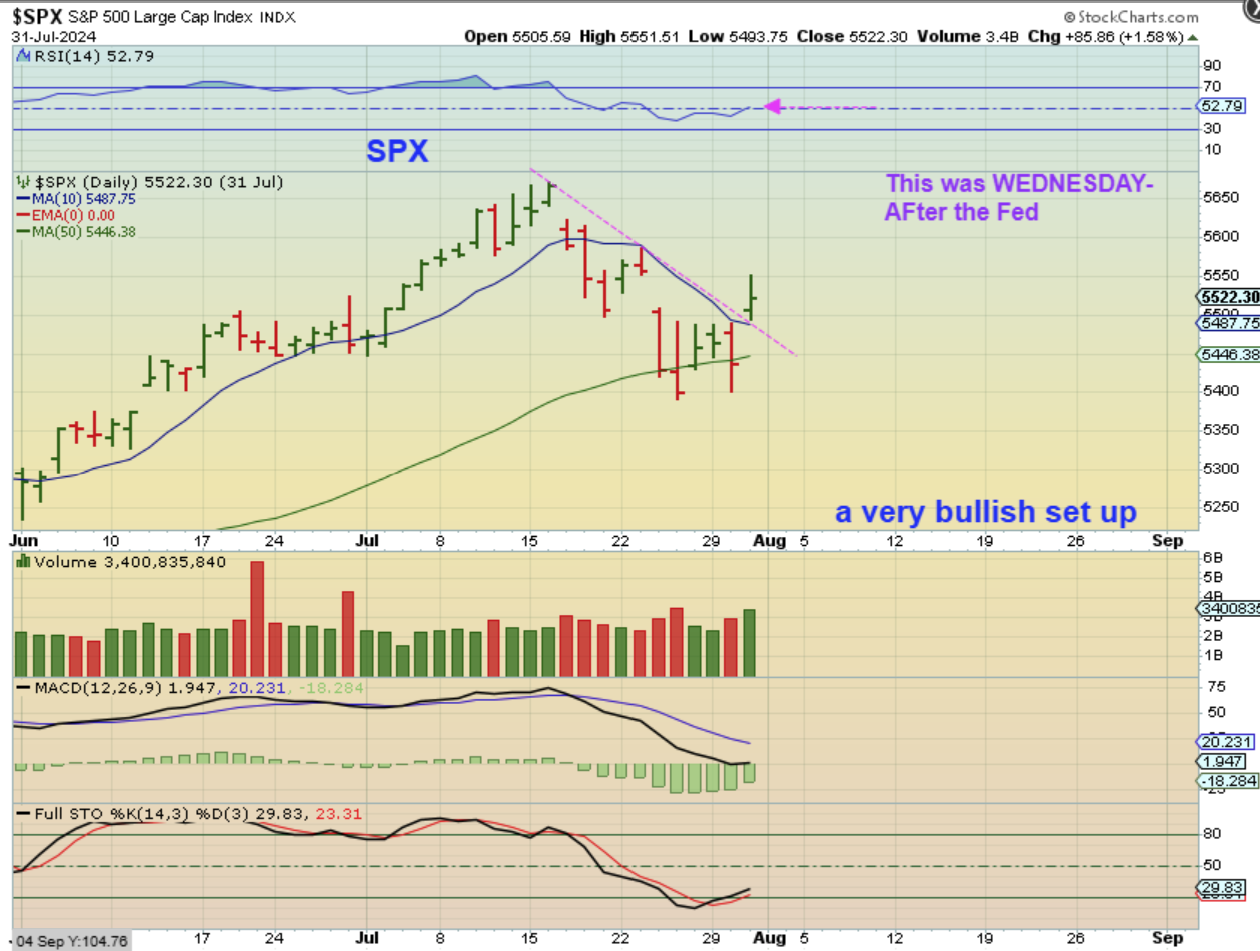
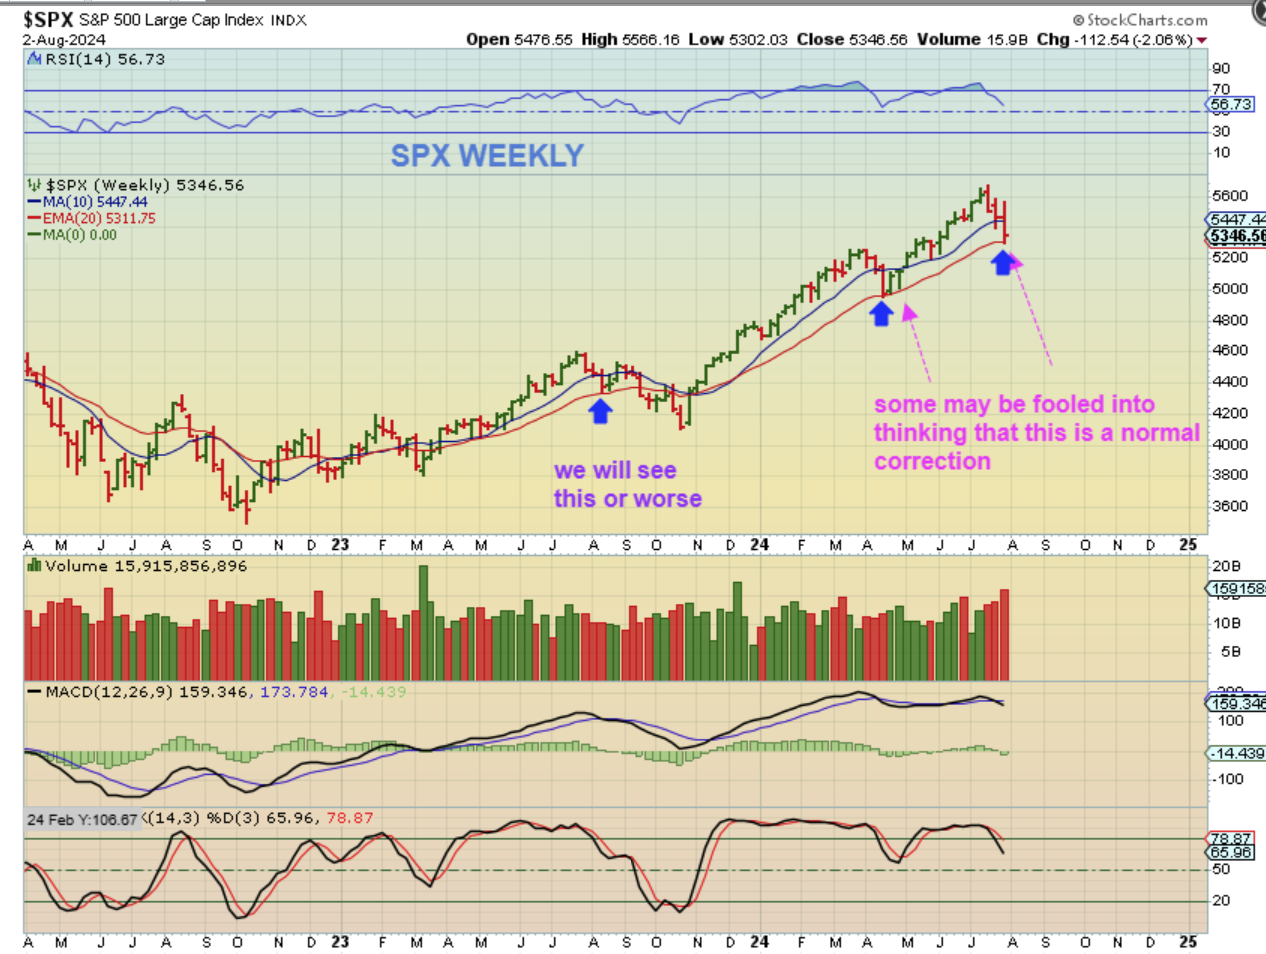
SPX- I just want you to know (& see) that as of the close on Wednesday, after the FOMC Meeting, We had a very bullish setup. I had been warning caution too, however, since I saw the SOXX fail, and the Nasdaq closed under the 50sma repeatedly, but I still expected that we could get a nice bounce from here with the Fed behind us. This set up was quite bullish looking.
.
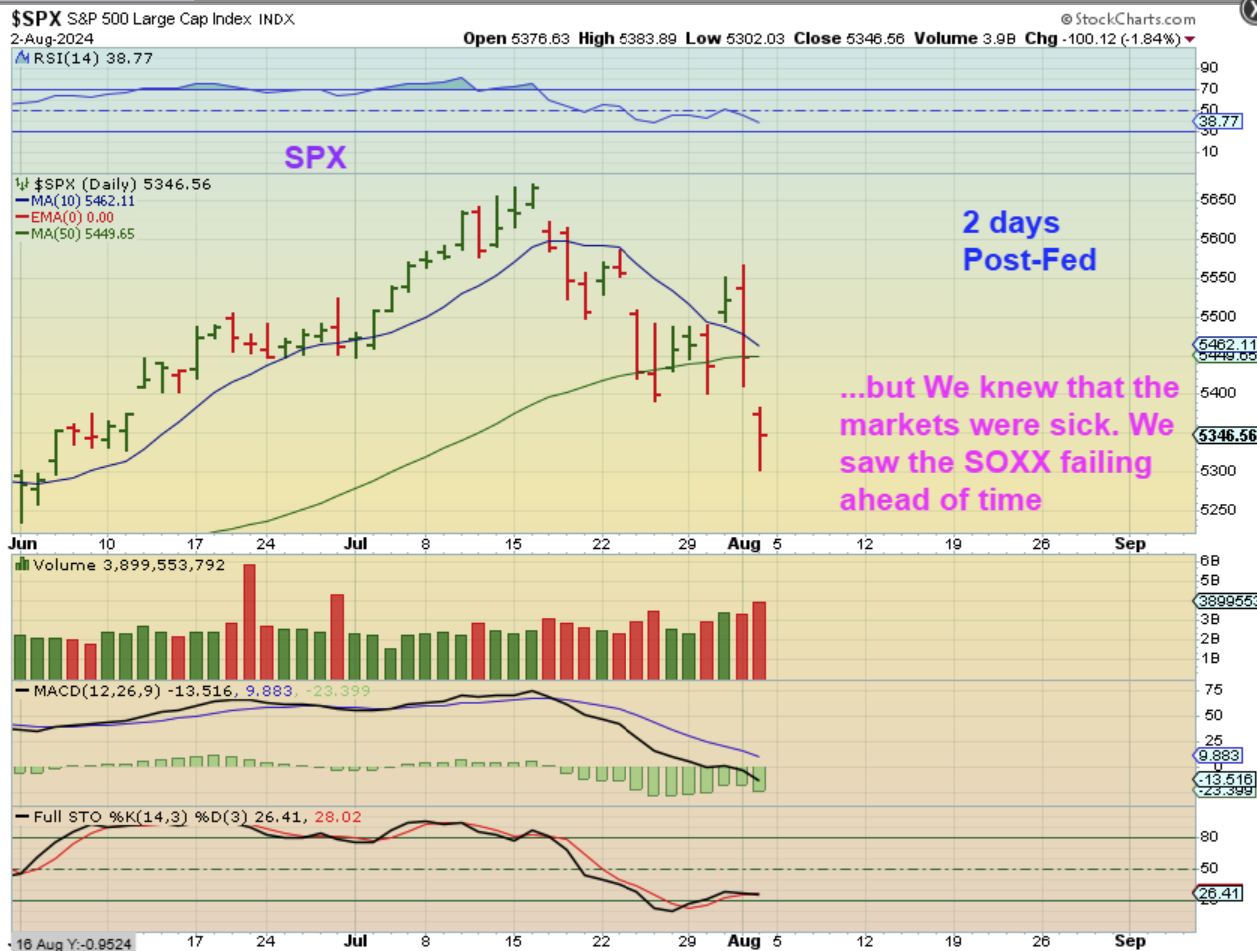
SPX- The markets opened up Thursday and rallied actually. They gapped open, rallied for 1/2 hr, and then tanked. What is that old saying about news driven trading? Oh yes, “Buy the rumors, Sell the News’. The news of the rate cuts ahead killed the rally? The last 2 days of the week really hurt that bullish set up rather quickly. I think that a bounce from here (if we don’t straight out crash) will a ‘short’ opportunity.
.
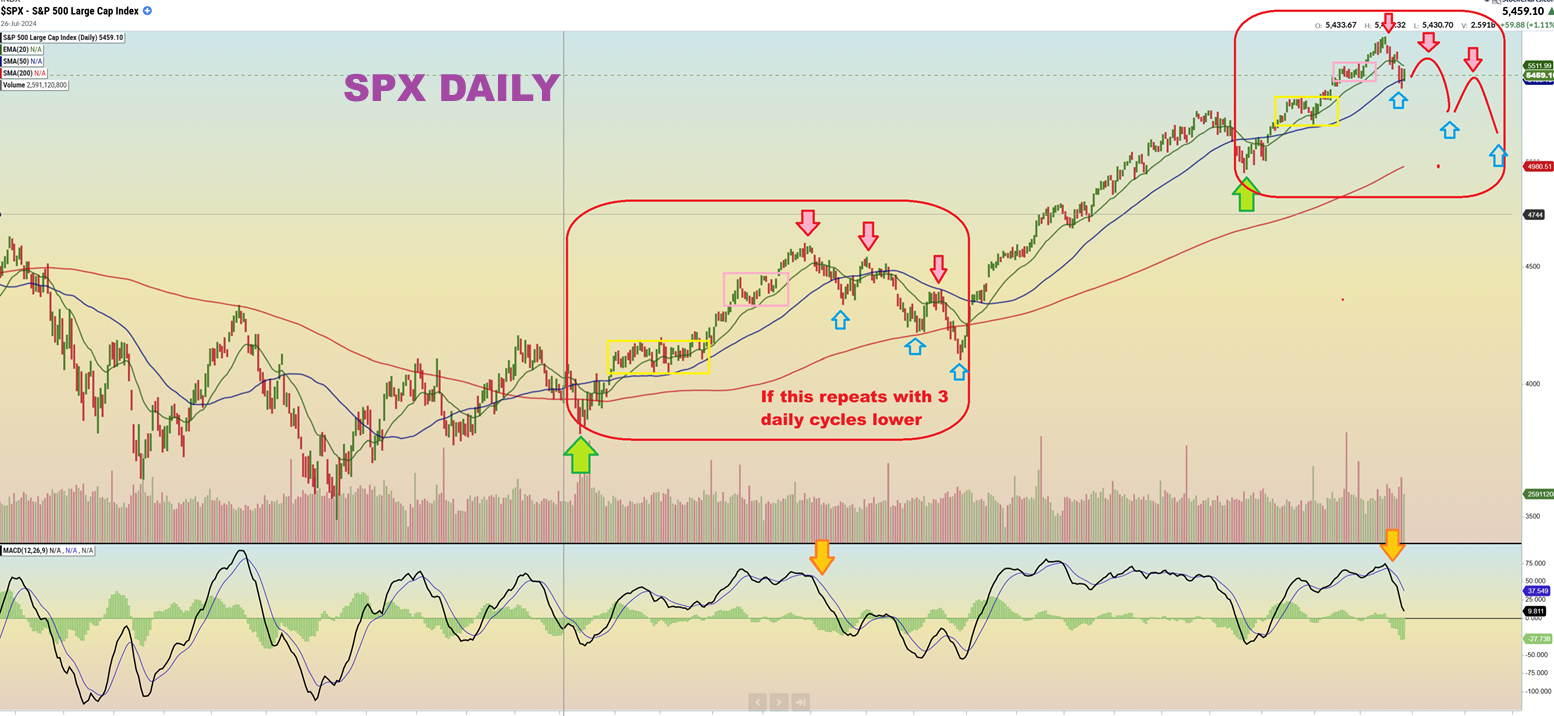
Looking at The SPX Weekly, some may mistakenly see this as a normal drop to the 20 weekly ema, just like tin April, but this is not the same. That was a drop into an ICL after a 6 month rally (normal). This is the 2nd or maybe the start of the 3rd daily cycle out of that ICL. Do not be fooled by a bounce, this is not acting correctly this early in an Intermediate Cycle, and this is not an ICL.
..
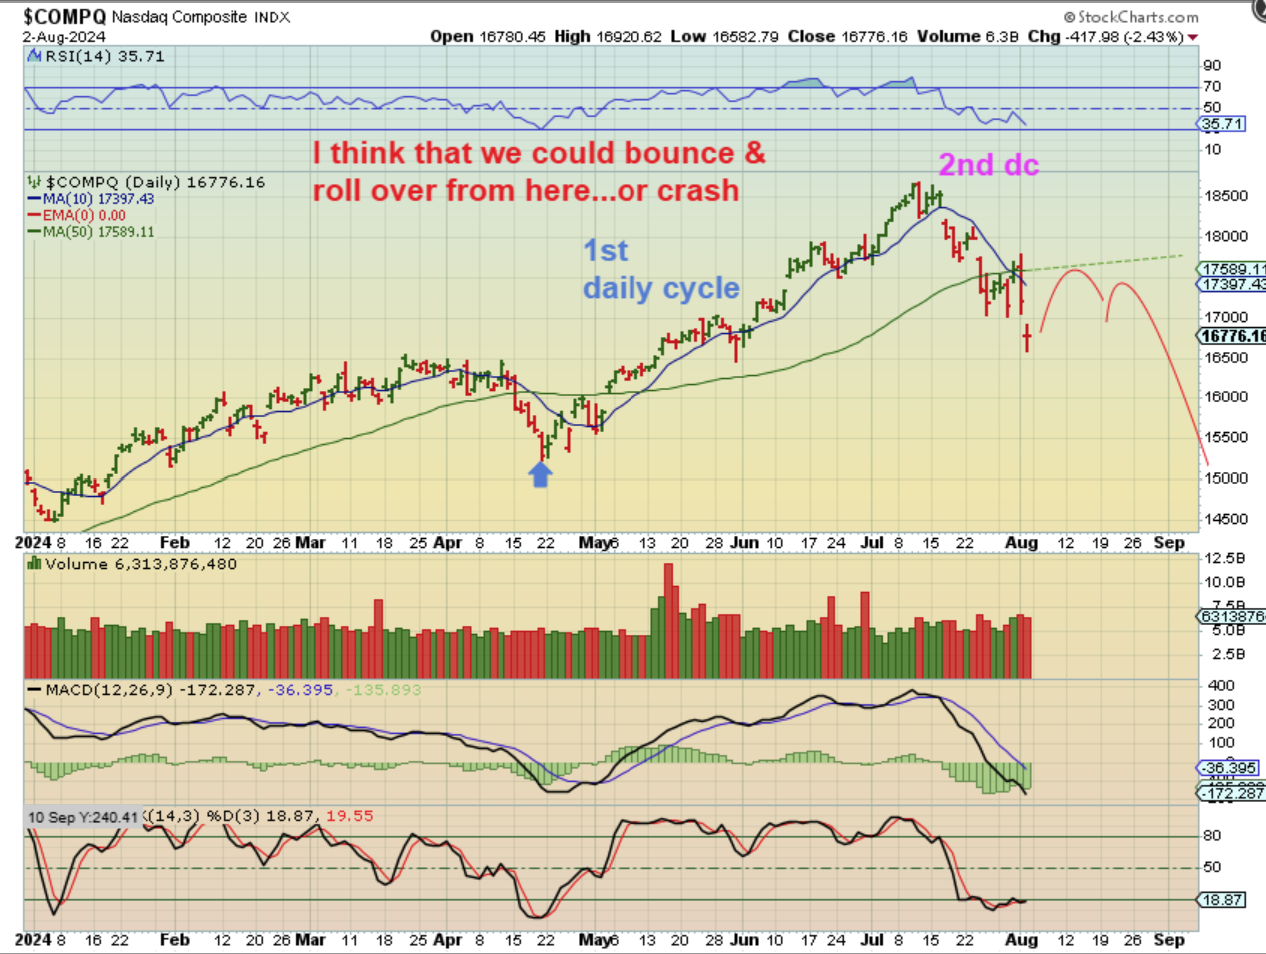
THE NASDAQ rallied back above the 50sma on Thursday at the open, but then it sold off Thursday and Friday. This is a BIG drop early in the intermediate cycle and it should not be the last of it if we have 3 daily cycles ahead. I also noticed some earnings reports had ‘warnings’ of future concerns and estimates. I said that …
.
Same chart: I said that a bounce to the 50sma, as seen here, should be short-able. I want to show you a comparison to the 2008 crash where it also rallied around the 50sma before the real crash…
.
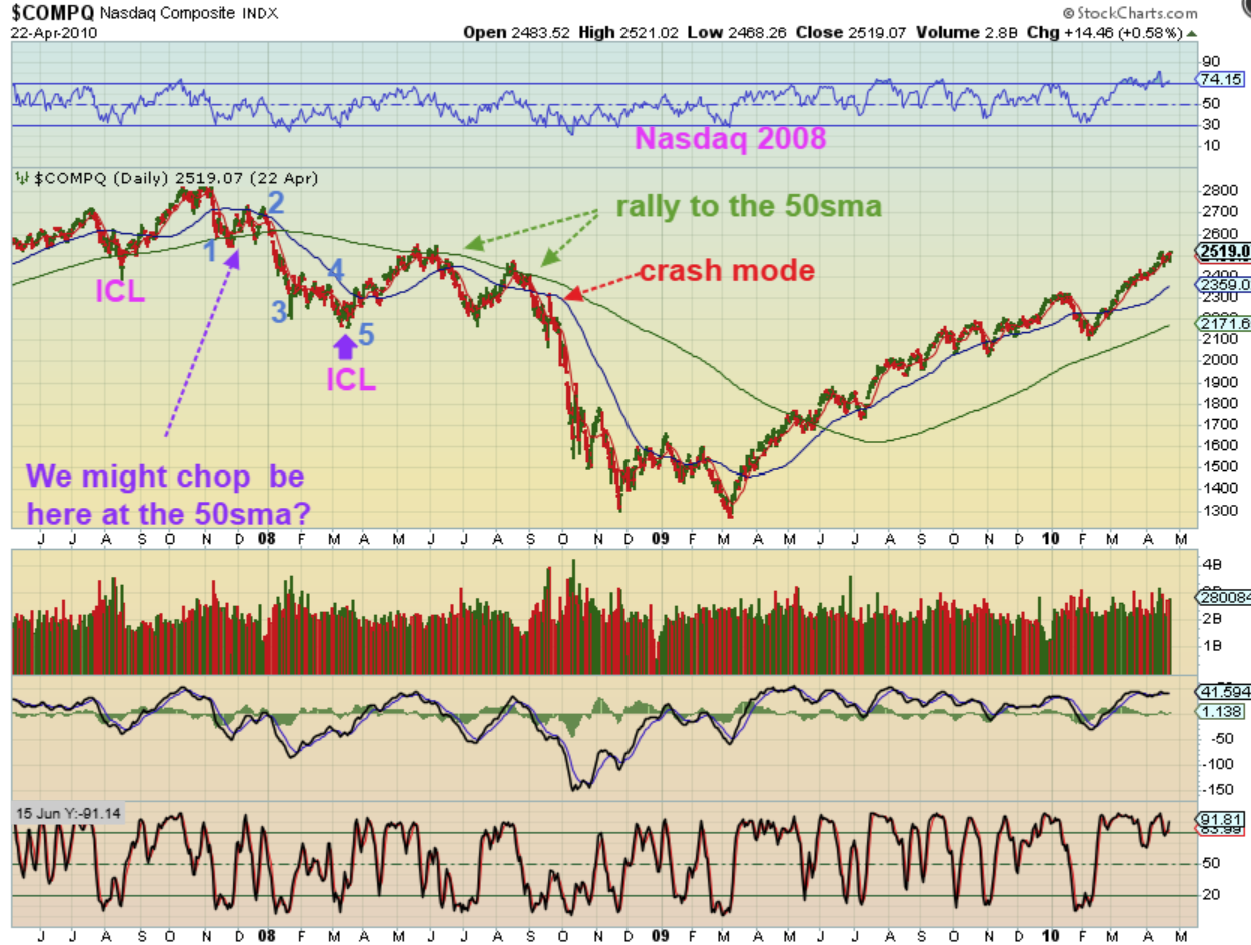
NASDAQ 2008 – Notice that The 2008 Crash was actually made up of 2 intermediate cycles lower. We could imitate the first one now? Please notice that…
1. I’m looking at the 5 wave drop into the ICL in March 2008. Before that, out of the ICL in 2007 bull run, the markets rallied strongly above the 50sma for 3 months. We just did that too.
2. Then it kind of suddenly and sharply crashed down to the 50sma, as wave 1 down. We just did that too, the Naz is now below the 50sma.
3. We then saw a bounce and it was choppy in the next daily cycle (wave 2) above the 50sma. We could see that or just a chop around under the 50sma.
4. Notice Wave 3 down was sharp and fast after again losing the 50sma. Losing that 50sma then was a good place to short.
5. After that small 5 wave crash, we saw an ICL form and did it again. Two rallies to the 50sma took place and then the bigger crash followed. So price danced around the 50sma a lot, and we might get a shorting opportunity at the 50sma, unless we just crash lower from here. If we do drop more now, the next rally out of a dcl will likely back test that 50sma.
.
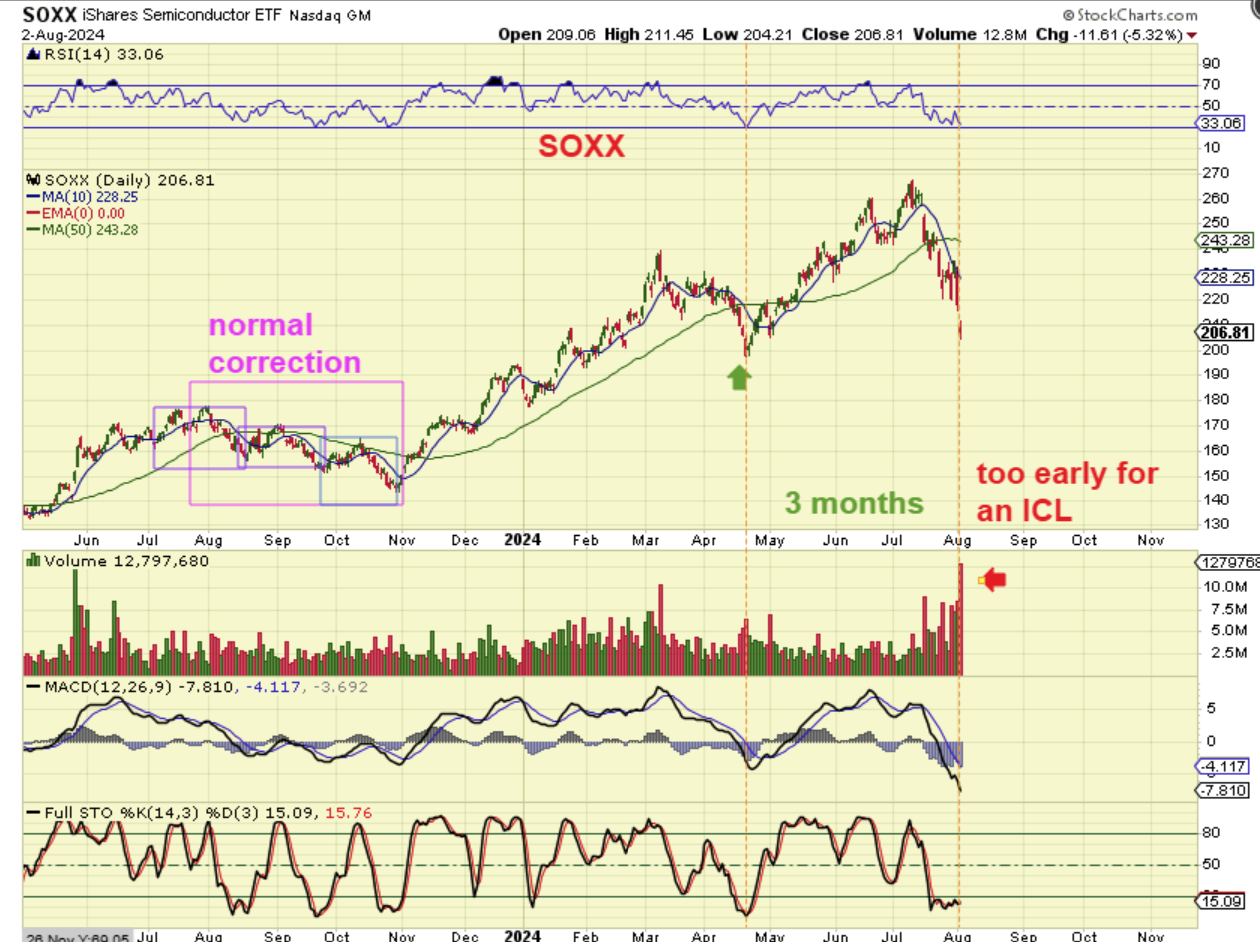
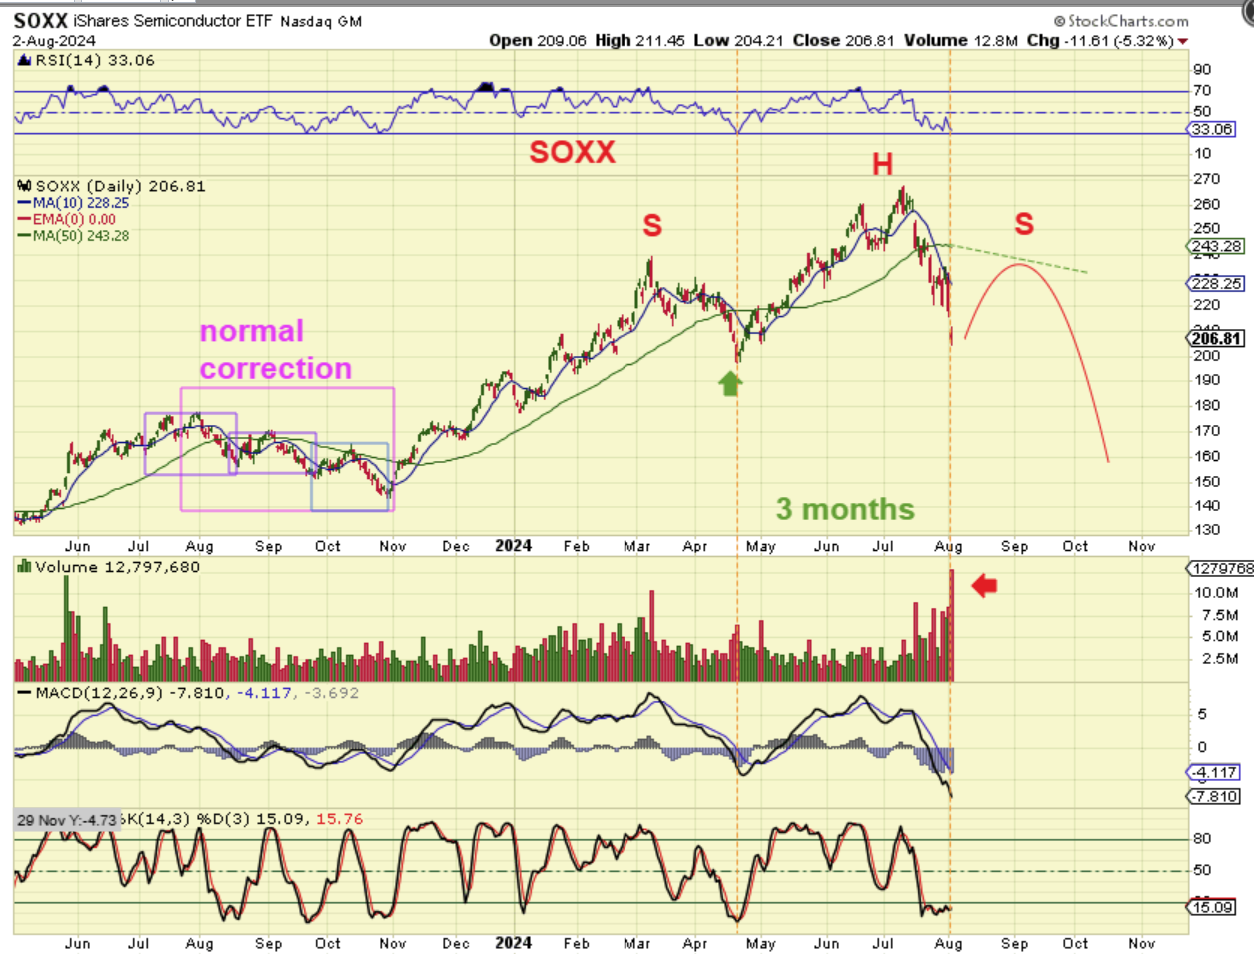
Now take a look at the very weak SOXX. THAT drop below the 50sma broke a dcl, and that is what I considered a clue to the future of our markets. We are only 3 months away from the last ICL ( 2 daily cycles), so there has to be more time for this to crash down. You may recall me saying that possibly we do a 3 daily cycle correction like we saw in August to Nov 2003. We still could and that is a normal correction. That said, I personally think that this was already a bit too Deep to be normal, but we’ll see what the bounce out of the next dcl gives us. At this point I can also picture…
.
SOXX– I can easily picture this now…
1) A dcl forming soon.
2) A rally or bounce to the 50sma for the rate cut
3) A bullish looking recovery when the Fed cuts rates in September and then it drops?
4) A crash as the economy suffers further, Jobless claims rise, Earnings forecasts suffer. A H&S at the 50sma.
.
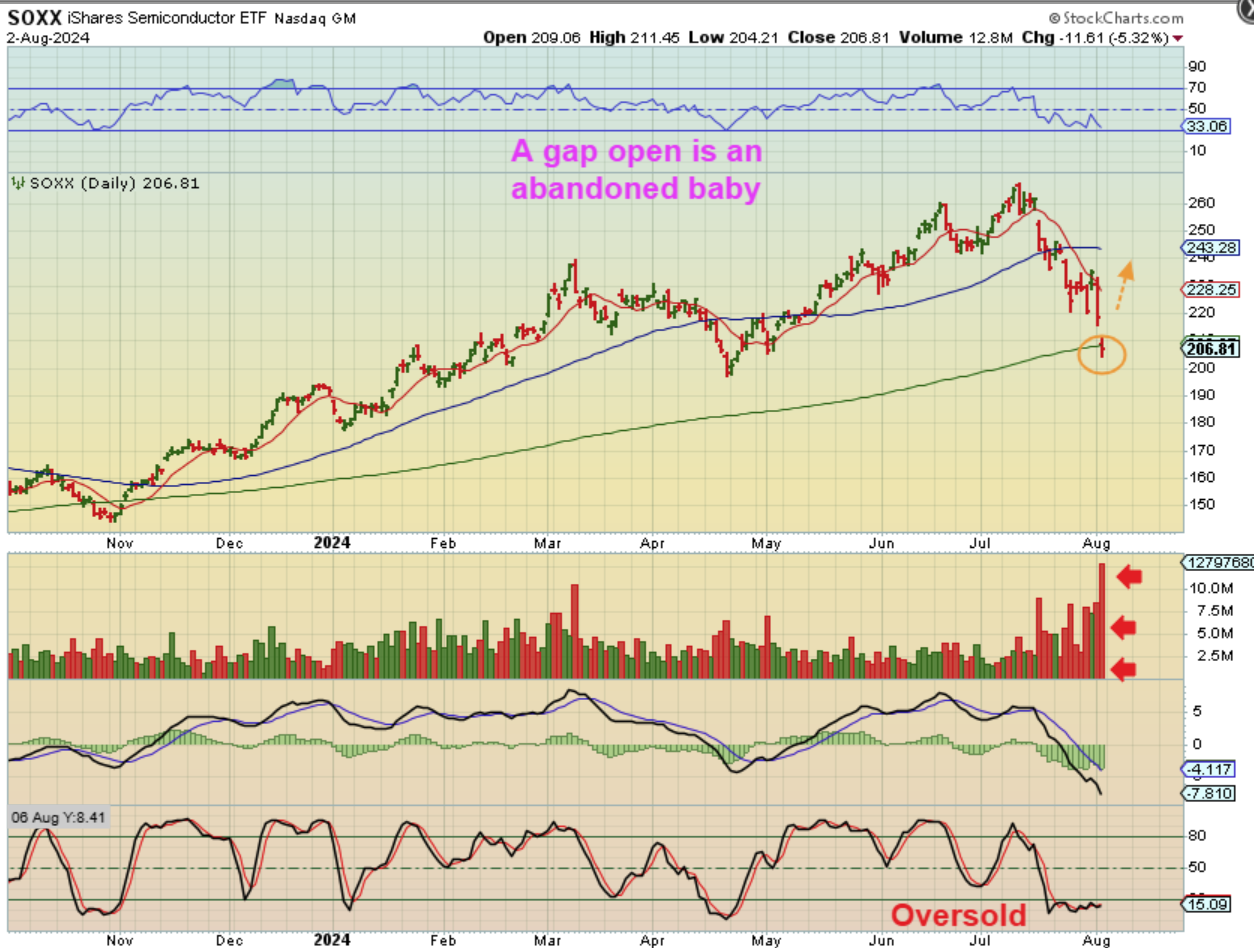
Same chart: That may have been capitulation volume on Friday, so the markets may put in a dcl right here and rally into the 50sma. We’ll see, but we are within the timing for a dcl and that could be a capitulation crash low.
.
SOXX: So short term we could get an abandoned baby and a move higher (dcl), we’ll see on Monday, but in the bigger picture, we may be seeing cracks appear in the bull run.
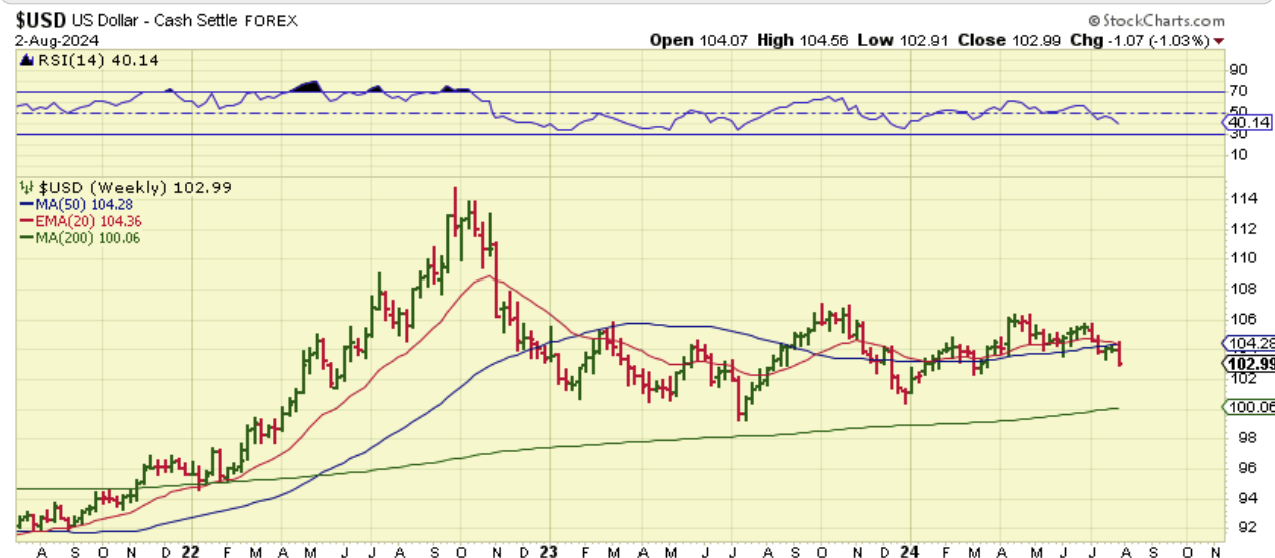
Even the USD dropped, but I was expecting that to happen.
.
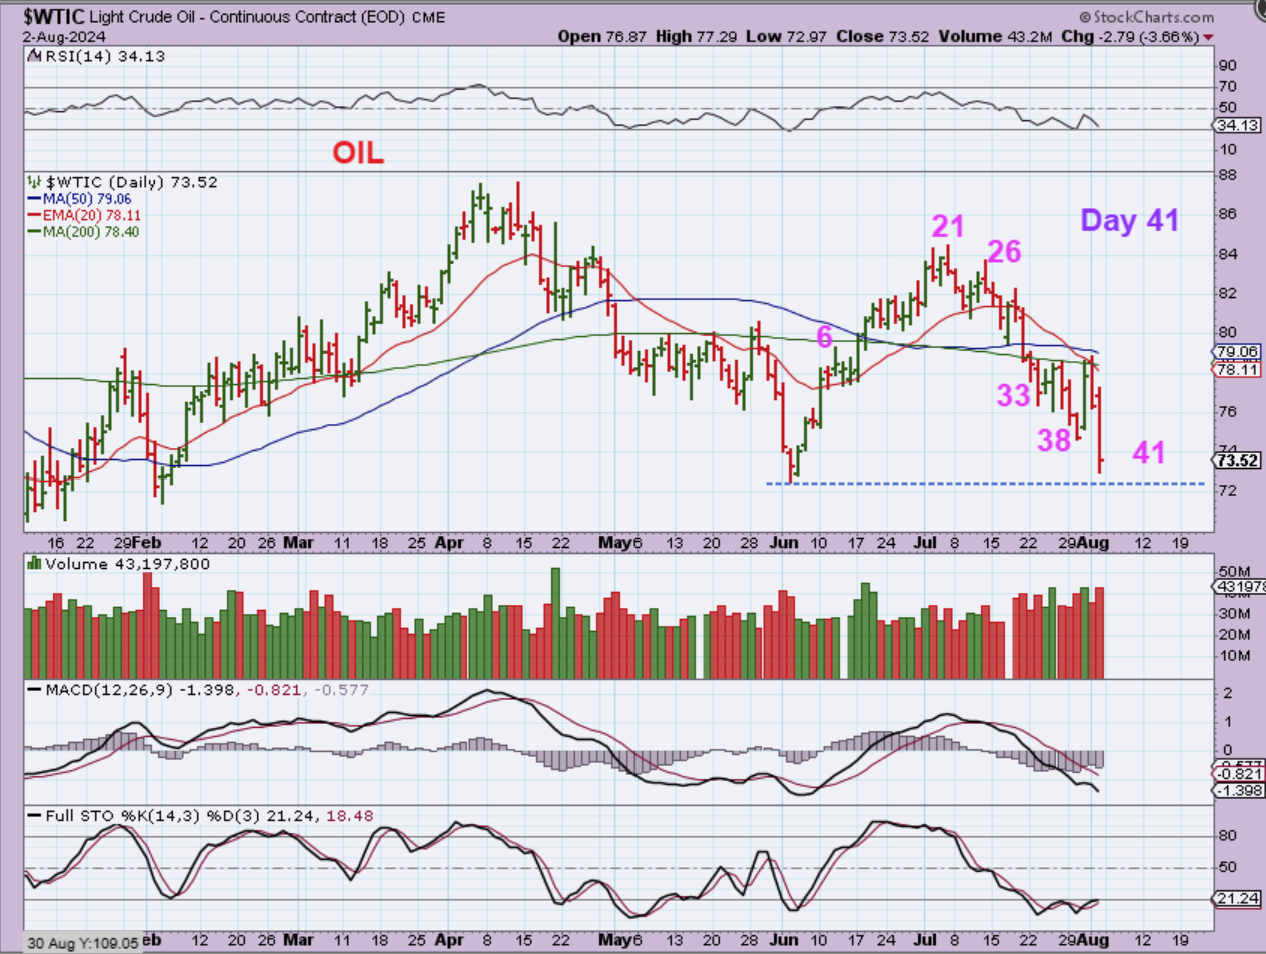
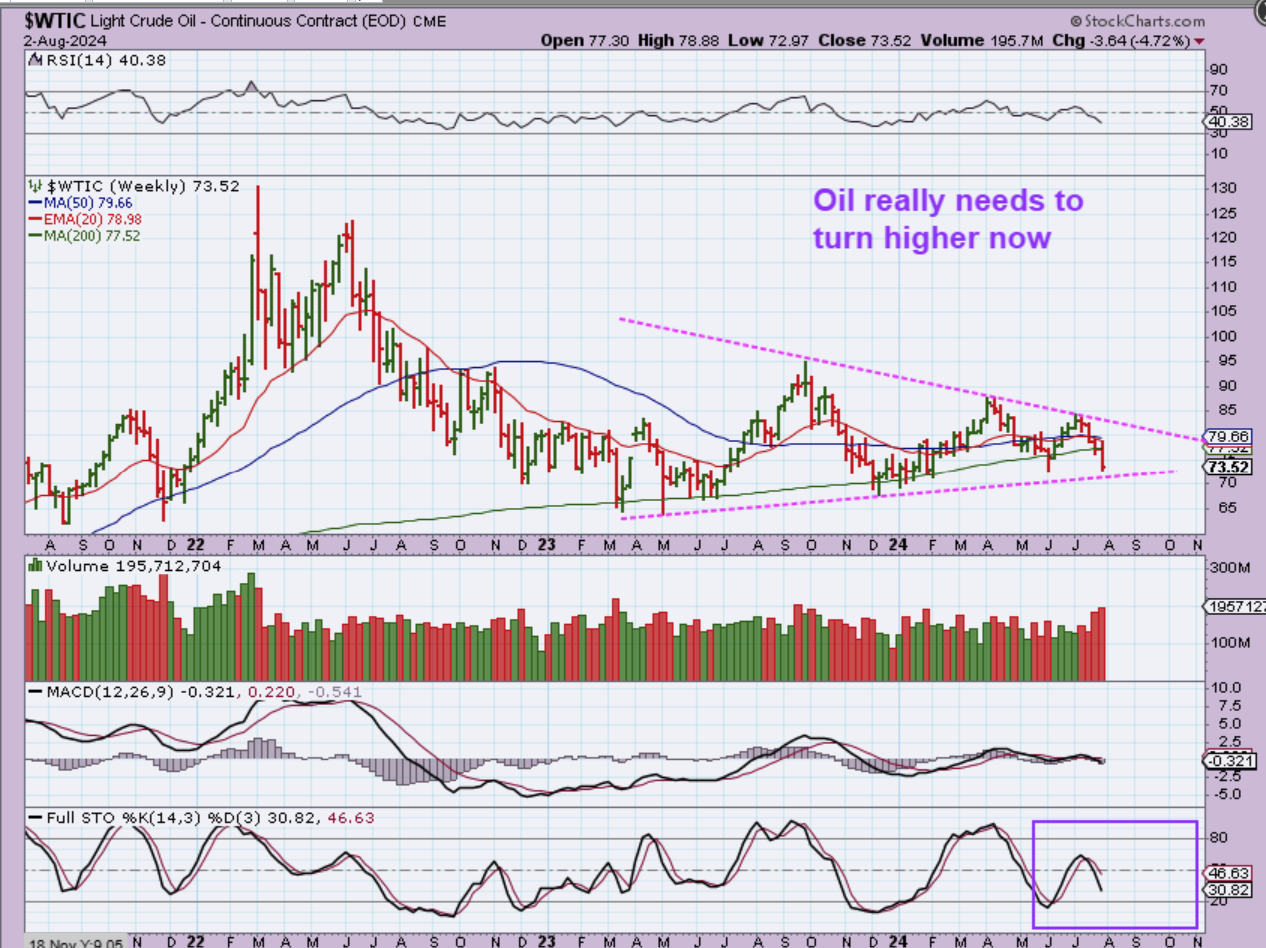
WTIC – Oil plunged on Friday and you can see that things just aren’t quite right. That drop from April to June was a drop into an ICL, so those lows should not be broken, but now on day 41 they could be taken out. Oil has basically done a ’round trip’ and needs to bounce immediately to hold that ICL.
.
I pointed out this triangle in Oil on July 26, and that did give it room to drop to about $73 -$74…
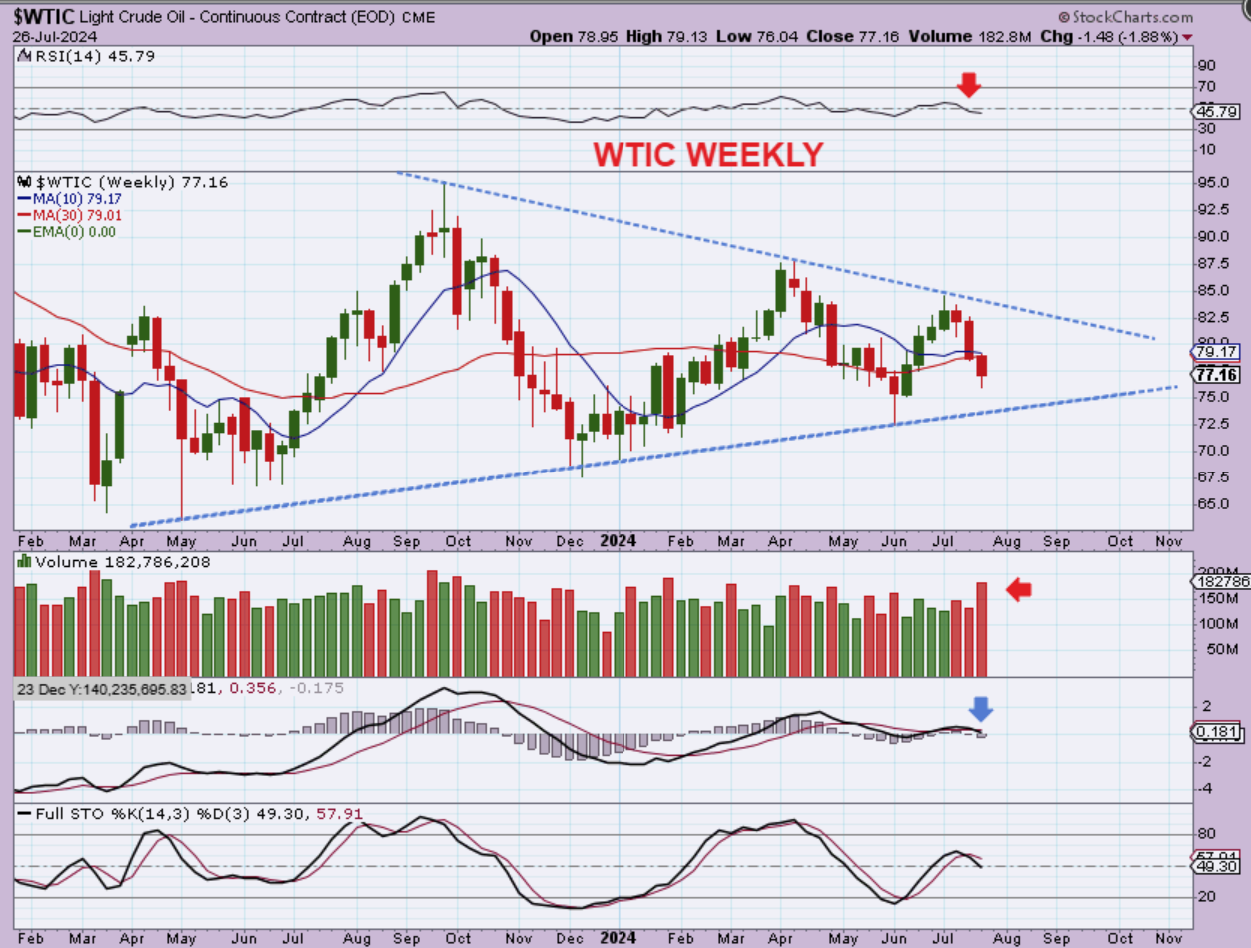
.
Oil is just below $74, so even in The Bigger Picture which shows a large triangle forming in oil, this needs to reverse soon.
.
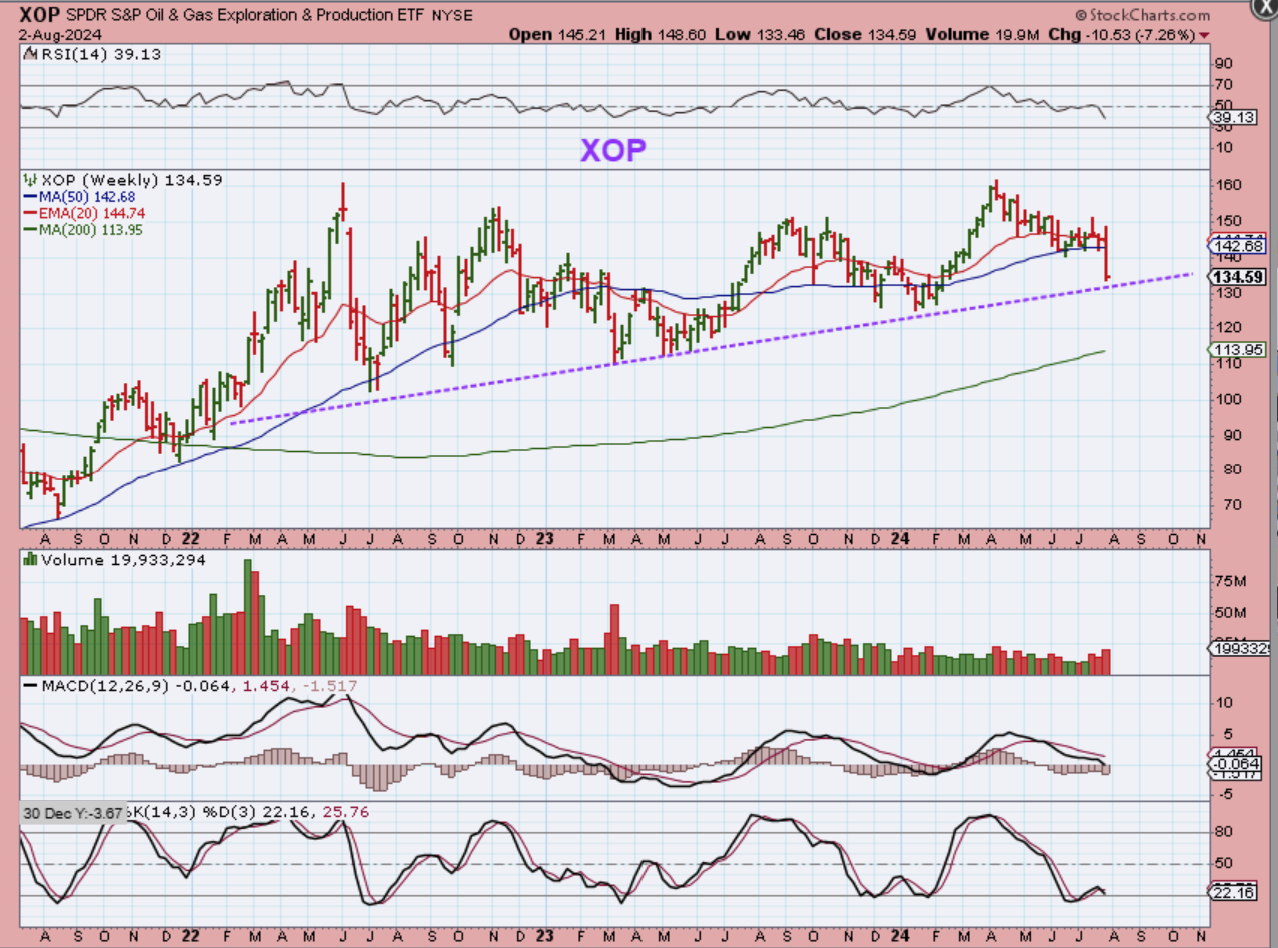
THE XOP took a dive last week. It seems to have followed the general Markets and oil lower. Now it is also approaching a 2 yr uptrend line. A stop up near $140 or $142 was needed.
.
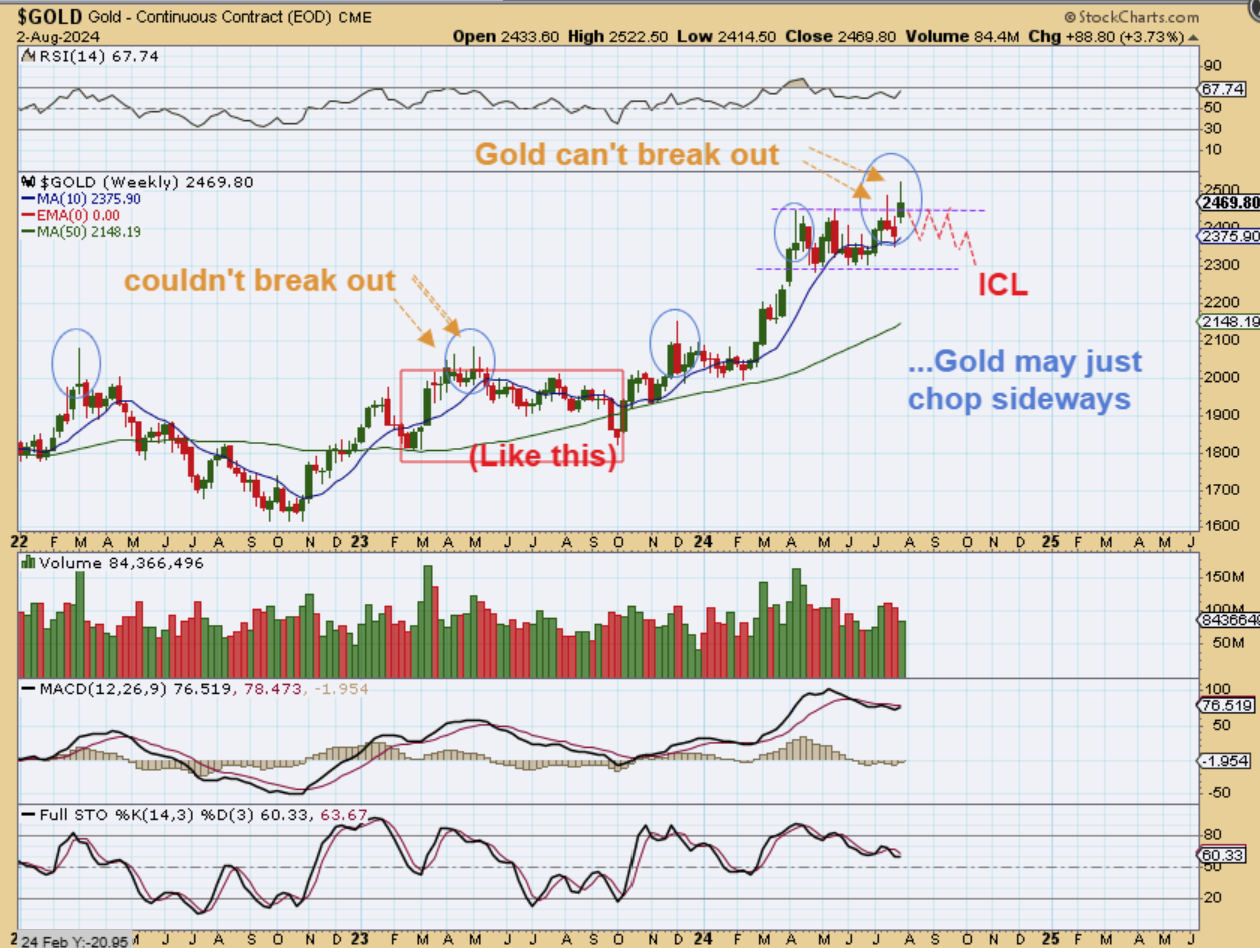
GOLD isn’t ugly, it was actually up last week 4%, but it did not serve as a safe-haven after it broke to new highs. We actually now have ANOTHER weekly false break out if it dips down a bit further. Sellers at the highs, is what that candle tells me I am seeing. Did people lock in gains here to offset losses in the General Markets? Maybe. This now looks like it may chop sideways like it has in the past when failing to break out and run. Read the chart. The MACD does look good if it would power higher next week.
.
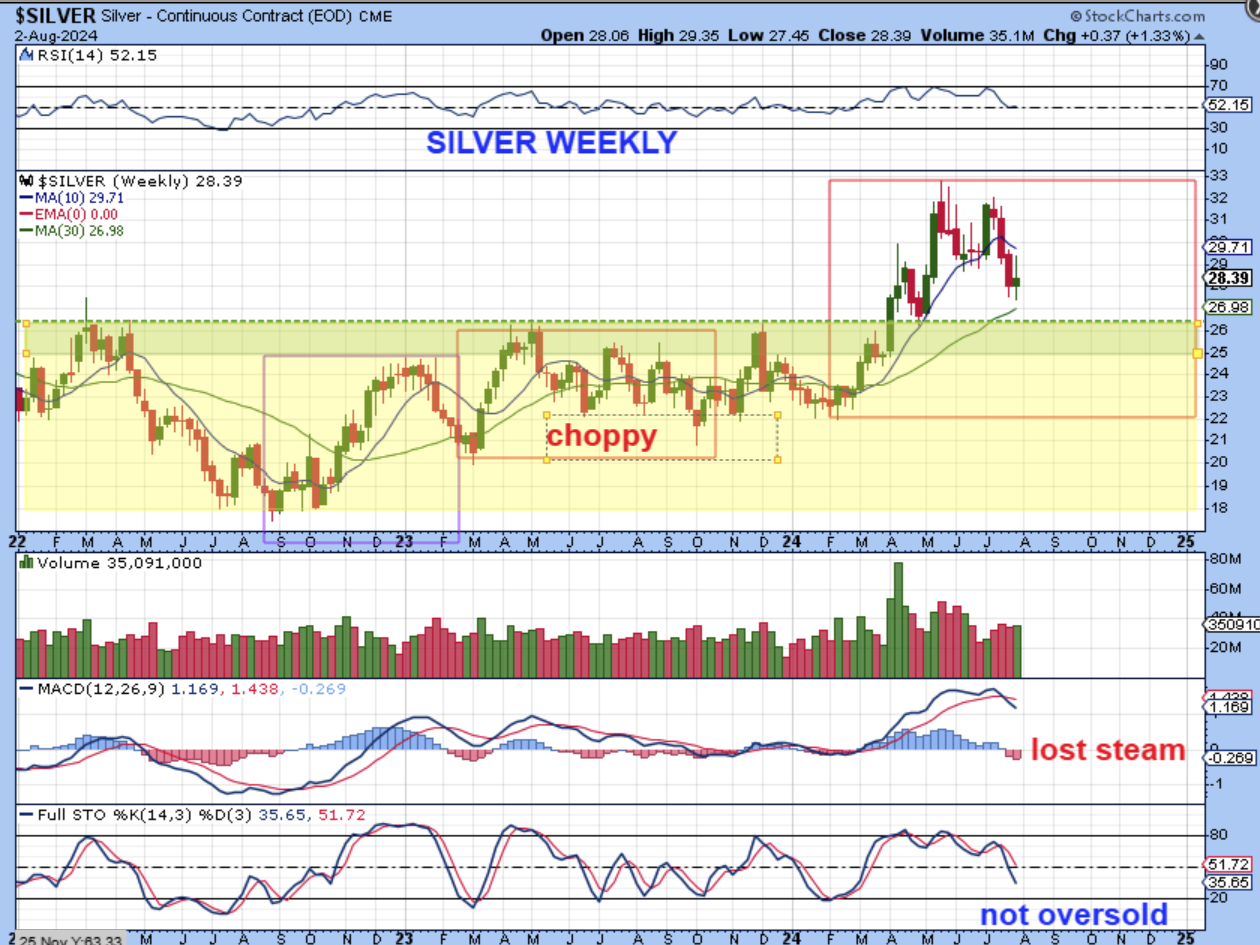
SILVER has not looked as good as gold for the past 3 weeks, but it did actually close up 1.33% and remains above the 30 week ma. Look at the MACD and Stochastics though, and this looks like it wants to drop to the 30 week ma over time. Silver is just not ready to make the run yet.
.
CHECK THIS OUT:
.
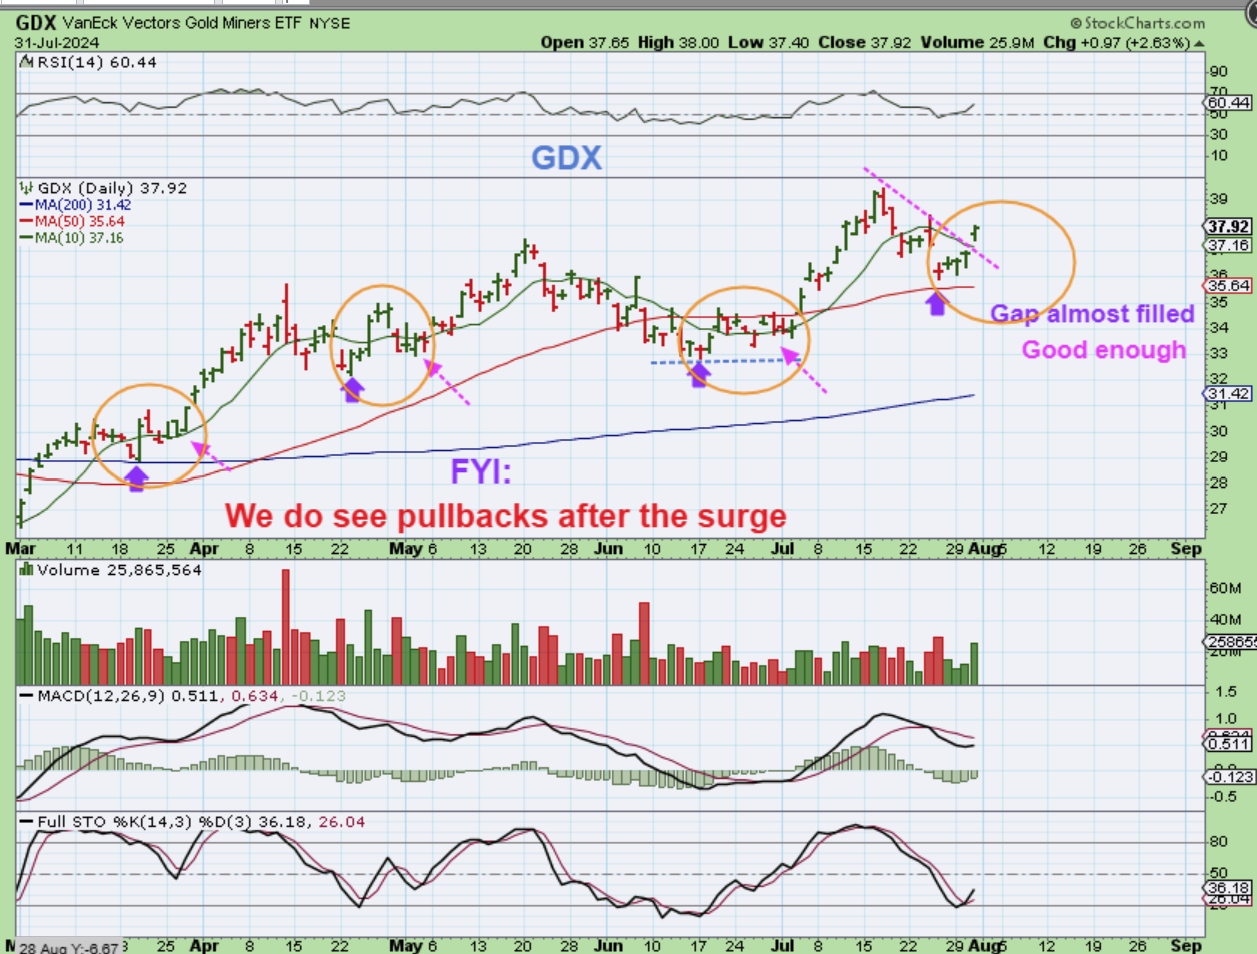
This was the GDX on Wednesdays close after the Fed Mtg. I was Buying on Monday and Tuesday and now this was a beautiful bullish break out, and our only concern seemed to be would that gap fill and then a rally (I pointed out past dips before the rally) or might this just rally onward with ‘rate cut’ gas in the engine? This looked great going into Thursday with the Fed behind us! If this dipped to a gap fill, I would ‘add’, and I did…
.
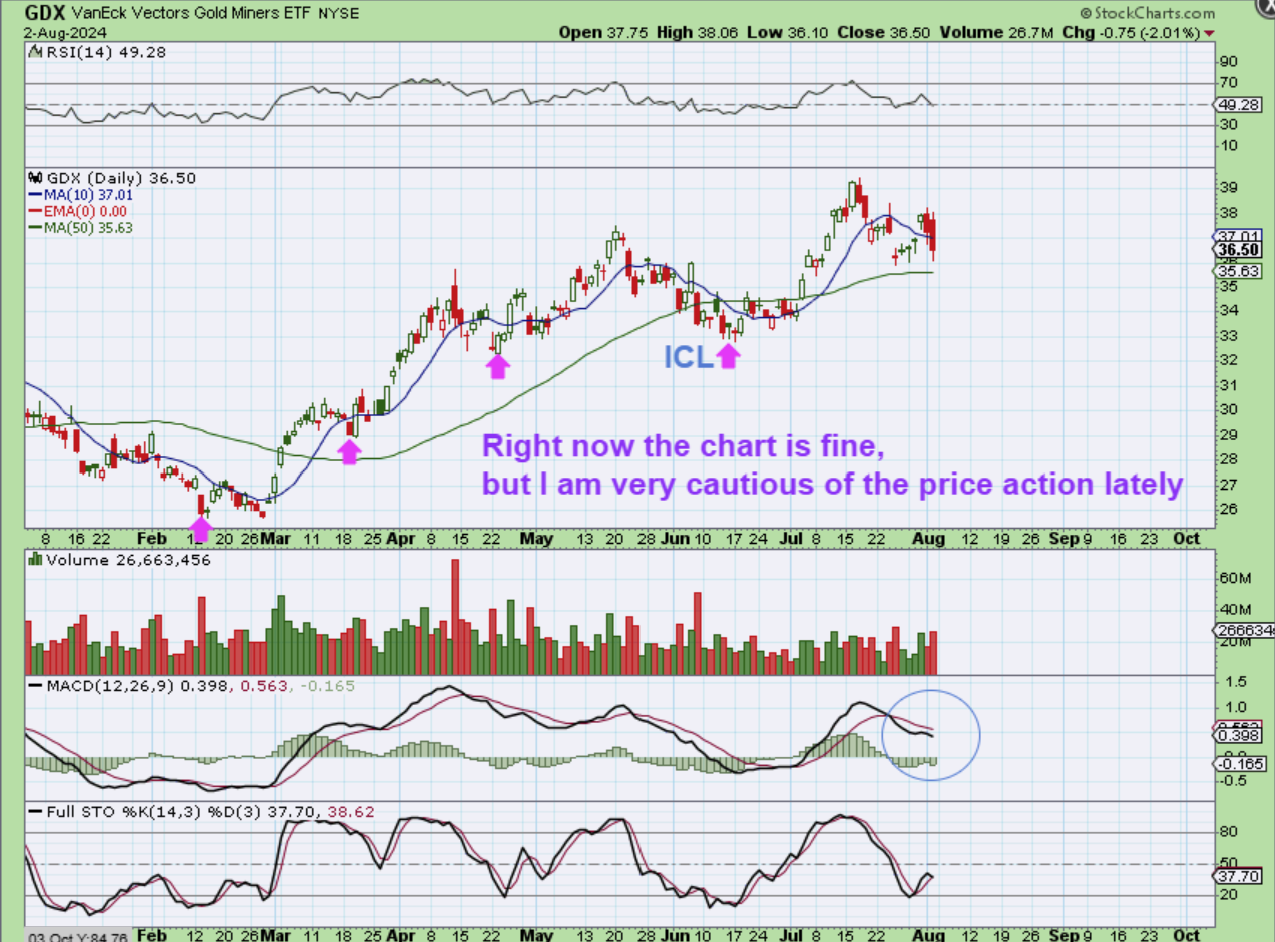
GDX DAILY FRIDAY– The GDX almost pulled back to the 50sma. So now 2 days after the Fed Mtg it still wasn’t overly ugly when you consider what we just saw with the General Markets, right? However I am concerned. Why? Because my individual Miners and especially the Silver Miners took a pretty good hit (& I was heavily invested with such a bullish set up on Wednesday). Again, this is ‘O.K.’, but also…
.
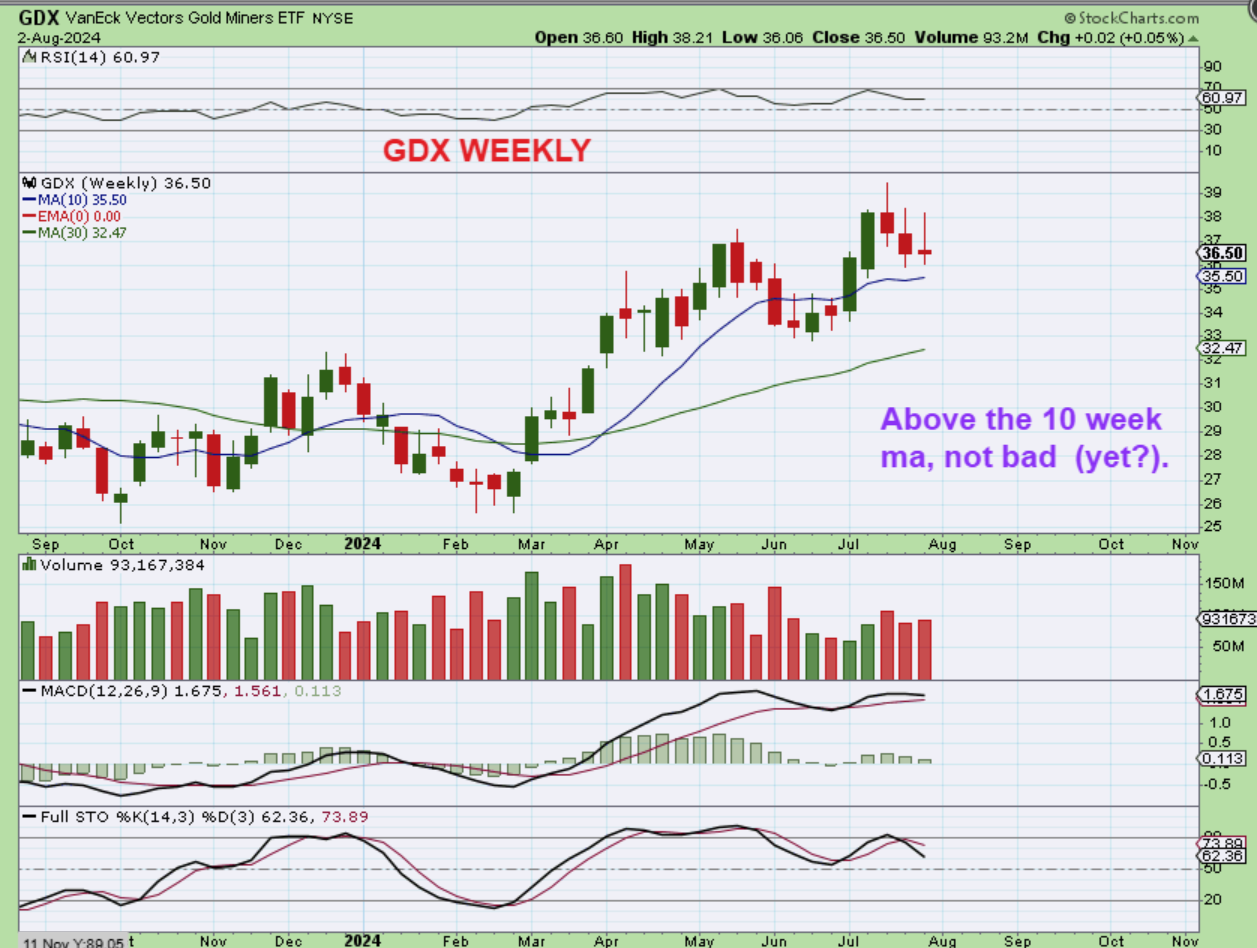
WITH THE GDX WEEKLY I am seeing 3 weeks with spikes on top. To me, that tells me again that someone (Smart money?) might be selling every pop or every attempt at a rally. We now have 3 red candles with spikes on top & strong volume, so using technical analysis, I have to sit up and pay attention….and dig deeper.
.
So I flipped to my Silver Stocks that got caught up in some heavy selling. Maybe they’ll tell me the story?
.
SILJ WEEKLY (Our Silver Stocks) – This is also ‘O.K.’, but it won’t be for long and Silver looked like it could drop a bit further. I don’t see any outstanding bullishness here when I examine the Weekly MACD as a weak double top with divergence and now a cross lower. Do you see dominant green volume or dominating Red Volume? Yeah, me too.
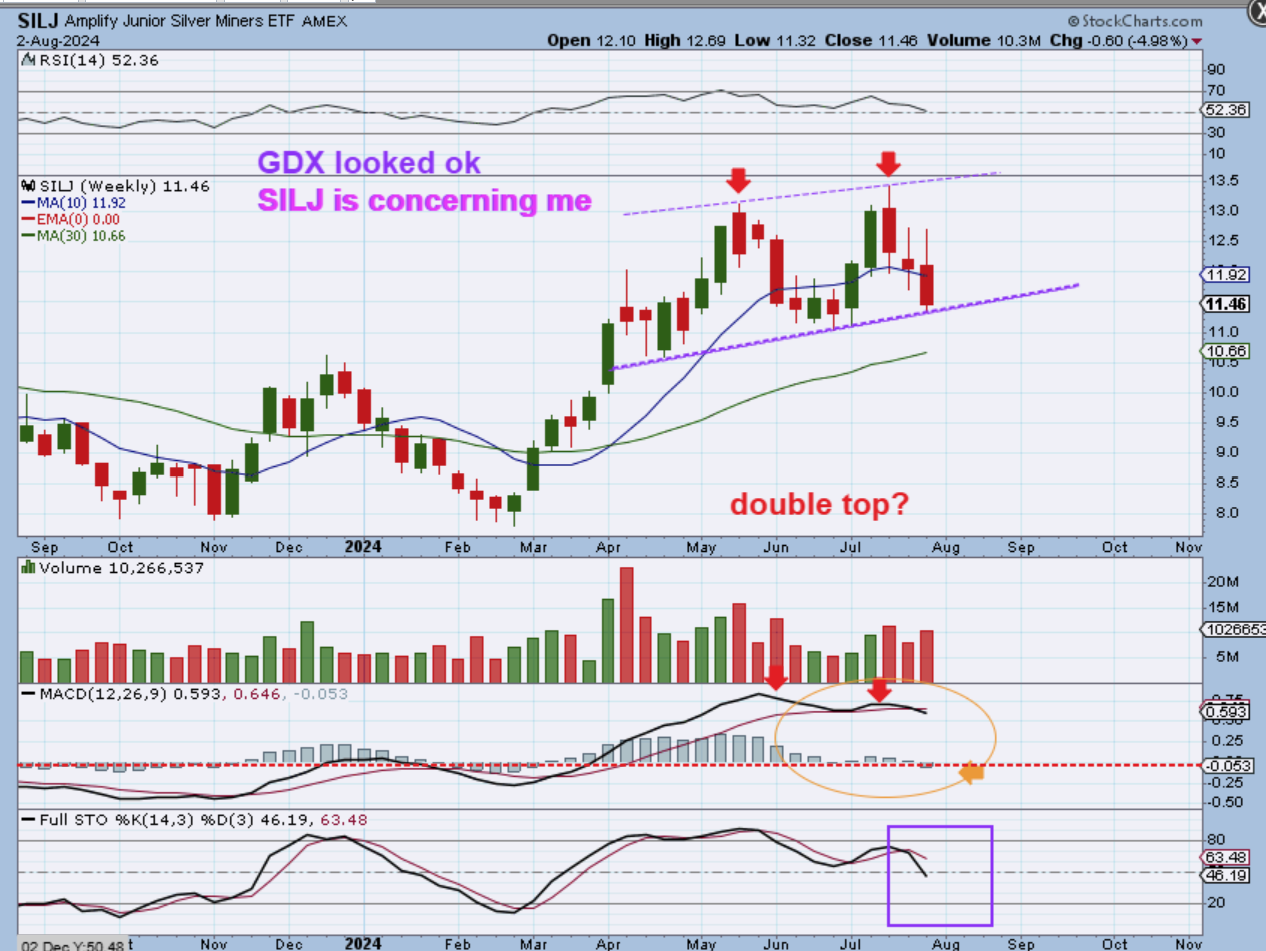
..
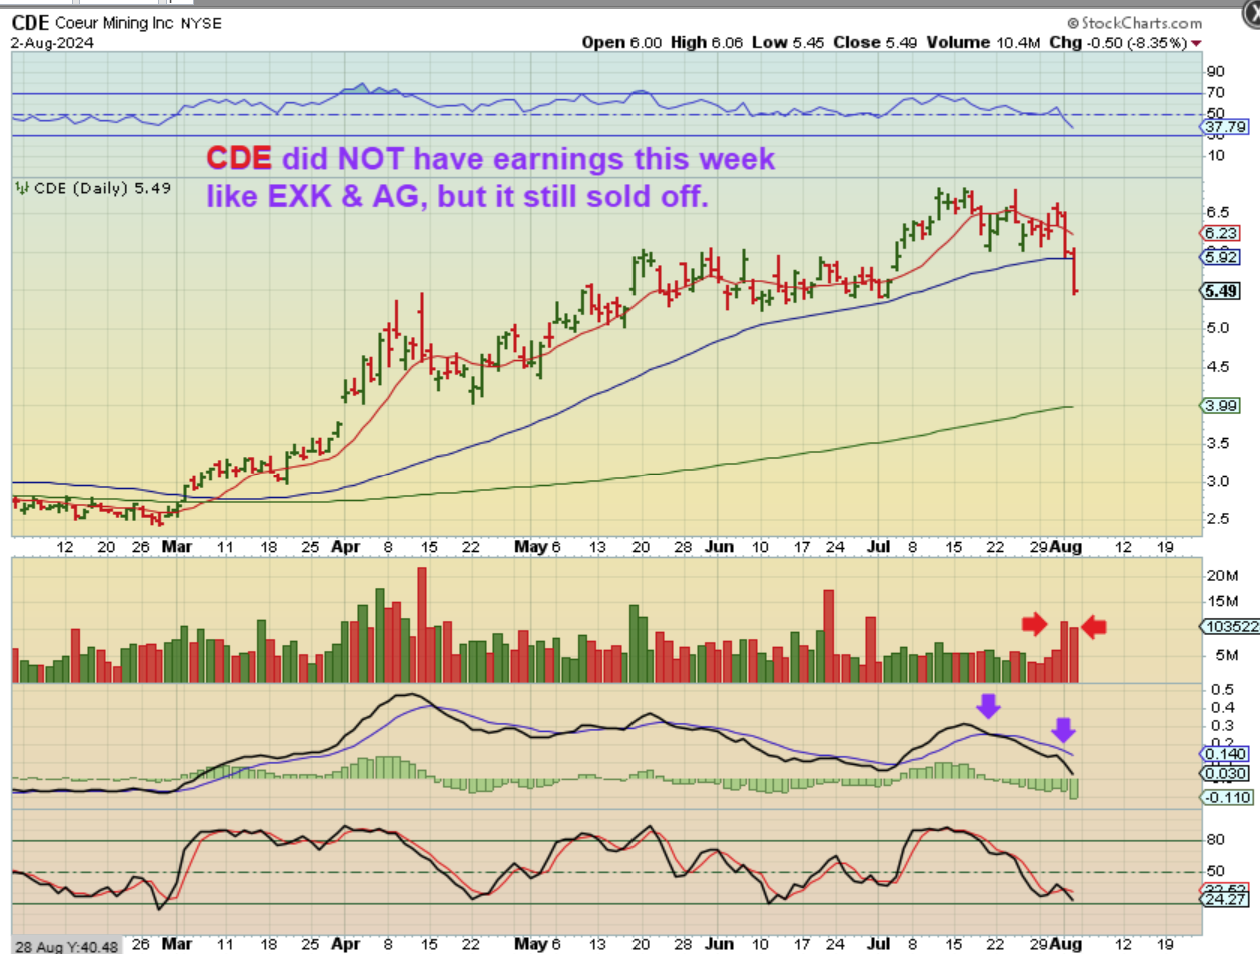
EXK had earnings and sold off sharply, though the report was actually pretty good. So EXK, AG, & SSRM dropped sharply after earnings,
but others that did NOT have earnings, like CDE, also dropped sharply, so this is a concern of mine now. Are these just following Silver into an ICL, or are the wheels coming off of the Miners Wagon during a General Market sell off?
.
SO I WANTED TO KEEP DIGGING:
.
JDST LOOKED WEAK AFTER THE FED MTG ON WEDNESDAY, RIGHT? Doesn’t this JDST chart look ready to tank after that Fed Mtg Wednesday after the close?
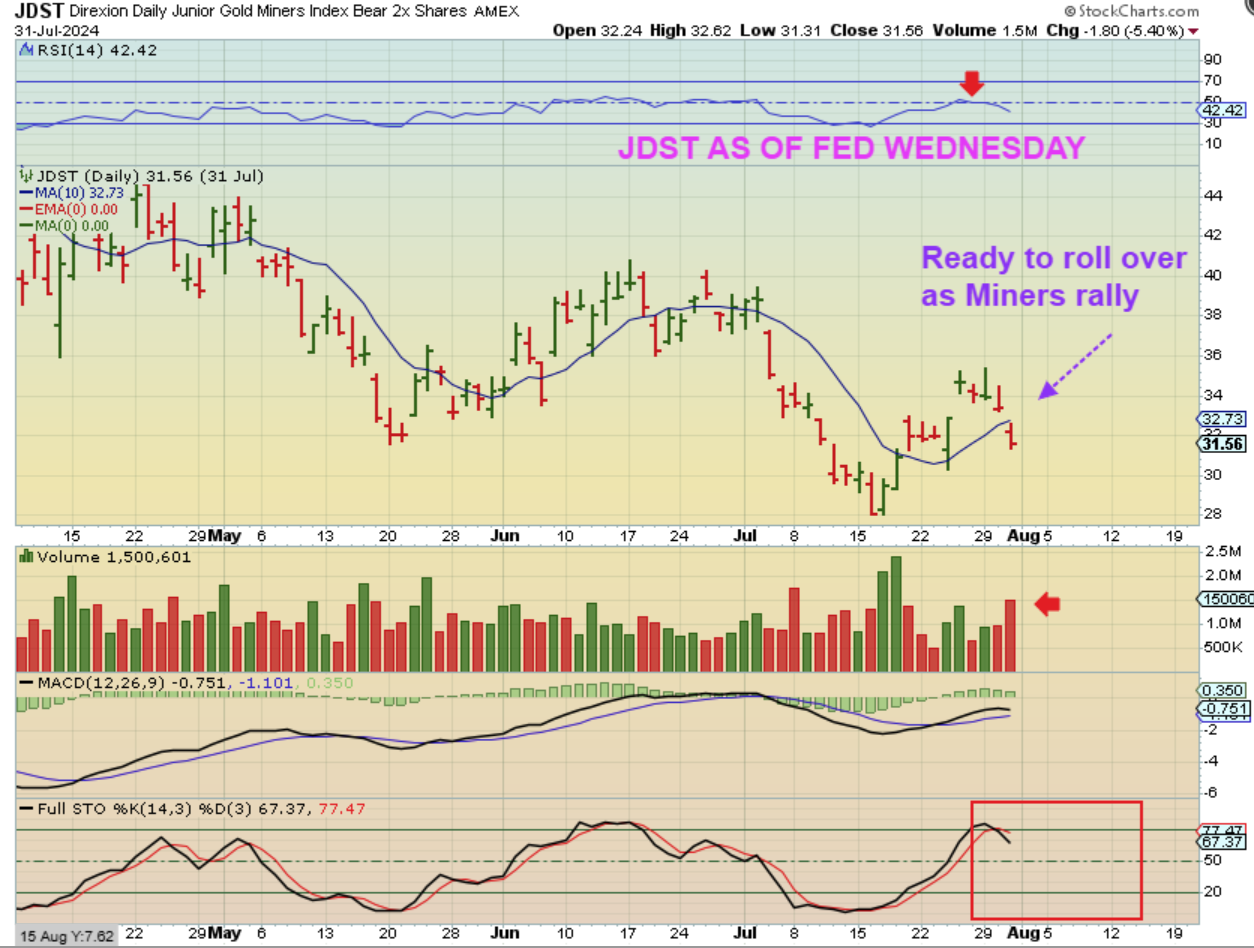
.
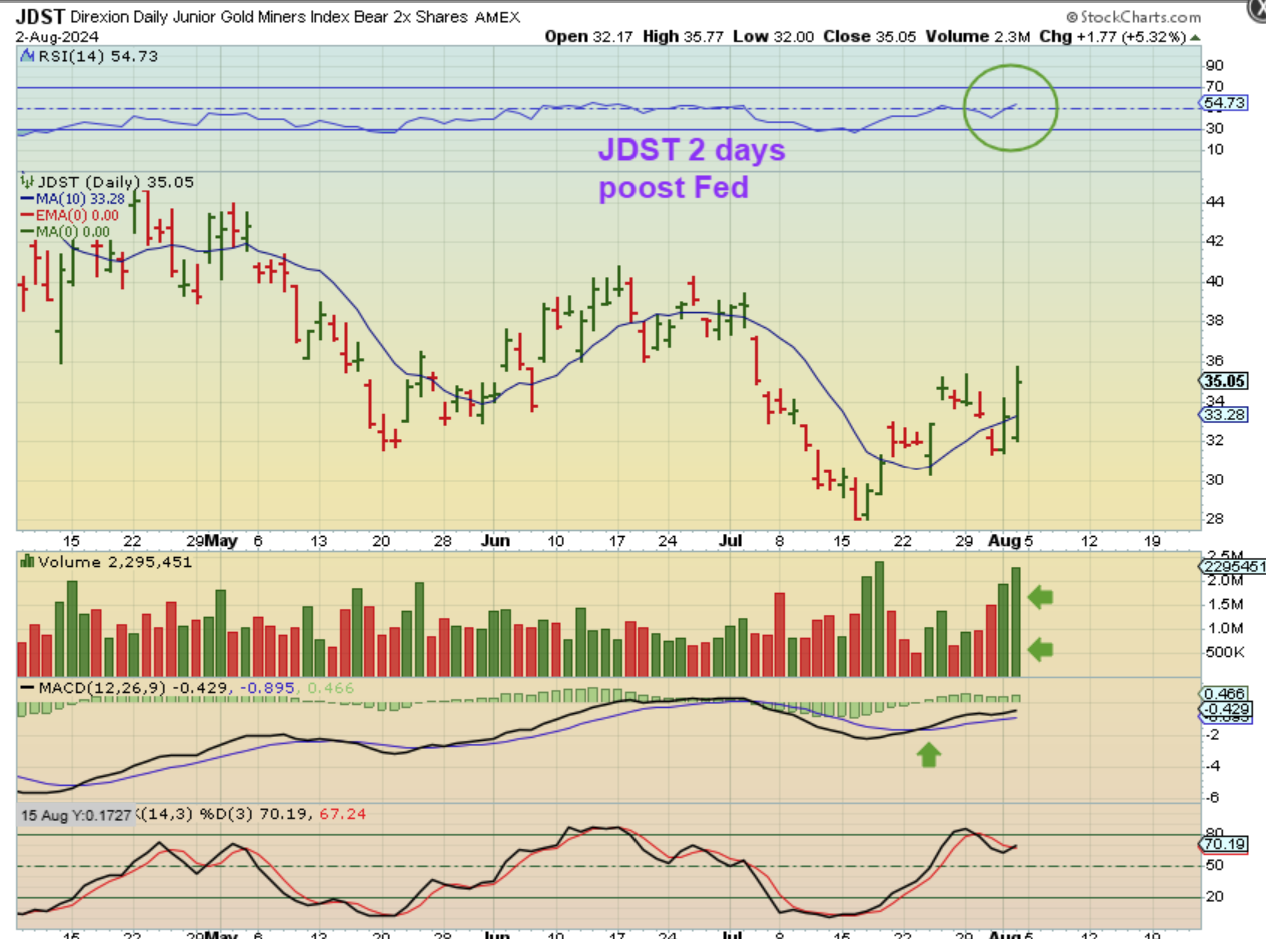
JUST 2 DAYS LATER AND IT WAS SUDDENLY BULLISH
.
JDST DAILY POST FED – Again 2 days later and now I see very Bullish volume Thursday and Friday. That ugly chart above turned beautiful in 2 days. What about the JDST Weekly chart?
.
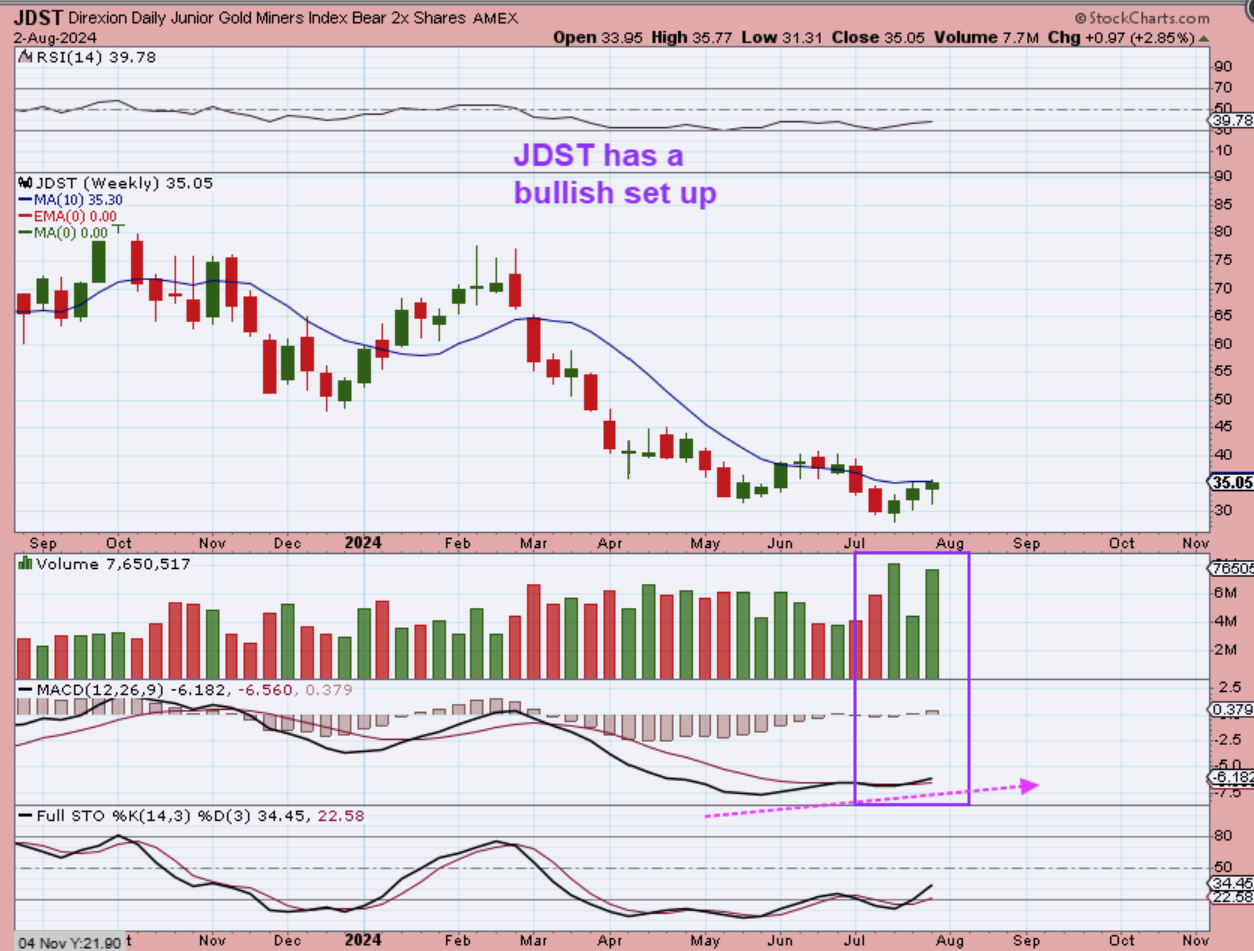
JDST WEEKLY – Strong Volume, Bullish MACD divergence, Pushing on the 10 week ma. THAT looks like the Miners have peaked very early in daily cycle #2, and the Bear inverse ETF has bottomed? We need to STAY FROSTY here! A market crash may damage our Miners, and Silver stocks seemed to get that message already. I owned EXK, CDE, and HL. Each one stopped me out below the 50sma and they all sold off sharply on Friday too. Unnecessarily deep with Silver not looking too bad, so I am VERY CAUTIOUS with the rest of the Miners now too.
,
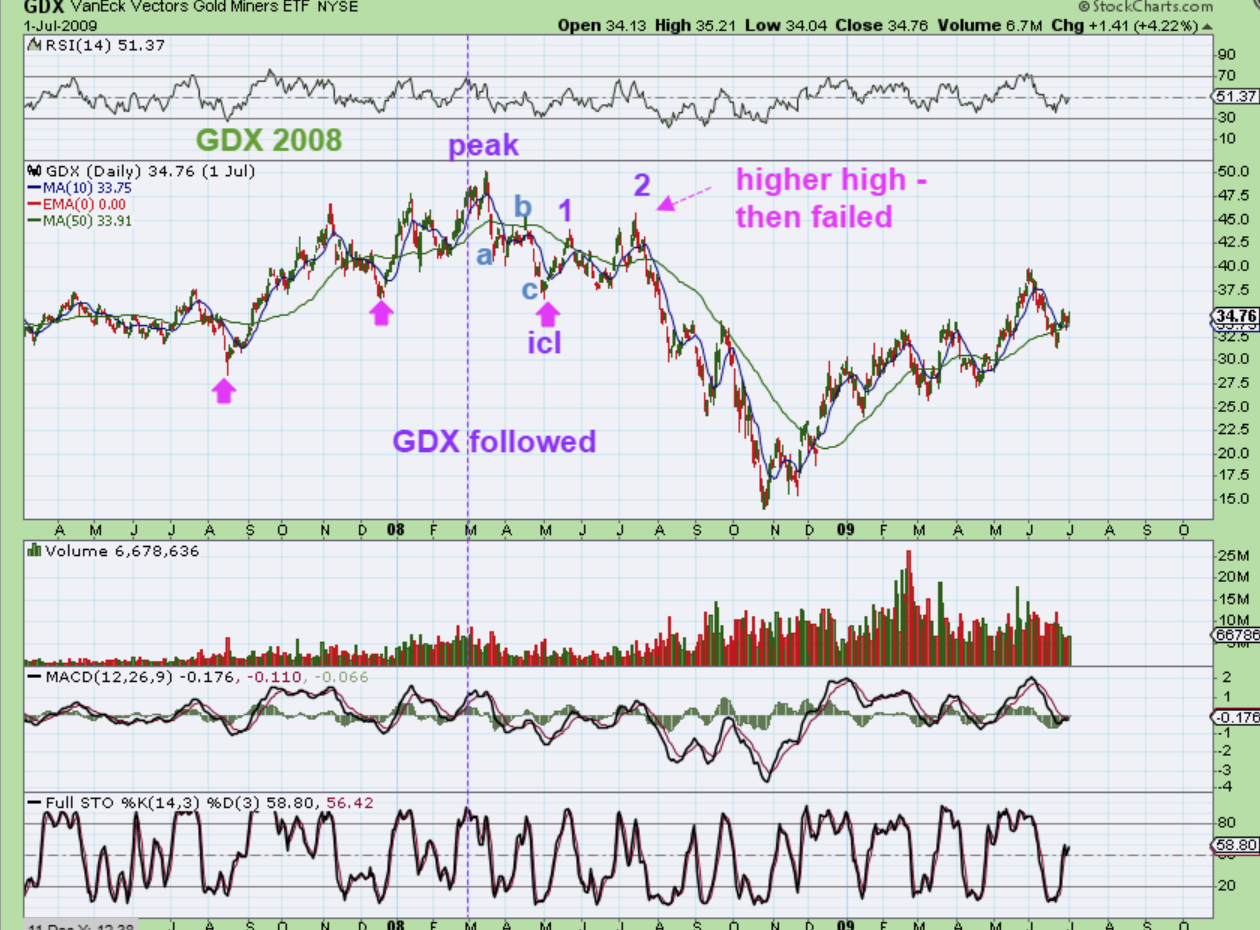
What about the 2008 GDX drop? GDX had a bullish rally from $28 to $50 in 7 months! This is how the Bull can crash from daily cycle #2 onward.
1. I see an A-B-C drop after that $28-$50 rally. GDX dropped down into an ICL.
2. After 2 choppy daily cycles higher, the ‘Stock Market sell off’ crashed the Miners quickly too.
3. Those three massive daily cycles lower were brutal! $45 to $15.
.
CONCLUSION: Please understand that this report is a little limited in what I can discuss. It takes me hours to gather all of the charts, examine them, and then draw them up for you to see what I see. I then upload them to the website and write the story, so it literally takes 5-6 hours. I am not complaining, I love what I do, but I’m just wanting to say that this is how things are playing out now, but I also could show you the ‘what if we don’t crash’ scenario. I could show you sideways chopping after the rate cut. I could show you Silver putting in an ICL soon and then Gold, Silver, and the Miners blasting higher as a safe haven move, even with the Markets selling off. I just don’t have enough time in this report to show every possible scenario. We may NOT get a crash as bad as 2008, and the Covid 2020 crash was fast and V-Bottomed to some excellent gains! We could still just get a complex choppy drop for 3 daily cycles in the General Markets, like I mentioned before with this chart.
.
We also could bounce right here this week. Earlier in the report I said: That may have been capitulation volume on Friday, so the markets may put in a dcl right here and rally into the 50sma. We’ll see, but we are within the timing for a dcl and that could be a capitulation crash low.
If THAT is the case, the Miners may firm up and Gold may break out and things could stabilize in the Precious Metals sector. I will have those clues in my daily reports as we go forward if they present themselves. But right now, I only have time to show you all that I have gathered for this report. Things actually looked great into Wednesdays Fed mtg and even after that, things looked great into the close on Wednesday. Then on Thursday and Friday we saw a storm roll in and a few things changed quickly. The biggest change that bothered me was with the Silver stocks, but they may be seeking out an ICL with Silver and then blast higher too—we’ll know over time. The General Markets look bad though. They can bounce & rally here and there out of DCL’s, but we want to Stay Frosty when they do.
.
I’m not trying to scare anyone, but I just have to keep using the charts to show you what I am seeing. When the SOXX failed and I warned about the SPX & NASDAQ likely to follow, I got an email where an honest hearted reader just felt that with rate cuts coming, this market is now bulletproof. ‘Semiconductors will quickly recover and just Stay long and strong’, so to speak. I simply replied that the SPX & NAZ do still look bullish, and I was long in the 1st & 2nd daily cycle, but please use stops. The SOXX had FAILED and the odds of a deeper correction were now very high, since semis often lead the way. The Charts were right, there was reason to be concerned. We are still early in this intermediate cycle (3 months or 2 daily cycles), so we have to Stay Frosty for that reason alone. Timing is not on our side for a long-term bottom to be close yet (though a dcl bounce should come soon enough). After every crash ( 2008, the 2020 Covid crash, etc) there is a very strong rally out of those lows, so that is the good news.
.
Now we switch to Precious Metals. Right up into the Fed Mtg things looked bullish in Precious Metals with Gold and the Miners. Gold even broke to new all-time highs again! Silver was due for an ICL, so that would just be a matter of time and Silver catches up QUICKLY when it runs. And honestly, didn’t this GDX chart look great after Fed Wednesday? After making new 2024 highs with Gold in July, this looked ready to fly to new 2024 highs again.
So yes, the Miners have held up for now, but my Silver stocks took a bad hit. Are Silver stocks warning us about the sector in the same way that the SOXX was warning me about the Nasdaq. Maybe. Is Gold unable to breakout and run again telling us anything about the selling? Maybe, just use stops if you are long that sector. I’d love to see Gold break out and become a safe haven, and Silver put in an ICL and join in the run, but Thursday and Friday saw Silver stocks act bearishly, so I am cautious. Going forward now for the Precious Metals, we have to watch for the set ups to take shape and see if they form bullishly, but for now I’m throwing up the caution flag with 1. A General Market crashing and they still have time for more downside in 2 more daily cycles and 2. Silver stocks tanked for 2 days, and 3. JDST is looking quite bullishly at the lows, isn’t it? JDST makes it look like the Miners may have ‘peaked’ early here.
.
Will Crypto be the safe haven if the Markets continue lower? It is acting correctly, so I’ll discuss that, but crypto stocks are still a bit weak and may follow the General Markets. If Bitcoin runs as a safe-haven, we DO have those ETFS that follow Bitcoin nicely, so keep that in mind.
.
We’ll wait to see if the capitulation in SOXX gives us a dcl and a move higher next week. If so, we’ll see if that helps the Precious Metals sector too. That bounce out of a dcl for the Markets may become an opportunity to go short using SOXS, SQQQ, TECS, etc in a few days /weeks. We just have to take it one day at a time from here and look for more clues along the way. I hope you all enjoy your weekend!
.
~ALEX
.
IN FRIDAY MORNINGS REPORT I WROTE:
.
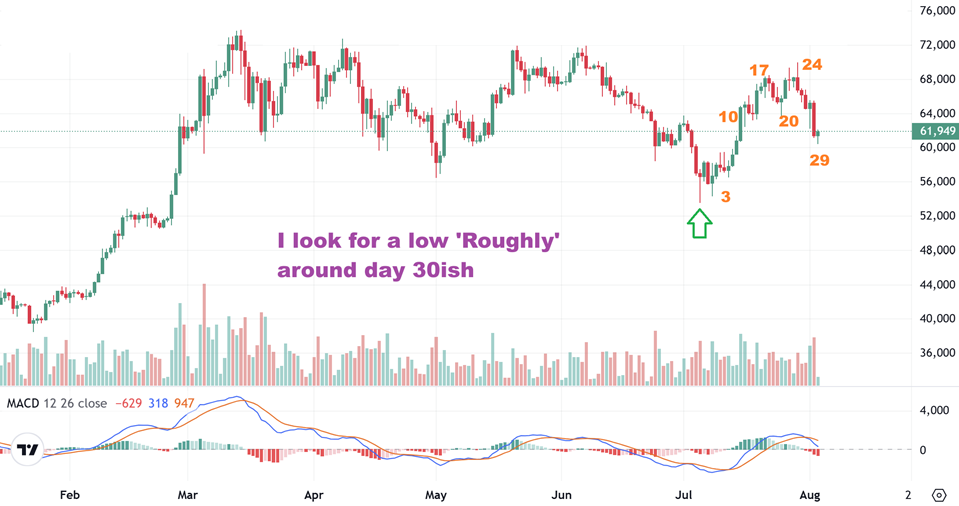
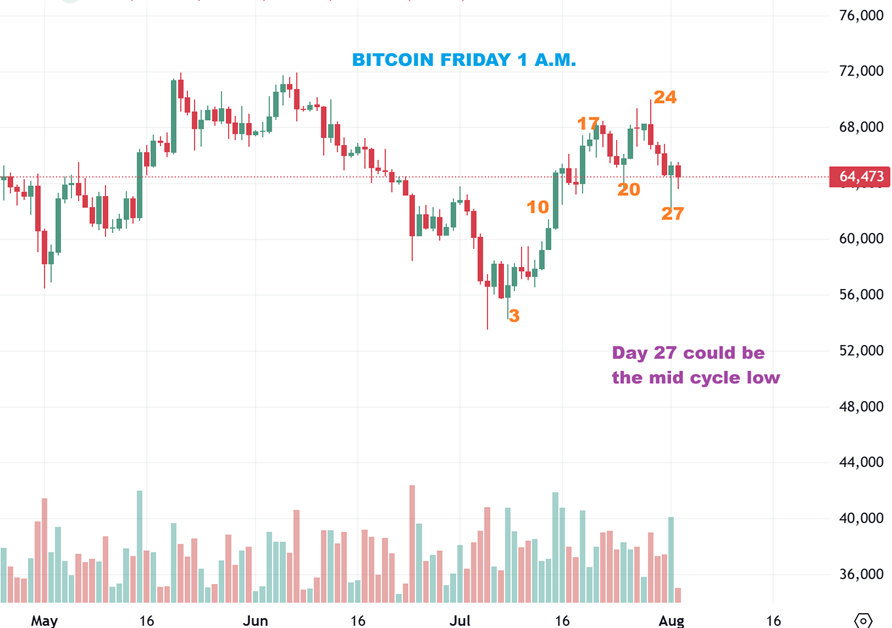
BITCOIN is dropping into that mid-cycle-low and the reversal here MIGHT be that low. I saw some Crypto stocks ‘bounce’ into the close, but I still don’t trust them. They could sell off with the General Markets, but for now we’ll see what they do on Friday IF Bitcoin continues to bounce. Reminder: If Bitcoin rises alone, you can go long using the ETFs
.
BITCOIN then sold off on Friday, but we do have another swing low trying to form here, so at day 29 I will watch this closely. THEN I will probably use the ETFs for now and see how crypto stocks react. Do they respond to Bitcoin? Or do they respond to the market sell off.